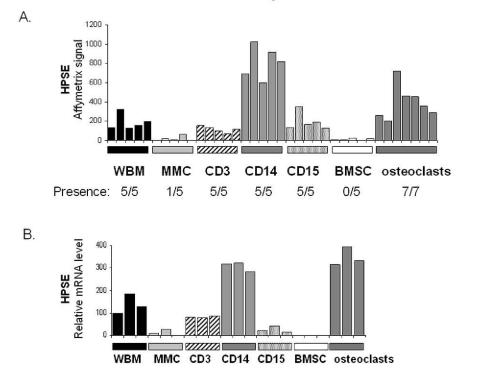
Figure 5. Expression of HPSE in subpopulations of the BM environment of patients with MM.
A. Expression of HPSE was determined in the WBM of five MM patients as well as in MMC, CD3+ cells, CD14+ cells, and CD15+ cells purified from the bone marrow of the same patients, using Affymetrix plus 2.0 microarrays. The five BMSC and seven osteoclast samples were obtained by culture in vitro. B. HPSE expression was measured by real-time RT-PCR. HPSE expression was normalized to that of GAPDH. One WBM sample was used as a reference and was assigned the arbitrary value of 100.

