

Abstract
In the mammalian retina, the scotopic threshold of ganglion cells is in part dependent on how rod inputs are summed by their presynaptic cone bipolar cells. For ON cone bipolar cells, there are two anatomical routes for rod signals: 1) cone photoreceptors receive inputs via gap junctions with the surrounding, more numerous rods; and 2) ON cone bipolar cells receive highly convergent input via gap junctions with AII amacrine cells, which each receive input from hundreds of rods. Rod-cone coupling is thought to be utilized at higher photon fluxes relative to the AII-ON cone bipolar pathway due to the impedance mismatch of a single small rod driving a larger cone. Furthermore, it is widely held that the convergence of high-gain chemical synapses onto AIIs confers the highest sensitivity to ON cone bipolar cells and ganglion cells. A lack of coupling between one or more types of ON cone bipolar cells and AIIs would obviate this high-sensitivity pathway and explain the existence of ganglion cells with elevated scotopic thresholds. To investigate this possibility, we examined Neurobiotin and glycine diffusion from AIIs to bipolar cells and found that approximately one-fifth of ON cone bipolar cells are not coupled to AIIs. Unlike AII-AII coupling, which changes with ambient background intensity, the fraction of noncoupled ON cone bipolar cells was unaltered by dark or light adaptation. These data suggest that one of five morphologically distinct ON cone bipolar cell types is not coupled to AIIs and suggest that AII-ON cone bipolar coupling is modulated differently from AII-AII coupling.
Indexing terms: retina, gap junction, rod pathway, neurotransmitter coupling, adaptation
The duplex vertebrate retina possesses two different photoreceptor types, cones and rods, which are biochemically and structurally optimized for different photon flux densities. Cone threshold sensitivity is a log unit higher than for rods (Schneeweis and Schnapf, 1995), which can respond to single photon absorptions. Cones vary in their opsin expression and spectral sensitivity whereas rods are uniform. Furthermore, cones communicate rather directly with ganglion cells via several types of bipolar cells. In contrast, rods synapse with a single type of bipolar cell that does not contact ganglion cells. Instead, rods control the output of cones and cone bipolar cells at low photon fluxes when cones are quiescent (Dacheux and Raviola, 1986; Strettoi et al., 1994).
Rods exert their control via several pathways, two of which involve gap junctions between heterologous cells. The primary rod pathway (from rods to rod bipolars to AII amacrine cells to cone bipolar cells) is believed to be responsible for the low threshold responses of ganglion cells (Kolb and Famiglietti, 1974; Sterling et al., 1988; Deans et al., 2002; Volgyi et al., 2004), because of the high degree of convergence of rods onto ganglion cells, as well as the divergence and amplification of a single rod response to several cone bipolar cells (Sterling et al., 1988; Field and Rieke, 2002; Dunn et al., 2006). The AII is responsible for splitting the rod bipolar signal into depolarizing (ON) and hyperpolarizing (OFF) channels (Kolb and Marshak, 2003). The AII makes synapses with rod bipolars and passes rod-driven information to ON cone bipolar cells via heterologous gap junctions and to OFF cone bipolar cells via glycinergic connections (Famiglietti and Kolb, 1975). Glutamatergic input from rod bipolars occurs on the AII’s arboreal dendrites in stratum 5 of the inner plexiform layer (IPL). In strata 3—5, AIIs form gap junctions with ON cone bipolar axon terminals (McGuire et al., 1984; Cohen and Sterling, 1990b). In the second pathway, signals flow from rods directly to cones via heterologous gap junctions between the two photoreceptor types (Raviola and Gilula, 1973; Nelson, 1977; Smith et al., 1986; DeVries and Baylor, 1995; Schneeweis and Schnapf, 1999; Trexler et al., 2005). The third pathway involves direct glutamate release from rods onto OFF cone bipolars (Soucy et al., 1998; Hack et al., 1999; Tsukamoto et al., 2001; Bloomfield and Volgyi, 2004).
Electrophysiological studies on wild-type and connexin36 knockout mice (Deans et al., 2002; Volgyi et al., 2004) have suggested that different types of ganglion cell receive rod inputs by different pathways. They showed that a population of ganglion cells has elevated thresholds, without apparent inputs from the rod-AII pathway; these results imply that not all subtypes of ON cone bipolar cells form electrical synapses with AII amacrine cells. Earlier electron microscopy studies examined the coupling of ON cone bipolars to AII amacrines in the cat retina (McGuire et al., 1984; Cohen and Sterling, 1990b) and found that of the five different morphological classifications of ON cone bipolars, only three were directly coupled to AIIs. One was not coupled at all, and the fifth was indirectly coupled to AIIs via gap junctions with a directly coupled ON cone bipolar type. Here we examine the coupling patterns of ON cone bipolars in rabbit retina by using different techniques that offer larger sample sizes to determine whether some are selectively uncoupled from AIIs.
In order to observe the interactions of AIIs and ON cone bipolars, we initially used Neurobiotin as a tracer for gap junction coupling (Vaney, 1997). Injecting Neurobiotin into an AII labels neighboring AIIs and any ON cone bipolars that are coupled by gap junctions (Mills and Massey, 1991; Hampson et al., 1992; Trexler et al., 2001; Li et al., 2002b). G0α labels depolarizing bipolar cells, which includes rod bipolars as well as ON cone bipolar cells (Vardi, 1998). In order to distinguish between rod and cone bipolar cells, we used protein kinase C-α (PKCα) to label rod bipolar cells (Haverkamp and Wassle, 2000). In the initial series of experiments with Neurobiotin injections, we found a population of noncoupled ON cone bipolars. In complementary experiments, we examined neurotransmitter coupling by labeling for immunoreactive glycine (Cohen and Sterling, 1986; Vaney et al., 1998; Haverkamp and Wassle, 2000). Vaney et al. (1998) showed that ON cone bipolars receive glycine from glycinergic AIIs via gap junctions but do not take up or produce glycine on their own. Because AIIs are glycinergic, the use of glycine is equivalent to injecting every single AII in the retina. Another advantage of using glycine was the ability to observe any differences in coupling between light- and dark-adapted states, which is impossible with DAPI-directed dye injection studies (Vaney, 1985) because of epifluorescence illumination.
The data demonstrate that approximately one-fifth of ON cone bipolar cells are not coupled to the AII network in both light- and dark-adapted states. Furthermore, the data also suggest that AII-ON cone bipolar coupling is regulated differently from AII-AII coupling because the latter has been shown to depend on the adaptation state of the retina (Hampson et al., 1992; Bloomfield et al., 1997; Baldridge et al., 1998).
MATERIALS AND METHODS
Tissue collection
All handling of rabbits and surgical procedures were conducted according to the guidelines and under the approval of the Institutional Animal Care and Use Committee. Retinas were isolated from the eyecups of New Zealand albino white rabbits (Charles River Laboratories, Wilmington, MA). Rabbits (1.5–2.5 kg) of either sex were anesthetized with ketamine (60 mg/kg), xylazine (6 mg/kg), and acepromazine (1 mg/kg) and sacrificed via intravenous injection of sodium pentobarbital (Sleepaway Euthanasia solution, Fort Dodge Laboratories, Inc., Fort Dodge, Iowa) before the eyes were removed. Depending on the experiment, the rabbits were either dark-adapted or light-adapted prior to anesthetization for 2–3 hours. For dark-adapted rabbits, surgery and tissue preparation were performed under dim red light (660 nm) in a dark room. For light-adapted rabbits, surgery and tissue preparation were performed under normal indoor lighting. Rabbits were housed under a 12-hour light/dark cycle (8 pm/8 am), and retinas were collected between 11 am and 12 pm.
Retina preparation
The dissected eyeball was cut in half, and the eyecup was separated from the lens and vitreous humor. The retina, still attached to the choroid and sclera, was placed in Ames-Nesbett solution (Sigma, St. Louis, MO) that was bubbled with 95%/5% O2/CO2 at room temperature. For Neurobiotin (Vector, Burlingame, CA) injection experiments, the eyecup was incubated for 30 minutes in 0.01 mg/ml 4,6-diamidino-2-phenylindole (DAPI: Invitrogen, Carlsbad, CA) dissolved in the bubbling Ames-Nesbett solution. DAPI was used to visualize all nuclei in the retina and was specifically used to distinguish the AII amacrine cells, which were the brightest somas in the visual field (Mills and Massey, 1991). The eyecup was cut into four to six sections that were individually floated onto filter paper vitreal side up.
Injection of identified AIIs
The flat-mounted retina pieces were securely placed in a superfusion chamber instrument and mounted into the microscope stage. The tissue was kept in 95% O2/5% CO2-bubbled Ames-Nesbett solution heated to 35–37°C (measured at the microscope objective) from an inline heater. Incubation with DAPI allowed for visualization of all somas in the inner nuclear layer. The AII amacrine cells were the first mosaic of brightly labeled somas to be seen as the focus was brought down through the retina from the inner limiting membrane (Vaney, 1985; Mills and Massey, 1991). Injection electrodes were pulled by using a Flaming-Brown puller from 1.2-mm od/0.94-mm id borosilicate glass capillaries. The tips of the electrodes were filled with 4% Neurobiotin and 0.5% Lucifer Yellow (Invitrogen) in ddH2O or 0.05 M phosphate-buffered saline (PBS) and backfilled with 100 mM KCl. Injected cells were allowed to fill for 5 minutes with a square wave current (±1 nA, 2 Hz, 50% duty cycle). For some experiments, three or four AII cells were injected to create a ring. The Neurobiotin was allowed to diffuse for 10 minutes after the last cell had filled, and the tissue was then fixed.
Immunohistochemistry
Retina pieces were fixed in 4% paraformaldehyde (Ted Pella, Redding, CA) for 1 hour at room temperature, washed extensively in 0.1 M phosphate buffer (PB), blocked in 3% donkey serum for 3 hours at room temperature, and incubated in a cocktail of primary antibodies prepared in 0.1 M PB with 1% donkey serum and 1% Triton at 4°C for 3– 7 days. The primary antibodies were as follows:
Mouse G0α (NeoMarkers, Fremont, CA; #MS-242), raised against partially purified bovine brain G0α protein and staining a single band of 39 kDa in a Western blot of purified lysate from G0α-expressing Human Cells-8 (manufacturer’s technical information), labeled all depolarizing bipolar cells (Vardi et al., 1993; Vardi, 1998).
Rabbit protein kinase C-α (PKCα; abcam, Cambridge, MA; #AB118, lot 177850), raised against a synthetic peptide, QFVHPILQSSV, corresponding to amino acids 662–672 of rabbit PKCα, and specifically staining PKCα in Western blot (manufacturers’ technical information), labeled all rod bipolar cells.
Rat anti-glycine (ImmunoSolutions, Jesmond, New South Wales, Australia; #IG1002), raised against glycine that was conjugated to a porcine thyroglobulin by using formaldehyde and extensively tested for specificity to glycine relative to other amino acids and lack of binding to the carrier protein (Pow et al., 1995), labeled endogenous free immunoreactive glycine in glycinergic amacrine cells and coupled ON cone bipolar cells.
The secondary antibodies were chosen with conjugated fluorophores: donkey anti-mouse Alexa 488 (Invitrogen) for G0α, donkey anti-rat Cy3 (Jackson ImmunoResearch, West Grove, PA) for glycine, and donkey anti-rabbit Alexa 647 (Invitrogen) for PKCα. Streptavidin-cy3 (Invitrogen) stained Neurobiotin-filled cells.
Confocal imaging and analysis
Immunolabeled retinas were imaged by using a Leica (Wetzlar, Germany) confocal microscope equipped with 488-, 561-, and 633-nm laser lines to excite the Alexa 488-, Cy3-, and Alexa 647-conjugated secondaries, respectively. 3D image sets were acquired by using optical sections spaced 0.5–1 μm apart and analyzed by using Leica software and custom software written in the lab (TiffView and Coloco). The Leica software was used to improve picture quality, specifically the contrast and brightness of the image stacks. TiffView was used to observe the 3D organization of the cells of interest, allowing viewing of one to three channels with rapid movement through the stack. Coloco was developed in collaboration with Dr. Stephen C. Massey (Dept. of Ophthalmology and Visual Science, UT Health Science Center, Houston, TX) to quantitate the average spatial relationship between multiple labels around similar anatomical units (Mills et al., 2001; Li et al., 2002a,b; Zhang et al., 2002). It was used to assess the degree of Neurobiotin and glycine labeling, if any, in ON cone bipolar cells by normalizing the range of pixels from 0 to 255 and comparing the mean intra- and extracellular intensities. Coloco also served to quantify the differences between ON cone bipolars with and without Neurobiotin or glycine by averaging each set of bipolar cells clipped from the acquired image. Coloco generated panels B–D in Figures 1–3, which show the average normalized intensity of 100 pixel2 images centered on ON cone bipolar cells. Adobe Photoshop (San Jose, CA) was used to adjust the final images of labeled retinas.
RESULTS
Neurobiotin injections of AII amacrine cells
We sought to determine whether all ON cone bipolar cells are coupled to AII amacrine cells by following two different strategies. In the first series of experiments, AII cells were injected with Neurobiotin and allowed to fill and diffuse for a controlled period (Hampson et al., 1992; Bloomfield et al., 1997; Mills and Massey, 1995, 1999, 2000; Massey and Mills, 1999; Trexler et al., 2001; Xia and Mills, 2004). Processed retinas were imaged in confocal stacks that encompassed the OPL and the outer third of the IPL. Large numbers of Neurobiotin-coupled cells that surrounded the injected cell were visible in the INL. The brightest array of somas lay in the inner limit of the INL. These cells exhibited the characteristic morphology of bistratified AII amacrine cells, with a spread of lobule-ending dendrites in sublamina a, and finer arboreal dendrites sublamina b of the IPL (Strettoi et al., 1992). Higher in the INL there was also a mosaic of less uniformly labeled cells, identified as bipolar cells. Neurobiotin-labeled cells were brightest near the injected cell and faded as the distance increased from the injection site. For all injected AIIs (n = 48), we found that a fraction of ON cone bipolar cells was not labeled with Neurobiotin.
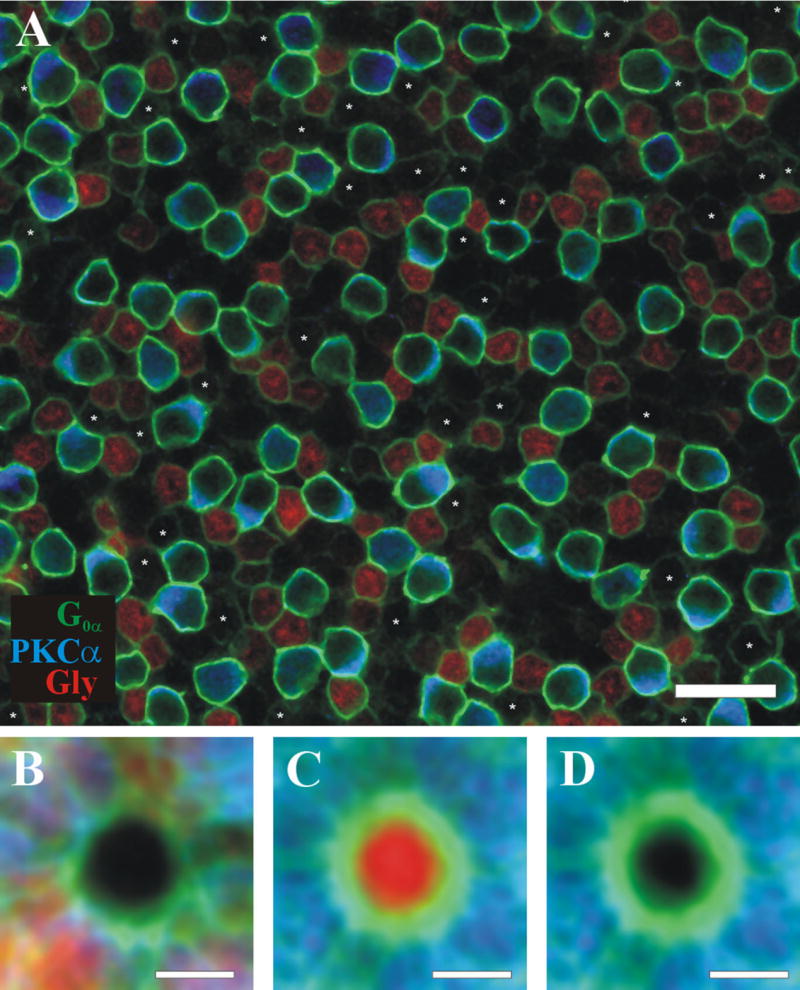
An example of an injected AII is shown in Figure 1. G0α labels all depolarizing bipolar cells along the dendritic, the somatic, and often the axonal plasma membranes of ON cone bipolars and rod bipolar cells (Vardi et al., 1998). PKCα labels the entire membrane of rod bipolar cells. Thus, ON cone bipolar cells were identified as G0α-positive/PKCα-negative cells whose somas were in the outer half of the INL. The quality of the G0α labeling was variable and seemed to depend on the interval between dissection and fixation. Numbers reported in this study were from analyzed images in which the retinas were very flat and where cell somas were easily traceable through the stack. Comparing the three different channels and the relationship between the G0α and the Neurobiotin (Fig. 1) helped identify ON cone bipolars that were not coupled to the AII network. A cell was deemed Neurobiotin negative if the mean of the pixels inside the G0α outline of the cell was less than or equal to the mean of the surrounding extracellular space (see Materials and Methods). For this image, a total of 64 ON cone bipolars were identified, and for 18 (28%) no Neurobiotin was detectable (marked by asterisks). The mean percentage of noncoupled ON cone bipolar cells for all images analyzed, in which all three labels were pristine (n = 9), was 30 ± 11%. The average of noncoupled and coupled bipolar cells are shown in Figure 1B and C, respectively. Figure 1D omits the Neurobiotin signal (red). These averaged images further highlight the difference between coupled and noncoupled cells.
Fig. 1.

Triple-labeled retina with a Neurobiotin-injected AII amacrine cell. A: Confocal section of the retina in the plane of ON bipolar cells. The somas of all depolarizing bipolar cells were labeled with G0α (green). This includes all rod bipolar cells as well as ON cone bipolar cells. Rod bipolars (labeled “R”) are labeled with PKCα (blue). The coupled ON cone bipolar cells (labeled “C”) are filled with Neurobiotin (red). The injected AII cell (upper right, labeled “I”) is in a different plane but had z-blur visible in this level. Likewise, the z-blur of other AII amacrine cells is marked with an “A.” Cells that were found to be labeled with G0α but nothing else (green outlined cell with no fill) were identified as noncoupled ON cone bipolars and labeled with an asterisk. In this tissue we found 62 rod bipolar cells, 16 AII amacrine cells, 46 coupled ON cone bipolar cells, and 18 noncoupled ON cone bipolar cells. Approximately 28% of ON cone bipolars were noncoupled. B: Normalized average image of noncoupled ON cone bipolar cells (see Materials and Methods). Note the G0α (green) ring that excludes PKCα and Neurobiotin in its center, indicating that these ON cone bipolars contained no Neurobiotin. C: Normalized average image of coupled ON cone bipolar cells. The red channel has the inverse distribution of B. D: Same as C, but with red channel removed for comparison. Scale bar = 20 μm in A; 5 μm in B–D.
Figure 1 shows the characteristic decrease in Neurobiotin intensity as distance from the injected cell increases, reflecting a decrease in concentration (Xia and Mills, 2004). It is reasonable to assume that some coupled ON cone bipolars were not labeled due to insufficient Neurobiotin concentration. To examine this possibility, we compared the numbers of Neurobiotin-negative ON cone bipolars in concentric rings with increasing radii. From a single injected AII we constructed a montage of four confocal images that together encompassed the innermost 80% of the 257 imaged ON cone bipolar cells surrounding the AII. The outer diameters of the circles were placed at 1.5, 2.5, and 3.5 soma distances from the injected cell, creating an inner circle and two annuli with nearly equal numbers of ON cone bipolars. The percentage of non-coupled cells was greater in the second and third annuli (46.7 and 46.4%, respectively) than in the inner circle (36.2%). Because the number of noncoupled cells was greater in the periphery, and there are groups of bipolar cells with different staining intensities connoting different coupling strengths (Xia and Mills, 2004), then it is likely that some coupled ON cone bipolar cells in the periphery are not detected by this assay.
In the next experiments we injected more cells per tissue, usually a ring of three or four cells to provide multiple diffusion sources (Fig. 2). The diffusion of Neurobiotin from all injection sites overlapped in the center of the ring of cells with the purpose of increasing the Neurobiotin concentration to detectable levels in poorly coupled cells. In these experiments (n = 5), we again found that there were noncoupled ON cone bipolars, including the center of the ring of injection sites. For the image depicted in Figure 2, 30% of ON cone bipolars were Neurobiotin negative (asterisks). These experiments demonstrate that the non-coupled cells we found were not due to poor diffusion or low coupling but likely reflect a true lack of gap junction communication between a population of ON cone bipolars and AII amacrine cells. We could not calculate a mean for noncoupled cells in these experiments due to inconsistent G0α labeling.
Fig. 2.

Confocal image of a triple-labeled retina that has a ring of three injected AII amacrine cells. A: Triple-labeled tissue with G0α (green), PKCα (blue), and Neurobiotin (red) filled cells. The letter I represents an injection site. Even though there are three injection sites, there are still cells that are labeled with G0α and have no Neurobiotin in them, which are identified as noncoupled ON cone bipolars (asterisks). There are noncoupled ON cone bipolar cells in the middle of the three injection sites, where Neurobiotin diffusion from the three AIIs is combined, suggesting that poor diffusion does not account for the lack of Neurobiotin labeling in the noncoupled ON cone bipolars. B–D: Same as in Figure 1. Scale bar = 20 μm in A; 5 μm in B–D.
Glycine as a diffusible tracer
The second series of experiments examined glycine coupling between AIIs and ON cone bipolar cells. ON cone bipolar cells are glutamatergic (Ehinger et al., 1988; Matsui et al., 1998) and do not release glycine as a neurotransmitter; however, they accumulate glycine via gap junctions with glycinergic AII amacrine cells (Vaney et al., 1998). There are several other glycinergic amacrine cells types in the rabbit retina. Electron microscopy studies in cat have shown gap junctions between ON cone bipolar cells and a second type of glycinergic amacrine cell, the A8 (Pourcho and Goebel, 1985a,b; Kolb and Nelson, 1996). Although the presence of amacrine cells homologous to the cat A8 has been demonstrated for rabbit (MacNeil et al., 1999), coupling of rabbit A8 amacrines to ON cone bipolars has not been confirmed. Due to the sensitivity of the Neurobiotin coupling assay and the small size of the A8 amacrine (MacNeil et al., 1999), one would expect that diffusion of low molecular weight neural tracers from the AII-ON cone bipolar network to A8 cells would occur. However, A8 amacrines have not been recovered from retinas in which Neurobiotin-injected AIIs resulted in large, well-labeled networks extending 8 or more soma distances from the injected AII (Hampson et al., 1992; our unpublished observations; Bloomfield et al., 1997). Therefore, AII amacrine cells alone are likely to contribute to the accumulation of immunoreactive glycine in ON cone bipolar cells.
ON cone bipolar cell accumulation of immuoreactive glycine proved to be a more reliable coupling assay than labeling in the Neurobiotin injections because of the increased number of diffusion sources (all AIIs) and time allowed for diffusion (hours, rather than minutes). Figure 3 shows an example of one of 38 retinal sections that were triple labeled with antibodies to glycine, PKCα, and G0α to examine the glycine distribution among ON cone bipolars. As with the Neurobiotin experiments, a population of non-coupled cells was found whose glycine content was indistinguishable from the background (Fig. 3A, asterisks). This noncoupled population (18.9 ± 6.2%) was evident in all imaged retinas (n = 35) and was consistently glycine negative regardless of any manipulations during image acquisition or analysis, such as changing laser power, photomultiplier tube gain, contrast, brightness, or the palette. For each image, the range of intensities for glycine labeling of ON cone bipolar cells was narrower than the range for Neurobiotin labeling in earlier experiments, indicating more uniform glycine concentrations and decreasing the probability of false negatives. These data demonstrate that approximately one-fifth of ON cone bipolar cells are glycine-negative and thus not coupled to the AII network.
Fig. 3.
Confocal image of light-adapted, triple-labeled inferior retina with G0α (green), PKCα (blue), and Glycine (red). A: Noncoupled ON cone bipolar cells have been identified (G0α positive, PKCα negative, and glycine negative), labeled with an asterisk (43 cells, 21.3%). B–D: Same as in Figure 1, but glycine is red. Scale bar = 20 μm in A; 5 μm in B–D.
Glycine coupling in dark- and light-adapted retinas
Two additional benefits of using glycine immunoreactivity as an assay for AII-ON cone bipolar cell coupling are that coupling could be examined under more physiological conditions and comparisons between light- and dark-adapted tissues were possible. All the retinas used for Neurobiotin injection were bleached from dissection under normal room lighting and the epifluorescence illumination required for imaging DAPI-labeled cell nuclei. For glycine studies, some rabbits were dark adapted and underwent surgery in dim red light, and those retinas were fixed in darkness to preserve the state of the retina in vivo.
The next objective was to compare the percent of non-coupled ON cone bipolars in dark- and light-adapted retinas to determine whether ON cone bipolar-AII coupling is regulated by light (Hampson et al., 1992; Mills and Massey, 1995). Retinas were adapted for 2 or more hours to allow for glycine depletion or accumulation depending on their state of coupling to the AII network (Vaney et al., 1998). In addition, for each retina, tissue collection and fixation were performed under the same condition as the adaptation. Figure 4 displays all the analyzed tissues categorized by the experimental conditions and the section of the retina used. Our findings are summarized as follows. All retinas from dark-adapted rabbits, which were protected from any exposure to light for 2 hours or more, yielded a noncoupled percentage of 17.3 ± 4.9%. The noncoupled percentage for retinas that were adapted to ambient lighting for 2 hours or more while still in the rabbit was 20 ± 6.3%. There was no significant difference for light- and dark-adapted retinas (P = 0.13). Also of note, we compared the noncoupled percentages from different sections of superior and inferior retinas and found a small difference (superior: 20.9 ± 5.7% and inferior: 16.9 ± 5%, P = 0.02), but the reason for this is uncertain. We conclude that approximately one-fifth of ON cone bipolar cells (18.9 ± 6.2%) are functionally uncoupled from the AII network in both light- and dark-adapted states.
Fig. 4.

Graphical representation of the noncoupled ON cone bipolar (ONCB) percentages of all tissues analyzed for glycine coupling. Each symbol in the key represents retina sections from a single rabbit. They are all divided into four categories of tissue state and are represented as follows: SL, light-adapted superior tissue; IL, light-adapted inferior tissue; SD, dark-adapted superior tissue; and ID, dark-adapted inferior tissue. Rabbits 1 and 2 were sacrificed on the same day. Rabbit 1 was dark adapted for 12 hours and then light adapted for 3 hours. Rabbit 2 was dark adapted for 15 hours. Rabbits 3 and 4 were sacrificed on the same day and were light or dark adapted for 3 hours prior to surgery. The remaining rabbits were adapted for 2 or 3 hours each.
DISCUSSION
By the use of three different methods, we found that there is a population of ON cone bipolar cells that are functionally not coupled to AII amacrine cells and therefore would not receive inputs from rod bipolar cells via AIIs. The first method examined tracer diffusion from a single injected AII, which was subject to uncertainty due to falloff in Neurobiotin concentration with distance from the injected cell. The second method reduced some of this uncertainty by the injection of multiple cells per tissue, thereby generating a multidirectional source of Neurobiotin for ON cone bipolars in the center of the injected ring. The third method utilized glycine diffusion from AIIs to ON cone bipolars via gap junctions. This method had the dual advantage of essentially “injecting” every AII in the retina with an even more permeable tracer than Neurobiotin, given glycine’s lower molecular weight (75 Da vs. 243 Da) and allowed for comparison of dark- and light-adapted retinas. Based on the glycine experiments, one-fifth of ON cone bipolars are not coupled, and this may explain the apparent lack of primary rod pathway input to some ganglion cells (Deans et al., 2002).
Use of an endogenous tracer such as glycine allowed tissues to be subjected to different conditions in the intact animal. Ideally, the rapid tissue collection and fixation methods we employed preserved the state of the retina in vivo. Glycine labeling of ON cone bipolars via coupling with AIIs can be viewed as a competition of two processes. Diffusion to ON cone bipolars from AIIs is counteracted by processes in the ON cone bipolars that consume or sequester the free and readily labeled glycine. Previous studies have shown that gap junctions must be blocked for an hour for the glycine labeling in ON cone bipolars to become undetectable (Vaney et al., 1998). Therefore, we are confident that the time allowed for light or dark adaptation exceeded that necessary to detect changes in ON cone bipolar glycine concentration and that the few minutes required for surgery and dissection before placement of the retinas into fixation media did not significantly alter the glycine concentration in the ON cone bipolars relative to their in vivo condition.
The presence of these noncoupled cells under all circumstances suggests that there is a population of ON cone bipolars that receive no input from rods via AII cells; however, we cannot be certain whether this population comprises a single type of ON cone bipolar or a fraction of all types. Because the primary rod pathway likely forms the highest sensitivity inputs to bipolar cells and their postsynaptic ganglion cells, lack of coupling to this pathway would lead to higher thresholds (Deans et al., 2002; Volgyi et al., 2004). It follows that a population of higher threshold ganglion cells would exist if most or all of their presynaptic bipolar cells were not AII coupled. The stratification of the IPL suggests that ganglion cells receive input from one or perhaps two different types of bipolar cells (MacNeil et al., 2004). Although our data do not directly address the issue of whether all noncoupled ON cone bipolars belong to a single morphological type, our finding that one-fifth of all ON cone bipolars are noncoupled, given the identification of five different types of ON cone bipolars (excluding wide-field bipolar cells) (Cohen and Sterling, 1990b; McGillem and Dacheux, 2001; Ghosh et al., 2004; MacNeil et al., 2004) supports that assertion. Random photofilling of rabbit bipolar cells loaded with dihydrorhodamine revealed that the five types of narrow-medium field bipolar cells exist in approximately equal proportions (MacNeil et al., 2004).
Furthermore, of the bipolar cell types that are Neurobiotin coupled, approximately one-fourth are calbindin positive (Massey and Mills, 1996), suggesting that there are four coupled types. Third, the coverage factor of all cone bipolar cells is near 1.0 (Cohen and Sterling, 1990a,b; Mills and Massey, 1992), and ON cone bipolar cells that ramify in sublamina b of the IPL have nearly the same diameter (MacNeil et al., 2004), suggesting that each type exists in equal numbers. Lastly, Cohen and Sterling (1990b) found that only one of five identified ON cone bipolars did not make gap junctions with AIIs or was not indirectly coupled via an intermediary cell. Taken together with our results, these data support the notion that the population of Neurobiotin -or glycine-negative ON cone bipolars reflects the lack of coupling of a single morphological cell type to AIIs. Regrettably, attempts to determine the morphology of the noncoupled population by injecting bipolar cells were thwarted by the low visibility of ON cone bipolar somas in DAPI-labeled tissue and the inconsistency of glycine labeling in injected retinas.
The glycine coupling assay utilized in this study has provided the first direct examination of whether the adaptational state of the retina alters coupling from AIIs to ON cone bipolars independent of changes in AII-AII homologous coupling (Hampson et al., 1992; Mills and Massey, 1995; Bloomfield et al., 1997; Baldridge et al., 1998). We found that both light- and dark-adapted tissues had the same fraction of coupled cells, suggesting that there is no difference in AII-ON cone bipolar coupling with light or dark adaptation. Although one might expect AII-ON cone bipolar coupling to exist in dark-adapted retinas (due to its role in communicating rod signals) but diminish in light-adapted retinas to maintain cone bipolar independence, data presented here argue against this and are in agreement with functional studies showing that AIIs get input from ON cone bipolars in light-adapted conditions (Cohen and Miller, 1999; Xin and Bloomfield, 1999a,b).
Acknowledgments
We thank Drs. Deanna Benson, Audrey Bernstein, and John Danias for helpful discussion and Benjamin Lee and Dr. Madhumita Sen for help with analysis. Confocal laser scanning microscopy was performed at the MSSM-Microscopy Shared Resource Facility.
Grant sponsor: National Institutes of Health; Grant numbers: EY16392 (to E.B.T.) and EY01867 (Department Core); Grant sponsor: Research to Prevent Blindness (unrestricted grant to the Department of Ophthalmology); Grant sponsors for confocal laser scanning microscopy, performed at the Mount Sinai School of Medicine-Microscopy Shared Resource Facility: National Institutes of Health-National Cancer Institute (shared resources grant 5R24 CA095823-04), National Science Foundation (Major Research Instrumentation grant DBI-9724504) and National Institutes of Health (shared instrumentation grant 1 S10 RR0 9145-01).
LITERATURE CITED
- Baldridge WH, Vaney DI, Weiler R. The modulation of intercellular coupling in the retina. Semin Cell Dev Biol. 1998;9:311–318. doi: 10.1006/scdb.1998.0235. [DOI] [PubMed] [Google Scholar]
- Bloomfield SA, Volgyi B. Function and plasticity of homologous coupling between AII amacrine cells. Vision Res. 2004;44:3297–3306. doi: 10.1016/j.visres.2004.07.012. [DOI] [PubMed] [Google Scholar]
- Bloomfield SA, Xin D, Osborne T. Light-induced modulation of coupling between AII amacrine cells in the rabbit retina. Vis Neurosci. 1997;14:565–576. doi: 10.1017/s0952523800012220. [DOI] [PubMed] [Google Scholar]
- Cohen E, Sterling P. Accumulation of (3H)glycine by cone bipolar neurons in the cat retina. J Comp Neurol. 1986;250:1–7. doi: 10.1002/cne.902500102. [DOI] [PubMed] [Google Scholar]
- Cohen E, Sterling P. Convergence and divergence of cones onto bipolar cells in the central area of cat retina. Philos Trans R Soc Lond B Biol Sci. 1990a;330:323–328. doi: 10.1098/rstb.1990.0202. [DOI] [PubMed] [Google Scholar]
- Cohen E, Sterling P. Demonstration of cell types among cone bipolar neurons of cat retina. Philos Trans R Soc Lond B Biol Sci. 1990b;330:305–321. doi: 10.1098/rstb.1990.0201. [DOI] [PubMed] [Google Scholar]
- Cohen ED, Miller RF. The network-selective actions of quinoxalines on the neurocircuitry operations of the rabbit retina. Brain Res. 1999;831:206–228. doi: 10.1016/s0006-8993(99)01448-1. [DOI] [PubMed] [Google Scholar]
- Dacheux RF, Raviola E. The rod pathway in the rabbit retina: a depolarizing bipolar and amacrine cell. J Neurosci. 1986;6:331–345. doi: 10.1523/JNEUROSCI.06-02-00331.1986. [DOI] [PMC free article] [PubMed] [Google Scholar]
- Deans MR, Volgyi B, Goodenough DA, Bloomfield SA, Paul DL. Connexin36 is essential for transmission of rod-mediated visual signals in the mammalian retina. Neuron. 2002;36:703–712. doi: 10.1016/s0896-6273(02)01046-2. [DOI] [PMC free article] [PubMed] [Google Scholar]
- DeVries SH, Baylor DA. An alternative pathway for signal flow from rod photoreceptors to ganglion cells in mammalian retina. Proc Natl Acad Sci U S A. 1995;92:10658–10662. doi: 10.1073/pnas.92.23.10658. [DOI] [PMC free article] [PubMed] [Google Scholar]
- Dunn FA, Doan T, Sampath AP, Rieke F. Controlling the gain of rod-mediated signals in the Mammalian retina. J Neurosci. 2006;26:3959–3970. doi: 10.1523/JNEUROSCI.5148-05.2006. [DOI] [PMC free article] [PubMed] [Google Scholar]
- Ehinger B, Ottersen OP, Storm-Mathisen J, Dowling JE. Bipolar cells in the turtle retina are strongly immunoreactive for glutamate. Proc Natl Acad Sci U S A. 1988;85:8321–8325. doi: 10.1073/pnas.85.21.8321. [DOI] [PMC free article] [PubMed] [Google Scholar]
- Famiglietti EV, Jr, Kolb H. A bistratified amacrine cell and synaptic cirucitry in the inner plexiform layer of the retina. Brain Res. 1975;84:293–300. doi: 10.1016/0006-8993(75)90983-x. [DOI] [PubMed] [Google Scholar]
- Field GD, Rieke F. Mechanisms regulating variability of the single photon responses of mammalian rod photoreceptors. Neuron. 2002;35:733–747. doi: 10.1016/s0896-6273(02)00822-x. [DOI] [PubMed] [Google Scholar]
- Ghosh KK, Bujan S, Haverkamp S, Feigenspan A, Wassle H. Types of bipolar cells in the mouse retina. J Comp Neurol. 2004;469:70–82. doi: 10.1002/cne.10985. [DOI] [PubMed] [Google Scholar]
- Hack I, Peichl L, Brandstatter JH. An alternative pathway for rod signals in the rodent retina: rod photoreceptors, cone bipolar cells, and the localization of glutamate receptors. Proc Natl Acad Sci U S A. 1999;96:14130–14135. doi: 10.1073/pnas.96.24.14130. [DOI] [PMC free article] [PubMed] [Google Scholar]
- Hampson EC, Vaney DI, Weiler R. Dopaminergic modulation of gap junction permeability between amacrine cells in mammalian retina. J Neurosci. 1992;12:4911–4922. doi: 10.1523/JNEUROSCI.12-12-04911.1992. [DOI] [PMC free article] [PubMed] [Google Scholar]
- Haverkamp S, Wassle H. Immunocytochemical analysis of the mouse retina. J Comp Neurol. 2000;424:1–23. [PubMed] [Google Scholar]
- Kolb H, Famiglietti EV. Rod and cone pathways in the inner plexiform layer of cat retina. Science. 1974;186:47–49. doi: 10.1126/science.186.4158.47. [DOI] [PubMed] [Google Scholar]
- Kolb H, Marshak D. The midget pathways of the primate retina. Doc Ophthalmol. 2003;106:67–81. doi: 10.1023/a:1022469002511. [DOI] [PubMed] [Google Scholar]
- Kolb H, Nelson R. Hyperpolarizing, small-field, amacrine cells in cone pathways of cat retina. J Comp Neurol. 1996;371:415–436. doi: 10.1002/(SICI)1096-9861(19960729)371:3<415::AID-CNE5>3.0.CO;2-5. [DOI] [PubMed] [Google Scholar]
- Li W, Trexler EB, Massey SC. Glutamate receptors at rod bipolar ribbon synapses in the rabbit retina. J Comp Neurol. 2002a;448:230–248. doi: 10.1002/cne.10189. [DOI] [PubMed] [Google Scholar]
- Li W, Zhang J, Massey SC. Coupling pattern of S1 and S2 amacrine cells in the rabbit retina. Vis Neurosci. 2002b;19:119–131. doi: 10.1017/s0952523802191115. [DOI] [PubMed] [Google Scholar]
- MacNeil MA, Heussy JK, Dacheux RF, Raviola E, Masland RH. The shapes and numbers of amacrine cells: matching of photofilled with Golgi-stained cells in the rabbit retina and comparison with other mammalian species. J Comp Neurol. 1999;413:305–326. [PubMed] [Google Scholar]
- MacNeil MA, Heussy JK, Dacheux RF, Raviola E, Masland RH. The population of bipolar cells in the rabbit retina. J Comp Neurol. 2004;472:73–86. doi: 10.1002/cne.20063. [DOI] [PubMed] [Google Scholar]
- Massey SC, Mills SL. A calbindin-immunoreactive cone bipolar cell type in the rabbit retina. J Comp Neurol. 1996;366:15–33. doi: 10.1002/(SICI)1096-9861(19960226)366:1<15::AID-CNE2>3.0.CO;2-N. [DOI] [PubMed] [Google Scholar]
- Massey SC, Mills SL. Gap junctions between AII amacrine cells and calbindin-positive bipolar cells in the rabbit retina. Vis Neurosci. 1999;16:1181–1189. doi: 10.1017/s0952523899166173. [DOI] [PubMed] [Google Scholar]
- Matsui K, Hosoi N, Tachibana M. Excitatory synaptic transmission in the inner retina: paired recordings of bipolar cells and neurons of the ganglion cell layer. J Neurosci. 1998;18:4500–4510. doi: 10.1523/JNEUROSCI.18-12-04500.1998. [DOI] [PMC free article] [PubMed] [Google Scholar]
- McGillem GS, Dacheux RF. Rabbit cone bipolar cells: correlation of their morphologies with whole-cell recordings. Vis Neurosci. 2001;18:675–685. doi: 10.1017/s0952523801185019. [DOI] [PubMed] [Google Scholar]
- McGuire BA, Stevens JK, Sterling P. Microcircuitry of bipolar cells in cat retina. J Neurosci. 1984;4:2920–2938. doi: 10.1523/JNEUROSCI.04-12-02920.1984. [DOI] [PMC free article] [PubMed] [Google Scholar]
- Mills SL, Massey SC. Labeling and distribution of AII amacrine cells in the rabbit retina. J Comp Neurol. 1991;304:491–501. doi: 10.1002/cne.903040312. [DOI] [PubMed] [Google Scholar]
- Mills SL, Massey SC. Morphology of bipolar cells labeled by DAPI in the rabbit retina. J Comp Neurol. 1992;321:133–149. doi: 10.1002/cne.903210112. [DOI] [PubMed] [Google Scholar]
- Mills SL, Massey SC. Differential properties of two gap junctional pathways made by AII amacrine cells. Nature. 1995;377:734–737. doi: 10.1038/377734a0. [DOI] [PubMed] [Google Scholar]
- Mills SL, Massey SC. AII amacrine cells limit scotopic acuity in central macaque retina: a confocal analysis of calretinin labeling. J Comp Neurol. 1999;411:19–34. [PubMed] [Google Scholar]
- Mills SL, Massey SC. A series of biotinylated tracers distinguishes three types of gap junction in retina. J Neurosci. 2000;20:8629–8636. doi: 10.1523/JNEUROSCI.20-22-08629.2000. [DOI] [PMC free article] [PubMed] [Google Scholar]
- Mills SL, O’Brien JJ, Li W, O’Brien J, Massey SC. Rod pathways in the mammalian retina use connexin 36. J Comp Neurol. 2001;436:336–350. [PMC free article] [PubMed] [Google Scholar]
- Nelson R. Cat cones have rod input: a comparison of the response properties of cones and horizontal cell bodies in the retina of the cat. J Comp Neurol. 1977;172:109–135. doi: 10.1002/cne.901720106. [DOI] [PubMed] [Google Scholar]
- Pourcho RG, Goebel DJ. A combined Golgi and autoradiographic study of (3H)glycine-accumulating amacrine cells in the cat retina. J Comp Neurol. 1985a;233:473–480. doi: 10.1002/cne.902330406. [DOI] [PubMed] [Google Scholar]
- Pourcho RG, Goebel DJ. Immunocytochemical demonstration of glycine in retina. Brain Res. 1985b;348:339–342. doi: 10.1016/0006-8993(85)90453-6. [DOI] [PubMed] [Google Scholar]
- Pow DV, Wright LL, Vaney DI. The immunocytochemical detection of amino-acid neurotransmitters in paraformaldehyde-fixed tissues. J Neurosci Methods. 1995;56:115–123. doi: 10.1016/0165-0270(94)00113-u. [DOI] [PubMed] [Google Scholar]
- Raviola E, Gilula NB. Gap junctions between photoreceptor cells in the vertebrate retina. Proc Natl Acad Sci U S A. 1973;70:1677–1681. doi: 10.1073/pnas.70.6.1677. [DOI] [PMC free article] [PubMed] [Google Scholar]
- Schneeweis DM, Schnapf JL. Photovoltage of rods and cones in the macaque retina. Science. 1995;268:1053–1056. doi: 10.1126/science.7754386. [DOI] [PubMed] [Google Scholar]
- Schneeweis DM, Schnapf JL. The photovoltage of macaque cone photoreceptors: adaptation, noise, and kinetics. J Neurosci. 1999;19:1203–1216. doi: 10.1523/JNEUROSCI.19-04-01203.1999. [DOI] [PMC free article] [PubMed] [Google Scholar]
- Smith RG, Freed MA, Sterling P. Microcircuitry of the dark-adapted cat retina: functional architecture of the rod-cone network. J Neurosci. 1986;6:3505–3517. doi: 10.1523/JNEUROSCI.06-12-03505.1986. [DOI] [PMC free article] [PubMed] [Google Scholar]
- Soucy E, Wang Y, Nirenberg S, Nathans J, Meister M. A novel signaling pathway from rod photoreceptors to ganglion cells in mammalian retina. Neuron. 1998;21:481–493. doi: 10.1016/s0896-6273(00)80560-7. [DOI] [PubMed] [Google Scholar]
- Sterling P, Freed MA, Smith RG. Architecture of rod and cone circuits to the on-beta ganglion cell. J Neurosci. 1988;8:623–642. doi: 10.1523/JNEUROSCI.08-02-00623.1988. [DOI] [PMC free article] [PubMed] [Google Scholar]
- Strettoi E, Raviola E, Dacheux RF. Synaptic connections of the narrow-field, bistratified rod amacrine cell (AII) in the rabbit retina. J Comp Neurol. 1992;325:152–168. doi: 10.1002/cne.903250203. [DOI] [PubMed] [Google Scholar]
- Strettoi E, Dacheux RF, Raviola E. Cone bipolar cells as interneurons in the rod pathway of the rabbit retina. J Comp Neurol. 1994;347:139–149. doi: 10.1002/cne.903470111. [DOI] [PubMed] [Google Scholar]
- Trexler EB, Li W, Mills SL, Massey SC. Coupling from AII amacrine cells to ON cone bipolar cells is bidirectional. J Comp Neurol. 2001;437:408–422. doi: 10.1002/cne.1292. [DOI] [PubMed] [Google Scholar]
- Trexler EB, Li W, Massey SC. Simultaneous contribution of two rod pathways to AII amacrine and cone bipolar cell light responses. J Neurophysiol. 2005;93:1476–1485. doi: 10.1152/jn.00597.2004. [DOI] [PubMed] [Google Scholar]
- Tsukamoto Y, Morigiwa K, Ueda M, Sterling P. Microcircuits for night vision in mouse retina. J Neurosci. 2001;21:8616–8623. doi: 10.1523/JNEUROSCI.21-21-08616.2001. [DOI] [PMC free article] [PubMed] [Google Scholar]
- Vaney DI. The morphology and topographic distribution of AII amacrine cells in the cat retina. Proc R Soc Lond B Biol Sci. 1985;224:475–488. doi: 10.1098/rspb.1985.0045. [DOI] [PubMed] [Google Scholar]
- Vaney DI. Neuronal coupling in rod-signal pathways of the retina. Invest Ophthalmol Vis Sci. 1997;38:267–273. [PubMed] [Google Scholar]
- Vaney DI, Nelson JC, Pow DV. Neurotransmitter coupling through gap junctions in the retina. J Neurosci. 1998;18:10594–10602. doi: 10.1523/JNEUROSCI.18-24-10594.1998. [DOI] [PMC free article] [PubMed] [Google Scholar]
- Vardi N. Alpha subunit of Go localizes in the dendritic tips of ON bipolar cells. J Comp Neurol. 1998;395:43–52. [PubMed] [Google Scholar]
- Vardi N, Matesic DF, Manning DR, Liebman PA, Sterling P. Identification of a G-protein in depolarizing rod bipolar cells. Vis Neurosci. 1993;10:473–478. doi: 10.1017/s0952523800004697. [DOI] [PubMed] [Google Scholar]
- Vardi N, Morigiwa K, Wang TL, Shi YJ, Sterling P. Neurochemistry of the mammalian cone ’synaptic complex’. Vision Res. 1998;38:1359–1369. doi: 10.1016/s0042-6989(98)00007-8. [DOI] [PubMed] [Google Scholar]
- Volgyi B, Deans MR, Paul DL, Bloomfield SA. Convergence and segregation of the multiple rod pathways in mammalian retina. J Neurosci. 2004;24:11182–11192. doi: 10.1523/JNEUROSCI.3096-04.2004. [DOI] [PMC free article] [PubMed] [Google Scholar]
- Xia XB, Mills SL. Gap junctional regulatory mechanisms in the AII amacrine cell of the rabbit retina. Vis Neurosci. 2004;21:791–805. doi: 10.1017/S0952523804045122. [DOI] [PMC free article] [PubMed] [Google Scholar]
- Xin D, Bloomfield SA. Comparison of the responses of AII amacrine cells in the dark- and light-adapted rabbit retina. Vis Neurosci. 1999a;16:653–665. doi: 10.1017/s0952523899164058. [DOI] [PubMed] [Google Scholar]
- Xin D, Bloomfield SA. Dark- and light-induced changes in coupling between horizontal cells in mammalian retina. J Comp Neurol. 1999b;405:75–87. doi: 10.1002/(sici)1096-9861(19990301)405:1<75::aid-cne6>3.0.co;2-d. [DOI] [PubMed] [Google Scholar]
- Zhang J, Li W, Trexler EB, Massey SC. Confocal analysis of reciprocal feedback at rod bipolar terminals in the rabbit retina. J Neurosci. 2002;22:10871–10882. doi: 10.1523/JNEUROSCI.22-24-10871.2002. [DOI] [PMC free article] [PubMed] [Google Scholar]