

Abstract
The aim of this study was to investigate the relation between microvascular and venous oxygen pressures during haemorrhagic shock and resuscitation in the pig intestine. To this end microvascular PO2 (μPO2) was measured by quenching of Pd-porphyrin phosphorescence by oxygen and validated for the intestines. In addition, mesenteric venous blood gasses, blood flow, ilial CO2 production and global haemodynamics were also measured.
In one group (n= 11), moderate shock was induced by withdrawal of 40% of the circulating blood volume. Seven of these animals were resuscitated with a crystalloid solution and four with the withdrawn blood. In a second group of three animals, a more severe shock was induced by withdrawal of 50% of the circulating blood volume; these animals were not resuscitated.
Baseline mesenteric venous PO2 and μPO2 values were similar (60 ± 9 and 60 ± 11 mmHg, respectively). During moderate shock, μPO2 dropped significantly below mesenteric venous PO2 (26 ± 10 versus 35 ± 8 mmHg). After resuscitation with crystalloid solution, μPO2 and mesenteric venous PO2 rose to 44 ± 9 and 44 ± 6 mmHg, respectively. In the group that received the withdrawn blood, values were 41 ± 9 and 53 ± 12 mmHg, respectively. Severe shock resulted in a drop in the mesenteric venous PO2 (n= 3) to a value similar to that seen in the moderate shock group, but the gut μPO2 dropped to a much lower value than that of the moderate shock group (15 ± 5 versus 26 ± 10 mmHg).
The results indicate that the oxygenation of the microcirculation of the gut can become lower than the venous PO2 under conditions of haemorrhagic shock.
Intestinal ischaemia resulting from shock is particularly hazardous because it can cause loss of barrier function, which could contribute to the development of sepsis (Pinsky & Matuschak, 1989). The oxygenation of the microcirculation can show deterioration in advance of changes in global parameters of oxygenation (Gutierrez, 1986; Stein et al. 1993; Lam et al. 1994; Kerger et al. 1996). However, the behaviour of microcirculatory oxygenation in shock and resuscitation remains largely unknown. Therefore methods are needed to assess the microvascular PO2 (μPO2). The application of the quenching of Pd-porphyrin phosphorescence by oxygen provides a new promising optical method. This method of oxygen measurement has been applied to measure the PO2 of the microcirculation of the eye (Shonat et al. 1992), the isolated rat heart (Ince et al. 1993; Rumsey et al. 1994), brain (Wilson et al. 1991; Pastuszko et al. 1993), muscle (Poole et al. 1995; Kerger et al. 1996) and tumour (Helmlinger et al. 1997). However, it has not as yet been applied to the intestines. The quenching of phosphorescence technique provides a quantitative measure of the amount of oxygen in the microcirculation. In this technique, the decay time of the phosphorescence is measured after pulsed excitation. The Pd-porphyrin is bound to albumin and when this molecular complex is injected intravascularly the dye is confined to the circulation and enables measurement of the PO2 of this compartment (Shonat et al. 1992). We recently calibrated and characterized the use of Pd-porphyrin phosphorescence for measurement of PO2 with a newly developed phosphorimeter (Sinaasappel & Ince, 1996). The main purpose of this study was to investigate the relation between the microvascular oxygenation of the pig ileum, measured by the quenched phosphorescence of Pd-porphyrin, and regional and global parameters of oxygenation, during haemorrhagic shock and resuscitation. Pd-porphyrin phosphorescence quenching by oxygen was validated for measurement of μPO2 in the intestine by comparison with surface electrode measurements. The results presented in this study show that μPO2 becomes lower than the venous PO2 during haemorrhagic shock, indicating that oxygen bypasses the microcirculation. This indicates that venous PO2 is not a good measure of the oxygenation of the intestine under all circumstances.
METHODS
Quenching of phosphorescence
The quenching of the phosphorescence of Pd-porphyrin by oxygen is based upon the principle that a Pd-porphyrin molecule which has been excited by light can either release this absorbed energy as light (phosphorescence) or transfer the absorbed energy to oxygen. As a result of the energy transfer to oxygen, the Pd-porphyrin molecule releases the absorbed energy without phosphorescence, resulting in a phosphorescence intensity and decay time which is dependent on the oxygen concentration. The Stern-Volmer relation gives the relation between the decay time and oxygen concentration:
| (1) |
In this relation, τ0 (in μs) is the decay time in the absence of oxygen, τ (in μs) is the decay time measured in the presence of [O2] (μM), and kq (μM−1μs−1) is the quenching constant. The temperature-dependent calibration constants τ0 and kq have been determined in vitro (Sinaasappel & Ince, 1996). The Stern-Volmer relation is defined for oxygen concentration rather then oxygen partial pressures. To compare the oxygen concentration ([O2]) with oxygen partial pressure (PO2) given conventionally, the oxygen concentrations from eqn (1) can be converted to PO2 values:
| (2) |
where α is the Bunsen coefficient, Vm is the molar volume of oxygen at 0°C (22.4 l mol−1) and Pg is the standard pressure (760 mmHg). For the in vivo studies, the oxygen solubility in serum (αs) was used, which is 10 % lower than the α of pure water (Christoforides et al. 1969).
Roughly three layers of tissue can be distinguished in the ileum: the muscularis externa, the submucosa and the mucosa. An estimation of the penetration depth of the used excitation light and the attenuation of the phosphorescence intensity was made to determine which microcirculatory layers of the intestinal wall contribute predominantly to the measured PO2. To this end, a Monte-Carlo simulation of the phosphorescence measurement was performed in which the absorption coefficient (μa) and scattering coefficient (μs) from human colon tissue (Marchesini et al. 1994) were used. The Monte-Carlo simulation simulates the optical pathway of a large number of photons and gives the light distribution within the tissue (Verkruysse et al. 1995). The calculated light distribution was compared with the geometric dimensions of histological sections of the ileal wall. To this end sections, stained with Haematoxylin to stain the cell nucleus and Asopholoxin to stain the cytoplasm, were analysed microscopically.
The animal model
The Animal Ethical Committee of the Academic Medical Centre of the University of Amsterdam approved the experiments described in this study.
After an overnight fast, female cross-bred Land race × Yorkshire pigs (n= 14; mean weight, 15 ± 2 kg; Vendrig, Amsterdam, The Netherlands) were sedated with ketamine-HCl (Nimatek; UAV, Cuyk, The Netherlands; 10 mg kg−1i.m.) and intubated. Anaesthesia throughout the experiment was, after an initial bolus, maintained by continuous infusion of fentanyl citrate (Fentanyl; Janssen Pharmaceutica, Tilburg, The Netherlands; bolus, 15 μg kg−1; 15 μg kg−1 h−1i.v.) and midozolam-HCL (Dormicum; Hoffmann-LaRoche, Mijdrecht, The Netherlands; bolus, 0.75 mg kg−1; 1.5 mg kg−1 h−1i.v.). No other drugs were administered which could influence the measurements. Muscle relaxation was maintained with vecuronium-bromide (Organon; Teknika B.V., Boxtel, The Netherlands; bolus, 1 mg kg−1; 0.75 mg kg−1 h−1i.v.). During the preparation the heart rate and blood pressure were monitored for signs of stress; if this occurred the level of anaesthesia was adapted accordingly. After the depth of anaesthesia was established, the infusion rate of the anaesthetics was kept constant. Muscle relaxation was assessed by monitoring the eyelid movement and shivering of the animal.
After intubation, ventilation (Dräger AV-1; Drägerwerk A.G., Lubeck, Germany) was performed by intermittent positive pressure ventilation with a mixture of 33 % O2 and 67 % N2. During preparation, artificial ventilation was instituted to maintain an end-tidal PCO2 of 35–40 mmHg. A positive end-expiratory pressure of 5 mmHg was used to prevent atelectases. All animals received an infusion of 25 ml kg−1 h−1 0.9 % NaCl solution throughout the experiment to compensate for fluid loss. A catheter was placed in the brachial artery to measure blood pressure and heart rate. A Swan Ganz catheter (Edwards 5 Fr.; Baxter Healthcare Co., Deerfield, KA, USA) was introduced in the right jugular vein for measurement of the cardiac output and central temperature. A catheter in the left jugular vein was used for blood withdrawal and administration of the resuscitation fluids. Blood samples were taken from the brachial artery and the right pulmonary artery for determination of the arterial and mixed venous blood gasses, respectively. In addition, a vein in the mesentery was cannulated to obtain mesenteric venous blood samples. Blood gasses were analysed using an ABL 505 blood gas analyser (Radiometer, Copenhagen, Denmark). Haemoglobin (Hb) concentration and saturation was measured using an OSM 3 (Radiometer, Copenhagen, Denmark). A flow probe (Transonic Systems Inc., NY, USA) was used to measure blood flow in the superior mesenteric artery. The intraluminal PCO2 of the ileum was measured as an indicator of regional ischaemia (Fiddian-Green, 1995). This was done by inserting a CO2-permeable Silastic balloon (Baxter HealthCare Co.) filled with saline into the lumen of the ileum. After 30 min equilibration, a sample was taken from this balloon and analysed for PCO2 using the blood gas analyser. Because equilibration of CO2 in saline is only 77 % complete after 30 min, the PCO2 values were multiplied by 1.24 to compensate for this effect (Fink et al. 1989).
Oxygen measurements
A length of ileum was extracted from the peritoneal cavity via a mid-line laparotomy. The fibre of the phosphorimeter and a multiwire surface oxygen electrode (GMS, Kiel-Mielkendorf, Germany), with built-in thermocouple, were placed on the serosa of the last 10 cm of the ileum. The oxygen electrode was calibrated before and after the experiment with air- and nitrogen-saturated water (VanderMeer et al. 1995). A rubber ring was placed around the electrode in contact with the tissue to isolate the electrode from atmospheric oxygen. The fibre phosphorimeter used to measure μPO2 by quenched phosphorescence of Pd-porphyrin has been described elsewhere (Sinaasappel & Ince, 1996). Intestinal surface temperature can change during haemodynamic changes (Ince et al. 1996). Since the calibration constants kq and τ0 are temperature dependent (Sinaasappel & Ince, 1996), the temperature of the intestine surface was measured throughout the experiment and used for continuous correction of kq and τ0. Pd meso-tetra (4-carboxyphenyl) porphine (Porphyrin Products, Logan, UT, USA) was dissolved in 3 ml DMSO (67 mg ml−1) and added to 50 ml of a human albumin solution in saline (40 g l−1). This mixture was brought to a pH of 8 using Tris base. Eight hours later, HCl was used to buffer the solution to a pH of 7.4. This method of preparation avoids pH dependency of the calibration constants (Sinaasappel & Ince, 1996). From this solution, 12 mg (kg body weight)−1 was injected i.v.
After instrumentation, the pigs were allowed to stabilize for 30 min. Blood gasses were sampled every 15 min and the haemodynamic parameters measured continuously. For the analyses of the arterial and venous blood gasses, samples of 1 ml were taken for a total of 15 measurements per experiment. The μPO2 was measured every 30 s by calculation of the decay time of 50 flashes of the excitation lamp.
Haemorrhagic shock
Moderate haemorrhagic shock was induced in 11 pigs by withdrawal of 25 ml kg−1 blood in four steps. Each step took 5 min, followed by a 10 min stabilization period. After this a set of measurements was carried out. Blood volumes, expressed as blood volume per kilogram body weight, amounted to 10, 7, 5 and 3 ml kg−1, respectively. In four pigs, 1 h of shock was followed by donation of the withdrawn blood (autologous blood group). In the remaining seven pigs, resuscitation was applied by infusion of three times the withdrawn volume of Ringer lactate solution (N.P.B.I., The Netherlands) (crystalloid group). This resuscitation protocol was performed according to the recommendations of the American College of Surgeons Committee on Trauma (1995). To investigate the effect of hyperoxia on the different oxygen parameters under baseline conditions, during shock, immediately after resuscitation and 60 min after resuscitation, the inspired O2 fraction (FI,O2) was elevated from 0.3 to 1, for a period of 10 min. At the end of these FI,O2 steps, a complete set of measurements was made after which FI,O2 was brought back to 0.3. Experiments were terminated by injection of a lethal dose of 10 mM KCl. In five pigs of the crystalloid group, measurement of PO2 by the surface electrode and Pd-porphyrin techniques and blood gasses was continued after the blood flow had stopped.
Simultaneous phosphorescence and oxygen electrode measurements were done on the mucosa before the haemorrhagic shock protocol was started (n= 5). For these measurements 4 cm of the ileum was opened along the antimesenteric border to make the mucosa accessible (VanderMeer et al. 1995). In these experiments, the mucosal and serosal PO2 were measured simultaneously, using both the surface electrode and Pd-porphyrin phosphorescence quenching.
In a group of three pigs, severe haemorrhagic shock was induced by withdrawal of 50 % of the blood volume. Blood was withdrawn in four steps: 15, 12, 8 and 5 ml kg−1, respectively. The changes in the oxygenation of the ileum were observed for 4 h without any form of resuscitation, other than the maintenance fluids (25 ml kg−1 h−1 0.9 % NaCl solution). Every 15 min, a full set of measurements was made. The pigs were killed after 4 h.
Data analysis
Statistical significance was determined by Student's t test in which the null hypothesis was rejected for P < 0.05. The simulations on the propagation of light in tissue were made using a Monte-Carlo simulation using the software described by Verkruysse et al. (1995). Data are presented as means ±s.d.
RESULTS
The depth of measurement using the phosphorescence technique
The penetration depth of the excitation light in the tissue and the collection efficiency of the phosphorescence light determine the depth of measurement of the phosphorescence technique.
The penetration depth of both excitation and emission light was calculated using a Monte-Carlo simulation of the light paths of emission and excitation. The calculations were done using the optical parameters reported for the intestines by Marchesini et al. (1994). The attenuation of the phosphorescence light at 700 nm is much smaller (Fig. 1), therefore the measurement depth will be determined predominantly by the attenuation of the excitation light. The results of the simulation (Fig. 1) together with the geometry of the intestine predict that 20 % of the excitation light reaches the mucosa when illumination is from the serosa. Figure 1 shows that the catchment depth for the quenching of Pd-porphyrin phosphorescence was of the order of 0.5 mm. This in contrast to the surface oxygen electrode which only measures a layer 15 μm thick (Germann et al. 1995). To experimentally verify the differences in catchment depth of the electrode and phosphorescence techniques, simultaneous measurements using both techniques were done on both serosa and mucosa.
Figure 1. Simulated light paths of the used excitation (▪; 520 nm) and phosphorescence light (▴; 700 nm) in the ileum.
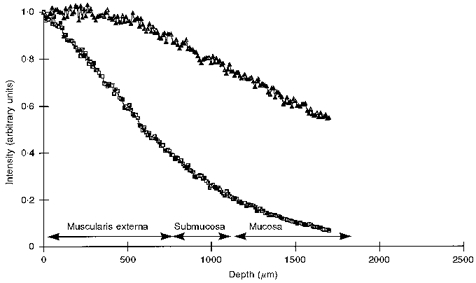
Simulations were done by a Monte-Carlo simulation using the scattering and absorbing properties of human colon tissue (Marchesini et al. 1994). Calculated penetration depths were related to the actual thickness of the muscle, submucosal and mucosal layers as indicated by the arrows. The thickness of the layers was measured from histological sections: muscle (Muscularis externa), 0.7 ± 0.3 mm; Submucosa, 0.5 ± 0.3 mm; Mucosa, 0.7 ± 0.2 mm.
The large difference between serosal versus mucosal PO2 readings as measured with the surface oxygen electrode shown in Table 1 are in agreement with the findings of others (Vallet et al. 1994; Noldge-Schomburg et al. 1996; Haisjackl et al. 1997). Table 1 shows that PO2 values measured by serosal oxygen electrodes were higher than μPO2 values obtained when measurements were made on the serosal side. When both measurements were made on the mucosal side, the μPO2 was higher than PO2 measured by surface electrode. These measurements confirm that the larger measurement volume of the Pd-phosphorescence technique results in a PO2 value from a compartment in-between the serosa and mucosa and can be regarded as a mean intestine μPO2.
Table 1.
PO2 measured in the serosa and mucosa with both the Pd-porphyrin phosphorescence and surface oxygen electrode methods for 5 pigs
| Serosa | Mucosa | |
|---|---|---|
| μPO2(mmHg) | 63 ± 3 | 42 ± 8 |
| Electrode PO2 (mmHg) | 87 ± 21 | 20 ± 6 |
Data are means ± S.D. In both serosa and mucosa, values obtained using the two methods of measurement were significantly different (P < 0.05).
Functional compartment measured by Pd-porphyrin
To test whether oxygen from the atmosphere contributes to the surface electrode and μPO2 measurements, values of these parameters were monitored during circulatory arrest induced by injection of 10 mM KCl. Figure 2 shows that the surface electrode as well as the phosphorescence measurements fell to 0 mmHg as the available oxygen was consumed by the tissue. This is in contrast to the mesenteric venous PO2 values, which were not significantly changed after the cardiac arrest. This experiment shows that the contribution of atmospheric oxygen can be ignored since both oxygen electrode and Pd-porphyrin PO2 measurements reached 0 mmHg.
Figure 2. Time course of the oxygen electrode (▪) and μPO2 (▴) measurements from the serosal side during circulatory arrest induced by the injection of 10 mM KCl.
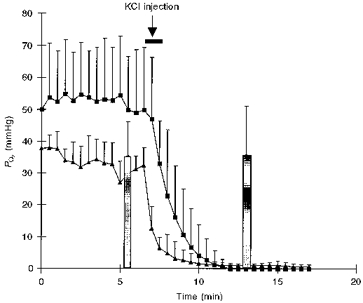
Data are means ±s.d. from 5 pigs from the crystalloid group. The mesenteric venous blood gasses (bars) were measured just before and 5 min after the KCl injection.
To investigate the sensitivity of the different circulatory compartments to changes in arterial PO2, measurements were made at different fractions of inspired oxygen. The responses of μPO2, arterial PO2, mesenteric venous PO2, mixed venous PO2 and oxygen electrode PO2 to an FI,O2 increase from 0.3 to 1 are shown in Table 2. The results show a ranking in the sensitivity of the different parameters to changes in the FI,O2. In response to increased FI,O2, the arterial PO2 and the oxygen electrode PO2 showed the largest response followed by the venous PO2 and μPO2. This ranking shows that the oxygen electrode measurement is more sensitive to changes in the arterial PO2, whereas the μPO2 is a measure of a compartment closer to the venous system. This ranking was independent of the haemodynamic changes related to shock and resuscitation.
Table 2.
The relative increases of the different oxygen measurements calculated as the ratio of the value just before switching to 100% oxygen and 10 min after the switch was made
| Resuscitation | ||||
|---|---|---|---|---|
| Pre-shock (n= 11) | Shock (n= 11) | Crystalloid (n= 7) | Autologous blood (n= 4) | |
| μPO2 | 1.2 ± 0.2 | 1.3 ± 0.4 | 1.1 ± 0.3 | 1.3 ± 0.2 |
| Mesenteric venous PO2 | 1.4 ± 0.1 | 1.3 ± 0.1 | 1.4 ± 0.2 | 1.2 ± 0.1 |
| Mixed venous PO2 | 1.3 ± 0.1 | 1.2 ± 0.1 | 1.3 ± 0.1 | 1.3 ± 0.1 |
| Electrode PO2 | 2.8 ± 0.9 | 2.0 ± 1.3 | 2.1 ± 1.2 | 2.2 ± 1.2 |
| Arterial PO2 | 3.2 ± 0.4 | 3.3 ± 0.4 | 3.6 ± 0.4 | 3.3 ± 0.8 |
Data are means ± S.D. FI,O2 steps were made before blood withdrawal (Pre-shock), after blood withdrawal (Shock) and 1 h after resuscitation. All increases are significant (P < 0.05). The increases in the oxygen electrode PO2 readings and arterial PO2 are significantly larger than the increases in venous PO2 and μPO2(P < 0.05).
Microvascular PO2 during shock and resuscitation
Haemorrhagic shock induced by stepwise blood withdrawal resulted in a concomitant stepwise fall in the mesenteric blood flow (Fig. 3B). Each step was followed by partial restoration. The continuous measurement of superior mesenteric artery flow and μPO2 (Fig. 3A and B) shows that changes in the mesenteric artery flow resulted in concomitant changes in μPO2 values.
Figure 3.
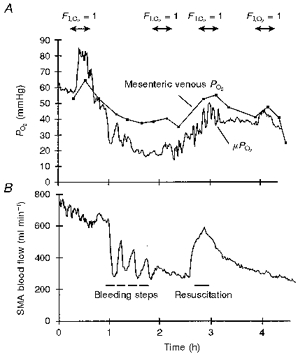
A, time course of μPO2 and mesenteric venous PO2 during moderate shock and resuscitation with autologous blood. B, the concomitant changes in the mesenteric artery (SMA) flow.
The oxygen-related and haemodynamic parameters were all significantly depressed during shock (Table 3A). The PCO2 measured tonometrically in the ileum showed a significant increase. The microvascular and mesenteric venous pre-shock PO2 values were similar. During shock, however, μPO2 dropped to a value that was lower than the venous PO2 (Table 3A and Fig. 3A). This PO2 gap between the μPO2 and the mesenteric venous PO2 can be quantified by calculating the ratio between the two values. In Table 3A this ratio is given for the moderate shock group and shows that it was significantly lower during shock compared with the pre-shock state (P < 0.05, Student's t test).
Table 3.
Global and regional oxygenation and haemodynamic parameters of the moderate shock group before (Pre-shock) and after 40% blood withdrawal (Shock) (A), after resuscitation with crystalloid solution (B) and after resuscitation with the shed blood (Autologous blood) (C)
| A. Total moderate shock group (n= 11) | ||
|---|---|---|
| Pre-shock | Shock | |
| μPO2 (mmHg) | 60 ± 11 | 26 ± 10 |
| Mesenteric venous PO2 (mmHg) | 60 ± 9 | 35 ± 8 |
| Electrode PO2(mmHg) | 87 ± 21 | 56 ± 26 |
| SMA flow (ml min−1) | 547 ± 168 | 235 ± 111 |
| μPO2/mesenteric venous PO2 (a.u.) | 1.0 ± 0.2 | 0.8 ± 0.3 |
| PCO2, ileum (mmHg) | 50 ± 6 | 64 ± 7 |
| Mixed venous PO2(mmHg) | 53 ± 6 | 27 ± 6 |
| Cardiac output (l min−1) | 1.9 ± 1 | 1.0 ± 0.2 |
| MABP (mmHg) | 104 ± 15 | 58 ± 15 |
| [Hb] (g dl−1) | 9.6 ± 1.2 | 8.4 ± 1.0 |
| B. Crystalloid group (n= 7) | ||
|---|---|---|
| Resuscitation | Post-resuscitation | |
| μPO2(mmHg) | 44 ± 9* | 29 ± 9 |
| Mesenteric venous PO2 (mmHg) | 44 ± 6* | 35 ± 11 |
| Electrode PO2 (mmHg) | 69 ± 28* | 46 ± 19 |
| SMA flow (ml min−1) | 609 ± 245* | 226 ± 91 |
| μPO2/mesenteric venous PO2 (a.u.) | 1.0 ± 0.3* | 0.9 ± 0.3 |
| PCO2, ileum (mmHg) | 61 ± 5 | 57 ± 9.4* |
| Mixed venous PO2 (mmHg) | 35 ± 5* | 33 ± 12 |
| Cardiac output (l min−1) | 1.6 ± 0.3* | 1.2 ± 0.2 |
| MABP (mmHg) | 92 ± 15* | 74 ± 13* |
| [Hb] (g dl−1) | 7.3 ± 1.2 | 7.7 ± 0.6 |
| C. Autologous blood (n= 4) | ||
|---|---|---|
| Resuscitation | Post-resuscitation | |
| μPO2 (mmHg) | 41 ± 9* | 37.6 ± 10* |
| Mesenteric venous PO2 (mmHg) | 53 ± 12* | 42.5 ± 10 |
| Electrode PO2 (mmHg) | 94 ± 16* | 71.8 ± 28 |
| SMA flow (ml min−1) | 417 ± 121* | 264.3 ± 70* |
| μPO2/mesenteric venous PO2 (a.u.) | 0.9 ± 0.3* | 1.0 ± 0.2 |
| PCO2, ileum (mmHg) | 51 ± 9* | 54.2 ± 6* |
| Mixed venous PO2 (mmHg) | 39 ± 15* | 32.8 ± 10* |
| Cardiac output (l min−1) | 1.4 ± 0.2* | 1.1 ± 0.2 |
| MABP (mmHg) | 96 ± 16* | 93.2 ± 31* |
| [Hb] (g dl−1) | 9.4 ± 1.2 | 10.3 ± 2.0 |
Data are means ± S.D. In A, all shock values are significantly different from pre-shock values (P < 0.05). In B and C, data were obtained immediately after resuscitation had taken place (Resuscitation) and 1 h later (Post-resuscitation.
Significant difference (P < 0.05) from shock values in A. MABP, mean arterial blood pressure; a.u., arbitrary units.
Following shock, a group of seven pigs were resuscitated with crystalloid solution (Table 3B).This procedure initially restored most parameters with the exception of the [Hb], which decreased due to haemodilution. It is noteworthy that the PO2 gap between microvascular and mesenteric venous PO2 was narrowed compared with shock values (Table 3A). These effects were only temporal and 1 h post-resuscitation (Table 3B) most parameters had reverted to shock levels.
In a further group of four pigs, autologous blood (1 : 1) was given following shock. All values except the [Hb] improved significantly (Table 3C). Values of μPO2, mixed venous PO2 and mean arterial blood pressure (MABP) were still significantly higher 1 h after resuscitation (Post-resuscitation) than those during shock, but were still lower than pre-shock values.
Relation between microvascular PO2 and mesenteric venous PO2 in severe shock
The previous section showed that, during an episode of shock, μPO2 dropped below mesenteric venous PO2 levels. This led to the question whether this divergence of μPO2 and mesenteric venous PO2 can become more severe in deeper and extended shock. To investigate this, severe haemorrhagic shock was induced and the microvascular and mesenteric venous PO2 were measured without resuscitation (Fig. 4). Figure 4 shows that the mesenteric venous PO2 reached a plateau at 27 mmHg below which μPO2 continued to fall. The difference between μPO2 and venous PO2during this severe haemorrhage was larger than during the milder haemorrhage.
Figure 4. μPO2 (•) and mesenteric venous PO2 (▪) for the severe shock group.
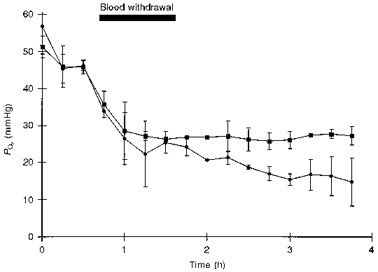
This figure shows that at 27 mmHg the mesenteric venous blood gasses level out whereas the μPO2 continues to decrease. Data are means ±s.d. (n= 3).
DISCUSSION
This study has shown that the quenching of Pd-porphyrin phosphorescence can be applied to study the μPO2 of the pig ileum. We found that the PO2 measured in this manner reflects the PO2 of the submucosa, follows the venous PO2 during changes in the inspired oxygen fraction, and becomes lower than the mesenteric venous PO2 during haemorrhagic shock. Resuscitation by blood or crystalloid solution restored this PO2 gap to baseline values.
The first part of this study was performed to determine which compartment of the microcirculation of the intestine was measured by Pd-porphyrin phosphorescence. Comparison of penetration depth of the excitation light with the geometry of the ilial wall predicted that a significant portion of the excitation light reaches the mucosa when illumination is from the serosa (approximately 20 %; Fig. 1). In the ileum a large difference in the tissue PO2 of the serosa compared with the mucosa has been observed (Table 1; Vallet et al. 1994; Noldge-Schomburg et al. 1996; Haisjackl et al. 1997). As stated before, the oxygen electrode measures a layer that is only 15 μm thick (Germann et al. 1995), whereas the measurement volume of Pd-porphyrin is determined by the penetration depth of the excitation light (Fig. 1), which is approximately 0.5 mm. Comparison of oxygen electrode values with the Pd-porphyrin measurements on serosa and mucosa (Table 1) showed that the difference in the μPO2 was much smaller than that for the oxygen electrode readings, confirming this prediction.
Bohlen (1980) in a study on the small intestine of rats using oxygen electrodes showed that, under control circumstances, the PO2 at the tips of the villi was about half the value measured at the base of the villi. The surface oxygen electrode with a penetration depth of only 15 μm will only measure the PO2 in the tips of the villi whereas the Pd-Porphyrin technique with the much larger penetration depth will measure (when placed on the mucosa) the PO2 of villi base and submucosa. This explains why the mucosal μPO2 values were larger than the surface electrode readings.
When both measurements were performed on the serosa the surface electrode PO2 values were much larger than the μPO2 values. Table 2 shows that during FI,O2 steps the oxygen electrode PO2 followed the arterial PO2 whereas the μPO2 followed the venous PO2. This result suggests that the electrode measures a more arterial compartment, which could explain the high values of the oxygen electrode readings compared with the Pd-porphyrin measurements shown in Table 1. These results suggest that the μPO2, as measured by the quenching of Pd-porphyrin phosphorescence, represents a mean μPO2 over the thickness of the intestinal wall.
The classic view based on Krogh cylinders predicts a gradual decrease in the intravascular PO2 as blood flows from the arteries through the microcirculation to the venous pool (Krogh, 1919). In contradiction to this view, the present study shows that under conditions of shock the μPO2 can become lower then the venous PO2. These results are in agreement with those of other investigators who also observed that microcirculatory oxygenation can become lower than venous PO2 values. These studies have included intravital phosphorimetry (Kerger et al. 1996) and intravital measurement of haemoglobin saturation (Stein et al. 1993). In severe haemorrhagic shock in the skin fold of hamsters, Kerger et al. (1996) found a significantly lower capillary than venous PO2.
Several mechanisms have been proposed to explain the observed differences in μPO2versus venous PO2 that develop during shock (for a detailed overview see Ince & Sinaasappel, 1998). It has been observed that the red blood cell concentration and flow in the capillaries is distributed heterogeneously (Johnson et al. 1971; Ellis et al. 1994). Possible mechanisms to explain this heterogeneity include separation of plasma and red blood cells at arteriolar bifurcations (Cokelet, 1982) and/or intracapillary mechanisms (Desjardins & Duling, 1987). This heterogeneity in flow and red blood cell concentration can cause heterogeneity in oxygenation between the capillaries. The high-oxygenated areas will contribute more oxygen to the venous oxygen content than the low-oxygenated areas. This results in areas with lower capillary then venous PO2. However, in studies on the distribution of flow in the small intestine it has been shown that during hypovolaemia and haemorrhagic shock the heterogeneity is decreased (Humer et al. 1996; Connolly et al. 1997). This makes the heterogeneity of flow a less probable explanation for the observed divergence between microvascular and venous PO2 during shock.
A second explanation can be found in the studies of Stein et al. (1993). They suggested that direct diffusion of oxygen from arterioles to collecting venules could result in lower PO2 values being found in the capillaries than in the veins (Stein et al. 1993). This direct diffusion is dependent on the oxygen gradient between the arterioles and the venules. In the haemorrhagic shock described in the present study the arterial PO2did not change significantly from baseline values during shock (172 ± 15 mmHg at baseline and 165 ± 23 mmHg in shock), whereas the mesenteric and mixed venous PO2 decreased by almost 50 % (Table 3A). This results in an increase in the arterial/venous oxygen gradient and can therefore be responsible for an increase in the diffusive oxygen shunt, which in turn would result in a gap between the venous PO2 and the μPO2.
A third possibility proposed by Gutierrez in an early theoretical study concerns restrictions of the kinetics of oxygen release from the erythrocytes to the serum (Gutierrez, 1986). The mathematical model proposed in that paper and the experimental data from this study can be used to calculate an end-capillary PO2 that becomes lower than the measured mesenteric venous PO2 during shock. These model calculations are in agreement with the observed divergence between microvascular and venous PO2 during shock.
The present study demonstrates the conditions under which the microcirculation can become more hypoxic then the venous pool and illustrates the limitation of using blood gas values as indicators of tissue oxygenation. Measurement of μPO2 together with venous PO2, however, can be used to demonstrate the occurrence of functional shunting of the microcirculation.
Acknowledgments
The authors would like to thank C. Verlaan and M. Klein for the animal preparation. This study was supported in part by a grant from The Netherlands Science Foundation (NWO grant no. 900-519-110).
References
- American College of Surgeons Committee on Trauma. Advanced Trauma Life Support. 1995. pp. 75–94.
- Bohlen HG. Intestinal tissue PO2 and microvascular responses during glucose exposure. American Journal of Physiology. 1980;238:H164–171. doi: 10.1152/ajpheart.1980.238.2.H164. [DOI] [PubMed] [Google Scholar]
- Christoforides C, Laasberg LH, Hedley-Whyte J. Effect of temperature on solubility of O2 in human plasma. Journal of Applied Physiology. 1969;26:56–60. doi: 10.1152/jappl.1969.26.1.56. [DOI] [PubMed] [Google Scholar]
- Cokelet GR. Speculation on the cause of low vessel hematocrits in the microcirculation. Microcirculation. 1982;2:1–18. [Google Scholar]
- Connolly HV, Maginniss LA, Schumacker PT. Transit time heterogeneity in canine small intestine: significance for oxygen transport. Journal of Clinical Investigation. 1997;99:228–238. doi: 10.1172/JCI119151. [DOI] [PMC free article] [PubMed] [Google Scholar]
- Desjardins C, Duling BR. Microvessel hematocrit: measurement and implications for capillary oxygen transport. American Journal of Physiology. 1987;252:H949–503. doi: 10.1152/ajpheart.1987.252.3.H494. [DOI] [PubMed] [Google Scholar]
- Ellis CG, Wrigley SM, Groom AC. Heterogeneity of red blood cell perfusion in capillary networks supplied by a single arteriole in resting skeletal muscle. Circulation Research. 1994;75:357–368. doi: 10.1161/01.res.75.2.357. [DOI] [PubMed] [Google Scholar]
- Fiddian-Green RG. Gastric intramucosal pH, tissue oxygenation and acid-base balance. British Journal of Anaesthesia. 1995;74:591–606. doi: 10.1093/bja/74.5.591. [DOI] [PubMed] [Google Scholar]
- Fink MP, Cohn SM, Lee PC, Rothschild HR, Deniz YF, Wang H, Fiddian-Green RG. Effect of lipopolysaccharide on intestinal intramucosal hydrogen ion concentration in pigs: Evidence of gut ischemia in a normodynamic model of septic shock. Critical Care Medicine. 1989;17:641–646. doi: 10.1097/00003246-198907000-00009. [DOI] [PubMed] [Google Scholar]
- Germann R, Hasibeder W, Haisjackl M, Sparr H, Luz G, Pernthaler H, Friesenecker B, Bonatti J, Gruber E, Schwarz B. Dopamine-1-receptor stimulation and mucosal tissue oxygenation in the porcine jejunum. Critical Care Medicine. 1995;23:1560–1566. doi: 10.1097/00003246-199509000-00017. 10.1097/00003246-199509000-00017. [DOI] [PubMed] [Google Scholar]
- Gutierrez G. The rate of oxygen release and its effect on capillary O2 tension: a mathematical analysis. Respiration Physiology. 1986;63:79–96. doi: 10.1016/0034-5687(86)90032-0. 10.1016/0034-5687(86)90032-0. [DOI] [PubMed] [Google Scholar]
- Haisjackl M, Luz G, Sparr H, Germann R, Salak N, Friesenecker B, Deusch E, Meusburger S, Hasibeder W. The effects of progressive anemia on jejunal mucosal and serosal tissue oxygenation in pigs. Anesthesia and Analgesia. 1997;84:538–544. doi: 10.1097/00000539-199703000-00013. [DOI] [PubMed] [Google Scholar]
- Helmlinger G, Yuan F, Dellian M, Jain RK. Interstitial pH and PO2 gradients in solid tumors in vivo: high-resolution measurements reveal a lack of correlation. Nature Medicine. 1997;3:177–182. doi: 10.1038/nm0297-177. 10.1038/nm0297-177. [DOI] [PubMed] [Google Scholar]
- Humer MF, Phang PT, Friesen BP, Allard MF, Goddard CM, Walley KR. Heterogeneity of gut capillary transit times and impaired gut oxygen extraction in endotoxemic pigs. Journal of Applied Physiology. 1996;81:895–904. doi: 10.1152/jappl.1996.81.2.895. [DOI] [PubMed] [Google Scholar]
- Ince C, Ashruf JF, Avontuur JAM, Wieringa PA, Spaan JAE, Bruining HA. Heterogeneity of hypoxic state in rat heart is determined at capillary level. American Journal of Physiology. 1993;264:H294–301. doi: 10.1152/ajpheart.1993.264.2.H294. [DOI] [PubMed] [Google Scholar]
- Ince C, Sinaasappel M. Microcirculatory oxygenation in sepsis and shock. Critical Care Medicine. 1998 doi: 10.1097/00003246-199907000-00031. (in the Press) [DOI] [PubMed] [Google Scholar]
- Ince C, Thio JM, van Iterson M, Sinaasappel M. 9th Congress of Intensive Care Medicine. Monduzzi, Italy: 1996. Microvascular PO2 measured by Pd-porphyrin quenching of phosphorescence in a porcine model of slowly developing sepsis; pp. 133–139. [Google Scholar]
- Johnson PC, Blaschke J, Burton KS, Dial JH. Influence of flow variations on capillary hematocrit in mesentery. American Journal of Physiology. 1971;221:105–112. doi: 10.1152/ajplegacy.1971.221.1.105. [DOI] [PubMed] [Google Scholar]
- Kerger H, Saltzman DJ, Menger MD, Messmer K, Intaglietta M. Systemic and subcutaneous microvascular PO2 dissociation during 4-h hemorrhagic shock in conscious hamsters. American Journal of Physiology. 1996;270:H827–836. doi: 10.1152/ajpheart.1996.270.3.H827. [DOI] [PubMed] [Google Scholar]
- Krogh A. The number and distribution of capillaries in muscle with calculations of the oxygen pressure head necessary for supplying the tissue. The Journal of Physiology. 1919;52:409–415. doi: 10.1113/jphysiol.1919.sp001839. [DOI] [PMC free article] [PubMed] [Google Scholar]
- Lam C, Tyml K, Martin C, Sibbald W. Microvascular perfusion is impaired in a rat model of normotensive sepsis. Journal of Clinical Investigation. 1994;94:2077–2083. doi: 10.1172/JCI117562. [DOI] [PMC free article] [PubMed] [Google Scholar]
- Marchesini R, Pignoli E, Tomatis S, Fumagalli S, Sichirollo A, Di Palma S, Dal Fante M, Corco A, Bortolli G. Ex vivo optical properties of human colon tissue. Lasers in Surgery and Medicine. 1994;15:351–357. doi: 10.1002/lsm.1900150404. [DOI] [PubMed] [Google Scholar]
- Noldge-Schomburg GF, Priebe HJ, Armbruster K, Pannen B, Haberstroh J, Geiger K. Different effects of early endotoxaemia on hepatic and small intestinal oxygenation in pigs. Intensive Care Medicine. 1996;22:795–804. doi: 10.1007/BF01709523. 10.1007/s001340050169. [DOI] [PubMed] [Google Scholar]
- Pastuszko A, Saadat-Lajevardi N, Chen J, Tammela O, Wilson DF, Delivoria-Papadopoulos M. Effects of graded levels of tissue oxygen pressure on dopamine metabolism in the striatum of newborn piglets. Journal of Neurochemistry. 1993;60:161–166. doi: 10.1111/j.1471-4159.1993.tb05834.x. [DOI] [PubMed] [Google Scholar]
- Pinsky MR, Matuschak GM. Multiple systems organ failure: failure of host defense homeostasis. Critical Care Clinics. 1989;5:199–220. [PubMed] [Google Scholar]
- Poole DC, Wagner PD, Wilson DF. Diaphragm microvascular plasma PO2 measured in vivo. Journal of Applied Physiology. 1995;79:2050–2057. doi: 10.1152/jappl.1995.79.6.2050. [DOI] [PubMed] [Google Scholar]
- Rumsey WL, Pawlowski M, Lejavardi N, Wilson DF. Oxygen pressure distribution in the heart in vivo and evaluation of the ischemic ‘border zone’. American Journal of Physiology. 1994;266:H1676–1680. doi: 10.1152/ajpheart.1994.266.4.H1676. [DOI] [PubMed] [Google Scholar]
- Shonat RD, Wilson DF, Riva CE, Cranstoun SD. Effect of acute increases in intraocular pressure on intravascular optic nerve head oxygen tension in cats. Investigative Ophthalmology and Visual Science. 1992;33:3174–3180. [PubMed] [Google Scholar]
- Sinaasappel M, Ince C. Calibration of Pd-porphyrin phosphorescence for oxygen concentration measurements in vivo. Journal of Applied Physiology. 1996;81:2297–2303. doi: 10.1152/jappl.1996.81.5.2297. [DOI] [PubMed] [Google Scholar]
- Stein JC, Ellis CG, Ellsworth ML. Relationship between capillary and systemic venous PO2 during nonhypoxic and hypoxic ventilation. American Journal of Physiology. 1993;265:H537–542. doi: 10.1152/ajpheart.1993.265.2.H537. [DOI] [PubMed] [Google Scholar]
- Vallet B, Lund N, Curtis SE, Kelly D, Cain SM. Gut and muscle tissue PO2 in endotoxemic dogs during shock and resuscitation. Journal of Applied Physiology. 1994;76:793–800. doi: 10.1152/jappl.1994.76.2.793. [DOI] [PubMed] [Google Scholar]
- VanderMeer TJ, Wang H, Fink MP. Endotoxemia causes ileal mucosal acidosis in the absence of mucosal hypoxia in a normodynamic porcine model of septic shock. Critical Care Medicine. 1995;23:1217–1226. doi: 10.1097/00003246-199507000-00011. 10.1097/00003246-199507000-00011. [DOI] [PubMed] [Google Scholar]
- Verkruysse W, Pickering JW, Beek JF, Keijzer M, van Gemert JC. Modeling the effect of wavelength on pulsed dye laser treatment of port wine stains. Journal of Applied Optics. 1995;32:393–398. doi: 10.1364/AO.32.000393. [DOI] [PubMed] [Google Scholar]
- Wilson DF, Pastuszko A, DiGiacomo JE, Pawlowski M, Schneiderman R, Delivoria-Papadopoulos M. Effect of hyperventilation on oxygenation of the brain cortex of newborn piglets. Journal of Applied Physiology. 1991;70:2691–2696. doi: 10.1152/jappl.1991.70.6.2691. [DOI] [PubMed] [Google Scholar]