

Abstract
Confocal microscopic studies of rat colonic mucosa showed that the pericryptal sheath surrounding distal colonic crypts is an effective barrier both to dextran and NaCl movement, whereas no such structure surrounds the caecal crypts.
The distal colonic pericryptal barrier was functionally demonstrated by accumulation of Sodium Green within the pericryptal space. After exposure to benzamil, Sodium Green accumulation was decreased. Fluorescein isocyanate-labelled dextran (FITC dextran; molecular mass 10000 Da) was accumulated in the crypt lumens and pericryptal spaces. Both dextran and Sodium Green accumulation were absent from the pericryptal zone surrounding caecal crypts.
Low dietary Na+ intake raised rat plasma aldosterone and stimulated distal pericryptal sheath growth and adhesiveness as shown by increased amounts of F-actin, smooth muscle actin, β-catenin and E-cadherins in the pericryptal zone. It also raised the capacity of the distal colon to dehydrate against a high luminal hydraulic resistance. This linkage indicates that trophic effects on the colon resulting from a low Na+ diet are not confined solely to effects on transepithelial Na+ transport, but are observed in the pericryptal sheath.
A computer model of crypt function confirms that a pericryptal sheath with low permeability to NaCl is an essential component of the crypt dehydrating mechanism.
In the preceding paper (Naftalin et al. 1999) it was shown that there is a functional difference between crypts from descending colon and caecum. The descending colon can absorb fluid against a high hydraulic resistance in the lumen, whereas, the caecum is unable to do this. It was shown that fluorescein-labelled dextran (FITC dextran; molecular mass 10000 Da) accumulated inside the crypt lumens of descending colon as a result of concentration polarization, but concentrative accumulation of FITC dextran was not seen in the caecum to any significant extent. Additionally, a low Na+ diet, which raised circulating aldosterone levels, also increased the capacity of the descending colon to absorb fluid against a high hydraulic resistance in the lumen; conversely a high Na+ diet reduced the capacity of the descending colon to absorb fluid against a high hydraulic resistance. The caecum did not absorb against a high hydraulic resistance and did not respond to variations in dietary Na+ intake.
The capacity of the descending colon to absorb against a high hydraulic resistance depends on its ability to generate a hypertonic absorbate. The absorbate tonicity increased from 352 ± 38 mosmol kg−1 with low resistance 2.5 % agarose gels to 880 ± 54 mosmol kg−1 with high resistance 10 % agarose gels (Naftalin et al. 1999).
A hypertonic absorbate tonicity of approximately 450–600 mosmol kg−1 is required to generate sufficient osmotic pressure across the crypt wall to produce the hydraulic suction pressure of 3–4 atm (300–400 kPa). This hypertonicity is generated as a result of crypt mucosal Na+ pump activity at the basolateral membranes of the crypt luminal cells pumping NaCl from the crypt lumen and surface mucosa into the pericryptal region without being completely dissipated by submucosal capillary flow.
Three mechanical processes are required to transform the Na+ pump activity of the colonic crypts into an efficient suction device. First, the osmotic pressure, created by ionic gradients across the crypt mucosa, is transduced into hydrostatic pressure at the mucosal surface of the crypt lumen. The narrow crypt lumen surrounded by wedge-shaped columnar epithelial cells is well designed to fulfil this transducing and suction function. The crypt lumen decreases when colonic transport is activated and widens when transport is inhibited (Bleakman & Naftalin, 1990). A decrease in the crypt luminal volume is caused by raised luminal tension. The wedge-shaped crypt epithelial cells retard collapse of the luminal diameter, thereby generating a large hydraulic suction tension at the crypt opening. This suction tension is propagated into the semisolid colonic luminal content.
Second, the high osmotic pressure required to generate the large hydraulic suction tension must coexist with a low hydraulic conductivity (Lp) across the entire crypt mucosal wall, otherwise water flow generated by the large osmotic gradient would prevent hypertonic NaCl accumulation.
Thirdly, there should be a physical barrier to Na+ movement from the pericryptal space into the submucosa and pericryptal capillaries. The barrier is required to maintain a high osmotic pressure gradient in vivo across the crypt mucosa, otherwise the relatively high rate of capillary circulation through the lamina propria and the high rate of water flow through the crypt lumen would dissipate the gradient (Naftalin et al. 1995; Singh et al. 1995; Skinner & O'Brien 1996; Araki et al. 1996).
The low hydraulic conductance of the crypt luminal cells and low Na+ permeability of the pericryptal sheath are analogues of membranes 1 and 2, respectively, of the double membrane model of Curran & McIntosh (1962) which explains coupled salt and water transport across epithelia (see Fig. 1).
Figure 1. An adaptation of the Curran & McIntosh double membrane model.

Diagrams showing how the Curran & McIntosh (1962) double membrane model is adapted to describe crypt-induced faecal dehydration.
Light and electron microscopic studies indicate that a network of myofibroblast-like cells surround colonic crypts (Pascal et al. 1968; Kaye et al. 1968; Joyce et al. 1987). These are attached to neighbouring cells to form a pericryptal sheath (Komuro, 1990; Tomasek et al. 1992, 1997; Eyden, 1993). As well as being identified as a diffusion barrier (Kaye et al. 1968), myofibroblasts are a source of autacoids (Berschneider & Powell, 1992).
The distal colon differs from the caecum, as it alone is capable of generating a hypertonic gradient in response to raised luminal resistance (Naftalin et al. 1990, 1999). Additionally, only the distal colon responds to a low Na+ diet by producing excess amiloride-sensitive Na+ conductance channels (Edmonds & Marriott, 1967; Clauss, 1985; Sellin & Desoignie, 1984).
In this paper we correlate regional differences in absorptive capacity with the prevalence of a pericryptal sheath by examining the distribution of F-actin fibres, β-catenin and E-cadherins present in the crypt cells in caecal and distal segments. E-cadherins are the adhesion molecules which mediate cell-cell contact in the zona adherens of transporting epithelia and in epithelial barrier tissues such as skin (Grunwald, 1993), and have recently been demonstrated to be the main adhesive molecules between corneal myofibroblasts (Petridou & Masur, 1996). The extracellular portions of E-cadherins make intercellular contact by Ca2+-dependent homophilic interactions. The intracellular portions of the molecule are linked to the cytoskeleton by direct interaction with the linker protein β-catenin, which is bound via α-catenin to the F-actin molecules in microfilaments which are present in the cortical layers of epithelial cells (Wheelock, Knudsen & Johnson, 1996).
Additionally, we examine the effects of low and high Na+ diets on growth of the pericryptal sheath and barrier formation to dextran and Na+ diffusion from the pericryptal sheath to the submucosal space.
METHODS
Confocal microscopy
Rats (Wistar) weighing 150–200 g were killed by cervical dislocation and the colonic mucosa was stripped of its muscle layer. This was mounted as a 10 mm2 sheet in a temperature-controlled perifusion chamber at 35°C. The perifusion chamber was perfused with modified Tyrode solution (mM: NaCl, 136.9; KCl, 4.0; CaCl2, 1.8; NaHCO3, 11.8; NaH2PO4, 0.9; sodium formate, 4.3; glucose, 5.6). The total measured osmolality of the Tyrode solution was 289 mosmol kg−1. The solution prior to perifusion was gassed with 95 % O2-5 % CO2 to maintain a pH of 7.3–7.4.
The tissue was viewed using a Nikon Diaphot inverted microscope with a Nikon Fluor × 20 lens with a numerical aperture of 0.75. The objective lens was attached to an MRC 600 confocal scanning head, equipped with two detection channels and an Ar-Kr mixed gas laser. This allowed simultaneous detection of fluorescein excitation, using the 488 nm line, and the bright field image, using the transmitted light detector in the second channel. Movement along the z-axis was controlled by a software-controlled stepper motor attached to the focusing control of the microscope, which allowed the plane of focus to be changed in 1 μm steps. Fluorescence images could be resolved to a depth of ca 120 μm below the tissue surface. Perifusion media were continuously passed over the tissues via a pre-warming loop and a pair of back-to-back solenoid valves (Lee Products Ltd, Gerrards Cross, UK). This enabled the solutions to be maintained at 35 ± 0.1°C and changed in less than 1 s. Medium was aspirated at the opposite side of the chamber using a suction micropipette and resulted in a near-laminar flow of medium.
Sodium Green
To test whether the pericryptal barrier retards Na+ diffusion and retains Na+ within the pericryptal space, the tissue was perfused with impermeant fluorescent Na+ probe, Sodium Green (NG). Use of a Na+-sensitive fluorescence dye excited by light at 488 nm (Sodium Green tetra (tetramethylammonium) salt, cell impermeant form, Molecular Probes Inc.) in conjunction with confocal microscopy permited more accurate observation of the extracellular distribution of Na+ than has hitherto been possible with UV epifluorescence microscopy and the Na+-sensitive fluorescence probe SBFI (Pedley & Naftalin, 1993). Additionally, the effect of a specific Na+ conductance inhibitor, benzamil (Molecular Probes) (Bridges et al. 1989) on the distribution of extracellular Sodium Green was examined.
Evidence that Sodium Green reports the extracellular Na+ concentration
Accumulation of trace amounts of Sodium Green chelated to Na+ (NG.Na+) in the pericryptal space depends on three conditions: (1) The region should be freely permeable to the unchelated form of NG, (2) NG.Na+ should be less permeable than NG, and (3) the Na+ concentrations in both bulk and local solutions should exceed the Kd of Na+ for NG ≡ 20 mM (Haugland, 1996) by a large factor. If bulk extracellular [Na+] is 140 mM and a higher concentration of Na+ is present in the pericryptal space, e.g. 200–250 mM, then Na+ chelation by NG will result in accumulation of NG.Na+ in the pericryptal region without an accompanying reduction in the space concentration of NG. In this circumstance the limiting concentration ratio NG.Na+local/NG.Na+bulk is equal to [Na+local]/[Na+bulk] (Naftalin & Pedley, 1995).
If the localized region has a high binding capacity for cations because of a high density of fixed anions, e.g. sulphated polyglycans or heparans and cadherins, then these circumstance will favour accumulation of the positively charged NG.Na+ species. Fortuitously for this study the pericryptal zone of descending colon is apparently very impermeable to cations. Accumulation of NG.Na+ is less evident in other regions (see below). It should be noted that the accumulation of Sodium Green within the pericryptal space is dependent on the low permeability of the pericryptal tissues to cations and does not depend on a change in the ratio of chelated to non-chelated forms of Sodium Green (Spring, 1998).
Hence, estimates of [Na+]i in tissue regions, i, where it is sequestered can be obtained as follows:
The bathing solution sodium concentration, [Na+]o, is obtained from the fluorescence intensity (mean pixel density 50–60) in regions of extracellular bathing solution, fNGo. Background fluorescence intensity (fbkg; mean pixel density, 8–12) is obtained from regions of tissue where extracellular fluid is sparse, i.e. over regions of high cell density crypt cells and the local extracellular regions of high mean pixel density where NG.Na+ fluorescence is concentrated (≡ 170–190).
The effects of altering extracellular Na+ from 40 to 140 mM on the Sodium Green fluorescence signal in the pericryptal region and the crypt cells are compared in Fig. 2. Extracellular [Na+] was altered by substitution of NaCl by choline chloride in the Tyrode solution. The total amount of Sodium Green, i.e. (NG + NG.Na+), in the bathing solution was held constant during the changes in [Na+]. The effects of changing the bathing solution from 140 to 80 mM Na+ by substitution of NaCl with choline chloride are shown in Fig. 3. The observed fluorescence changes in the region of the pericryptal and luminal zones of the tissue were estimated from the Sodium Green signal normalized to that at the time of the change in Tyrode solution Na+. This avoided problems with tissue movement induced by rapid changes in the solution so a time series on the fluorescence changes in a single field could be obtained. Our simulation model shows that a rate of movement for NG of 0.018 s−1 is the most likely rate-determining process for the fluorescence changes. The extent of the fluorescence change depends on the variation in tissue Na+ pump activity with altered bath [Na+] and the relative permeability of NG.Na+ and NG; the higher the relative permeability of the chelated compound, the lower the fluorescence change.
Figure 2. The effects of raising extracellular [Na+] from 40 to 140 mM on the Sodium Green fluorescence signal in the pericryptal region.
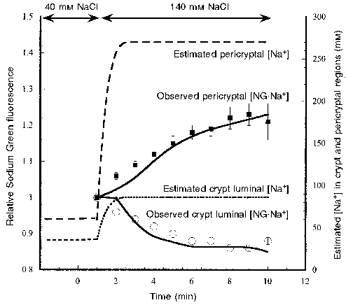
The pericryptal space (high fluorescence signal; see also Figs 12–13) and crypt luminal regions (low fluorescence signal) as measured by serial confocal microscopic images at a depth of 20 μm below the tissue surface over a 10 min period. Alteration in Na+ concentration is by substitution of choline chloride for NaCl (low fluorescence signal). Each signal is normalized to the initial fluorescence after changing solutions. The images are analysed using the NIH image program (Wayne Rasband (wayne@helix.nih.gov), National Institutes of Health, USA). The signal ratio is also shown. The error bars are ±s.e.m. (n= 5–8). The lines following the points (▪, pericryptal fluorescence; ^, crypt luminal fluorescence) are simulations of the Sodium Green fluorescence data using a simple model of the pericryptal space and crypt lumen (Fig. 1B). The predicted changes in pericryptal and crypt luminal Na+ are also shown.
Figure 3. The effects of decreasing extracellular [Na+] from 140 to 80 mM on Sodium Green fluorescence in the pericryptal region.
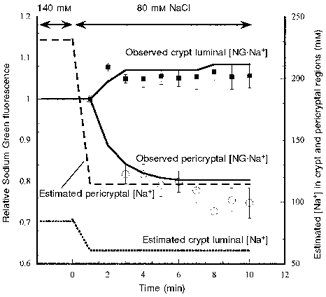
Experimental details are as described in the legend to Fig. 2. The observed pericryptal and crypt luminal fluorescence changes shown are normalized to the signals obtained immediately after making the Na+ concentration change as for Fig. 2. The lines following the points (^, pericryptal fluorescence; ▪, crypt luminal fluorescence) are simulations of the Sodium Green fluorescence data using a simple model of the pericryptal space and crypt lumen (Fig. 1B). The predicted changes in pericryptal and crypt luminal Na+ are also shown.
Increasing extracellular [Na+] from 80 to 140 mM increased the steady-state fluorescence signal of NG.Na+local in the pericryptal solution by ca 18 % within 6 min (Fig. 2) and reciprocally decreased the fluorescence in the region over the crypt cells; this effect was reversed by reduction in bulk solution [Na+] (Fig. 3).
The model predictions show that simulation of the observed changes in NG.Na+ in the pericryptal sheath crypt lumen and bathing solution can be achieved by having a NG.Na+/NG permeability ratio in the range 0.02–0.005. With this later value the ratio NG.Na+i/NG.Na+ois 0.98 of Na+i/Na+o. The model predicts that when Tyrode solution [Na+] is 140 mM, the pericryptal space Na+ is ∼270 mM; when Tyrode solution [Na+] is 80 mM, pericryptal [Na+] falls to ∼140 mM.
The decrease in fluorescence signal over the crypt region on raising Tyrode solution [Na+] from 40 to 140 mM is due to the depletion of NG as a result of increased amounts of NG.Na+ formed. The simulation model predicts that [Na+] in the crypt region is lower than in the bathing solution, but increases from ca 30 to 90 mM when Tyrode solution [Na+] is raised from 40 to 140 mM. The reduction in bathing solution [NG] accompanying the rise in Tyrode solution [Na+] reduces the [NG.Na+] signal in regions where Na+ is not actively accumulated. Conversely, the crypt luminal region shows an increase in NG.Na+ signal when Tyrode solution [Na+] is reduced from 140 to 80 mM (Fig. 3).
Low and high Na+ diets
In order to vary the blood aldosterone levels we fed rats on low and high Na+ diets, which are known to increase and decrease, respectively, circulating aldosterone levels. The rats fed on a low Na+ diet received plain flour + 5 % wheat bran with water ad libitum for 10 days, as previously described (Naftalin et al. 1999). Rats on a high Na+ diet were fed on the flour and bran diet, as above, but isotonic saline was substituted for drinking water. The rats maintained a normal weight gain during this period (Fattah et al. 1977; Abayasekara et al. 1993).
Fluorescence staining of F-actin with BODIPY-phalloidin
Isolated colonic mucosa was fixed for 5 min at 37°C in 2.0 % (w/v) paraformaldehyde in phosphate-buffered saline (PBS, pH 7.35) and then permeabilized for 15 min in 0.2 % Triton X-100 in PBS at room temperature. The permeabilized mucosa was then bathed in Hepes buffer containing a specific stain for F-actin, BODIPY-phalloidin 581/591 (10 μg ml−1, approximately 0.3 μm; Molecular Probes) for 30 min. Excess stain was then removed by repeated washing in buffer.
Fluorescence staining of E-cadherin and β-catenin
E-cadherins were labelled with human/mouse/rat-reactive goat polyclonal IgG epitope mapping to amino acids 158–177 of the amino terminus of the human E-cadherin precursor (Research Diagnostics Inc., Mount Pleasant Hill, Flanders, NJ, USA). This was diluted 1:100 with saline and incubated with 0.2 % Triton X-100-permeabilized fixed colonic mucosa for 3 h at 37°C. The goat antibody was counterstained with TRITC-labelled anti-goat antibody (Sigma Chemical Co., catalogue no. T6028) for 2 h. Alternatively, E-cadherins were stained with mouse anti-pan cadherin antibody (Sigma, catalogue no. C3678) and counterstained with goat anti-mouse antibody labelled with Texas Red (Molecular Probes).
β-Catenin was immunostained with rabbit anti β-catenin antibody (Sigma, catalogue no. C2206). This was diluted 1:100 with saline and incubated with 0.2 % Triton X-100-permeabilized fixed colonic mucosa for 3 h at 37°C. The rabbit antibody was counterstained with goat TRITC-labelled anti-rabbit antibody (Sigma, catalogue no. T5268) for 2 h.
Fluorescence staining for smooth muscle actin
α-Smooth muscle actin was immunostained with mouse antibody to α-smooth muscle actin (Sigma, monoclonal, clone no. 1A4, catalogue no. A2547) amd counterstained with goat anti-mouse labelled with Texas Red.
Modelling crypt fluid and electrolyte transport and luminal suction tension
The flows of water and electrolyte into the crypt lumen compartments, pericryptal space and submucosal compartment result from the osmotic pressure induced by Na+ pumping into the pericryptal space. The pump activity is controlled by the Na+ concentration in the crypt lumen. The resultant convective diffusion flows of electrolyte and water between the various compartments are simulated using the first-order equations of Kedem & Katchalsky (1958). The simulation was implemented using both Stella 2.2 and Stella 5, simulation programs for Macintosh and Windows 95 platforms, respectively (High Performance Systems Inc., Hanover, NH, USA).
Statistics
Estimates of statistical significance were obtained using either Student's t test for paired data, or one-way analysis of variance (ANOVA) for multiple testing in the case of the effects of high and low Na+ diets.
RESULTS
BODIPY-phalloidin staining of F-actin in rat colonic crypts
The F-actin in the cortical region of epithelial cells anchors adhesion molecules, e.g. integrins, E-cadherins and tight junction zonula adherens (ZO) proteins, within the cell membrane (Hynes, 1992; Grunwald, 1993; Wheelock et al. 1996).
The confocal images (Fig. 4A-C) show BODIPY-phalloidin staining of F-actin in rat descending colonic mucosa (width of image 120 μm) at varying depths (10–70 μm, panels A-E) from the mucosal surface. The F-actin in the fibronexus is demonstrated with BODIPY-phalloidin staining adjacent to the cell surfaces in the upper parts of the crypts. The F-actin microfilaments form a series of concentric rings surrounding the upper 50 μm of the crypt, demarcating the inner crypt luminal cells from the pericryptal sheath cells. The regions close to the mucosal surface are more heavily stained with BODIPY-phalloidin than the deeper parts where the F-actin is confined to the outer perimeter of the crypt. This intercryptal junctional zone is associated with the pericryptal accumulation of solutes (see below). At a depth of 70 μm, F-actin is lost from the pericryptal layers, although it is still present within the microfilaments of the luminal brush border.
Figure 4. Confocal microscopic depth scan through descending colonic mucosa stained with BODIPY-phalloidin for F-actin.
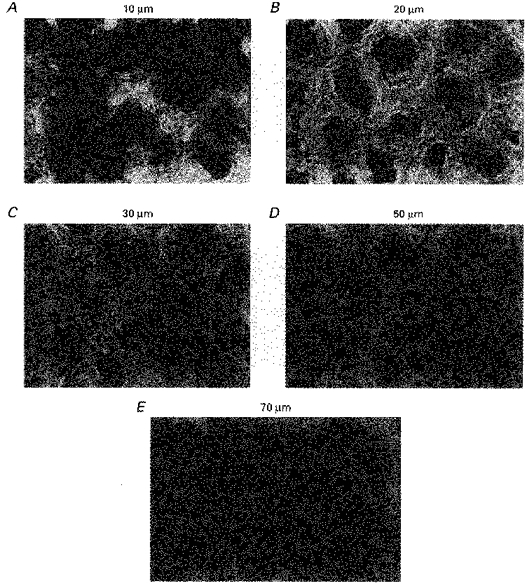
Staining of F-actin with BODIPY-phalloidin in rat descending colonic mucosa at varying depths: A, 10 μm; B, 20 μm; C, 30 μm; D, 50 μm; E, 70 μm. Width of panels, 120 μm. The F-actin in the fibronexus is the fluorescent material adjacent to the surfaces in the upper parts of the crypts. At a depth of 70 μm F-actin is a narrow, filamentous pericryptal layer. F-actin is also present in the crypt lumen due microfilaments within the crypt luminal brush-border.
F-actin distribution in caecal crypts differed from that in descending colon. In caecal crypt cells the highest proportion of F-actin was in the outer 10 μm (Fig. 5A-D), whereas in the upper part of descending colonic crypts F-actin was present in large amounts, evenly distributed throughout the entire thickness of the crypt wall and pericryptal cells. This is shown quantitatively in (Fig. 6) where the relative amounts of F-actin in descending colonic and caecal crypts are plotted as radial distributions (Pedley et al. 1993). The higher concentrations of F-actin throughout the entire thickness of the descending crypt wall indicate that there is a much richer network of intercellular adhesion molecules in this region than in the caecum.
Figure 5. Confocal microscopic depth scan through caecal mucosa stained with BODIPY-phalloidin showing F-actin distribution in crypt cells (A-D) and pericryptal capillaries (E).
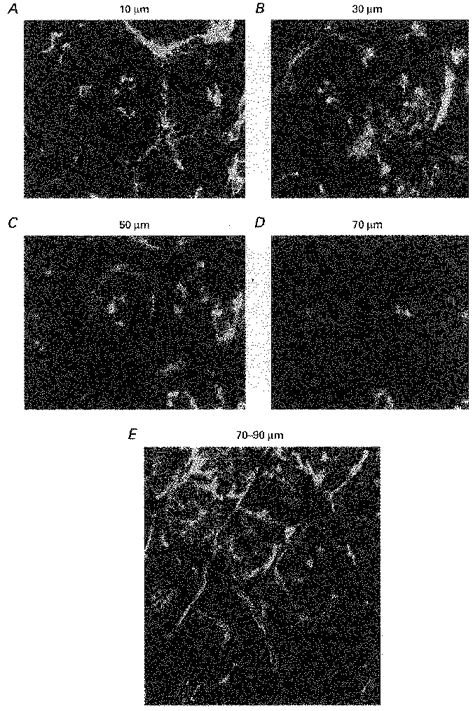
F-actin is less apparent in caecal crypts than descending colon The highest proportion of F-actin is in the outer 10 μm of the caecal crypts. Width of panels in A-D, 225 μm. Width of panels in E, 250 μm.
Figure 6. The relative amounts of F-actin in descending colonic (▪) and caecal (^) crypts plotted as radial distributions.

The radial densities of F-actin are obtained by measuring the relative fluorescence density in twenty concentric annuli surrounding the centre of each crypt lumen (n= 20 crypts). These are obtained using a macro, which automatically generates the radial density functions (Pedley et al. 1993). The average radial length of the descending colonic and caecal crypts is approximately 40 μm. The low density in the centre of the crypt is due to the absence of F-actin in the lumen. The crest of high density 8–12 μm from the axis of the descending colonic crypts is due to F-actin present in the brush border.
Another difference between rat caecal and descending colonic mucosa is the presence of a capillary network surrounding the caecal crypts and the virtual absence of capillaries in the proximity of descending colonic crypts (Fig. 5E). This finding is consistent with previous quantitative descriptions of the relative density of capillaries in these regions (Skinner & O'Brien, 1996; Araki et al. 1996; see Discussion).
Distribution of E-cadherins and β-catenins in descending colon and caecum
The distribution of E-cadherins and β-catenin in rat descending colon and caecum mirrored the distribution of F-actin; both proteins were present in high concentrations in the pericryptal sheath surrounding the upper 50 μm of the descending colonic crypts. The antibody staining also demarcates the cell membranes of the crypt wall (Fig. 7).
Figure 7. Comparison of distributions of F-actin, E-cadherin and β-catenin in rat descending colonic and caecal crypts.
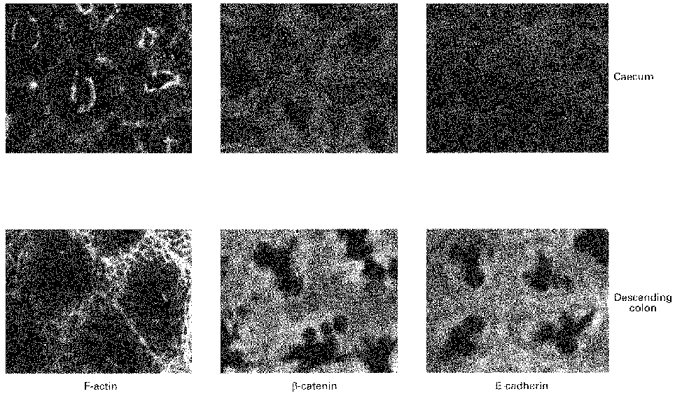
Similar densities of E-cadherin and β-catenin are observed in the crypt luminal cells of both caecum and descending colon. However, the pericryptal region of caecum shows much less staining than that of the descending colon for either protein.
In the caecum, the densities of both F-actin and β-catenin in the crypt wall were similar to those observed in the descending colon; however there was relatively less E-cadherin in the luminal cells of caecal crypts than in those of descending colonic crypts. The ratios of the densities of F-actin, E-cadherin and β-catenin in the pericryptal space to the corresponding densities in the crypt luminal cells were lower in caecal crypts than in descending colonic crypts (P < 0.01). A quantitative comparison of these distributions in the two types of crypt at a depth of 30 μm from the surface is illustrated in Fig. 8. The findings are consistent with the view that the number of intercellular adhesions in the pericryptal sheath surrounding caecal crypts is less than in descending colon. This is consistent with the view that the caecal pericryptal sheath has a lower barrier resistance than that of the descending colon.
Figure 8. The differences in distribution of F-actin (▪), β-catenin ( ) and E-cadherin (□) between descending colonic crypts and caecal crypts.
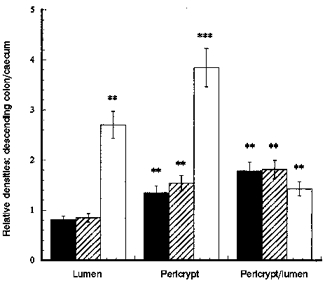
Each column shows mean values from tissue from 3 rats. Four regions of interest in the crypt and pericryptal regions from each tissue were evaluated. **P < 0.01, descending colon vs. caecum; ***P < 0.001 descending colon vs. caecum; Student's two-tailed t test.
Effect of low and high Na+ diets on F-actin, α-smooth muscle actin, E-cadherin and β-catenin distributions in descending colonic and caecal crypts
The distributions of F-actin, α-smooth muscle actin, E-cadherin and β-catenin in descending colonic mucosa of rats fed for a week on high or low Na+ diets were examined in the same way as above. In rats fed a low Na+ diet the density of both F-actin and β-catenin antibodies was higher (P < 0.01) in the crypt luminal cells than in rats fed a high Na+ diet. In the pericryptal region of descending colon of rats fed a low Na+ diet, E-cadherin antibody is also denser than in rats fed on a high Na+ diet (Figs 9–11). In rats fed a low Na+ diet the ratios of the densities of E-cadherins and β-catenin in the pericryptal region relative to the corresponding densities in the luminal cells were also higher than in rats fed on a high Na+ diet (P < 0.01).
Figure 9.

F-actin, E-cadherin and β-catenin distribution in descending colonic mucosa of rats fed on high or low Na+ diets.
Figure 11.
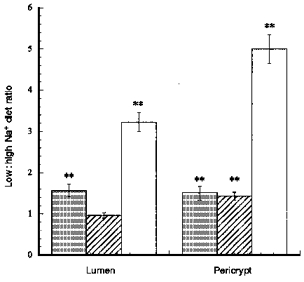
Comparison of F-actin (▪), E-cadherin ( ) and β-catenin (□) distribution in descending colonic crypts of rat fed on high and low Na+ diets
Each column shows mean values from tissues from 3 rats each fed comtemporaneously on high or low Na+ diets. Four regions of interest in the crypt and pericryptal regions from each tissue were evaluated. **P < 0.01 low Na+vs. high Na+ diet; Student's two-tailed t test.
These findings are consistent with the view that the higher suction power found in vivo in descending colons from animals on a low Na+ diet is due to a greater capacity of these crypts to generate a hypertonic absorbate because of an enhanced pericryptal barrier to ion diffusion. These findings indicate that a low Na+ diet, as well increasing transmucosal Na+ movements (Horster et al. 1994), has a trophic effect on the pericryptal sheath.
The smooth muscle actin, which is found in myofibroblasts (Joyce et al. 1987; Petridou & Masur, 1996), is most evident in the pericryptal layer of descending colon of rats fed a low Na+ diet. In contrast to F-actin, smooth muscle actin is not present in luminal microvilli (cf. Fig. 9).
Sodium Green accumulation in the pericryptal region of descending colonic crypts
It was shown in Methods that Sodium Green tetra (tetramethylammonium salt, cell membrane-impermeant form) reports the concentration changes of Na+ in the extracellular fluid surrounding rat descending colon. It is possible to demonstrate that high concentrations of Na+ are sequestered within the pericryptal spaces by superimposing the Sodium Green fluorescence image on the corresponding bright field image (Pedley & Naftalin, 1993; Naftalin & Pedley, 1995). Sodium Green accumulates in the pericryptal spaces to a depth of 70–100 μm below surface. Unlike FITC dextran, Sodium Green does not accumulate more in the crypt lumen than in the external bathing solution.
A high power confocal fluorescence view of descending colonic crypts perfused for 5 min with Sodium Green dye in Tyrode saline at a depth of 20–40 μm from the mucosal surface is shown in Fig. 12A. The Sodium Green dye accumulated in the pericryptal space to a concentration 3.5 ± 0.2-fold (P < 0.001, n= 4) higher than in the external bathing solution and crypt lumen. This indicates that [Na+] in the pericryptal space was 490 ± 90 mM and that the pericryptal solution was hypertonic to the crypt luminal solution by ∼700 mosmol kg−1.
Figure 12. Pericryptal Na+ accumulation demonstrated by difference imaging.

A, high power confocal fluorescence views of descending colonic crypts perfused for 5 min with Sodium Green dye at a depth of 20–40 μm from the mucosal surface. B-D, the difference images between 5 and 10 min (B), between 5 and 15 min (C) and between 5 and 20 min (D). The difference images in B-D are obtained by subtracting the fluorescence densities of superimposable images obtained at 5 min intervals using the image subtraction facility in the NIH image program. The increase in fluorescence surrounding the crypts is seen as a narrow line, which increases in intensity between 5 and 20 min. The black parts of the difference image show no change in fluorescence intensity. Width of each panel, 165 μm.
Because the Sodium Green fluorescence accumulated in the entire pericryptal space of descending crypts, it was difficult to localize the source of the pericryptal Na+. However, by examining the successive difference images between 5 and 10 min (Fig. 12B), between 5 and 15 min (Fig. 12C) and between 5 and 20 min (Fig. 12D), the source of the raised pericryptal [Na+] became evident. A build-up in fluorescence occurred at the basal poles of the crypt cells, which is consistent with the dye being accumulated between the infoldings of the basal membranes. This build-up would normally be obscured by the bright Sodium Green fluorescence retained within the pericryptal spaces of distal colonic crypts.
Figure 10. Comparison of α-smooth muscle actin distribution in descending colon and caecum of rats fed low and high Na+ diets.
α-Smooth muscle actin is more evident in the pericryptal cells surrounding descending colon of rats fed a low Na+ diet than those fed a high Na+ diet. The figure shows crypts at a depth of between 10 and 20 μm below the tissue surface.
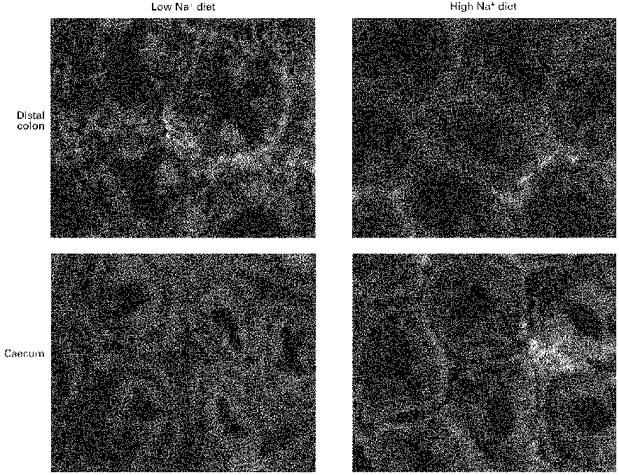
Much less Sodium Green dye accumulated in the caecal pericryptal region than in the corresponding regions surrounding descending colon (Fig. 13). This is consistent with a higher permeability to Sodium Green in the caecal pericryptal region than in the corresponding region of the descending colon.
Figure 13.
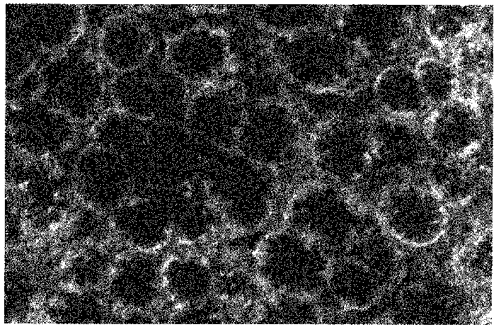
Confocal image of Sodium Green accumulation in the pericryptal region of rat caecal crypts
Note absence of dye accumulation in the caecal pericryptal spaces. Width of panel, 500 μm.
Additionally, a higher density of Sodium Green fluorescence was observed in the crypt lumen of caecal crypts than in the lumens of descending colonic crypts, indicating that the descending colonic crypts depleted their lumens of NaCl, whereas caecal crypts did not (see ‘Simulation of crypt function’ in Discussion and Fig. 16).
Figure 16. The responses of the models of distal colonic (A, C and E) and caecal (B, D and F) crypts to the effects of raising the luminal hydraulic resistance at 250 s.

A and B show that the model response to increased luminal resistance is to increase absorbate tonicity and increase the rate of fluid absorption in line with observed findings (see preceding paper: Naftalin et al. 1999). The model with a low pericryptal sheath resistance (B) becomes unstable after 400 s as crypt luminal water and Na+ fall to zero. However, with this model no large increase in absorbate tonicity is observed after increasing the load hydraulic resistance (F). The crypt luminal and pericryptal space hydrostatic pressures are shown in C and D. In the distal colonic crypt model (C) the luminal tension falls to very low levels (-5000 cmH2O) as this can be sustained by the large osmotic pressure across the crypt wall. The luminal pressure developed in the model of caecal crypts is lower (D). The [NaCl] concentrations in the pericryptal space and crypt lumens are shown in E and F. In the descending colonic crypt model (E) a high osmolarity is present at steady state in the pericryptal space and a low osmolarity is present in the crypt lumen. No large osmotic pressure differences are sustained in the caecal model (F). It can be noted that the effect of raising the crypt luminal tension is to decrease the pericryptal [NaCl].
Effects of benzamil on Sodium Green distribution
Addition of the high affinity inhibitor of epithelial cell Na+ conductance, benzamil (20 μm) (Bridges et al. 1989) to the perfusion solution decreased the pericryptal Sodium Green fluorescence. This effect was detectable after 1 min and progressed for a further 10 min (Fig. 14). The benzamil-dependent decrease in Sodium Green fluorescence, shown as a difference image, is observed in a narrow, sharply delineated zone immediately surrounding the crypts. The extent of the benzamil-dependent decrease in Sodium Green fluorescence over 10 min was ca 37 % of the total Sodium Green signal, equivalent to a decrease of 180 mM in the pericryptal Na+ concentration from ∼500 mM.
Figure 14. The effect of benzamil on Sodium Green fluorescence in the pericryptal region of rat descending colonic crypts.

A, the pericryptal Sodium Green fluorescence at an image depth 20–30 μm below the mucosal surface, immediately before addition of benzamil (20 μm) to the perfusion solution. B, difference image as in Fig. 12B is shown, illustrating the regions where the Sodium Green fluorescence signal has decreased in the time between 0.5 and 30 min after addition of benzamil. A decrease in intensity is shown as black; no change is white. Width of each panel, 250 μm.
The sharp demarcation between the pericryptal zone of Na+ sensitivity to the action of benzamil and the region lying outside this layer indicates that a diffusion barrier to Na+ movement lies adjacent to the basal poles of the crypt colonocytes. This zone coincides with the region where FITC dextran accumulates after it is concentrated in the crypt lumens (Naftalin & Pedley, 1995; Naftalin et al. 1999).
The effects of a low Na+ diet on extracellular Sodium Green distribution in the pericryptal solutions of rat descending colons were also investigated (not shown). These results indicate that a low Na+ diet led to a higher accumulation of Sodium Green dye in the pericryptal space than a control diet. This finding was difficult to quantify precisely, as this technique is unsuited to establishing small differences between tissues from different animals; although large differences can be detected (Pedley & Naftalin, 1993).
Pericryptal accumulation of dextran
In the preceding paper (Naftalin et al. 1999) it was shown that there is a greater accumulation of dextran (molecular mass 10000) in the crypt lumens of descending colon than in the caecal crypts (Figs 8 and 9 in Naftalin & Pedley, 1999). This indicates that the ratio of the rate (cm s−1) of fluid inflow to crypt wall permeability (cm s−1) to dextran in descending colonic crypts is higher than in caecal crypts.
It is estimated using a computer simulation of concentration polarization (Naftalin et al. 1995) that the ratio v/(PCy5) is 25-fold higher in descending colonic crypts than in caecal crypts. From this estimate the rate of water uptake into the crypt luminal openings of descending colon was estimated to be ∼10−3 cm s−1, ca 5- to 10-fold greater than into caecal crypt lumens.
At a depth of 40 μm the ratio of fluorescein acetate fluorescence in the caecal crypt lumen to that in the adjacent pericryptal space was 7.5 ± 1.5, whereas in the distal crypts this ratio was 1.5 ± 0.2. This difference reflects the differences in permeabilities of the crypt wall, Pwall, and the pericryptal resistance outside the wall, Ppericrypt, between the descending colon and caecum.
If the pericryptal sheath has a high permeability to fluorescein, little dye is retained in the pericryptal space. Quantitatively this can be expressed as follows:
where F is fluorescence intensity and P the permeability (cm s−1) of fluorescein. Thus a low ratio of fluorescence intensity in the crypt lumen to that in the pericryptal sheath implies that the pericryptal sheath permeability is low.
Assuming an equal permeability to fluorescein acetate across the crypt walls of distal colon and caecum, it follows from the above equations that:
This indicates that the pericryptal permeability of the caecum to fluorescein acetate is at least 13-fold higher (P < 0.01) than that of the distal colonic crypts.
DISCUSSION
Microscopic differences in structure and function between rat caecum and descending colon crypts in relation to fluid absorption
Several results point to the conclusion that the caecal pericryptal sheath is much more permeable to both Na+ and macromolecules than the distal colonic pericryptal sheath. It is evident that the pericryptal sheath of the descending colonic crypts presents a much higher barrier to solute diffusion than that of caecal crypts, since dextran accumulation in the pericryptal space surrounding descending colonic crypts was higher than in the space surrounding caecal crypts and the ratios of the concentrations of Cy5 and fluorescein acetate in the caecal crypt lumen to the corresponding concentrations in the caecal pericryptal space were lower. The higher the concentration ratio across the barrier, the higher is the resistance to diffusion.
Another major difference between descending colonic crypts and caecal crypts in rats was the lack of Sodium Green accumulation in the pericryptal spaces of caecum in comparision with the descending colon. This was also an independent demonstration of the presence of a pericryptal diffusion barrier to NaCl surrounding descending colonic crypts.
The Na+ sensitivity of Sodium Green accumulation was confirmed in Fig. 14, where the effect of benzamil, a specific inhibitor of Na+ entry via Na+ conductance channels into colonic epithelial cells (Bridges et al. 1989), is demonstrated. The coincidence of the narrow pericryptal depletion band of Sodium Green fluorescence displaying benzamil sensitivity with the zone showing pericryptal dextran accumulation indicates that colonic crypts are bounded by a physical barrier which retards both dextran and Na+ diffusion. The absence of this barrier in caecal crypts is an important confirmation that its presence in descending colonic crypts has functional significance.
Evidence that intercellular adhesion molecules in pericryptal sheath are affected by dietary Na+ intake
The density of F-actin at the cell membrane is related to the density of adhesion molecules between adjacent cells. The intercellular adhesion molecule is bound via catenins to F-actin; integrins, adhesion molecules which bind to extracellular matrix proteins, also bind intracellular F-actin via the Rho protein (Komuro, 1990; Hynes, 1992; Tomasek et al. 1992; Glass & Kreisberg, 1993; Bussey, 1996). High densities of E-cadherins and β-catenin are found in barrier epithelial cells (Grunwald, 1993; Wheeler et al. 1996) and myofibroblasts (Petridou & Masur, 1996). This finding is consistent with the view that in the upper 50–70 μm of distal colonic crypts the dense intercellular adhesions of the pericryptal sheath have a barrier function, isolating the pericryptal space from the submucosal space.
The densities of F-actin, β-catenin and E-cadherin show wide regional differences. Higher concentrations of all three molecules are present in the pericryptal region surrounding the upper 40 μm of descending colonic crypts than in the lower parts of the crypts or in the caecal pericryptal region (Figs 7 and 8). Additionally, more F-actin, α-smooth muscle actin, E-cadherin and β-catenin are present in the pericryptal sheath of descending colonic crypts of rats exposed to low Na+ diet than in the sheaths of rats exposed to a high Na+ diet (Figs 9–11). These findings indicate that the densities and amounts of adhesion molecules present in the pericryptal sheath are correlated with the capacity of the crypt to generate a suction tension. The extracellular matrix proteins, such as collagen, could strengthen the intercellular adhesions provided by E-cadherins; however, as the major deposits of collagen are present in descending colon mainly adjacent to the surface mucosa (Kaye et al. 1968), the role of extracellular matrix protein in pericryptal barrier function remains open.
The increases in the amounts of F-actin, α-smooth muscle actin, E-cadherin and β-catenin in the descending colonic crypts of rats fed on a low Na+ diet are consistent with reported effects of raised aldosterone and angiotensin II. These agents enhance net Na+ absorption in cultured colonic crypt cells grown on reconstituted basement membranes and increase the resistance of crypt-derived cell monolayers (Horster et al. 1994). Proliferation of cardiac myofibroblasts and collagen turnover in the surrounding extracellular matrix has been observed in rat hearts exposed to raised angiotensin II and aldosterone (Campbell et al. 1995; Weber et al. 1997). The observed response of distal colon to a low Na+ diet seen here may be another manifestation of the trophic effects of aldosterone on fibroblastic growth (Unger et al. 1996). The relative dearth of capillaries surrounding the distal crypts in comparison to caecal crypts may result from suppression of angiogenesis by these hormones. However, no change in the amount and distribution of angiotensin II receptor is observed with Na+ intake (R. J. Naftalin & K. C. Pedley, unpublished observations). The difference in response of the pericryptal sheath cells to high and low Na+ diets suggests that the sheath cells respond to a separate set of growth signals from the luminal cells. This is consistent with previous findings that the rates of cell division and migration of the pericryptal sheath differ from those of the crypt luminal cells (Kaye et al. 1968). It is also consistent with more recent findings of Petridou & Masur (1996), who show that corneal myofibroblasts adhere to each other via cadherins and this type of intercellular connection is apparently regulated by growth factors.
Simulation of crypt function
The computer model was designed to simulate the following specific properties of colonic crypts. (1) The crypt should have the capacity to generate within the crypt lumen a large suction tension necessary to dehydrate faeces and account for convective diffusion and concentration polarization of dextran (Naftalin et al. 1995; Naftalin et al. 1999). (2) The crypt should have the capacity to generate a hypertonic absorbate. The absorbate tonicity should increase as the hydraulic load is raised. This involves (a) osmotic coupling of water and NaCl movement across the crypt luminal mucosa and (b) accumulation of a hypertonic solution in the pericryptal zone to generate a large osmotic pressure across the crypt luminal wall. The ion and water flux measurements should be consistent with those determined in rat colon in vivo (Zammit et al. 1994). (3) The crypt must have a pericryptal sheath acting as a barrier to diffusion of NaCl and to hydraulic conductance. The sheath is necessary for retention of a hypertonic NaCl solution in the ‘intermediate’ compartment between the double membrane barrier.
The model was adapted to simulate either descending colonic crypts, which generate a high suction tension, or caecal crypts, which do not. The only difference between these models is (a) the absence of a pericryptal permeability barrier from caecal crypts and (b) a small reduction in Na+ pump activity in the caecum to keep the water and ion flow matched to observed values. The major parameters, namely the hydraulic conductances (Lp) and permeabilities in different parts of the model system, are shown in Fig. 15 and the system variables are shown in Fig. 16.
Figure 15.

Variation in the coefficients of the models of crypts from rats fed high and low Na+ diets
A and B, effects of increased hydraulic load on the hydraulic conductivities of the crypt lumen, paracellular, transcellular and pericryptal sheath high-resistance (A) and low-resistance (B) pathways. C and D, changes in crypt lumen, paracellular and pericryptal Na+ permeability with high (C) and low (D) pericryptal sheath resistance. The coefficients, which vary, are responding to crypt luminal pressure, which shuts down the paracellular shunt conductances of Na+ and water leaving the transcellular routes unaffected. Thus paracellular, crypt lumen (distal part of crypt lumen) and crypt opening (proximal half of crypt lumen) Lp values show a dramatic decrease when the hydraulic resistance of the colonic lumen is raised at 250 s. The transcellular and pericryptal Lp and pericryptal Na+ permeability remain unaltered.
In the caecal model, the Lp values of the paracellular pathway across the crypt wall and the pericryptal sheath are ten times higher than for the descending colon. Similarly, the pericryptal and paracellular permeability to NaCl are 20- and 10-fold higher in the caecal simulation than in the descending colonic crypts. These parameters were chosen because of the experimental findings reported in Results. The only other difference between the distal and caecal crypt simulations is the rate of Na+ pump activity. In the caecum the pump rate is fixed at 2.5 nosmol cm−2 s−1 and in the distal colon it is fixed at 7.5 nosmol cm−2 s−1. This is required to keep the net rates of fluid and electrolyte in the two regions comparable with the observed rates in vivo.
The effects of activating the Na+ pump at zero time on net fluid absorption rate from the lumen and absorbate tonicity of fluid extracted from the colonic lumen are shown in Fig. 15A and B. This is followed by a second perturbation: a 25-fold increase in the hydraulic resistance of the luminal content from 5 × 10⁻⁶ to 2 × 10⁻⁷ cm cmH2O −1 s−1 at the time indicated by the horizontal arrow. This simulates the effects of placing a high hydraulic resistance in the colonic lumen.
In the descending colon simulation, an increase in hydraulic load resistance in the colonic lumen is accompanied by a decrease in the rate of fluid absorption from around 60 to 10 μl cm−2 h−1. The absorbate tonicity increases from 350 mosmol kg−1 to 800–1000 mosmol kg−1 as observed in vivo (Naftalin et al. 1999). With the caecal simulation the fluid absorption falls from 80 μl cm−2 h−1 to between 5 and 10 μl cm−2 h−1, but the absorbate tonicity only increases from 290 to 300 mosmol kg−1 for a short period before becoming unstable. Thus the models are able to simulate the macroscopic behaviour of the descending colon and caecum.
The microscopic activity of the crypts is also simulated. The NaCl concentration in the pericryptal space of descending crypts is raised to around 500 mosmol kg−1 and the crypt luminal [NaCl] falls to ca 150 mosmol kg−1 before the high luminal resistance is applied. Although the absorbate tonicity rises, after the high luminal resistance, the pericryptal [NaCl] falls. Raising the luminal hydraulic resistance reduces convective inflow of NaCl into the crypt lumen, so crypt luminal [NaCl] falls to low levels. This reduces crypt Na+ pump activity, thus explaining the decreased pericryptal [Na+]. The caecal crypts are unable to generate a high luminal tension because both the crypt wall and the pericryptal sheath are leaky to NaCl.
These findings are consistent with the experiments showing high Sodium Green accumulation in the pericryptal space of descending colonic crypts and the much lower level of Sodium Green accumulation observed in the pericryptal regions of caecal crypts. Thus, the model confirms that a pericryptal sheath surrounding colonic crypts with low hydraulic conductance and NaCl permeability is an essential component in the crypt mechanism of faecal dehydration.
Acknowledgments
The authors wish to thank Dr Barbara Whitehouse, Physiology Group, Division of Biomedical Sciences, King's College London, Kensington Campus, for measurements of the rat aldosterone levels and advice regarding high and low Na+ diets, Mr Ray Andrews for his expert help in maintaining and controlling the animal diets, and Mr Jay Thiagarajah for help with immunohistochemical staining.
References
- Abayasekara DRE, Onyezili NI, Whitehouse BJ, Laird SM, Vinson GP. Effects of chronic corticotrophin treatment on aldosterone metabolism in the rat. Journal of Endocrinology. 1993;137:445–455. doi: 10.1677/joe.0.1370445. [DOI] [PubMed] [Google Scholar]
- Araki K, Furuya Y, Kobayashi M, Matsuura K, Ogata T, Isozaki H. Comparison of mucosal microvasculature between the proximal and distal human colon. Journal of Electron Microscopy. 1996;45:202–206. doi: 10.1093/oxfordjournals.jmicro.a023433. [DOI] [PubMed] [Google Scholar]
- Berschneider HM, Powell DW. Fibroblasts modulate intestinal secretory responses to inflammatory mediators. Journal of Clinical Investigation. 1992;89:484–489. doi: 10.1172/JCI115610. [DOI] [PMC free article] [PubMed] [Google Scholar]
- Bleakman D, Naftalin RJ. Hypertonic fluid absorption from rat descending colon in vitro. American Journal of Physiology. 1990;258:G377–390. doi: 10.1152/ajpgi.1990.258.3.G377. [DOI] [PubMed] [Google Scholar]
- Bridges RJ, Cragoe EJ, Jr, Frizzell RA, Benos DJ. Inhibition of colonic Na+ transport by amiloride analogues. American Journal of Physiology. 1989;256:C67–74. doi: 10.1152/ajpcell.1989.256.1.C67. [DOI] [PubMed] [Google Scholar]
- Bussey H. Update - Rho returns - its targets in focal adhesions. Science. 1996;273:203. doi: 10.1126/science.273.5272.203. [DOI] [PubMed] [Google Scholar]
- Campbell SE, Janicki JS, Weber KT. Temporal differences in fibroblast proliferation and phenotype expression in response to chronic administration of angiotensin II or aldosterone. Journal of Molecular and Cellular Cardiology. 1995;27:1545–1560. doi: 10.1016/s0022-2828(95)90359-3. [DOI] [PubMed] [Google Scholar]
- Clauss W. Segmental action of aldosterone on water and electrolyte transport across rabbit colon in vivo. Comparative Biochemistry and Physiology A. 1985;81:873–877. doi: 10.1016/0300-9629(85)90922-3. [DOI] [PubMed] [Google Scholar]
- Curran PF, McIntosh JR. A model for biological water transport. Nature. 1962;193:347–348. doi: 10.1038/193347a0. [DOI] [PubMed] [Google Scholar]
- Edmonds CJ, Marriott JC. The effect of aldosterone and adrenalectomy on the electrical potential difference of rat colon and on the transport of sodium, potassium, chloride and bicarbonate. Journal of Endocrinology. 1967;39:517–531. doi: 10.1677/joe.0.0390517. [DOI] [PubMed] [Google Scholar]
- Eyden BP. Brief review of the fibronexus and its significance for myofibroblastic differentiation and tumor-diagnosis. Ultrastructural Pathology. 1993;17:611–622. doi: 10.3109/01913129309027797. [DOI] [PubMed] [Google Scholar]
- Fattah DI, Whitehouse BJ, Vinson GP. Biosynthesis of aldosterone from 18-hydroxylated precursors in rat adrenal tissue in vitro. Journal of Endocrinology. 1977;75:187–195. doi: 10.1677/joe.0.0750187. [DOI] [PubMed] [Google Scholar]
- Glass WF, Kreisberg JI. Regulation of integrin-mediated adhesion at focal contacts by cyclic-AMP. Journal of Cellular Physiology. 1993;157:296–306. doi: 10.1002/jcp.1041570212. [DOI] [PubMed] [Google Scholar]
- Grunwald GB. The structural and functional analysis of cadherin calcium-dependent cell adhesion molecules. Current Opinion in Cell Biology. 1993;5:797–805. doi: 10.1016/0955-0674(93)90028-o. [DOI] [PubMed] [Google Scholar]
- Haugland RP. Handbook of Fluorescent Probes and Research Chemicals. 6. Eugene, OR, USA: Molecular Probes Inc.; 1996. [Google Scholar]
- Horster M, Fabritius J, Buttner M, Maul R, Weckwerth P. Colonic-crypt-derived epithelia express induced ion transport differentiation in monolayer cultures on permeable matrix substrata. Pflügers Archiv. 1994;426:110–120. doi: 10.1007/BF00374678. [DOI] [PubMed] [Google Scholar]
- Hynes RO. Integrins - versatility, modulation, and signaling in cell-adhesion. Cell. 1992;69:11–25. doi: 10.1016/0092-8674(92)90115-s. [DOI] [PubMed] [Google Scholar]
- Joyce NC, Haire MF, Palade GE. Morphologic and biochemical evidence for a contractile cell network within the rat intestinal mucosa. Gastroenterology. 1987;92:68–81. doi: 10.1016/0016-5085(87)90841-9. [DOI] [PubMed] [Google Scholar]
- Kaye GI, Lane N, Pascal RR. Colonic pericryptal fibroblast sheath: replication, migration and cytodifferentiation of a mesenchymal cell system in adult tissue. II. Fine structural aspects of normal rabbit and human colon. Gastroenterology. 1968;54:852–865. [PubMed] [Google Scholar]
- Kedem O, Katchalsky A. Thermodynamic analysis of the permeability of biological membranes to non-electrolytes. Biochimica et Biophysica Acta. 1958;27:229–246. doi: 10.1016/0006-3002(58)90330-5. [DOI] [PubMed] [Google Scholar]
- Komuro T. Re-evaluation of fibroblasts and fibroblast-like cells. Anatomical Embryology (Berlin) 1990;182:103–112. doi: 10.1007/BF00174011. [DOI] [PubMed] [Google Scholar]
- Naftalin RJ, Pedley KC. The sodium concentration of lateral intercellular spaces. Journal of Membrane Biology. 1995;147:105–106. doi: 10.1007/BF00235401. [DOI] [PubMed] [Google Scholar]
- Naftalin RJ, Zammit PS, Pedley KC. Concentration polarization of fluorescent dyes in rat descending colonic crypts: evidence of crypt fluid absorption. The Journal of Physiology. 1995;487:479–495. doi: 10.1113/jphysiol.1995.sp020894. [DOI] [PMC free article] [PubMed] [Google Scholar]
- Naftalin RJ, Zammit PS, Pedley KC. Regional differences in rat large intestinal crypt function in relation to dehydrating capacity in vivo. The Journal of Physiology. 1999;514:201–210. doi: 10.1111/j.1469-7793.1999.201af.x. [DOI] [PMC free article] [PubMed] [Google Scholar]
- Pascal RR, Kaye GI, Lane N. Colonic pericryptal fibroblast sheath: replication, migration, and cytodifferenentiation of a mesenchymal cell system in adult tissue. Gastroenterology. 1968;54:835–851. [PubMed] [Google Scholar]
- Pedley KC, Jones GE, Magnani M, Rist RJ, Naftalin RJ. Direct observation of hexokinase translocation in stimulated macrophages. Biochemical Journal. 1993;291:515–522. doi: 10.1042/bj2910515. [DOI] [PMC free article] [PubMed] [Google Scholar]
- Pedley KC, Naftalin RJ. Evidence from fluorescence microscopy and comparative studies that rat, ovine and bovine colonic crypts are absorptive. The Journal of Physiology. 1993;460:525–547. doi: 10.1113/jphysiol.1993.sp019485. [DOI] [PMC free article] [PubMed] [Google Scholar]
- Petridou S, Masur SK. Immunodetection of connexins and cadherins in corneal fibroblasts and myofibroblasts. Investigative Opthalmology and Visual Science. 1996;37:1740–1748. [PubMed] [Google Scholar]
- Sellin JH, Desoigne R. Rabbit proximal colon - a distinct transport epithelium. American Journal of Physiology. 1984;246:G603–610. doi: 10.1152/ajpgi.1984.246.5.G603. [DOI] [PubMed] [Google Scholar]
- Singh SK, Binder HJ, Boron WF, Geibel JP. Fluid absorption in isolated-perfused colonic crypts. Journal of Clinical Investigation. 1995;96:2373–2379. doi: 10.1172/JCI118294. [DOI] [PMC free article] [PubMed] [Google Scholar]
- Skinner SA, O'Brien PE. The microvascular structure of the normal colon in rats and humans. Journal of Surgical Research. 1996;61:482–490. doi: 10.1006/jsre.1996.0151. [DOI] [PubMed] [Google Scholar]
- Spring KR. Routes and mechanism of fluid transport in epithelia. Annual Review of Physiology. 1998;60:105–119. doi: 10.1146/annurev.physiol.60.1.105. [DOI] [PubMed] [Google Scholar]
- Tomasek JJ, Haaksma CJ, Eddy RJ, Vaughan MB. Fibroblast contraction occurs on release of tension in attached collagen lattices - dependency on an organized actin cytoskeleton and serum. Anatomical Record. 1992;232:358–368. doi: 10.1002/ar.1092320305. [DOI] [PubMed] [Google Scholar]
- Tomasek JJ, Halliday NL, Updike DL, AhernMoore JS, Vu TKH, Liu RW, Howard EW. Gelatinase A activation is regulated by the organization of the polymerized actin cytoskeleton. Journal of Biological Chemistry. 1997;272:7482–7487. doi: 10.1074/jbc.272.11.7482. [DOI] [PubMed] [Google Scholar]
- Unger T, Chung O, Csikos T, Culman J, Gallinat S, Gohlke P, Hohle S, Meffert S, Stoll M, Stroth U, Zhu YZ. Angiotensin receptors. Journal of Hypertension. 1996;14:S95–103. [PubMed] [Google Scholar]
- Weber KT, Sun Y, Katwa LC. Myofibroblasts and local angiotensin II in rat cardiac tissue repair. International Journal of Biochemistry and Cell Biology. 1997;29:31–42. doi: 10.1016/s1357-2725(96)00116-1. [DOI] [PubMed] [Google Scholar]
- Wheelock MJ, Knudsen KA, Johnson KR. Membrane-cytoskeleton interactions with cadherin cell adhesion proteins: roles of catenins as linker proteins. Current Topics in Membranes. 1996;43:169–184. [Google Scholar]
- Zammit PS, Mendizabal MV, Naftalin RJ. Effects on fluid and Na+ flux of varying luminal hydraulic resistance in rat colon in vivo. The Journal of Physiology. 1994;447:539–548. doi: 10.1113/jphysiol.1994.sp020214. [DOI] [PMC free article] [PubMed] [Google Scholar]