Abstract
Carotid chemoreceptor sensitivity is minimal immediately after birth and increases with postnatal age. In the present study we have investigated the peri- and postnatal developmental time course of [Ca2+]i responses to hypoxia in clusters of type I cells isolated from near-term fetal rats and rats that were 1, 3, 7, 11, 14 and 21 days old, using the Ca2+-sensitive fluoroprobe fura-2.
In type I cells from all age groups a graded increase in [Ca2+]i occurred in response to lowering the PO2 from 150 mmHg to 70, 35, 14, 7, 2 and 0 mmHg. The graded [Ca2+]i response to hypoxia was hyperbolic at all ages.
Type I cells from rats near-term fetal to 1 day old exhibited small [Ca2+]i responses, mainly to the most severe levels of hypoxia. After day 1, an increase in the [Ca2+]i responses to submaximal hypoxia stimulation resulted in a rightward shift in the O2 response curve. Using the Δ[Ca2+]i between 35 and 2 mmHg PO2 as an index of O2 sensitivity, type I cell O2 sensitivity increased approximately 4- to 5-fold between near-term fetal to 1 day old and 11 to 14 days of age.
Exposure to elevated extracellular potassium (10, 20 and 40 mm K+) caused a dose-dependent [Ca2+]i rise in type I cells from all age groups. There were no age-related changes in [Ca2+]i responses to any level of K+ between near-term fetal and 21 days.
We conclude that the maximal type I cell [Ca2+]i response to anoxia, as well as the sensitivity to submaximal hypoxic stimulation, of rats aged from near-term fetal to 21 days depends on the level of postnatal maturity. The lack of an age-related increase in the [Ca2+]i response to elevated K+ during the timeframe of maximal development of O2 sensitivity suggests that resetting involves maturation of O2 sensing, rather than non-specific developmental changes in the [Ca2+]i rise resulting from depolarization.
Regulation of arterial oxygen levels is critically important in mammals, particularly during early life. Peri- and postnatal hypoxia may lead to impaired cognitive development, abnormalities in cardiovascular function, breathing control maturation and lung function, and death (Okubo & Mortola, 1988; Nyakas et al. 1996; Hudlicka & Brown, 1996).
The main sensors of arterial O2 tension are the carotid body chemoreceptors, which are located bilaterally at the bifurcations of the common carotid arteries. Carotid chemoreceptor sensory afferents, via the carotid sinus nerves (CSN), project to the nucleus tractus solitarii and other brainstem nuclei, providing the major source of O2-mediated ventilatory drive. Neural signals from the carotid chemoreceptors to brainstem cardiorespiratory control nuclei also mediate critically important respiratory reflexes such as arousal from sleep during hypoxia and cardiovascular reflexes that modulate heart rate and blood pressure (Marshall, 1987).
The primary site of oxygen sensing in the carotid body is thought to be the type I cell (Gonzalez et al. 1994). Type I cells are specialized sensory neurons which depolarize in response to low O2, resulting in Ca2+ entry via voltage-gated calcium channels, and exocytosis of neurotransmitters and modulators onto apposed CSN terminals (Gonzalez et al. 1994). Although further study is needed to define their precise role, there is little question that type I cells play a crucial role in carotid chemoreceptor oxygen sensing.
Carotid denervation, which is well tolerated by adults, in neonates leads to profound abnormalities of respiratory control and high mortality rates. In piglets and in lambs the effects of carotid denervation just after birth are not immediate but, instead, life-threatening respiratory abnormalities occur weeks later (Bureau et al. 1985; Donnelly & Haddad, 1990; Cote et al. 1996). This suggests a ‘vulnerable period’ during mammalian postnatal maturation, during which functioning carotid chemoreceptors become essential for surviving infancy.
Perhaps surprisingly, given their obvious importance, the carotid chemoreceptors are minimally sensitive just after birth and become active over the next few days. Previous studies suggest a slower phase of carotid chemoreceptor maturation, with O2 sensitivity increasing slowly over weeks or months (Carroll et al. 1993). This rightward shifting of the O2 response range after birth is termed ‘resetting’ of the arterial chemoreceptors and it occurs in both the carotid and aortic chemoreceptors (Kumar & Hanson, 1989). Although it is clear that oxygen tension at birth is the major factor modulating carotid chemoreceptor resetting (Blanco et al. 1988), the mechanism and site of resetting are unknown.
Using fura-2 to measure intracellular calcium ([Ca2+]i), we previously reported that enzymatically isolated type I cells of the newborn rabbit exhibit smaller [Ca2+]i responses to hypoxia compared with cells isolated from adults and studied under identical conditions (Sterni et al. 1995). However, our previous study examined only two ages, 1-2 days old vs. adult, and one level of hypoxia. Maturation of type I cell [Ca2+]i responses to graded hypoxia and the developmental profile of O2 sensitivity resetting have not been reported. In addition, it is not known whether the peri- and postnatal development of type I cell [Ca2+]i responses involves the development of mechanisms leading to cell depolarization or whether they reflect an age-related increase in the [Ca2+]i rise resulting from depolarization.
If postnatal resetting and maturation of carotid chemoreceptor O2 sensitivity reflects properties of the type I cell, then type I cell O2 sensitivity should be low at the time of birth and increase postnatally with a profile consistent with the known time course of carotid chemoreceptor maturation. The present study aimed to determine the developmental profile of [Ca2+]i responses to maximal and submaximal hypoxic stimulation, the developmental profile of type I cell sensitivity to graded hypoxia, and the dependence of [Ca2+]i responses to elevated extracellular K+ on the level of postnatal maturity.
METHODS
Isolation of cells
Type 1 cells were isolated from rats at the following ages: near-term fetal, 1, 3, 7, 11, 14 and ∼21 days. All procedures were approved by the Animal Care and Use Committee of Johns Hopkins School of Medicine. At least three cell preparations, from different litters, were performed at each age.
Cells from near-term fetal rats were harvested at 20 days gestation (rat gestational period is 21 days). The mother was anaesthetized with methoxyflurane; the rat was placed in a 1 l container with 2-3 ml of methoxyflurane until deep surgical anaesthesia was obtained. While still under anaesthesia, the uterus was removed by Caesarean section. The mother was killed by decapitation under deep surgical anaesthesia. Each fetus was removed from the uterus, immediately decapitated and the head placed in ice-cold saline. For experiments using rat pups, the rat was anaesthetized with methoxyflurane as above, decapitated and the head placed in ice-cold saline.
The carotid bifurcations were dissected and placed in ice-cold phosphate-buffered saline (PBS; Sigma). The carotid bodies were dissected from the bifurcations and placed in 1 ml enzymatic solution composed of 0.6 ml PBS with 50 μm Ca2+, 0.2 ml trypsin (1 mg ml−1; Sigma) and 0.2 ml of Type I collagenase (5 mg ml−1; Sigma). The carotid bodies were incubated in the enzymatic solution at 37°C in 21 % O2-5 % CO2 for 20 min. The 20 min enzymatic incubation time was determined, in preliminary experiments, to be optimal for cells from newborn rats. Increasing the incubation time for carotid bodies from older rats increased cell yield but not the amplitude of [Ca2+]i measurements. Therefore, because we were making comparisons among seven ages, we elected to standardize the enzymatic incubation time.
The carotid bodies, along with the enzyme solution, were transferred to an Eppendorf tube with a fire-polished glass pipette and incubated for an additional 5 min. After the second incubation, the cells were dispersed by gently rocking the Eppendorf tube. The tissue was pelleted at 200 g for 2 min and resuspended in 1 ml of growth medium composed of Ham's F12 medium (Mediatech) with 1 % fetal calf serum, 33 mM glucose, 2 mM L-glutamine, 100 u ml−1 penicillin, 100 μg ml−1 streptomycin, 1 % Fungizone (Gibco) and 0.08 u ml−1 insulin. The cells were centrifuged a second time at 200g for 2 min, the supernatant removed and growth medium added at 35 μl per coverslip (typically 3-4 coverslips were used per experiment). The cells were plated on poly-D-lysine-coated glass coverslips at 30 μl per coverslip and incubated at 37°C in 21 % O2-5 % CO2 until use. Clusters of type I cells were studied between 4 and 8 h after plating.
Measurement of intracellular calcium
Cytosolic Ca2+ ([Ca2+]i) was measured by quantitative fluorescence imaging using the calcium-sensitive dye fura-2 (Grynkiewicz et al. 1985). Cells attached to the coverslip were loaded with fura-2 by incubation for 8 min at 37°C in 21 % O2-5 % CO2 with 4 mM fura-2 acetoxymethyl ester (fura-2 AM; Molecular Probes). Fura-2 fluorescent emission was measured at 510 nm in response to alternating excitation at 340 and 380 nm. Images were acquired and stored using a Zeiss Axiovert-135TV microscope and CCD camera and image intensifier (Videoscope) under computer control (Metafluor, Universal Imaging, West Chester, PA, USA).
For each coverslip, the background light levels were determined and subtracted, pixel by pixel, from each image before measurement of the fluorescence intensity ratio at 340 nm/380 nm. [Ca2+]i was determined using the 340 nm/380 nm fluorescence ratio and the equation:
where Ro is the measured fluorescence ratio, Rmin is the fluorescence ratio at 0 Ca2+, Rmax is the fluorescence ratio at saturating Ca2+, Kd is the dissociation constant for fura-2 (224 nM; Grynkiewicz et al. 1985) and β is the ratio of 380 nm fluorescence intensity at 0 Ca2+ to 380 nm fluorescence intensity at saturating Ca2+ concentrations. Calibration was performed using cell-free solutions. Autofluorescence was determined by treating the cells as above but without loading with fura-2. At the maximum camera gains used for this preparation, autofluorescence was undetectable under control or anoxic conditions.
Experimental protocol
After loading cells with fura-2, the coverslip was placed in a closed microscope chamber (0.2 ml total volume) and perfused with a bicarbonate-buffered balanced salt solution (BSS) containing (mM): 118 NaCl, 23 NaHCO3, 3 KCl, 2 KH2PO4, 1.2 CaCl2, 1 MgCl2 and 10 glucose. The ‘baseline’ superfusate, equilibrated with 21 % O2- 5 % CO2, also contained 5 μg ml−1 of the membrane-impermeant DNA stain propidium iodide (PI; Molecular Probes). The hypoxic superfusates consisted of the above BSS (without PI) equilibrated with 10, 5, 2, 1 and 0 % O2 in 5 % CO2 balanced with N2. Also, to produce a PO2 of 0 mmHg, 0.5 mM sodium hydrosulphite (Na2S2O4) was added to BSS equilibrated with 5 % CO2-95 % N2. For experiments examining the type I cell response to high external K+, solutions containing 10, 20 and 40 mM KCl were made from the above BSS with equimolar substitution of NaCl by KCl. All superfusates were maintained at 35°C. Perfusion rate was ∼1 ml min−1. The oxygen tension of the superfusate entering the chamber was measured with a flow-through oxygen electrode (Microelectrodes, Inc., Londonderry, NH, USA).
Two protocols were used for cells from rats aged near-term fetal, 1, 3, 7, 11, 14 or 21 days: graded hypoxia and elevated extracellular KCl. The graded hypoxia protocol, to determine the type I cell O2-[Ca2+]i stimulus-response profile, consisted of measuring baseline calcium at a superfusate PO2 of ∼150 mmHg and the peak [Ca2+]i response to 0, 2, 7, 14, 35 and 70 mmHg PO2. Each 2 min challenge was separated by a 5 min recovery period. The order of challenges was random. For technical reasons (e.g. bubbles in superfusate line) some experiments were terminated before all [Ca2+]i measurements were complete. Of the 77 clusters of cells exposed to this protocol, 73 had [Ca2+]i measured at every challenge level. The remaining four clusters in this protocol had [Ca2+]i measurements at most hypoxia challenge levels.
The elevated extracellular K+ protocol exposed cells to five separate challenge levels, PO2= 0 (with Na2S2O4), PO 2=∼7 mmHg and three levels of elevated extracellular KCl, 10, 20 and 40 mM. Each 2 min challenge was separated by a 5 min recovery period and the order of challenge presentation was random. The rationale for performing the two hypoxia challenges as part of the KCl protocol was to allow comparison of [Ca2+]i responses to hypoxia vs. KCl at each age.
In developmental studies in which Δ[Ca2+]i responses are low, as in cells from immature animals, it is important to demonstrate the ability to measure [Ca2+]i equally well in cells from mature vs. immature rats. We therefore studied responses to the calcium ionophore ionomycin, in clusters of type I cells from near-term fetal (n= 4) and 11- to 14-day-old rats (n= 5). If the cells from immature and mature rats have loaded and de-esterified fura-2 in a similar manner, ionomycin responses should be independent of age. Cells were exposed to 10 μm ionomycin in BSS for approximately 2 min, or until [Ca2+]i reached maximal values for all cells in a field.
Type I cells have a high catecholamine content, and in preliminary studies characteristic type I cell morphology (∼10-15 μm diameter, rounded shape, tendency to occur in clusters) was found to be correlated with the presence of catecholamines, using glyoxylic acid-induced amine fluorescence (Nurse, 1990). In subsequent studies, type I cells were identified on the basis of their characteristic morphology and their occurrence in clusters. Before running each protocol, cell viability was tested by examining for propidium iodide (PI) fluorescence. If cell membrane integrity is compromised, PI binds to nuclear DNA, resulting in fluorescence when the dye is excited at 487 nm and monitored at 645 nm. Cells were eliminated from the study if they showed positive PI fluorescence or baseline shifts in [Ca2+]i greater than 50 nM over the course of the experiment. PI is not fluorescent at the excitation wavelengths used for fura-2 and therefore did not interfere with [Ca2+]i measurements.
Data analysis
We studied only clusters of type I cells, which ranged in size from 2-20 cells. Fluorescence ratio data from each of the clusters in a field were measured separately and treated as an independent observation. The experimental protocol was performed only once per coverslip. Baseline values were calculated as the average [Ca2+]i during the 2 min period prior to a challenge and peak values of [Ca2+]i were the maximum obtained during a 2 min challenge. Δ[Ca2+]i was calculated as peak [Ca2+]i - baseline [Ca2+]i. Values are presented as means ±s.e.m. Responses from each cluster were grouped by age and oxygen level. Non-parametric ANOVA (Kruskal-Wallis) was used to test for a main effect of age on the oxygen response profiles and Dunnet's T3 post hoc test (equal variances not assumed) was used (SPSS release 7.5.1). A P value < 0.05 was considered statistically significant. In order to obtain a rough index of O2 response sensitivity, for each cluster in the graded hypoxia protocol the Δ[Ca2+]i between PO2 values of 35 and 2 mmHg was calculated and expressed as Δ[Ca2+]i (mmHg PO2)−1. The curvilinear O2 response profiles were fitted, using a least-squares approximation method, by the hyperbolic function [Ca2+]i= (a+c) - {(aPO2)/(b+PO2)} (Buckler & Vaughan-Jones, 1994a).
RESULTS
[Ca2+]i response to graded hypoxia: maturation with age
Graded [Ca2+]i responses of clusters of type I cells were measured in 10, 18, 8, 7, 9, 9 and 16 clusters at near-term fetal, 1, 3, 7, 11, 14 and 21 days, respectively. Figure 1A shows the typical graded [Ca2+]i response of a cluster of type I cells from near-term fetal rats. The response to hypoxia was an increase in [Ca2+]i, beginning within seconds of the drop in chamber PO2, the magnitude of which was graded to the intensity of the stimulus. Figure 1B illustrates the [Ca2+]i response of a cluster of type I cells from 14-day-old rats, which are representative of mature type I cell responses. As noted above, the [Ca2+]i responses of the cluster were graded in proportion to the intensity of the hypoxic stimulus, but were much larger in amplitude compared with those of young rats.
Figure 1. Effects of hypoxia on [Ca2+]i in rat type I cells.
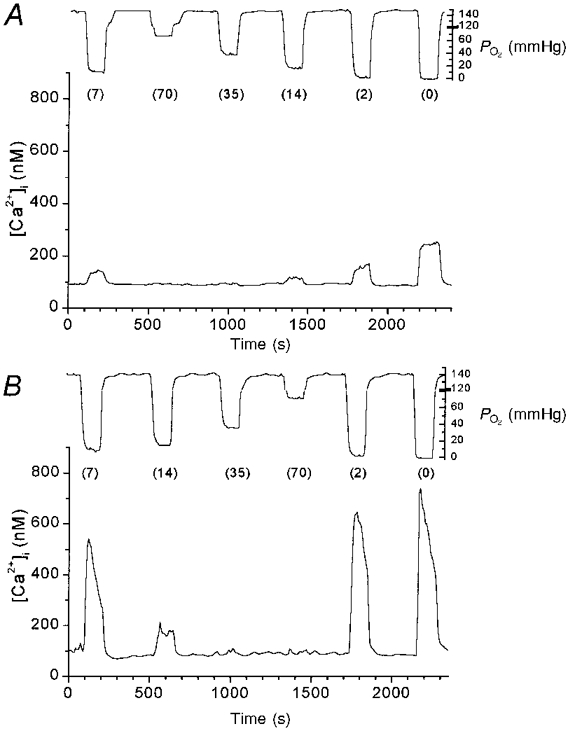
Tracings showing [Ca2+]ivs. time during 2 experimental runs in type I cell clusters from near-term fetal rats (A) and 14-day-old rats (B). Each line represents [Ca2+]i measurements from one cluster of type I cells. The tracing from the superfusate PO2 electrode is shown above each graph. Numbers in parentheses are superfusate PO2 (in mmHg).
[Ca2+]i response to graded hypoxia: development of PO2 response profile with age
The profile of mean peak [Ca2+]i responses for all seven O2 levels and all seven age groups is shown in Fig. 2. The shape of the PO2-[Ca2+]i stimulus-response curve was roughly hyperbolic at all ages. Although there was variability among clusters, in general there were small but significant [Ca2+]i responses even to superfusate PO2 levels between 35 and 70 mmHg, with [Ca2+]i rising steeply at PO2 levels < 15 mmHg. ANOVA showed that Δ[Ca2+]i responses to PO2 levels of ∼0, 2, 7 and 14 mmHg were statistically significantly greater at 11 and 14 days compared with near-term fetal, 1 and 3 days (P < 0.005 for PO2 levels of ∼0 and 2 mmHg, P < 0.05 for PO2 levels of ∼7 and 14 mmHg). At 21 days, the Δ[Ca2+]i responses to PO2 levels of ∼0, 2 and 7 mmHg were statistically significantly greater than in clusters from near-term fetal and 1-day-old rats (P < 0.05).
Figure 2. Response to graded hypoxia during development.
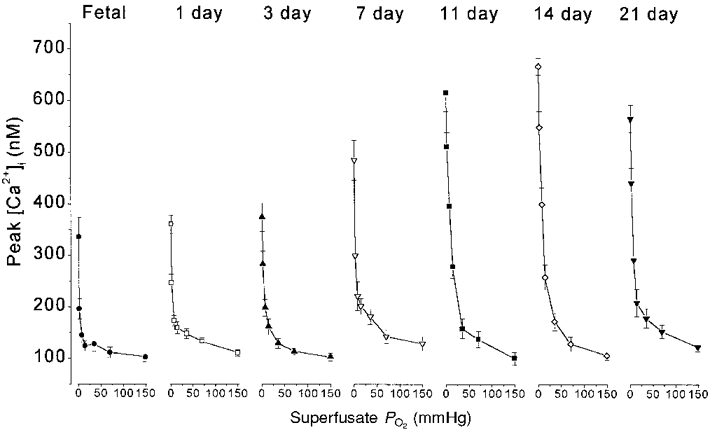
Mean [Ca2+]i response to graded hypoxia at each age studied. Each point represents the mean ±s.e.m. of peak [Ca2+]i values for a given superfusate PO2.
In clusters of cells from the youngest rats, the response to anoxia with Na2S2O4 accounted for a large proportion of the overall response from PO2 levels of 150-0 mmHg. In near-term fetal and 1-day-old rats the response to anoxia was approximately double the [Ca2+]i response to 2 mmHg (Fig. 2). In contrast, by 11-21 days the additional rise in [Ca2+]i caused by anoxia, above the response to 2 mmHg, accounted for only ∼20 % of the overall response curve. Thus, developmental increases in [Ca2+]i responses tended to be greater for submaximal stimuli.
The most striking developmental changes in [Ca2+]i response amplitude occurred in the range of superfusate PO2 levels between 2 and 35 mmHg. This is illustrated in Fig. 3, which shows Δ[Ca2+]i responses in this range. Type I cells from near-term fetal and 1-day-old rats showed a slight gradation of responses in this range to graded stimuli (Fig. 3A). By 3 to 7 days Δ[Ca2+]i responses were more hyperbolic but still low amplitude (Fig. 3B). The largest developmental increase in the response to submaximal hypoxic stimulation occurred between 3-7 days and 11-21 days (Fig. 3C).
Figure 3. Δ[Ca2+]i for PO2 levels between ≈2 and ≈35 mmHg vs. age.
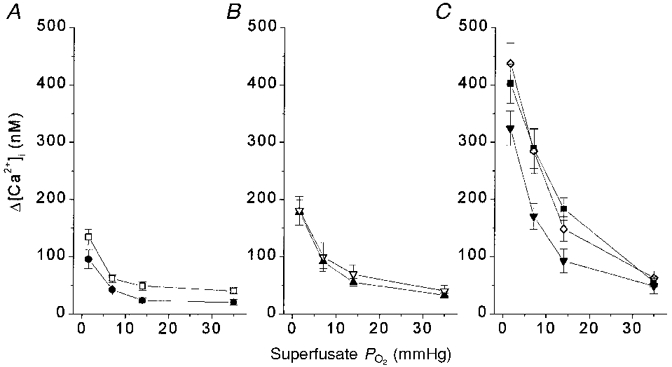
Δ[Ca2+]i responses to hypoxia challenge at PO2 levels of ≈2, 7, 14 and 35 mmHg at all 7 ages. A: •, fetal; □, 1 day. B: ▴, 3 days; ▿, 7 days. C:▪, 11 days; ⋄, 14 days; ▾, 21 days. Δ[Ca2+]i values at the lowest PO2 shown (≈2 mmHg) were not different between 11 and 21 days, but all were significantly greater than the corresponding responses at younger ages. With less hypoxic superfusate PO2 levels, ANOVA detected fewer significant changes with age. n= 10, 18, 8, 7, 9, 9 and 16 clusters at near-term fetal, 1, 3, 7, 11, 14 and 21 days, respectively.
Development of type I cell O2 sensitivity
In order to obtain a rough index of hypoxic sensitivity at each age, the Δ[Ca2+]i between ∼35 and 2 mmHg was calculated for each cluster of type I cells and expressed as Δ[Ca2+]i (mmHg PO2)−1. Figure 4 shows mean Δ[Ca2+]i (mmHg PO2)−1 levels from 2 to 35 mmHg vs. age. By this measure of hypoxic sensitivity, there was no change between near-term fetal and 7 days, a large increase between 7 and 11 days, and no further change thereafter. The increase in sensitivity, using this index, was ∼5-fold between near-term fetal and 11-14 days of age. Hypoxic sensitivity appeared to decrease slightly after 14 days; at 21 days, sensitivity remained statistically significantly greater than at near-term fetal and 1 day, but was no longer different from 3 and 7 days (Fig. 4).
Figure 4. Change in type I cell O2‘sensitivity’ with age.
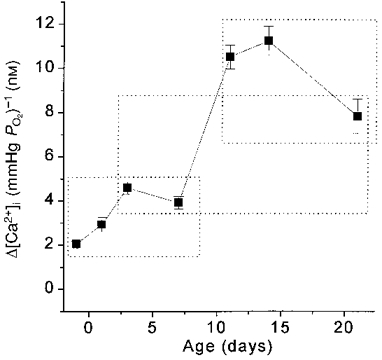
Mean Δ[Ca2+]i (mmHg PO2)−1 from 2 to 35 mmHg for each age group. Values enclosed within a dotted box were not significantly different.
In order to facilitate comparison with published data on the development of rat carotid chemoreceptor neural responses to hypoxia (Kholwadwala & Donnelly, 1992), data were pooled within the age groups fetal-1 day, 3-7 days, and 11-21 days. [Ca2+]i responses to maximal stimulation (anoxia) as well as submaximal stimulation showed statistically significant increases with age. Thus, with increasing age, there was not only an increase in the maximum [Ca2+]i response to anoxia, but a ‘rightward’ shift in the O2 response curve. Figure 5 shows the data fitted with the hyperbolic function [Ca2+]i= (a+c) - {(aPO2)/(b+PO2)}. As indicated by the arrows, the PO2 at half-maximal [Ca2+]i response shifted towards the right, from ∼1 mmHg in the near-term fetal-1 day group to ∼6 mmHg in the 11-21 day group. In summary, type I cell O2 sensitivity is present but low in rats between near-term fetal and 1 day old, starts to increase after 3 days, and is maximal by 11-14 days of age.
Figure 5. Rightward shift in the submaximal portion of the O2 response profile with age in pooled age groups.
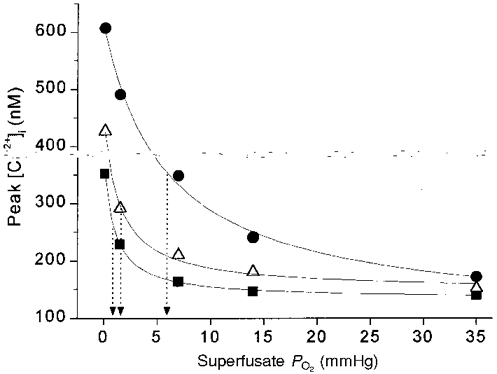
Mean peak [Ca2+]i responses of carotid chemoreceptor cells from 3 age groups, plotted vs. superfusate PO2. ▪, fetal-1 day (n= 28 clusters); ▵, 3-7 days (n= 15 clusters); •, 11-21 days (n= 34 clusters). Data in each age group fitted with hyperbolic function [Ca2+]i= (a + c) - {(aPO2)/(b+PO2)} using the least-squares method. Arrows indicate superfusate PO2 at half-maximal [Ca2+]i response (b value in hyperbolic function).
Development of type I cell response to elevated extracellular K+
If the developmental rise in type I cell O2 sensitivity were entirely due to an age-related increase in Ca2+ entry for a given degree of cell membrane depolarization, then developmental changes in the response to elevated extracellular K+ should parallel those observed for hypoxia. We therefore measured [Ca2+]i responses to 10, 20 and 40 mM KCl and, in the same clusters of cells, the [Ca2+]i responses to anoxia (PO2= 0, with Na2S2O4) and hypoxia (PO2= 7 mmHg). Using this protocol, 9, 9, 9, 11, 13, 12, and 19 clusters were studied at ages near-term fetal, 1, 3, 7, 11, 14 and 21 days, respectively. This allowed comparison, during peri- and postnatal development, of [Ca2+]i responses to hypoxia and KCl on the same type I cell clusters. Figure 6 illustrates a typical [Ca2+]i response of a cluster of type I cells from near-term fetal rats to graded KCl challenge and to anoxia.
Figure 6. Typical type I cell responses to elevated extracellular K+.
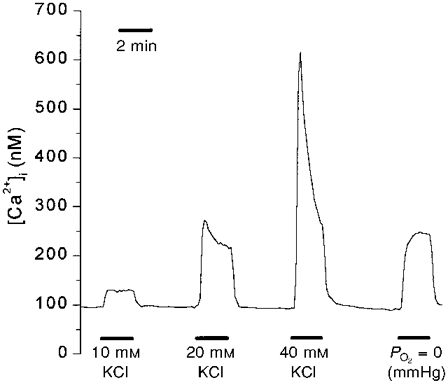
The line represents mean [Ca2+]i values for one cluster of type I cells from near-term fetal rats.
Type I cells at all ages responded to elevated extracellular K+ with a rise in intracellular calcium. Figure 7 shows the maturational Δ[Ca2+]i response profiles to 10, 20 and 40 mM KCl. At all these levels of KCl stimulation, the Δ[Ca2+]i response showed no statistically significant change between near-term fetal and 21 days.
Figure 7. Development of Δ[Ca2+]i responses to elevated extracellular K+.
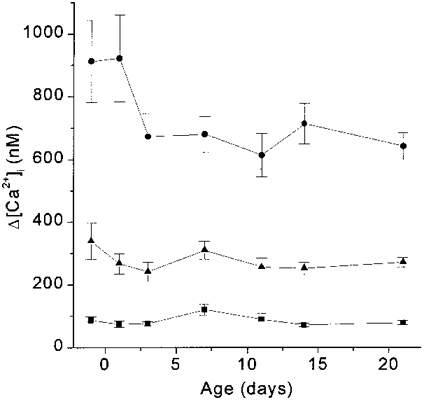
Δ[Ca2+]i responses to 10 mM KCl (▪), 20 mM KCl (▴) and 40 mM KCl (•). ANOVA revealed no statistically significant differences with age in the [Ca2+]i response to any concentration of KCl.
In striking contrast, as shown in Fig. 8, Δ[Ca2+]i responses to anoxia and hypoxia, measured in the same clusters of cells, exhibited a large developmental increase between 3 and 11-21 days. Thus, between near-term fetal and 11-21 days of age, type I cell Δ[Ca2+]i responses to anoxia and hypoxia demonstrated large age-dependent increases in O2 sensitivity whereas responses to KCl did not change significantly.
Figure 8. Maturation of [Ca2+]i response to hypoxia vs. KCl.
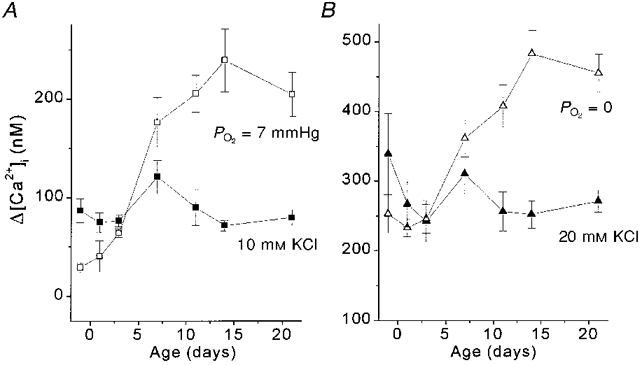
Δ[Ca2+]i responses to 10 and 20 mM KCl are shown with [Ca2+]i responses to hypoxia occurring in the same range. A, the Δ[Ca2+]i response to hypoxia (7 mmHg) (□) significantly increased ≈3-fold between 3 and 11 days (P < 0.001), while the response to 10 mM KCl did not change with age (▪). B,Δ[Ca2+]i response to PO2= 0 mmHg (with Na2S2O4; ▵) doubled between 3 and 14 days (P < 0.001) while the Δ[Ca2+]i response to 20 mM KCl (▴) did not change significantly with age by ANOVA.
In the near-term fetal to 3-day-old age groups, the largest mean Δ[Ca2+]i responses elicited even by anoxia (maximal low O2 stimulation) were in the range of ∼250 nM (Fig. 8B). However, Δ[Ca2+]i responses to 40 mM KCl during the same developmental timeframe were ∼670-920 nM. These response amplitudes elicited by 40 mM KCl were ∼3 times larger than those elicited by maximal anoxic stimulation, indicating that the cells were capable of mounting a much larger Δ[Ca2+]i than they exhibited in response to anoxia.
Type I cell responses to ionomycin
When challenged with 10 μm ionomycin, type I cell Δ[Ca2+]i responses were 2735 ± 192 nM in near-term fetal and 3256 ± 220 nM in 11- to 14-day-old cells (n.s.). This indicates that, under the conditions of study, observed differences were not due to age-related differences in the ability to measure or mobilize large amounts of [Ca2+]i.
DISCUSSION
This is the first study to examine perinatal resetting and postnatal maturation of O2 sensitivity in carotid chemoreceptor type I cells. The results demonstrate that type I cells from rats of all ages show graded [Ca2+]i responses to graded hypoxia, with a hyperbolic response profile that is typical of whole organ responses to hypoxia. Intracellular calcium responses to hypoxia, which are present but of low amplitude in the near-term fetus and newborn, increase ∼3- to 4-fold after birth and reach apparent maturity by approximately 2 weeks of age in rats. In addition to an increase in O2 sensitivity with age, the maximal [Ca2+]i response to anoxia increases more than 2-fold between the day before birth and 2-3 weeks after birth. In contrast, during the timeframe of the largest developmental increase in O2 sensitivity, from 1 to 11 days of age, type I cell [Ca2+]i responses to elevated extracellular K+ did not change with age. These results demonstrate large developmental changes in type I cell function that involve steps in the O2-sensing process other than voltage-gated Ca2+ influx.
Methodological issues
Previous studies using ‘neonatal’ rats actually studied rats between 8 and 18 days old. This is quite mature and well out of the newborn period for this rapidly maturing species. Kholwadwala & Donnelly (1992) and Donnelly & Doyle (1994) found large developmental changes in rat carotid chemoreceptor responsiveness occurring between 6 and 14 days. Therefore, although previous studies described [Ca2+]i responses in type I cells harvested from ‘neonatal’ rats, these studies did not address the question of type I cell maturation. In addition, differences in the properties of type I cells from immature vs. adult animals have been reported from different laboratories (Gonzalez et al. 1994; Lopez-Lopez et al. 1997). However, variations in methodology make it difficult to draw inferences concerning maturation of type I cells from differently aged animals studied in different laboratories.
Biscoe and colleagues described the first type I cell [Ca2+]i measurements using calcium-sensitive fluorescent probes (Biscoe et al. 1989) and were the first to report type I cell O2-[Ca2+]i stimulus-response curves (Biscoe & Duchen, 1990). Numerous studies since then have demonstrated that type I cells raise [Ca2+]i in response to hypoxia, CO2 and acid, in a manner that is graded to the intensity of the stimulus and similar to CSN neural responses of the whole carotid body (Buckler & Vaughan-Jones, 1993, 1994a,b;Sato, 1994; Montoro et al. 1996). Thus, the use of [Ca2+]i as a marker for type I cell function is well established and widely accepted, providing an ideal approach for studying type I cell sensitivity during peri- and postnatal maturation.
We only studied cells in clusters and did not measure responses of single isolated cells. In other studies (not shown) we have measured [Ca2+]i in single isolated type I cells and found responses to graded hypoxia to be similar to those described here. However, the electrophysiological characteristics of clustered vs. single isolated type I cells are different (Pang & Eyzaguirre, 1992). Therefore, we elected to study only clusters rather than to mix two populations of type I cells that potentially may behave differently.
Relationship of type I cell [Ca2+]i response development to carotid body maturation
In every species studied, carotid chemoreceptor neural responses to hypoxia are undetectable or minimal just after birth and increase during postnatal development (Biscoe & Purves, 1967; Blanco et al. 1984; Mulligan, 1991; Kholwadwala & Donnelly, 1992; Marchal et al. 1992; Carroll et al. 1993; Donnelly & Doyle, 1994). If development of type I cell O2 sensitivity plays a major role in overall carotid chemoreceptor maturation, then the maturational time course of the two should be similar. The only study to date in rats, by Kholwadwala & Donnelly, used the in vitro superfused preparation to measure carotid chemoreceptor O2 sensitivity from 1 to 30 days of age (Kholwadwala & Donnelly, 1992). Specifically, they studied carotid body neural responses to anoxia in rats aged 1-2, 4-7, 10-15 and 25-30 days. They reported that the increase in CSN activity during anoxia was significantly greater in the two older age groups compared with the two immature age groups (Kholwadwala & Donnelly, 1992). Thus, they determined that maturation of carotid chemoreceptor neural responses to severe hypoxia in the rat occurs mainly between 4-7 and 10-15 days and did not change thereafter. Our observations on the time course of type I cell O2 sensitivity closely agree with those of Kholwadwala & Donnelly in that most of the developmental changes in rat [Ca2+]i responses to hypoxia occurred between 3-7 and 11-14 days. This is consistent with the hypothesis that maturation of carotid chemoreceptor O2 sensitivity occurs primarily at the level of the type I cell.
Relationship between [Ca2+]i and oxygen tension
All studies to date examining the relationship between [Ca2+]i and superfusate PO2 over the ∼150 to 0 mmHg range have found a hyperbolic O2 response profile similar to that of the whole carotid body (Biscoe & Duchen, 1990; Buckler & Vaughan-Jones, 1994a). Biscoe & Duchen (1990), who studied whole type I cell clusters from adult rabbits, found that [Ca2+]i responses could be seen when PO2 was lowered below ∼30-50 mmHg, rising sharply with PO2 levels less than 20 mmHg. Buckler & Vaughan-Jones (1994a), studying type I cells from 8- to 14-day-old rats, also found a sharp ‘take-off’ of the hyperbolic [Ca2+]i response starting well below ∼20 mmHg superfusate PO2 levels. Our observations using graded hypoxia in the 11- to 14-day-old group agree closely with the above findings, with type I cell [Ca2+]i responses increasing somewhat at a PO2 level of ∼15 mmHg and increasing steeply at PO2 levels less than 10 mmHg (Figs 2 and 3).
The O2 response curve for type I cell [Ca2+]i is left-shifted compared with the intact carotid body. This is likely to be due to the fact that microvascular PO2, which should approximate tissue PO2 at the cellular level, is substantially lower than arterial PO2 (Rumsey et al. 1991). Rumsey et al. (1991) used oxygen-dependent quenching of phosphorescence to measure microvascular PO2 in cat carotid body (perfused/superfused preparation) while simultaneously recording from the carotid sinus nerve. They found that cat carotid body chemosensory activity starts to rise when microvascular PO2 falls below ∼20 mmHg and takes off steeply when PO2 falls below ∼10 mmHg (Rumsey et al. 1991), which is strikingly similar to the behaviour of [Ca2+]i in type I cells from rat and rabbit.
Development of type I cell function
Type I cell [Ca2+]i response O2 sensitivity could increase with maturation by several mechanisms. Hypoxia causes type I cells to depolarize, leading to Ca2+ influx via voltage-gated calcium channels. However, the mechanism by which type I cells sense O2 and how the ‘O2 sensor’ is linked to cell membrane depolarization is controversial. The major theories of type I cell chemoreception suggest that O2 is sensed by one or several O2-sensitive K+ channels, or by a haem-like chromophore (Wilson et al. 1994; Acker, 1994; Prabhakar et al. 1995) or linked to type I cell metabolism (Duchen & Biscoe, 1992a,b).
Peri- and postnatal development of type I cell [Ca2+]i responses to O2 could occur at several levels of the O2 transduction process. At present only speculation is possible since the importance of many of the components of the [Ca2+]i response is unknown and virtually nothing is known about their relative importance during maturation. However, examination of the developmental profile of type I cell O2 sensitivity may prove valuable. Two aspects of the response were affected: the maximum [Ca2+]i response to anoxia increased with age (Fig. 2) and the O2 response curve shifted to the right (increased sensitivity) with maturation (Figs 3 and 5). Major possible explanations for these observations include (1) that Ca2+ influx for a given degree of depolarization increased with age, (2) that the sensitivity of the O2 sensor increased with age, or (3) other aspects of the response (such as facilitation of depolarization, calcium sequestration, release from intracellular stores, proportion of calcium channel subtypes or calcium extrusion mechanisms) changed with age.
Our observations on [Ca2+]i responses to elevated extracellular K+ suggest that a developmental increase in Ca2+ mobilization for a given degree of depolarization is not likely to account for the maturation of type I cell O2 sensitivity. Most of the maturational increase in Δ[Ca2+]i response to hypoxia occurred during a timeframe when there were no significant changes in the Δ[Ca2+]i response to 10, 20 or 40 mM KCl. If the elevated extracellular K+ is viewed as a ‘non-specific’ depolarization stimulus that does not change with age, then our data suggest that between near-term fetal and 21 days the amount of Ca2+ rise for a given degree of depolarization is little affected by age. Thus, developmental theories such as an age-related change in Ca2+ channel density or relative proportion of Ca2+ channel types would not appear to explain our observations. This is consistent with the work of Hatton and colleagues who found no differences in Ca2+ current density of type I cells from 4-day-old vs. 10-day-old rats (Hatton et al. 1997).
If the Ca2+ rise for a given degree of depolarization does not change with age then perhaps, with age, there is a greater degree of type I cell depolarization for a given level of hypoxia challenge. If so, our observations could be explained, at least in part, by a maturational increase in sensitivity of the O2 sensor or its link with membrane potential. The [Ca2+]i response of type I cells from fetal and newborn rats to anoxia (maximal low-O2 stimulus) was not maximal. The same cells at these ages were capable of mounting an [Ca2+]i response to 40 mM KCl that was nearly 3-fold greater than the response to anoxia (Figs 7 and 8). Thus it is possible that anoxia simply produced less depolarization in fetal and newborn type I cells compared with cells from 11- to 21-day-old rats.
Type I cells possess a variety of hypoxia-sensitive voltage-dependent K+ channels (maxi-K, KO2 channels) (Delpiano & Hescheler, 1989; Lopez-Lopez et al. 1989; Peers, 1990; Stea & Nurse, 1991; Ganfornina & Lopez-Barneo, 1992), as well as a recently reported hypoxia-sensitive background K+ conductance (Buckler, 1997). The pattern of developmental change in O2 sensitivity we observed could be explained by a maturational increase in hypoxia-sensitive K+ channels responsible for the depolarization response. In this regard, it is interesting that Hatton and colleagues demonstrated that rat type I cell K+ current amplitude and density increases between 4 and 10 days, and between 10 days and adult (Hatton et al. 1997). More importantly, hypoxic inhibition of the K+ currents described by Hatton et al. (1997) was minimal in type I cells from 4-day-old rats, increased significantly between 4 and 10 days, and did not significantly increase between 10 days and adult. If these K+ currents play a significant role in type I cell depolarization, then the postnatal increase in K+ channel hypoxia sensitivity may be involved in the age-dependent changes we observed in [Ca2+]i responses to hypoxia.
The O2 sensitivity of the hypoxia-sensitive background K+ conductance described by Buckler (1997) could also increase with age. Our observations in the 11 day age group provide a full type I cell [Ca2+]i response curve to O2, from PO2 levels of ∼150 to 0 mmHg in nine cell clusters, using superfusate solutions (bicarbonate buffered and 5 % CO2 equilibrated), cell preparation methods (in the same species), and ages that are essentially identical to those used by Buckler (1997). As shown in Fig. 9, the type I cell O2-[Ca2+]i stimulus- response profile from our 11-day-old rats is remarkably similar to the O2 response profile of a K+ leak current in type I cells from similar age rats recently described by Buckler (1997). This K+ current is present at resting membrane potential in rat type I cells and inhibited, in a graded manner by graded hypoxia, with a K½ of about 12 mmHg. Hypoxia may depolarize type I cells mainly by inhibiting this K+ conductance (Buckler, 1997). Our type I cell [Ca2+]i response curve for the same age rats is remarkably similar, with a K½ of 9.3 mmHg. Whether the O2 response profile of this K+ current depends on the level of postnatal maturity has not been reported.
Figure 9. [Ca2+]i response to hypoxia in 11 day group.
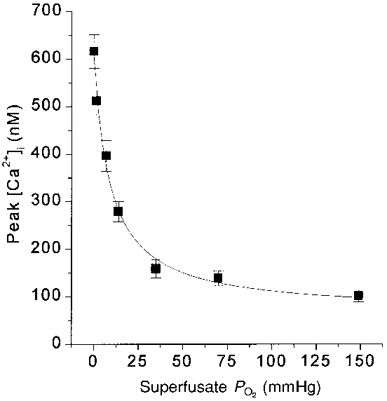
Each point represents mean of peak [Ca2+]i values for all clusters at a PO2 level. n= 9 clusters. PO2 at half-maximal Δ[Ca2+]i response was 9.3 mmHg. Curve fit as in Fig. 5.
Our data on the time course of type I cell [Ca2+]i response maturation agrees with the findings of Donnelly & Doyle (1994). They found that, similar to the time course for carotid sinus nerve activity, baseline and hypoxia-stimulated carotid body catecholamine levels were low within the first few days after birth, but increased to nearly adult levels by ∼10 days of age, with no further significant increase thereafter (Donnelly & Doyle, 1994). As a rise in [Ca2+]i is believed to be a crucial step in type I cell neurotransmitter release, it is noteworthy that our developmental profile for peak or Δ[Ca2+]i responses to anoxia and severe hypoxia is similar to the time course of catecholamine secretion development, increasing until about 11-14 days and not thereafter (Figs 2, 3 and 8).
Conclusions
In summary, this study provides evidence that rat type I cell O2 sensitivity is low around the time of birth and increases during postnatal development, primarily between 3 and 11 days of age. The time course of type I cell O2 sensitivity maturation matches the known time course of rat carotid body hypoxic chemosensitivity and hypoxia-stimulated catecholamine secretion, consistent with a major role for type I cell maturation in overall carotid body development. The developmental increase in type I cell O2 sensitivity appears to involve mechanisms related to O2 sensing, rather than a non-specific increase in the [Ca2+]i rise during depolarization.
Acknowledgments
We wish to thank Dr D. Donnelly for his valuable comments and suggestions. This work was supported by grant HL54621-01 from the National Institutes of Health, Heart, Lung and Blood Institute.
References
- Acker H. Mechanisms and meaning of cellular oxygen sensing in the organism. Respiration Physiology. 1994;95:1–10. doi: 10.1016/0034-5687(94)90043-4. 10.1016/0034-5687(94)90043-4. [DOI] [PubMed] [Google Scholar]
- Biscoe TJ, Duchen MR. Responses of type I cells dissociated from the rabbit carotid body to hypoxia. The Journal of Physiology. 1990;428:39–59. doi: 10.1113/jphysiol.1990.sp018199. [DOI] [PMC free article] [PubMed] [Google Scholar]
- Biscoe TJ, Duchen MR, Eisner DA, O'Neill SC, Valdeolmillos M. Measurements of intracellular Ca2+ in dissociated type I cells of the rabbit carotid body. The Journal of Physiology. 1989;416:421–434. doi: 10.1113/jphysiol.1989.sp017769. [DOI] [PMC free article] [PubMed] [Google Scholar]
- Biscoe TJ, Purves MJ. Carotid body chemoreceptor activity in the new-born lamb. The Journal of Physiology. 1967;190:443–454. doi: 10.1113/jphysiol.1967.sp008220. [DOI] [PMC free article] [PubMed] [Google Scholar]
- Blanco CE, Dawes GS, Hanson MA, McCooke HB. The response to hypoxia of arterial chemoreceptors in fetal sheep and new-born lambs. The Journal of Physiology. 1984;351:25–37. doi: 10.1113/jphysiol.1984.sp015229. [DOI] [PMC free article] [PubMed] [Google Scholar]
- Blanco CE, Hanson MA, McCooke HB. Effects on carotid chemoreceptor resetting of pulmonary ventilation in the fetal lamb in utero. Journal of Developmental Physiology. 1988;10:167–174. [PubMed] [Google Scholar]
- Buckler KJ. A novel oxygen-sensitive potassium current in rat carotid body type I cells. The Journal of Physiology. 1997;498:649–662. doi: 10.1113/jphysiol.1997.sp021890. [DOI] [PMC free article] [PubMed] [Google Scholar]
- Buckler KJ, Vaughan-Jones RD. Effects of acidic stimuli on intracellular calcium in isolated type I cells of the neonatal rat carotid body. Pflügers Archiv. 1993;425:22–27. doi: 10.1007/BF00374499. [DOI] [PubMed] [Google Scholar]
- Buckler KJ, Vaughan-Jones RD. Effects of hypoxia on membrane potential and intracellular calcium in rat neonatal carotid body type I cells. The Journal of Physiology. 1994a;476:423–428. doi: 10.1113/jphysiol.1994.sp020143. [DOI] [PMC free article] [PubMed] [Google Scholar]
- Buckler KJ, Vaughan-Jones RD. Effects of hypercapnia on membrane potential and intracellular calcium in rat carotid body type I cells. The Journal of Physiology. 1994b;478:157–171. doi: 10.1113/jphysiol.1994.sp020239. [DOI] [PMC free article] [PubMed] [Google Scholar]
- Bureau MA, Lamarche J, Foulon P, Dalle D. Postnatal maturation of respiration in intact and carotid body- chemodenervated lambs. Journal of Applied Physiology. 1985;59:869–874. doi: 10.1152/jappl.1985.59.3.869. [DOI] [PubMed] [Google Scholar]
- Carroll JL, Bamford OS, Fitzgerald RS. Postnatal maturation of carotid chemoreceptor responses to O2 and CO2 in the cat. Journal of Applied Physiology. 1993;75:2383–2391. doi: 10.1152/jappl.1993.75.6.2383. [DOI] [PubMed] [Google Scholar]
- Cote A, Porras H, Meehan B. Age-dependent vulnerability to carotid chemodenervation in piglets. Journal of Applied Physiology. 1996;80:323–331. doi: 10.1152/jappl.1996.80.1.323. [DOI] [PubMed] [Google Scholar]
- Delpiano MA, Hescheler J. Evidence for a PO2-sensitive K+ channel in the type-I cell of the rabbit carotid body. FEBS Letters. 1989;249:195–198. doi: 10.1016/0014-5793(89)80623-4. [DOI] [PubMed] [Google Scholar]
- Donnelly DF, Doyle TP. Developmental changes in hypoxia-induced catecholamine release from rat carotid body, in vitro. The Journal of Physiology. 1994;475:267–275. doi: 10.1113/jphysiol.1994.sp020067. [DOI] [PMC free article] [PubMed] [Google Scholar]
- Donnelly DF, Haddad GG. Prolonged apnea and impaired survival in piglets after sinus and aortic nerve section. Journal of Applied Physiology. 1990;68:1048–1052. doi: 10.1152/jappl.1990.68.3.1048. [DOI] [PubMed] [Google Scholar]
- Duchen MR, Biscoe TJ. Mitochondrial function in type I cells isolated from rabbit arterial chemoreceptors. The Journal of Physiology. 1992a;450:13–31. doi: 10.1113/jphysiol.1992.sp019114. [DOI] [PMC free article] [PubMed] [Google Scholar]
- Duchen MR, Biscoe TJ. Relative mitochondrial membrane potential and [Ca2+]i in type I cells isolated from the rabbit carotid body. The Journal of Physiology. 1992b;450:33–61. doi: 10.1113/jphysiol.1992.sp019115. [DOI] [PMC free article] [PubMed] [Google Scholar]
- Ganfornina MD, Lopez-Barneo J. Potassium channel types in arterial chemoreceptor cells and their selective modulation by oxygen. Journal of General Physiology. 1992;100:401–426. doi: 10.1085/jgp.100.3.401. [DOI] [PMC free article] [PubMed] [Google Scholar]
- Gonzalez C, Almaraz L, Obeso A, Rigual R. Carotid body chemoreceptors: from natural stimuli to sensory discharges. Physiological Reviews. 1994;74:829–898. doi: 10.1152/physrev.1994.74.4.829. [DOI] [PubMed] [Google Scholar]
- Grynkiewicz G, Poenie M, Tsien RY. A new generation of Ca2+ indicators with greatly improved fluorescence properties. Journal of Biological Chemistry. 1985;260:3440–3450. [PubMed] [Google Scholar]
- Hatton CJ, Carpenter E, Pepper DR, Kumar P, Peers C. Developmental changes in isolated rat type I carotid body cell K+ currents and their modulation by hypoxia. The Journal of Physiology. 1997;501:49–58. doi: 10.1111/j.1469-7793.1997.049bo.x. [DOI] [PMC free article] [PubMed] [Google Scholar]
- Hudlicka O, Brown MD. Postnatal growth of the heart and its blood vessels. Journal of Vascular Research. 1996;33:266–287. doi: 10.1159/000159155. [DOI] [PubMed] [Google Scholar]
- Kholwadwala D, Donnelly DF. Maturation of carotid chemoreceptor sensitivity to hypoxia: in vitro studies in the newborn rat. The Journal of Physiology. 1992;453:461–473. doi: 10.1113/jphysiol.1992.sp019239. [DOI] [PMC free article] [PubMed] [Google Scholar]
- Kumar P, Hanson MA. Re-setting of the hypoxic sensitivity of aortic chemoreceptors in the new-born lamb. Journal of Developmental Physiology. 1989;11:199–206. [PubMed] [Google Scholar]
- Lopez-Lopez J, Gonzalez C, Urena J, Lopez-Barneo J. Low pO2 selectively inhibits K channel activity in chemoreceptor cells of the mammalian carotid body. Journal of General Physiology. 1989;93:1001–1015. doi: 10.1085/jgp.93.5.1001. [DOI] [PMC free article] [PubMed] [Google Scholar]
- Lopez-Lopez JR, Gonzalez C, Perez-Garcia MT. Properties of ionic currents from isolated adult rat carotid body chemoreceptor cells: effect of hypoxia. The Journal of Physiology. 1997;499:429–441. doi: 10.1113/jphysiol.1997.sp021939. [DOI] [PMC free article] [PubMed] [Google Scholar]
- Marchal F, Bairam A, Haouzi P, Crance JP, Di Giulio C, Vert P, Lahiri S. Carotid chemoreceptor response to natural stimuli in the newborn kitten. Respiration Physiology. 1992;87:183–193. doi: 10.1016/0034-5687(92)90058-5. [DOI] [PubMed] [Google Scholar]
- Marshall JM. Analysis of cardiovascular responses evoked following changes in peripheral chemoreceptor activity in the rat. The Journal of Physiology. 1987;394:393–414. doi: 10.1113/jphysiol.1987.sp016877. [DOI] [PMC free article] [PubMed] [Google Scholar]
- Montoro RJ, Urena J, Fernandez-Chacon R, Alvarez de Toledo G, Lopez-Barneo J. Oxygen sensing by ion channels and chemotransduction in single glomus cells. Journal of General Physiology. 1996;107:133–143. doi: 10.1085/jgp.107.1.133. [DOI] [PMC free article] [PubMed] [Google Scholar]
- Mulligan EM. Discharge properties of carotid bodies: Developmental aspects. In: Haddad GG, Farber JP, editors. Developmental Neurobiology of Breathing. New York: Marcel Dekker; 1991. pp. 321–340. [Google Scholar]
- Nurse CA. Carbonic anhydrase and neuronal enzymes in cultured glomus cells of the carotid body of the rat. Cell and Tissue Research. 1990;261:65–71. doi: 10.1007/BF00329439. [DOI] [PubMed] [Google Scholar]
- Nyakas C, Buwalda B, Luiten PG. Hypoxia and brain development. Progress in Neurobiology. 1996;49:1–51. doi: 10.1016/0301-0082(96)00007-x. [DOI] [PubMed] [Google Scholar]
- Okubo S, Mortola JP. Long-term respiratory effects of neonatal hypoxia in the rat. Journal of Applied Physiology. 1988;64:952–958. doi: 10.1152/jappl.1988.64.3.952. [DOI] [PubMed] [Google Scholar]
- Pang L, Eyzaguirre C. Different effects of hypoxia on the membrane potential and input resistance of isolated and clustered carotid body glomus cells. Brain Research. 1992;575:167–173. doi: 10.1016/0006-8993(92)90440-k. [DOI] [PubMed] [Google Scholar]
- Peers C. Hypoxic suppression of K+ currents in type I carotid body cells: selective effect on the Ca2+-activated K+ current. Neuroscience Letters. 1990;119:253–256. doi: 10.1016/0304-3940(90)90846-2. [DOI] [PubMed] [Google Scholar]
- Prabhakar NR, Dinerman JL, Agani FH, Snyder SH. Carbon monoxide: a role in carotid body chemoreception. Proceedings of the National Academy of Sciences of the USA. 1995;92:1994–1997. doi: 10.1073/pnas.92.6.1994. [DOI] [PMC free article] [PubMed] [Google Scholar]
- Rumsey WL, Iturriaga R, Spergel D, Lahiri S, Wilson DF. Optical measurements of the dependence of chemoreception on oxygen pressure in the cat carotid body. American Journal of Physiology. 1991;261:C614–622. doi: 10.1152/ajpcell.1991.261.4.C614. [DOI] [PubMed] [Google Scholar]
- Sato M. Effects of CO2, acetate and lowering extracellular pH on cytosolic Ca2+ and pH in cultured glomus cells of the newborn rabbit carotid body. Neuroscience Letters. 1994;173:159–162. doi: 10.1016/0304-3940(94)90173-2. [DOI] [PubMed] [Google Scholar]
- Stea A, Nurse CA. Whole-cell and perforated-patch recordings from O2-sensitive rat carotid body cells grown in short- and long-term culture. Pflügers Archiv. 1991;418:93–101. doi: 10.1007/BF00370457. [DOI] [PubMed] [Google Scholar]
- Sterni LM, Bamford OS, Tomares SM, Montrose MH, Carroll JL. Developmental changes in intracellular Ca2+ response of carotid chemoreceptor cells to hypoxia. American Journal of Physiology. 1995;268:L801–808. doi: 10.1152/ajplung.1995.268.5.L801. [DOI] [PubMed] [Google Scholar]
- Wilson DF, Mokashi A, Chugh D, Vinogradov S, Osanai S, Lahiri S. The primary oxygen sensor of the cat carotid body is cytochrome a3 of the mitochondrial respiratory chain. FEBS Letters. 1994;351:370–374. doi: 10.1016/0014-5793(94)00887-6. [DOI] [PubMed] [Google Scholar]


