

Abstract
When intracellular recordings were made from the antral region of guinea-pig stomach, cells with different patterns of electrical activity were detected.
One group of cells, slow-wave cells, generated slow waves which consisted of initial and secondary components. When filled with either Lucifer Yellow or neurobiotin, the cells identified as smooth muscle cells lying in the circular muscle layer.
A second group of cells, driving cells, generated large, rapidly rising, potential changes, driving potentials. They had small cell bodies with several processes. With neurobiotin, a network of cells was visualized that resembled c-kit positive interstitial cells of the myenteric region.
A third group of cells generated sequences of potential changes which resembled driving potentials but had smaller amplitudes and slow rates of rise. These cells resembled smooth muscle cells lying in the longitudinal muscle layer.
When simultaneous recordings were made from the driving and slow-wave cells, driving potentials and slow waves occurred synchronously. Current injections indicated that both cell types were part of a common electrical syncytium.
The initial component of slow waves persisted in low concentrations of caffeine, but the secondary component was abolished; higher concentrations shortened the duration of the residual initial component. Driving potentials continued in the presence of low concentrations of caffeine; moderate concentrations of caffeine shortened their duration.
Hence three different types of cells were distinguished on the basis of their electrical activity, their responses to caffeine and their structure. These were smooth muscle cells, lying in the longitudinal and circular layers, and interstitial cells in the myenteric region. The observations suggest that interstitial cells initiate slow waves.
Many organs containing smooth muscle are myogenically active. This was assumed to originate from activity within the individual smooth muscle cells. Some smooth muscle cells have low resting membrane potentials and generate myogenic activity, in much the same way as cardiac pacemaker cells, through the sequential activation of voltage-dependent ion channels (see for example Anderson, 1993). In others, myogenic activity originates from the cyclic release of calcium ions (Ca2+) from stores inside the smooth muscle cells (Van Helden, 1993; Hashitani et al. 1996). Many regions of the gastrointestinal tract generate slow waves and contract rhythmically at low frequencies in the absence of stimulation (Tomita, 1981; Sanders, 1992). Again it was initially thought that the generation of slow waves reflected some properties of gastrointestinal smooth muscle cells (Connor et al. 1974; El-Sharkaway & Daniel, 1975; Tomita, 1981). More recently it has been suggested that slow waves result from the interaction between two distinct groups of cells: one group acts as pacemaking cells and activates a second group which generates slow waves. Several observations suggest that activity originates in interstitial cells of Cajal (ICC), and that smooth muscle cells, rather than initiating activity, act as follower cells. ICC form diffuse networks of cells which are thought to be linked together as electrical syncytia (Thuneberg, 1982). When ICC lying near the submucous border of the circular muscle layer of dog colon are dissected away, nearby smooth muscles stop generating slow waves (Smith et al. 1987). Intestinal preparations taken from mice devoid of ICC fail to generate normal slow waves (Ward et al. 1994; Huizinga et al. 1995).
However recordings have rarely been obtained from ICC. When this was done (Barajas-Lopez et al. 1989) the electrical activity was found to be similar to that recorded in nearby smooth muscle cells (see Sanders & Smith, 1989). Thus recordings from a group of cells which show distinct pacemaker-like activity and which are in continuity with intestinal muscle cells have not been obtained. The hypothesis that ICC are pacemaker cells, or indeed that separate pacemaker cells exist, has not been tested directly (Sanders & Ward, 1996). In this report we describe electrophysiological and histological observations on cells lying in the antral region of the guinea-pig stomach which show that three different groups of cells are present. Most cells generated slow waves with initial and secondary components; these cells were found to be smooth muscle cells lying in the circular muscle layer. Two other groups of cells generated different sequences of membrane potential changes. Cells of one of these groups resembled ICC which were identified by their reaction with an antibody to c-kit (Torihashi et al. 1995). Cells of the other group were found to be smooth muscle cells lying in the longitudinal muscle layer.
METHODS
The procedures described have been approved by the animal experimentation ethics committee at the University of Melbourne. Guinea-pigs of either sex were stunned, exsanguinated, and the stomach removed. The stomach was immersed in oxygenated physiological saline, composition (mM): NaCl, 120; NaHCO3, 25; NaH2PO4, 0.1; KCl, 5; MgCl2, 2; CaCl2, 2.5; and glucose, 11; bubbled with 95 % O2-5 % CO2 and cut along the greater curvature. The mucosa was dissected away and preparations consisting of three to four bundles of circular muscle were prepared. Subsequently the serosa and most of the longitudinal muscle was carefully removed under a dissecting microscope. In some experiments, preparations were attached at one end to a force transducer and held rigidly, serosal side up, at the other end (Tsuengo et al. 1995). Intracellular recordings were made from a small area of smooth muscle, close to the point of rigid attachment, using conventional microelectrodes. In other experiments preparations were pinned out, serosal surface uppermost, in a recording chamber whose base consisted of a microscope cover slip coated with Sylgard silicone resin (Dow Corning Corp. Midland, Michigan, 48640, USA), and viewed with an inverted compound microscope (see Hirst et al. 1974). Intracellular recordings were made using sharp independently mounted microelectrodes (90-150 MΩ) filled with 0.5 M KCl. In the experiments where the different cell types were to be identified morphologically, cells were impaled with microelectrodes filled with 0.5 M KCl and 2.5 % w/v neurobiotin or with 0.15 M LiCl and 3 % w/v Lucifer Yellow. Signals were amplified with an Axoclamp-2A amplifier (Axon Instruments, Foster City, CA, USA), low pass filtered (cut-off frequency 1 kHz) digitized and stored on a computer for later analysis. Preparations were constantly perfused with physiological saline solution warmed to 35°C. In initial experiments it was found that nifedipine reduced the amplitude of contractions but did not dramatically change the time courses of the associated membrane potential changes. Consequently nifedipine, 1 μm, (Sigma Chemical Co. USA) was routinely added to the physiological saline to minimize muscle movements in all experiments involving pinned out preparations but not in those where membrane potential and tension changes were measured simultaneously. In some experiments caffeine (Sigma Chemical Co.) was used.
Preparations containing neurobiotin or Lucifer Yellow-filled cells were fixed overnight at 4°C with fresh 4 % w/v paraformaldehyde in 0.1 M phosphate buffer. Tissues were washed six times for 10 min with 0.1 M phosphate buffered saline (PBS). Tissues containing cells filled with neurobiotin were incubated for 2 h in 0.4 % Triton-X in PBS and then incubated in streptavidin-Texas Red (1:200; Amersham, Buckinghamshire, UK) for 46 h at 4°C (Farraway et al. 1995). The methods used to identify c-kit immunoreactivity have been described previously (Burns et al. 1997). Briefly, segments of stomach, prepared in the same way as those used in the electrophysiological studies, were pinned out on thin pieces of Sylgard silicone resin, fixed in ice-cold acetone for 10 min, washed with PBS (3 × 10 min) and incubated overnight with a rat monoclonal antibody raised against the c-kit protein (ACK-2, diluted to 5 mg ml−1; Gibco BRL, Gaithsberg, MD, USA). After washing with PBS (3 × 10 min) preparations were incubated for 1 h in biotinylated Ig anti-rat (1:200; Amersham) at room temperature (20-22°C). Finally, tissue segments were washed with PBS (3 × 10 min) and incubated for 1 h in streptavidin-Texas Red (1:200; Amersham). All preparations were washed several times with PBS, mounted in buffered glycerol (pH 8.6), cover-slipped and viewed with either a confocal microscope (Biorad MRC 1024) or a Zeiss Axioskope fluorescence microscope. The confocal microscope, using a krypton/argon laser, allowed the visualization of Texas Red (568 nm excitation filter and 605-632 nm emission filter) and Lucifer Yellow (488 nm excitation filter and 522-535 nm emission filter). Appropriate filters were used to visualize Texas Red (510-560 nm excitation filter) and Lucifer Yellow (395-440 nm excitation filter) on the fluorescence microscope.
Unfortunately although several different methods of fixation were attempted, we were unable to identify both ICC and filled cells in the same preparation. The antibody for c-kit required rapid fixation of preparations in a fixative containing acetone. Preparations which had been set up for electrophysiological studies allowed only poor labelling of ICC even with acetone fixation. Moreover neurobiotin-filled cells could not be detected after using fixatives containing acetone.
RESULTS
Membrane potential changes recorded from the antral region of guinea-pig stomach
When intracellular recordings were made from strips of intestine two clearly distinct patterns of membrane potential change were associated with each contraction (Fig. 1). Most frequently the impaled cell generated a slow wave (Fig. 1A). These cells, which will be termed slow-wave cells, had negative membrane potentials in the range -58 to -67 mV (-62.4 ± 0.8 mV; n= 32: data throughout the text are presented as means ±s.e.m., each n value represents a measurement from a preparation taken from a separate animal unless stated otherwise) and discharged slow waves at frequencies of 2-4 waves min−1. Each slow wave was preceded by a period when the membrane potential was stable. This was interrupted by a slowly rising depolarization which appeared to trigger a second component. The peak depolarization was some 27-35 mV (31.2 ± 0.9 mV; n= 32) and the maximum rate of potential change during the entire cycle was less than 0.2 V s−1 (dV/dtmax 0.12 ± 0.04 V s−1; n= 32). The contraction reached its maximum during the latter half of the slow-wave depolarization (Fig. 1B). If the electrode was pushed through these cells, similar sequences of potential changes were detected from the next cell impaled.
Figure 1. Simultaneous recordings of slow waves, driving potentials and myogenic activity from guinea-pig stomach.
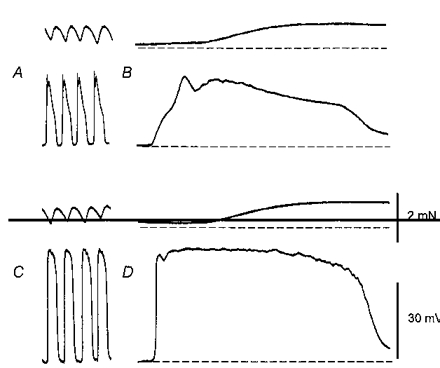
The upper pairs of traces, A and B, show recordings of contractions (upper trace) and associated slow waves (lower trace), displayed at two different recording speeds. It can be seen that slow waves occurred at about 2.5 waves min−1 and that each preceded a muscle contraction (A). On an expanded time base, it can be seen that slow waves had initial components and that the maximum contraction occurred during the latter half of each slow wave (B). The lower sets of traces, C and D, show recordings obtained from the same preparation. Large amplitude membrane potential changes occurred, again at about 2.5 waves min−1, each potential change preceded a muscle contraction (C). The maximum contraction occurred during the latter half of the driving potential (D). The force calibration bar applies to each contraction record; the voltage calibration bar applies to each voltage record. The left-hand time calibration bar refers to recordings shown in A and C, the right-hand time calibration refers to recordings shown in B and D.
On a few occasions, < 1 in 30 impalements from a small proportion of preparations, i.e. < 1 in 10 preparations, a different sequence of membrane potential changes was recorded. Impalement of the second group of cells was associated with a negative membrane potential, which also lay in the range -61 to -68 mV (mean -65.5 ± 1.1 mV; n= 14): these values were not significantly different (Student's t test, P > 0.1) from those of cells from which slow waves were recorded. Again a rhythmical discharge of depolarizing waves was detected (Fig. 1C). Each wave started from a negative potential but the depolarization lacked an obvious inflection in its rising phase (Fig. 1D). After an early peak, the membrane repolarized slightly and then depolarized to a plateau with a maximum depolarization in the range 40-55 mV (mean 45.6 ± 1.0 mV; n= 14). Furthermore the maximum rate of depolarization was more rapid than that occurring during slow waves, being in excess of 0.3 V s−1 (dV/dtmax 1.1 ± 0.2 V s−1; n= 14 with each value being obtained in nifedipine-free solution). For convenience the sequence of potential changes recorded from this second group of cells will be termed a driving potential. A small number of cells were encountered which generated similar sequences of potential changes to those generated by driving cells but with amplitudes less than 35 mV. As insufficient recordings were made from these cells in the experiments where tension and membrane potential changes were recorded simultaneously they were not included in this analysis. These cells, which form a separate group of cells, will be termed follower cells and described later.
When the temporal relationship between driving potential and contractions was compared, again it was found that the peak contraction occurred during the latter half of the depolarization cycle (Fig. 1D). When driving potentials and slow waves were recorded from the same preparation, it was apparent that they occurred at the same frequency and that the total duration of each was very similar (Fig. 1). If the electrode was pushed through a cell generating a driving potential, a cell generating normal slow waves was invariably impaled suggesting that driving cells were located on the surface of the circular muscle layer.
In the previous experiments, recordings were made from a small area of smooth muscle near a point of rigid attachment. Slow waves were readily detected but driving potentials were only detected in a few preparations. When recordings were made from preparations which were pinned out to allow impalements to be made from many different regions, driving potentials could be detected in every preparation. Clearly driving cells were not restricted to a few preparations, rather their distribution was sparse and many regions of tissue had to be probed before they could be located. Moreover sufficient recordings were made from the third group of cells, follower cells, which generated small amplitude driving potentials, to characterize their membrane potential changes.
As was found with the first experimental approach, cells generating slow waves had negative membrane potentials in the range -60 to -74 mV (-65.4 ± 0.7 mV, n= 19) and discharged slow waves at frequencies of 2-4 waves min−1. In some preparations each slow wave was preceded by a period when the membrane potential was stable; in others a small slow depolarization preceded each slow wave. Most frequently the rising phase of a slow wave had a shoulder which appeared to trigger a second component (Fig. 2A). Slow waves had peak depolarizations of 23-42 mV (34.3 ± 0.9 mV). The maximum rate of potential change during the each slow-wave cycle was less than 0.2 V s−1 (mean 0.08 ± 0.01 V s−1).
Figure 2. Different sequences of membrane potential change recorded from slow wave, driving and follower cells lying in the guinea-pig antrum.
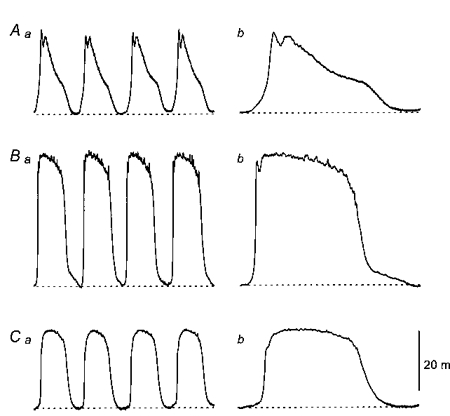
The upper traces (Aa and Ab) show recordings of slow waves, displayed on two different time bases. The peak negative potential was -64 mV. The middle traces (Ba and Bb) show driving potentials recorded from the same preparation, again displayed on two different time bases. The peak negative potential was -65 mV. The lower traces (Ca and Cb) show membrane potential changes recorded from a follower cell, again recorded from the same preparation and again displayed at two scan speeds. The peak negative potential was -62 mV. The physiological saline contained nifedipine (1 μm). The left-hand time calibration bar applies to the column of recordings shown on the left; the right-hand time-calibration bar applies to the column on the right. The voltage calibration bar applies to all recordings.
In the second group of cells, driving potentials were detected (Fig. 2B). Again the impression was gained that these cells lay close to the border between the longitudinal and circular muscle layers where they appeared to form a thin sheet or network. Again, after one of these cells had been impaled, further downward movement of the electrode invariably caused the electrode to impale a cell generating slow waves. Impalement of a driving cell was associated with a negative membrane potential, in the range -57 to -74 mV (-64.1 ± 1.3 mV; n= 15); this was not significantly different from that observed in cells from which slow waves were recorded (Student's t test, P > 0.1). Characteristically driving potentials had a primary component with a peak amplitude in the range 38-54 mV (45.1 ± 1.4 mV). This was followed by a transient repolarizing phase of some 2-8 mV and a plateau phase. During the plateau, the maximum depolarization was in the range 41-54 mV (47.1 ± 1.1 mV). The maximum rates of depolarization were more rapid than those detected during slow waves, being in excess of 0.3 V s−1 (dV/dtmax 0.4 ± 0.03 V s−1). This value is lower than that measured in preparations bathed in nifedipine-free solutions, presumably a few L-type calcium channels are activated during the rising phases of driving potentials. In some preparations, driving potentials were initiated abruptly from a stable negative membrane potential (Fig. 1B); in others they were preceded by a slow depolarization. A common feature of many of the recordings obtained from these cells was the occurrence of many small spontaneous depolarizing potentials (see Van Helden, 1995), during both the plateau and resting phases (Figs 2B and 7Ca).
Figure 7. The effect of caffeine on driving potentials and slow waves recorded from the same preparation of guinea-pig stomach.
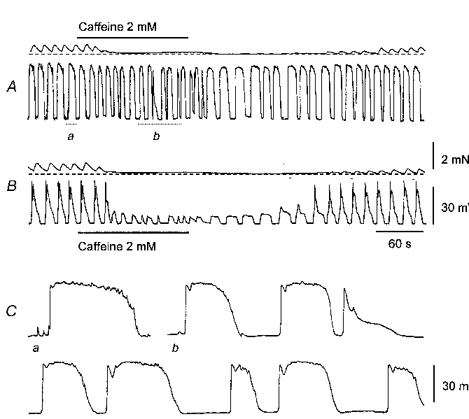
The upper pair of traces show driving potentials and the associated contractions (A). The addition of caffeine (2 mM) shortened the duration and increased the frequency of driving potentials (A). When viewed on expanded time base, giant potentials were seen to consist of a rapid primary component, followed by a plateau (Aa and Ca). In the presence of caffeine the duration of the plateau became variable and on occasions only the primary component persisted (Aa and Cb). Subsequently a cell generating a slow wave was impaled; caffeine (2 mM) now abolished the secondary component of the slow wave to reveal initial components of variable duration (B). The upper scale bars apply to traces A and B. The lower scale bars apply to traces Ca and b.
The third group of cells, follower cells, generated waves of depolarization that were distinguished from driving potentials in that they lacked an obvious primary component, they had smaller amplitudes and slower rates of rise. Unlike the recordings of slow waves, the potential changes lacked obvious initial and secondary components (Fig. 2C). These cells had negative membrane potentials in the range -58 to -74 mV (-64.9 ± 1.0 mV; n= 18). This value was not significantly different to that of either slow cells or driving cells (Student's t test P > 0.2 on both occasions). Their maximum depolarization was in the range 18-33 mV (27.6 ± 0.9 mV): a value significantly different to that recorded from that of driving cells (Student's t test; P < 0.01). The maximum rates of depolarization were slower than those that detected during driving potentials, dV/dtmax 0.07 ± 0.004 V s−1 but very similar to those measured during slow waves. Again these cells appeared to have restricted distribution, lying above the cells generating slow waves.
In summary, three different patterns of electrical activity could be recorded from the antral region of the guinea-pig stomach. Each was present in any given preparation as examples of each cell could often be recorded from the same preparation (Fig. 2).
Simultaneous recordings of driving potentials and slow waves
In the next experiments, the preparations were impaled with two independent microelectrodes. A slow wave was recorded from a cell in a bundle of circular smooth muscle cells. The other electrode was moved along the surface of the same muscle bundle and successive impalements were made until a driving cell, defined as a cell generating large (amplitude > 40 mV) rapidly rising (dV/dtmax > 0.3 V s−1) potential changes was located. The membrane potential changes from both cells were then measured simultaneously for several minutes and their time courses compared. Both types of cells had very similar resting potentials, in nine pairs of cells; the peak negativity of driving cells was -61.2 ± 1.0 mV and the peak negativity of slow-wave cells was -63.4 ± 0.8 mV: these values were not significantly different (Student's paired t test, P > 0.2). Individual driving potentials and slow waves started at identical times (Fig. 3A and B). The rapid primary depolarizing phase of the driving cell preceded the initial depolarizing phase of the slow-wave cell (Fig. 3C). The two repolarizing phases overlapped. When recordings were made from pairs of cells, one of which was a follower cell and one of which was a slow wave cell, the potential changes were also found to be synchronous and have similar durations.
Figure 3. Simultaneous recordings of driving potentials and slow waves from two cells in a bundle of circular smooth muscle cells of guinea-pig stomach.
The upper traces show simultaneous recordings of driving potentials (A) and slow waves (B). It can be seen that they occurred in phase. Two sequences of potential changes, recorded simultaneously, are overlaid in C. It can be seen that the rapid upstroke of the driving potential is followed by the slower rising phase of the initial component of the slow wave. The physiological saline contained nifedipine (1 μm). The upper time and voltage scale bars apply to traces A and B; the lower time and voltage scale bars apply to overlaid traces C.
When hyperpolarizing current pulses were passed through an electrode recording a slow wave, they produced electrotonic potentials in a nearby driving cell. When the two recording electrodes were separated by distances of 200-400 μm, but still in the same circular muscle bundle, a 10 nA hyperpolarizing current pulses produced hyperpolarizations of some 0.3 to 1.0 mV (0.7 ± 0.1 mV; n= 6). When the two electrodes were each placed in cells generating slow waves, again in the same muscle bundles, 10 nA hyperpolarizing current pulses produced electrotonic potentials with peak amplitude in the range 1.9-6.1 mV (3.5 ± 0.6 mV; n= 6). In three of these experiments, identical currents at identical separations were used to evoke electrotonic potentials in similar or dissimilar pairs of cells. In each case the electrotonic potential generated by current flow from a slow-wave cell to a second slow-wave cell was larger than that generated by current flow from a slow-wave cell to a driving cell (Fig. 4). These observations indicate that both sets of cells are part of a common electrical syncytium but suggest that the coupling between the two cell types differs.
Figure 4. Electrical coupling between slow wave and driving cells, and between two slow wave cells.
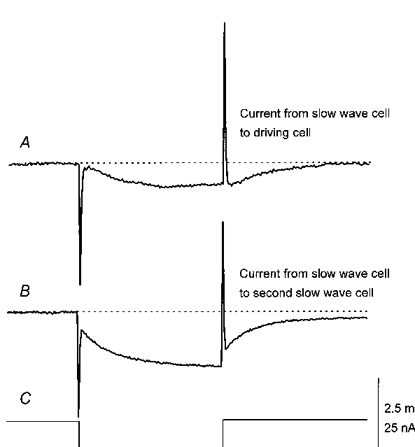
The upper trace (A) shows the electrotonic potential initiated in a driving cell by injecting hyperpolarizing current into a slow wave cell some 300 μm distant. The lower trace (B) shows the electrotonic potential initiated in a smooth muscle cell located just below the driving cell from which trace A was obtained when the same hyperpolarizing currents were injected into the same slow-wave cell. Each membrane potential recording is an average of eight traces, recorded during the resting period between each driving potential/slow wave. The physiological saline contained nifedipine (1 μm). The voltage calibration bar applies to the upper recordings, the current calibration bar applies to the lower current monitor trace (C) and the time calibration bar applies to all recordings.
In three experiments, recordings were made from cells generating slow waves, subsequently the second electrode was used to impale a nearby myenteric neurone. Myenteric neurones were readily identified as they generated brief action potentials when small depolarizing current pulses < 0.3 nA, were passed through the recording electrode (Hirst et al. 1974). When a current pulse of 10 nA was passed through the electrode used to record a slow wave, an electrotonic potential was not detected in the myenteric neurone. Clearly the cells generating driving potentials, whilst they appeared to be located on the surface of the bundles of circular smooth muscle, were not myenteric neurones.
Effects of caffeine on slow waves and driving potentials
Low concentrations of caffeine, added to the physiological saline, disrupted the pattern of myogenic activity (Fig. 5). At the lowest concentration examined, caffeine (0.5 mM) reduced the amplitudes and slowed the rate of generation of slow waves. At the same time the muscle relaxed and the amplitudes of the associated contractions fell (Fig. 5A). When the concentration was increased to 1 mM, again the rate of generation of slow waves fell, the associated contractions were abolished and the amplitudes of slow waves were reduced further. Inspection of individual slow waves indicated that part of the secondary component had been abolished. In some preparations, this response was associated with a small increase in peak negativity of the membrane potential, i.e. 3-9 mV; in others similar responses occurred in the absence of a detectable hyperpolarization. As caffeine was washed out, the slow waves recovered and complete second components were recorded (Fig. 5B). When the concentration of caffeine was increased to 2 mM, similar responses were detected except that the resistant component of the slow wave had a smaller amplitude and occasionally a brief duration (Fig. 5C). As caffeine was washed out, the resistant component triggered a secondary component of smaller amplitude which recovered to give complete slow waves (Fig. 5C). When the concentration was increased to 3 mM, the onset of action was more rapid, the resistant depolarizations had the same amplitudes as those recorded in 2 mM caffeine but often had briefer time courses. This concentration of caffeine first abolished the contractions associated with each slow wave but subsequently triggered a contracture (Fig. 5D); presumably this reflects the ability of caffeine to displace Ca2+ from intracellular stores. As caffeine was washed out the durations of resistant depolarizations lengthened and again a secondary depolarization reappeared (Fig. 5D). Similar observations were made on over 40 preparations, with the preparations showing slight variations in their sensitivity to caffeine. In three experiments, recordings were made from follower cells; caffeine (1 mM) reduced their frequency of occurrence but had little effect on their amplitude.
Figure 5. Effect of caffeine on slow waves and myogenic contractions recorded from guinea-pig stomach.
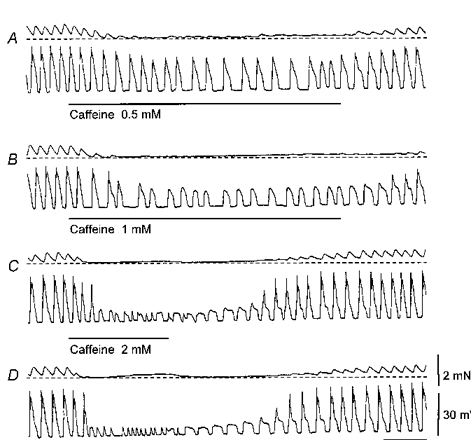
Each pair of traces records contraction (upper) and membrane potential (lower). The addition of caffeine (0.5 mM) reduced the frequency of slow waves and decreased their peak amplitude. Muscle tone was reduced and myogenic contractions almost abolished the phasic contractions associated with each slow wave (A). Increasing the concentration of caffeine (1 mM) completely abolished the phasic contractions and further reduced the frequency and amplitudes of the slow waves (B). A further increase in caffeine concentration (2 mM) reduced the amplitude of the slow waves and revealed a resistant component of constant amplitude. During wash out, the gradual recovery of the second component can be seen (C). The highest concentration of caffeine tested (3 mM) reduced the amplitudes of the slow waves to again give resistant components of constant amplitude. However, the resistant components frequently had brief durations (D). The force calibration bar applies to all contraction records; the voltage calibration bar applies to all membrane potential recordings and the time calibration bar refers to all recordings.
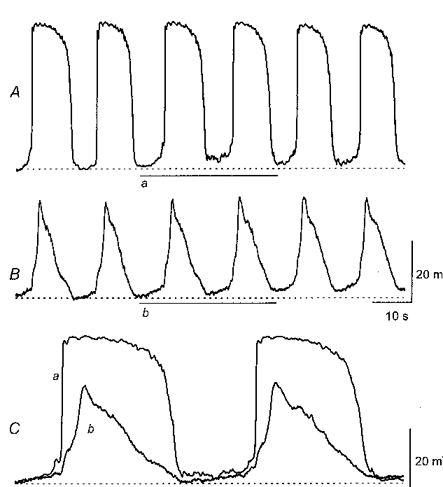
When simultaneous recordings were made from cells generating slow waves and driving potentials it became clear that caffeine (1 mM) reduced the frequency of slow waves and driving potentials but only the amplitude of the slow waves changed dramatically (Fig. 6). The second component of the slow wave was abolished and the resistant component continued to occur synchronously with the driving potential. As caffeine was washed out, the second component gradually recovered (Fig. 6). In five experiments, 1 mM caffeine reduced the frequency of both slow waves and driving potentials from 2.3 ± 0.2 to 1.2 ± 0.3 waves min−1. In each, driving potentials and the caffeine resistant components of the slow wave occurred synchronously. The peak amplitudes of the driving potentials fell from 43.2 ± 3.1 to 38.3 ± 4.5 mV, while those of slow waves fell from 36.3 ± 2.1 to 14.1 ± 1.6 mV. In two of the preparations the peak negative potential increased in both cells by 5 and 8 mV (Fig. 6), in the other three preparations no change was detected.
Figure 6. Effect of caffeine on driving potentials and slow waves recorded simultaneously from two cells in the same bundle of circular smooth muscle of guinea-pig stomach.
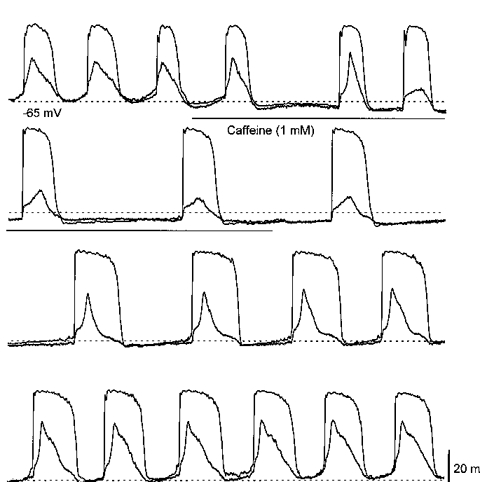
The traces show simultaneous recordings of driving potentials and slow waves during the application and wash out of caffeine (1 mM). Caffeine slowed the rate of generation of slow waves and driving potentials. When the secondary component of the slow wave was abolished, the residual response was seen to continue occurring synchronously with the driving potential. As caffeine was washed out, the secondary component of the slow wave gradually recovered. The duration of the driving potential was transiently increased, at the same time the duration of the initial component of the slow wave was prolonged. The physiological saline contained nifedipine (1 μm). The time and voltage scale bars apply to all traces.
During the application of a moderate concentration of caffeine (2 mM) the duration of driving potentials was often reduced. The primary rapid component persisted and the plateau component was abolished (Fig. 7Ab and Cb). When the plateau was abolished or reduced in duration, the primary components often occurred more frequently than during control. As caffeine was washed out, the duration of individual driving potentials was often increased (Fig. 7A). Subsequently, recordings were made from a cell in the same preparation which was generating slow waves. Caffeine (2 mM) again reduced the frequency and amplitudes of slow waves with the resistant depolarizations having variable durations (Fig. 7B). Occasionally, the initial component of the slow wave, which persisted in caffeine, had a brief duration. Again these potentials occurred more frequently than did control slow waves.
Together the observations indicate that low concentrations of caffeine selectively abolish the secondary component of slow waves and suggest that driving potentials give rise to the initial components of slow waves. Higher concentrations of caffeine also abolish the plateau component of the driving potential; when this happens the duration of the primary component of the slow wave is also shortened.
Morphological properties of smooth muscle cells, driving cells and follower cells filled with Lucifer Yellow
Cells were impaled with microelectrodes containing Lucifer Yellow. The cells were classified into one of the three groups described previously. Cells were sufficiently loaded with Lucifer Yellow to visualize them without any current injection provided a stable impalement was maintained for 4 min. A total of seventeen cells, in nine different preparations, generated slow waves (Fig. 8Aa) and were identified as smooth muscle cells. Of these, eight when viewed under a conventional microscope were seen to be single smooth muscle cells. That is the cells were long and thin and lacked processes (Fig. 8Ab). These cells invariably lay with their long axes oriented along a circular muscle bundle. The other nine cells when visualized were seen to consist of clumps of smooth muscle cells, again with their long axes oriented along a circular muscle bundle. Clearly Lucifer Yellow was, on occasions, able to spread from muscle cell to muscle cell (Beny & Connat, 1992). The impression was gained that the longer the impalement was maintained the more likely this was to happen. The dimensions of the circularly orientated smooth muscle cells were determined by reconstructing six of the single cells using a confocal microscope. Individual cells had lengths of 250-510 μm (317 ± 40 μm) and diameters at their widest point of 3-10 μm (6 ± 1 μm).
Figure 8. Morphological properties of slow-wave cells filled with Lucifer Yellow or neurobiotin.
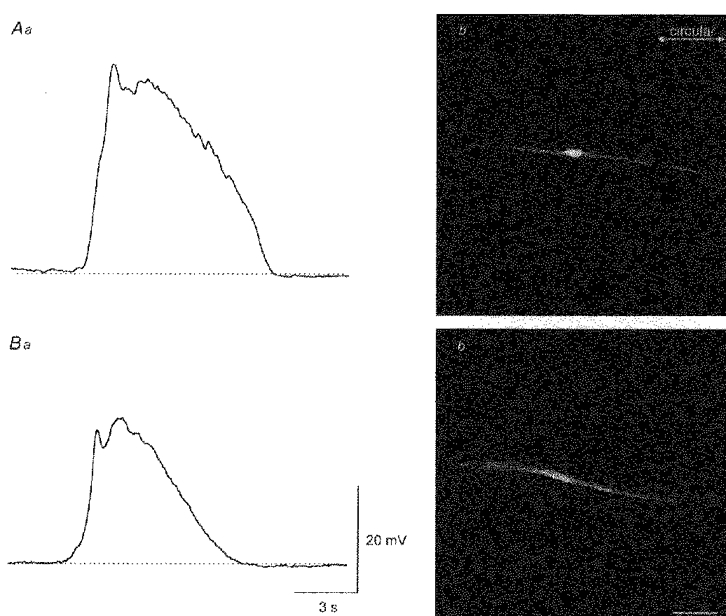
The upper membrane potential recording of a slow wave (Aa) was obtained using a microelectrode containing Lucifer Yellow. After appropriate fixation, the preparation was viewed and the shape of the filled cell (Ab) determined using a confocal microscope (composite of a z-series through 9 μm). The lower recording of a slow wave (Ba) was obtained using a microelectrode containing neurobiotin. Subsequently heptanol (3 mM) was added to the physiological saline and neurobiotin injected for 4 min. After appropriate fixation and conjugation with streptavidin-Texas Red, the preparation was viewed and the arrangement of the neurobiotin-loaded cell (Bb) determined using a confocal microscope (composite of a z-series through 12 μm). Note that both cells were orientated in a circular manner. The physiological saline contained nifedipine (1 μm). The time and voltage calibration bars apply to both membrane potential recordings. The calibration bar, 40 μm, applies to both photomicrographs.
Using the same approach, a total of seven cells in five different preparations were identified as driving cells (Fig. 9Aa). Each of these were filled with Lucifer Yellow and viewed under a conventional microscope. In one experiment a single cell was visualized. In the others, clumps of cells were visualized with one of the cells in each clump heavily loaded with dye (Fig. 9Ab). Five cells with well defined cell bodies were examined using the confocal microscope, these had diameters in the range 9-13 μm (11 ± 1 μm). Each gave rise to between 2 and 5 distinct processes which often bifurcated. The processes had variable lengths, some being as short as 9 μm with others in excess of 100 μm. It was clear that the cells which were lightly filled with dye had similar structures to the heavily loaded ones but it was not possible to accurately determine their number of processes.
Figure 9. Morphological properties of driving cells filled with Lucifer Yellow or neurobiotin.
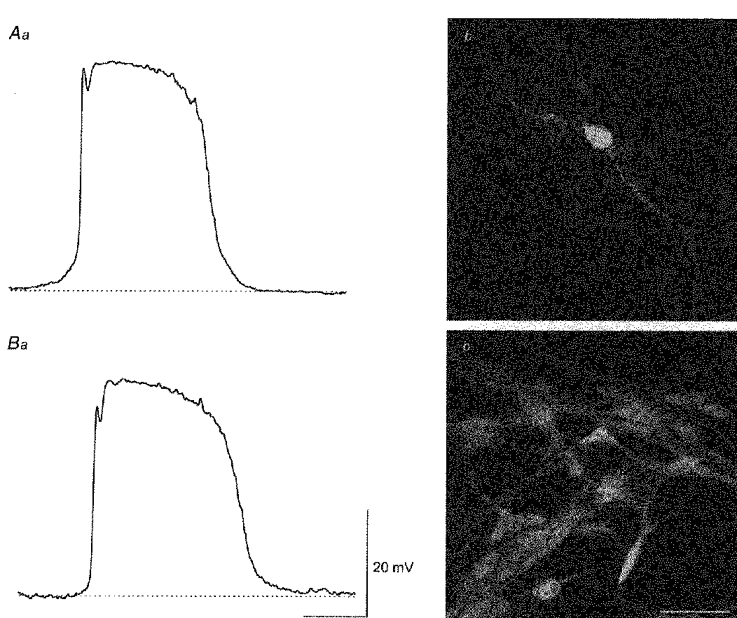
The driving potential shown in the upper trace (Aa) was obtained by using a microelectrode containing Lucifer Yellow. The shape of a driving cell was determined by sectioning through the brightest cell (Ab) with a confocal microscope (composite of a z-series through 19 μm). The lower trace (Ba) shows a driving potential recorded with a microelectrode containing neurobiotin. After identifying the cell, heptanol (3 mM) was added to the physiological saline and neurobiotin injected for 4 min. After appropriate processing the preparation was viewed and the arrangement of the neurobiotin-loaded cells (Bb) determined using a confocal microscope (composite of a z-series through 11 μm). The physiological saline contained nifedipine (1 μm). The time and voltage calibration bars apply to both membrane potential recordings. The calibration bar, 40 μm, applies to both photomicrographs.
A total of four cells in four different preparations, were identified as follower cells (Fig. 10Aa). Each of these was filled with Lucifer Yellow and viewed under a conventional microscope. These cells resembled single smooth muscle cells but unlike the cells generating slow waves they lay with their long axes at an angle (which was between 90 and 45 deg) to the axis of nearby circular muscle bundles (Fig. 10Ab). Each cell was viewed with the confocal microscope and its size determined. Individual cells had lengths of 210-320 μm (252 ± 24 μm) and diameters at their widest point of 6-14 μm (9 ± 2 μm).
Figure 10. Morphological properties of follower cells filled with Lucifer Yellow or neurobiotin.
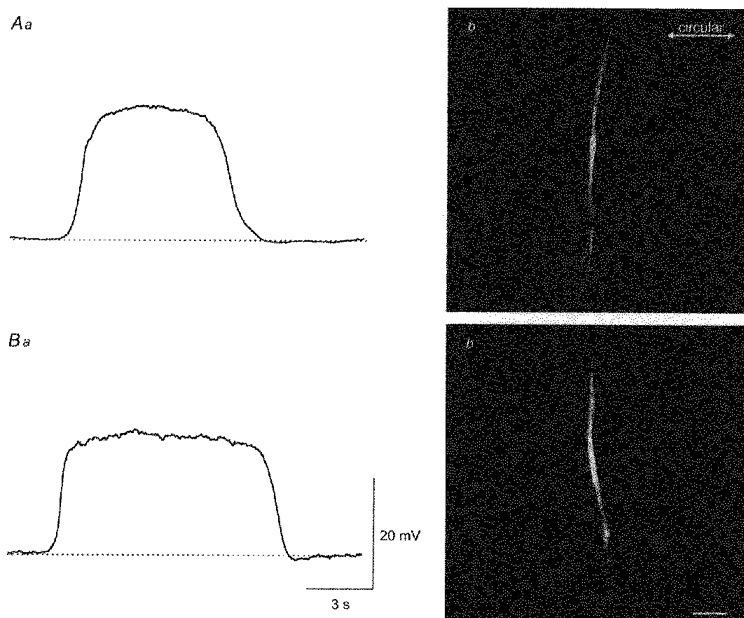
The upper trace (Aa) shows the potential change recorded from a follower cell with a microelectrode containing Lucifer Yellow. The filled cell (Ab) was viewed with a confocal microscope (composite of a z-series through 7 μm). The lower recording (Ba) was obtained using a microelectrode containing neurobiotin. After conjugating with streptavidin-Texas Red, the loaded cell (Bb) was viewed with a confocal microscope (composite of a z-series through 13 μm). Note that both cells were long and thin; both had a longitudinal orientation. The physiological saline contained nifedipine (1 μm). The time and voltage calibration bars apply to both membrane potential recordings. The calibration bar, 40 μm, applies to both photomicrographs.
Properties of smooth muscle cells, driving cells and follower cells filled with neurobiotin
In a parallel series of experiments, recordings were made from the three cell types with electrodes filled with neurobiotin. After classifying the cells, attempts were made to fill the cells by passing trains of depolarizing current pulses (0.1 nA for 500 ms delivered at 1 Hz) through the recording electrode for up to 5 min. Tissues were fixed, labelled with streptavidin-Texas Red and again viewed either with a conventional or a confocal microscope. With this approach, neither slow-wave cells nor driving cells could be visualized, presumably neurobiotin had diffused to nearby cells (Farraway et al. 1995). However, it was possible to visualize the follower cells (Fig. 10Ba). Again these cells had the appearance of smooth muscle cells (Fig. 10Bb) and, again, most lay at right angles to the orientation of circular muscle bundles. Their lengths were in the range 120-270 μm (200 ± 12 μm; n= 12) and diameters at the widest point were in the range 3-8 μm (7 ± 2 μm).
In other smooth muscles it has been reported that neurobiotin diffuses so rapidly through the connections between adjacent cells that little accumulates at the site of injection (Farraway et al. 1995). The conductance of gap junctions can be reduced by adding heptanol to the physiological saline (Spray et al. 1985). Subsequently cells were impaled, identified and the preparations superfused with physiological solution containing heptanol (3 mM). When this was done, slow-wave cells (Fig. 8Ba) were invariably found to be single smooth-muscle cells lying in bundles of circular muscle (Fig. 8Bb). When seven of these cells were examined in the confocal microscope, their lengths were found to lie in the range 110-330 μm (210 ± 27 μm) and their diameters at the largest point lay in the range 5-10 μm (7 ± 1 μm).
With this same approach, driving cells were filled with neurobiotin (Fig. 9Ba). Despite the presence of heptanol, neurobiotin continued to diffuse from the impaled cell and marked a network of cells which again failed to resemble smooth muscle cells (Fig. 9Bb). The cells were seen to have prominent cell bodies which gave rise to numerous interconnected processes. Again it was not possible to estimate the number of processes as they appeared to form a network of processes. When viewed under high magnification the cell bodies of the neurobiotin-filled cells had a granular appearance (Fig. 9Bb). The cell bodies had diameters in the range 7-15 μm (10 ± 1 μm, n= 20; where each n value represents a separate cell detected in the filled regions of five preparations). When viewed with the confocal microscope it was clear that driving cells lay in a similar plane to myenteric neurones.
Distribution of interstitial cells determined by use of antibody to c-kit
The previous observations have shown that the slow-wave cells and follower cells are smooth-muscle cells. In contrast, the cells which generate driving potentials form part of a network of cells which are so tightly linked together that both Lucifer Yellow or neurobiotin, even in the presence of heptanol, readily diffuse from cell to cell. ICC form extensive networks of cells in the myenteric region of the guinea-pig stomach and can be visualized using an antibody to c-kit (Burns et al. 1997). Their observations were re-confirmed on five preparations, isolated in the same way as those used in the electrophysiological studies. ICC were distributed throughout the preparations. A dense network of cells immunoreactive to c-kit was located at the junction between the circular and longitudinal muscle layers (Fig. 11A and B). A few isolated cells displaying immunoreactivity to c-kit antibody were distributed through the circular muscle layer (Fig. 11C). Cells staining positive for c-kit which lay in the myenteric region had diameters in the range 9-17 μm (13 ± 1 μm, n= 20 where each n value was a separate cell picked at random from the myenteric region of the five preparations examined). This value for the diameter of cells labelled with c-kit was not significantly different from that determined for driving cells either loaded with Lucifer Yellow, (Student's t test, P > 0.2) or with neurobiotin (Student's t test, P > 0.15). However, the diameter of the c-kit-labelled cells differed from both that of slow-wave cells (Student's t test, P < 0.01) and the follower cells (Student's t test, P < 0.01).
Figure 11. Distribution of ICC in the myenteric region of guinea-pig stomach shown by staining for c-kit.
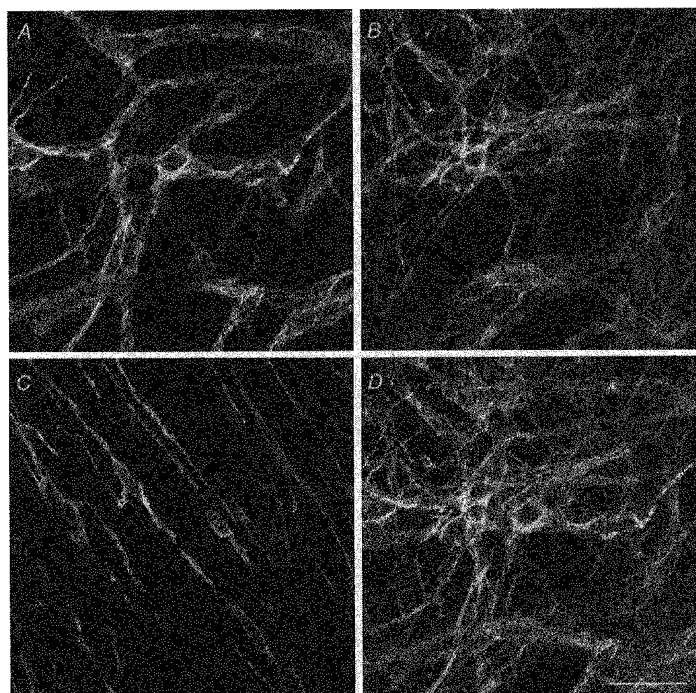
The figure shows four photomicrographs showing the distribution of cells expressing c-kit in the guinea-pig antrum. The confocal micrograph (A) shows the distribution of c-kit immunoreactive cells in the outer layer of the myenteric region adjacent to the longitudinal muscle layer (composite of a z-series through 2.4 μm). The micrograph (B) shows the distribution of c-kit immunoreactive cells in the lower region of the myenteric region (composite of a z-series through 5 μm). The cell bodies have diameters of some 10-15 μm but as they fail to appear in successive composites, are flattened. The lower myenteric region was invariably denser than the upper layer. Micrograph (C) shows a representative sample of ICC lying in the circular muscle layer (composite of a z-series through 5 μm). Micrograph (D) shows a combined projection of micrographs, A, B and C. The calibration bar of 40 μm applies to each micrograph.
DISCUSSION
Three distinct patterns of membrane potential change were recorded from different cells lying in or near the circular layer of guinea-pig stomach. One set of cells generated slow waves (Figs 1 and 2). Slow waves occurred regularly and each was associated with a contraction. An initial depolarization appeared to trigger a secondary wave of depolarization. During a slow wave the rate of membrane potential change was lower than that detected in excitable tissues when voltage-dependent channels open to generate an action potential (Tomita, 1981). Slow-wave cells, when filled with Lucifer Yellow, invariably had the appearance of smooth muscle cells (Fig. 8). They had lengths of some 200-300 μm, diameters of about 7 μm and lacked processes, values similar to those reported for other gastrointestinal smooth muscle cells (Gabella, 1976). In a proportion of the experiments where cells were filled with Lucifer Yellow, Lucifer Yellow diffused to adjacent cells. When the cells were injected with neurobiotin, insufficient dye remained at the site of injection. When its diffusion was slowed by adding heptanol to the physiological saline, cells with similar appearances to those filled with Lucifer Yellow were visualized. With both intracellular markers, the smooth muscle cells were found to lie in the same orientation as the circular muscle bundles. All these observations are consistent with the view that cells which generate slow waves are smooth-muscle cells which form an electrical syncytium in the circular muscle layer of the stomach (Fig. 4).
The second type of cell generated driving potentials of large amplitude (Figs 1 and 2). These cells were encountered infrequently. When recordings were only made from a small region of tissue, they were often not detected but when many regions of tissue were examined, examples of the second group were detected more regularly. Nevertheless such cells were still rare and appeared to consist of a thin layer of cells lying over the cells generating slow waves. Driving potentials had rapid upstrokes, followed by transient repolarizations, plateau phases and falling phases. The rates of rise of the depolarizing phases approached those detected in cardiac pacemaker regions (Noble, 1984). Driving cells when injected with Lucifer Yellow were seen to have different structures to the cells generating slow waves. They had prominent cell bodies which gave rise to a variable number of cell processes (Fig. 9A). These processes intermingled with those of other similar cells to form a network of cells. When driving cells were filled with neurobiotin, extensive networks of interconnected cells were detected (Fig. 9B). Clearly although driving cells lay in the myenteric region, they were not myenteric neurones. They had different electrical and structural properties. Myenteric neurones generated brief action potentials and were not coupled electrically to the circular muscle layer. They had cell bodies with diameters in excess of 20 μm (Hirst et al. 1974). Although they gave rise to branching dendritic trees which intermingle, neither Lucifer Yellow nor neurobiotin diffused from cell to cell (Bornstein et al. 1984; Brookes et al. 1995). However, networks of ICC have been demonstrated in the myenteric region of preparations of guinea-pig stomach stained for c-kit immunoreactivity (Burns et al. 1997). In the present study, cell bodies of identified driving cells, filled either with Lucifer Yellow or neurobiotin, had the same sizes as c-kit-labelled ICC which lay in the myenteric region (see Figs 9 and 11). Moreover, the network of cells revealed by neurobiotin injection resembled that labelled for c-kit (Figs 9 and 11). Together the observations suggest that driving potentials originate in ICC located within the myenteric region. Further support for this idea comes from the finding that driving cells had a granular appearance when loaded with neurobiotin; electron micrographs of interstitial cells show that they contain many large glycogen granules and condensed chromatin particles (Cook & Burnstock, 1976).
The third type of cell generated potentials which resembled those recorded from ICC but had smaller amplitudes and slower rising phases. These potentials were recorded from cells which had the same appearance as smooth muscle cells which generated slow waves (Fig. 10). However their orientation tended to be in the longitudinal axis. Surprisingly neither Lucifer Yellow nor neurobiotin escaped from these cells during even quite long impalements. This suggests that the way in which they are coupled to their neighbouring cells is different from the way in which either circular smooth muscle cells (see also Farraway et al. 1995) or ICC are coupled to their neighbouring cells. Presumably these recordings reflect impalements from the longitudinal muscle layer and support the view that these cells are coupled to the nearby layer of ICC (Sanders, 1996). As the potential changes recorded from them have smaller amplitudes and slower rising phases than do those recorded from ICC, they are more likely to be following, rather than initiating, driving potentials. Unlike the slow waves recorded from circular smooth muscle cells, the potentials recorded from longitudinal muscle cells appeared to lack a secondary component.
The electrophysiological observations made in this study suggest that slow waves in the circular smooth muscle cell layer are initiated by ICC in the guinea-pig antrum. When simultaneous recordings were made from these cells the potential changes were found to occur synchronously and have very similar overall durations (Fig. 3). The two cell types formed part of a common electrical syncytium (Fig. 4). The rapid upstroke of the driving cell appeared to give rise to the initial component of the slow wave (Fig. 3). This view was confirmed when caffeine was added to the physiological saline. A low concentration of caffeine abolished the secondary component of the slow wave, leaving the initial component. As caffeine was washed away the secondary phase returned, initially with a small amplitude but gradually increasing towards its control value. When simultaneous recordings were made from ICC and cells generating slow waves during the addition of caffeine, driving potentials and the caffeine resistant potential changes occurred synchronously (Fig. 6). During the recovery phase, the initial components of the slow waves lasted longer; at the same time the driving potentials were prolonged. When the concentration of caffeine was increased, the resistant initial component of the slow wave often became briefer and occurred at a higher frequency (Fig. 7). This concentration of caffeine shortened the duration of the driving potential, the upstroke was unchanged but the plateau component was shortened or abolished so giving rise to brief triangular shaped potential changes (Fig. 7C b). During recovery, the durations of individual driving potentials were again often prolonged (Fig. 7A). Together these observations indicate that although driving potentials and slow waves respond differently to caffeine, driving potentials and the caffeine resistant component of the slow wave respond similarly.
Clearly we have not attempted to identify the pathway that caffeine activates, or blocks, when it modifies the generation of slow waves; caffeine was used solely to clarify the relative roles of driving potentials and slow waves. Our observations suggest that a driving potential generates a long lasting wave of depolarizing current which flows passively to the circular muscle layer and initiates the initial component of the slow wave. The resulting depolarization then triggers a secondary component in circular smooth muscle cells which is inhibited by caffeine; a corresponding secondary depolarization was not found in longitudinal cells. It is possible that caffeine inhibits a set of voltage-dependent channels which contribute to the secondary component (see Zholos et al. 1991) but the identity of such channels remains unclear. Clearly L-type calcium channels are activated during each slow wave. The associated contractions are much reduced when organic Ca2+ antagonists are added to the physiological saline (T. Tomita, unpublished observations; see also Sanders, 1992; Malysz et al. 1995) but slow waves themselves are little changed. Evidently the dominant conductance change generating the regenerative component of the slow wave is not provided by the L-type calcium channels. Another set of voltage-dependent channels might be involved. However, although channels which will support long lasting depolarizations have been demonstrated in cardiac muscle (Saint et al. 1992), they have not been demonstrated in antral smooth muscle cells (Noack et al. 1992). The alternative possibility is that the regenerative component arises from the regenerative release of Ca2+ from an internal store (Fabiato & Fabiato, 1975) and this activates a set of channels which causes an increase in the net positive internal charge (see as examples Pacaud & Bolton, 1991; Large & Wang, 1996; Hashitani, et al. 1996). If this is the explanation, then at least part of the release of Ca2+ from an intracellular store must be sensitive to changes in membrane potential. Voltage sensitive release of Ca2+ from intracellular stores has been demonstrated in cardiac muscle (Howlett & Ferrier, 1997) but not in smooth muscle. On the other hand, the production of inositol trisphosphate (InsP3) has been shown to be influenced by membrane potential in some smooth muscles (Itoh et al. 1992). It is possible that InsP3 production could be increased during the initial phase of the slow wave and this would cause the release of Ca2+ from an intracellular store.
Our observations do not attempt to identify the nature of the membrane currents underlying the components which make up driving potentials and slow waves. Clearly several different membrane currents are involved in the initiation of a complete slow wave. The upstroke of a driving potential initiates each slow wave sequence. The rapid upstroke triggers a plateau component in ICC which can be shortened by caffeine. When this occurs the frequency of occurrence of the primary component increases; this might suggest that the upstroke of the driving potential has a voltage-dependent refractory period. Slow waves consist of a passive component which originates from the spread of depolarizing current generated by ICC (Fig. 12). The ensuing depolarization activates a secondary, regenerative phase which is abolished by caffeine (Fig. 12). During this phase, L-type calcium channels are opened but these channels do not appear to be essential for the generation of slow waves in guinea-pig stomach.
Figure 12. Experimental and schematic representations to explain the generation of slow waves in the circular muscle layer of the guinea-pig stomach.
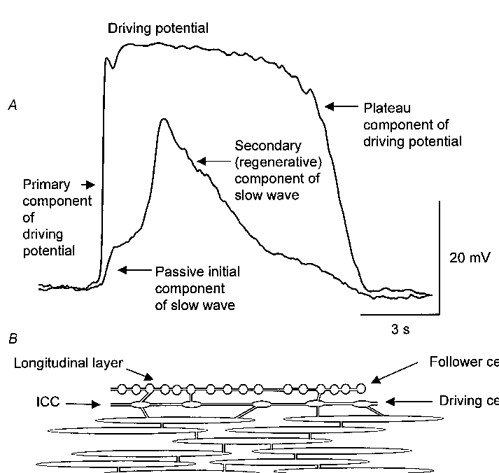
Simultaneous recordings of driving potentials and a slow wave from two cells in a bundle of circular smooth muscle cells of guinea-pig stomach are shown in the upper pair of traces (A); the physiological saline contained nifedipine (1 μm). The primary component of the driving potential causes a rapid membrane potential change which in turn triggers a long lasting plateau component. Driving cells, or ICC, produce a persistent depolarizing current which flows via gap junctions to slow-wave cells, smooth-muscle cells in the circular-muscle layer and to follower cells, smooth-muscle cells in the longitudinal layer (B). A persistent wave of depolarization in the circular muscle layer initiates a secondary, regenerative component in this layer.
In summary our observations provide a clear indication that myogenic activity results from the interaction between ICC and neighbouring smooth muscle cells (Sanders, 1996). As the ICC, from which recordings were made, appeared to be those lying in the myenteric region, the observations are consistent with the idea that, in the antrum of the stomach and in regions of the small intestine, myogenic activity is initiated at or near the junction between the longitudinal and circular muscle layer (Taylor et al. 1975; Bauer et al. 1985; Suzuki et al. 1986).
Acknowledgments
We wish to thank Drs Narelle Bramich and Frank Edwards for their helpful comments on the manuscript. We are also very grateful to Dr Heather Young for her advice on histological techniques. This project was supported by a grant from the Australian National Health & Medical Research Council.
References
- Anderson K-E. Pharmacology of lower urinary tract smooth muscles and penile erectile tissues. Pharmacological Reviews. 1993;45:253–307. [PubMed] [Google Scholar]
- Barajas-Lopez C, Berezin I, Daniel EE, Huizinga JD. Pacemaker activity recorded in interstitial cells of Cajal of the gastrointestinal tract. American Journal of Physiology. 1989;257:C830–835. doi: 10.1152/ajpcell.1989.257.4.C830. [DOI] [PubMed] [Google Scholar]
- Bauer AJ, Publicover NG, Sanders KM. Origin and spread of slow waves in canine gastric antral circular muscle. American Journal of Physiology. 1985;249:G800–806. doi: 10.1152/ajpgi.1985.249.6.G800. [DOI] [PubMed] [Google Scholar]
- Beny JL, Connat JL. An electron-microscopic study of smooth muscle dye coupling in the pig coronary arteries. Role of gap junctions. Circulation Research. 1992;70:49–55. doi: 10.1161/01.res.70.1.49. [DOI] [PubMed] [Google Scholar]
- Bornstein JC, Costa M, Furness JB, Lees GM. Electrophysiology and enkephalin immunoreactivity of identified myenteric plexus neurones of guinea-pig small intestine. The Journal of Physiology. 1984;351:313–325. doi: 10.1113/jphysiol.1984.sp015247. [DOI] [PMC free article] [PubMed] [Google Scholar]
- Brookes SJ, Song ZM, Ramsey GA, Costa M. Long aboral projections of Dogiel type II, AH neurones within the myenteric plexus of the guinea-pig small intestine. Journal of Neuroscience. 1995;15:4013–4022. doi: 10.1523/JNEUROSCI.15-05-04013.1995. [DOI] [PMC free article] [PubMed] [Google Scholar]
- Burns AJ, Herbert TM, Ward SM, Sanders KM. Interstitial cells of Cajal in the guinea-pig gastrointestinal tract as revealed by c-Kit immunohistochemistry. Cell and Tissue Research. 1997;290:11–20. doi: 10.1007/s004410050902. [DOI] [PubMed] [Google Scholar]
- Connor JA, Prosser CL, Weems WA. A study of pacemaker activity in intestinal smooth muscle. The Journal of Physiology. 1974;240:671–701. doi: 10.1113/jphysiol.1974.sp010629. [DOI] [PMC free article] [PubMed] [Google Scholar]
- Cook RD, Burnstock G. The ultrastructure of Auerbach's plexus in the guinea-pig. II. Non-neural elements. Journal of Neurocytology. 1976;5:195–206. doi: 10.1007/BF01181656. [DOI] [PubMed] [Google Scholar]
- El-Sharkaway TY, Daniel EE. Ionic mechanisms of the control of intestinal electrical activity. American Journal of Physiology. 1975;229:1287–1298. doi: 10.1152/ajplegacy.1975.229.5.1287. [DOI] [PubMed] [Google Scholar]
- Fabiato A, Fabiato F. Contractions induced by a calcium-triggered release of calcium from the sarcoplasmic reticulum of single skinned cardiac cells. The Journal of Physiology. 1975;249:469–495. doi: 10.1113/jphysiol.1975.sp011026. [DOI] [PMC free article] [PubMed] [Google Scholar]
- Farraway L, Ball AK, Huizinga JD. Intercellular metabolic coupling in canine colon musculature. American Journal of Physiology. 1995;268:C1492–1502. doi: 10.1152/ajpcell.1995.268.6.C1492. [DOI] [PubMed] [Google Scholar]
- Gabella G. Quantitative morphological study of smooth muscle cells of the guinea-pig taenia coli. Cell and Tissue Research. 1976;170:161–186. doi: 10.1007/BF00224297. [DOI] [PubMed] [Google Scholar]
- Hashitani H, Van Helden DF, Suzuki H. Properties of spontaneous depolarizations in circular smooth muscle cells of rabbit urethra. British Journal of Pharmacology. 1996;118:1627–1632. doi: 10.1111/j.1476-5381.1996.tb15584.x. [DOI] [PMC free article] [PubMed] [Google Scholar]
- Hirst GDS, Holman ME, Spence I. Two types of neurones in the myenteric plexus of duodenum in the guinea-pig. The Journal of Physiology. 1974;236:303–326. doi: 10.1113/jphysiol.1974.sp010436. [DOI] [PMC free article] [PubMed] [Google Scholar]
- Howlett SE, Ferrier GR. The 1996 Merck Frosst Award. The voltage sensitive release mechanism: a new trigger for cardiac contraction. Canadian The Journal of Physiology and Pharmacology. 1997;75:1044–1057. doi: 10.1139/cjpp-75-9-1044. 10.1139/cjpp-75-9-1044. [DOI] [PubMed] [Google Scholar]
- Huizinga JD, Thuneberg L, Kluppel M, Malysz J, Mikkelsen HB, Bernstein A. W/Kit gene required for intestinal pacemaker activity. Nature. 1995;373:347–349. doi: 10.1038/373347a0. 10.1038/373347a0. [DOI] [PubMed] [Google Scholar]
- Itoh M, Seki N, Suzuki H, Ito S, Kajikura J, Kuriyama H. Membrane hyperpolarization inhibits agonist-induced synthesis of inositol 1,4, 5-trisphosphate in rabbit mesenteric artery. The Journal of Physiology. 1992;451:307–328. doi: 10.1113/jphysiol.1992.sp019166. [DOI] [PMC free article] [PubMed] [Google Scholar]
- Large WA, Wang Q. Characteristics and physiological role of the Ca2+-activated Cl− conductance in smooth muscle. American Journal of Physiology. 1996;217:C435–454. doi: 10.1152/ajpcell.1996.271.2.C435. [DOI] [PubMed] [Google Scholar]
- Malysz J, Richardson D, Farraway L, Christen M-O, Huizinga JD. Generation of slow wave type action potentials in the mouse small intestine involves a non-L-type calcium channel. Canadian Journal of Physiology and Pharmacology. 1995;73:1502–1511. doi: 10.1139/y95-208. [DOI] [PubMed] [Google Scholar]
- Noack T, Deitmer P, Lammel E. Characterization of membrane currents in single smooth muscle cells from the guinea-pig antrum. The Journal of Physiology. 1992;451:387–417. doi: 10.1113/jphysiol.1992.sp019170. [DOI] [PMC free article] [PubMed] [Google Scholar]
- Noble D. The surprising heart: a review of recent progress in cardiac electrophysiology. The Journal of Physiology. 1984;353:1–50. doi: 10.1113/jphysiol.1984.sp015320. [DOI] [PMC free article] [PubMed] [Google Scholar]
- Pacaud P, Bolton TB. Relation between muscarinic receptor cationic current and intestinal calcium in guinea-pig jejunal smooth muscle. The Journal of Physiology. 1991;441:447–499. doi: 10.1113/jphysiol.1991.sp018763. [DOI] [PMC free article] [PubMed] [Google Scholar]
- Saint DA, Ju YK, Gage PW. A persistent sodium current in rat ventricular myocytes. The Journal of Physiology. 1992;453:219–231. doi: 10.1113/jphysiol.1992.sp019225. [DOI] [PMC free article] [PubMed] [Google Scholar]
- Sanders KM. Ionic mechanisms of electrical rhythmicity in gastrointestinal smooth muscles. Annual Review of Physiology. 1992;54:439–453. doi: 10.1146/annurev.ph.54.030192.002255. 10.1146/annurev.ph.54.030192.002255. [DOI] [PubMed] [Google Scholar]
- Sanders KM. A case for interstitial cells of Cajal as pacemakers and mediators of neurotransmission in the gastrointestinal tract. Gastroenterology. 1996;111:492–515. doi: 10.1053/gast.1996.v111.pm8690216. [DOI] [PubMed] [Google Scholar]
- Sanders KM, Smith TK. Electrophysiology of colonic smooth muscle. In: Schultz SG, Wood J, Rauner BR, editors. Handbook of Physiology, section 6; The GastroIntestinal Tract. Vol. 1. Bethesda, Maryland, USA: American Physiological Society; 1989. pp. 251–271. [Google Scholar]
- Sanders KM, Ward SM. Electrical rhythmicity in gastrointestinal muscles. In: Bolton TB, Tomita T, editors. Smooth Muscle Excitation. London: Academic Press; 1996. pp. 417–428. [Google Scholar]
- Smith TK, Reed JB, Sanders KM. Origin and propagation of electrical slow waves in the circular layer of canine colon. American Journal of Physiology. 1987;252:C215–224. doi: 10.1152/ajpcell.1987.252.2.C215. [DOI] [PubMed] [Google Scholar]
- Spray DC, White RL, Mazet F, Bennett MVL. Regulation of gap junctional conductance. American Journal of Physiology. 1985;248:H753–764. doi: 10.1152/ajpheart.1985.248.6.H753. [DOI] [PubMed] [Google Scholar]
- Suzuki N, Prosser CL, Dahms V. Boundary cells between longitudinal and circular layers: essential for electrical slow waves in cat intestine. American Journal of Physiology. 1986;250:G287–294. doi: 10.1152/ajpgi.1986.250.3.G287. [DOI] [PubMed] [Google Scholar]
- Taylor GS, Daniel EE, Tomita T. Origin and mechanism of intestinal slow waves. In: VanTrappen G, editor. Proceedings of the 5th International Symposium on GI Motility. Leuven, Belgium: Typoff Press; 1975. pp. 102–106. [Google Scholar]
- Thuneberg L. Interstitial cells of Cajal: intestinal pacemaker cells? Advances in Anatomy and Embryological Cell Biology. 1982;71:1–130. [PubMed] [Google Scholar]
- Tomita T. Electrical activity (spikes and slow waves) in gastrointestinal smooth muscles. In: Bulbring E, Brading AF, Jones AW, Tomita T, editors. Smooth Muscle: An Assessment of Current Knowledge. London: Edward Arnold; 1981. pp. 127–156. [Google Scholar]
- Torihashi S, Ward SM, Nishikawa S, Nishi K, Kobayashi S, Sanders KM. c-kit-dependent development of interstitial cells and electrical activity in the murine gastrointestinal tract. Cell and Tissue Research. 1995;280:97–111. doi: 10.1007/BF00304515. 10.1007/s004410050334. [DOI] [PubMed] [Google Scholar]
- Tsuengo M, Huang S-M, Pang Y-W, Chowdhury JU, Tomita T. Effects of phosphodiesterase inhibitors on spontaneous electrical activity (slow waves) in guinea pig gastric muscle. The Journal of Physiology. 1995;485:493–502. doi: 10.1113/jphysiol.1995.sp020745. [DOI] [PMC free article] [PubMed] [Google Scholar]
- Van Helden DF. Pacemaker potentials in lymphatic smooth muscle of guinea-pig mesentery. The Journal of Physiology. 1993;471:465–478. doi: 10.1113/jphysiol.1993.sp019910. [DOI] [PMC free article] [PubMed] [Google Scholar]
- Ward SM, Burns AJ, Torihashi S, Sanders KM. Mutation of the proto-oncogene c-kit blocks development of interstitial cells and electrical rhythmicity in murine intestine. The Journal of Physiology. 1994;480:91–97. doi: 10.1113/jphysiol.1994.sp020343. [DOI] [PMC free article] [PubMed] [Google Scholar]
- Zholos AV, Baidan LV, Shuba MF. Properties of the late transient outward current in isolated intestinal smooth muscle cells of the guinea-pig. The Journal of Physiology. 1991;443:555–574. doi: 10.1113/jphysiol.1991.sp018851. [DOI] [PMC free article] [PubMed] [Google Scholar]