Abstract
Membrane potential recordings were made from longitudinal smooth muscle cells of the guinea-pig urethra using conventional microelectrode techniques.
Smooth muscle cells of the urethra developed spontaneous transient depolarizations (STDs) and slow waves. Single unit STDs had amplitudes of approximately 5 mV and slow waves seemed to occur as amplitude multiples of single unit STDs.
STDs and slow waves were abolished by niflumic acid or low chloride solution and also by cyclopiazonic acid (CPA), BAPTA or high concentrations of caffeine. Lower concentrations of caffeine abolished slow waves but not STDs. Nifedipine inhibited slow waves but not STDs.
When stochastic properties of STDs were examined, it was found that the intervals between occurrences were not well modelled by Poisson statistics, instead the STDs appeared to be clustered.
Transmural stimulation evoked excitatory junctional potentials (EJPs) and triggered slow waves which were abolished by either α,β-methylene-ATP or tetrodotoxin. Evoked slow waves were also abolished by caffeine, co-application of caffeine and ryanodine or by CPA which left EJPs unaffected.
In conclusion, smooth muscle cells of urethra exhibit STDs which are clustered rather than random events, and are the result of spontaneous Ca2+ release from intracellular stores and subsequent activation of Ca2+-activated chloride channels. STDs sum to activate L-type Ca2+ channels which contribute to the sustained phase of slow waves. Stimulation of purinoceptors by neurally released ATP initiates EJPs and also causes the release of Ca2+ from intracellular stores to evoke slow waves.
Smooth muscle of the urethra generates a level of tone sufficiently high to exceed intravesical pressure except during micturition and so maintain urinary continence. (Bridgewater et al. 1993). Tone can be generated spontaneously and is modulated by either excitatory or inhibitory neural activity (Bridgewater et al. 1993; Andersson, 1993). It has been shown that urethral smooth muscle possesses a noradrenergic excitatory innervation, a cholinergic excitatory innervation, probably a non-adrenergic, non-cholinergic (NANC) excitatory innervation, and a NANC inhibitory innervation (Ito & Kimoto, 1985; Andersson et al. 1992; Andersson, 1993). However, the cellular mechanisms generating spontaneous tone and the neural control of tone are not well understood. It has recently been reported that smooth muscle cells of the rabbit urethra exhibit spontaneous transient depolarizations (STDs) and slow waves which seem to be the underlying mechanisms of spontaneous constrictions (Hashitani et al. 1996). STDs may be generated by Ca2+ release from intracellular stores which activates chloride channels. Slow waves rely on the further involvement of L-type Ca2+ channels (Hashitani et al. 1996; Cotton et al. 1997).
The aim of the present study was to investigate the cellular mechanisms underlying both spontaneous and neurally activated membrane depolarizations in the smooth muscle of the guinea-pig urethra.
METHODS
Female guinea-pigs, weighing 150-200 g, were killed by a blow to the head and exsanguination. The urethra and bladder were removed, and the urethra was dissected free of the bladder approximately 5 mm distal to the bilateral ureter entry. The dorsal wall of the urethra was then opened longitudinally and the mucosa and periurethral connective tissues were dissected away. The outer thick striated muscle and thin circular muscle were then carefully removed leaving longitudinal smooth muscle preparations.
Longitudinal smooth muscle preparations 4-6 mm long and 3-5 mm wide were mounted with mucosal side uppermost on a Sylgard plate (Dow Corning) fixed at the bottom of a recording chamber (approximate volume 1 ml) and pinned with tungsten wires (25 μm diameter). Preparations were superfused with warmed (38°C) physiological saline at a constant flow rate (approximately 2 ml min−1). After equilibration for half an hour, individual urethral smooth muscle cells were impaled with glass capillary microelectrodes filled with 0.5 M KCl (tip resistance 150-250 MΩ). Membrane potential changes were recorded using a high input impedance amplifier (Axoclamp-2B, Axon Instruments) and displayed on a cathode-ray oscilloscope (5103 N, Tektronix Inc., Beaverton, OR, USA). After low-pass filtering (cut-off frequency 1 kHz), potential changes were digitized and stored on a personal computer for later analysis
Intramural nerves were stimulated selectively by passing brief pulses of constant current (duration 0.05-0.1 ms, intensity 5-10 mA) between a pair of electrodes (silver plate and wire) placed one below and one above the urethral preparation. The neuronal selectivity of stimulating pulses was confirmed as evoked responses were abolished by 1 μm tetrodotoxin.
The ionic composition of physiological saline was (mM): NaCl, 119.8; KCl, 5.0; MgCl2, 2.0; CaCl2, 2.5; NaHCO3, 25.0; NaH2PO4, 1.0; and glucose, 22.0. The solution was bubbled with 95 % O2 and 5 % CO2 to maintain its pH between 7.2 and 7.3. Low chloride solution was prepared by equimolar replacement of NaCl with sodium isethionate.
Drugs used were 1,2-bis(2-aminophenoxy)-ethane-N,N,N′,N′-tetraacetic acid tetrakis (acetoxymethyl) ester (BAPTA-AM), α,β-methylene-ATP, caffeine, cyclopiazonic acid (CPA), guanethidine sulfate, hyoscine chloride, nifedipine, niflumic acid, phentolamine mesylate, phenylephrine hydrochloride, tetrodotoxin and ryanodine (all from Sigma). α,β-Methylene-ATP, caffeine, guanethidine, hyoscine, phentolamine, phenylephrine and tetrodotoxin were dissolved in distilled water. BAPTA-AM, CPA, nifedipine, niflumic acid and ryanodine were dissolved in dimethyl sulphoxide and added to the physiological saline to obtain the desired concentration. The final concentration of these solvents in the physiological saline did not exceed 1:1000.
Measured values were expressed as means ± standard deviation. Statistical significance was tested using Student's t test, and probabilities of less than 5 % were considered significant. The following parameters were measured: maximum amplitude; latency, measured as the time taken from the stimulus artifact to 10 % of the peak amplitude of the events; rise time, measured as the time between 10 and 90 % of the peak amplitude of the events; half-width, measured as the time between 50 % peak amplitude on the rising and falling phases of the events.
Analytical methods
To examine the properties of spontaneous STDs, a cumulative distribution function for the intervals between STDs was constructed and tested against the cumulative distribution function for a process generating random and statistically independent events (a Poisson process) having the same mean frequency. The goodness of fit of the data to the Poisson process was tested using a single-sided Kolmogorov-Smirnov test (Cox & Lewis, 1966; Cohen et al. 1974a). The application of Durbin's transformation to the cumulative distribution of intervals allowed a second test of goodness of fit of the data to a Poisson process (Durbin, 1961; Lewis, 1964). This modification increases the power of a subsequently applied single-sided Kolmogorov-Smirnov test, so a false null hypothesis is more likely to be rejected. Finally, empirical survivor functions were constructed according to the method described by Cohen et al. 1974b (see also Bornstein, 1978). This technique allows distinctions to be found between three types of processes: (i) a series of random independent events which can be described by Poisson statistics, (ii) a clustered process which shows a higher rate of short intervals between events than does a Poisson process, (iii) an ordered process in which short intervals are rarer and intervals near the mean value are more frequent than is true for a Poisson process.
In this analysis, no assumptions were made about event amplitude distribution or unit size. Instead, STDs were identified by the maximum gradient of their rising phase after a smoothing function had been applied. If this rate exceeded a specified threshold value, the event was marked as an STD and the time corresponding to the point of maximum gradient recorded. The interval which passed before the next such time was recorded was defined as an inter-event interval and corresponded to the x-value for one point on the survivor function. When an STD had been thus identified, the membrane potential trace was monitored until its gradient returned to near zero or to a negative value, before further STDs were sought. It is possible that pairs or groups of nearly coincident STDs rose from the baseline without measurable inflexions on the rising phase of the aggregate depolarization and were therefore counted as only one event, with only one time of occurrence. This inaccuracy has the effect of reducing the number of short intervals measured, and therefore tends to make clustered occurrence of events more difficult to demonstrate by the construction of a survivor function. However, by adopting this procedure, the number of assumptions required for the analysis was reduced and the measurements could be made by implementation of an algorithm which standardized detection.
RESULTS
Spontaneous membrane potential changes in urethral smooth muscle
Longitudinal smooth muscle preparations of the guinea-pig urethra exhibited both slow waves and spontaneous transient depolarizations (STDs) (see Fig. 1). In 4 of 36 preparations studied, infrequent spontaneous hyperpolarizations were also observed.
Figure 1. Effects of nifedipine on spontaneous slow waves and STDs.
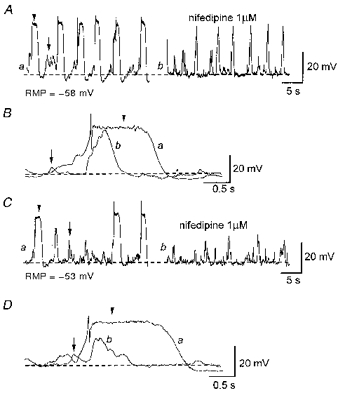
Aa, slow waves (indicated by arrowheads in each panel) and STDs (indicated by arrows in each panel) were recorded in control conditions. Ab, nifedipine (1 μm) reduced the duration of slow waves without obvious changes to their amplitude or frequency. STDs persisted in the presence of 1 μm nifedipine. B, nifedipine (1 μm) reduced the duration, but not the amplitude or rise time, of slow waves. Ca, slow waves and STDs were recorded from separate preparations in control conditions. Cb, nifedipine (1 μm) reduced not only the duration but also the amplitude of slow waves. STDs persisted in the presence of 1 μm nifedipine. D, nifedipine (1 μm) reduced not only the duration but also the amplitude of slow waves without reducing their rise times. A and B were recorded in one preparation, C and D in another. RMP, resting membrane potential.
Slow waves occurred periodically (frequency 0.9-7.5 min−1, mean 3.13 ± 2.03 min−1) and had variable amplitudes and time courses. They had peak amplitudes, measured at the plateau phase of slow waves, between 20 and 40 mV (30.5 ± 3.5 mV, n= 19), rise times between 0.2 and 1.0 s (0.59 ± 0.18 s, n= 19) and half-widths between 0.7 and 4.3 s (1.45 ± 0.58 s, n= 19). Many slow waves displayed an initial brief spike-like peak with an amplitude which sometimes exceeded that of the plateau phase. As this spike was frequently absent (see Figs 1Aa and 2Aa), measurements were made of the plateau phase amplitude only. Interestingly, the absolute peak value of the slow wave plateau ranged between -26 and -21 mV with only a small standard deviation (-23.3 ± 1.3 mV, n= 23) and this value is close to the reported equilibrium potential for chloride ions in smooth muscle (Aickin & Brading, 1982). During the plateau phase of slow waves small fluctuations in membrane potentials were often observed (see Fig. 1B and D and Fig. 6C). Since the membrane potential during the plateau was close to the reported equilibrium potential for chloride ions, these fluctuations are unlikely to reflect the activity of Cl− channels, rather they may reflect the opening of Ca2+-activated K+ channels (Bolton & Imaizumi, 1996).
Figure 2. Effects of low chloride solution and niflumic acid on slow waves and STDs.
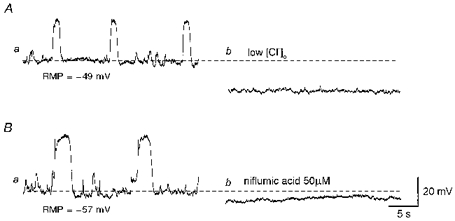
Aa, slow waves and STDs were recorded in control conditions. Ab, low chloride solution abolished both slow waves and STDs. Ba, in another preparation slow waves and STDs were recorded in control conditions. Bb, niflumic acid (50 μm) abolished slow waves and STDs. The scale bar on the right refers to both traces. RMP, resting membrane potential.
Figure 6. Effects of tetrodotoxin and nifedipine on responses produced by transmural nerve stimulation.
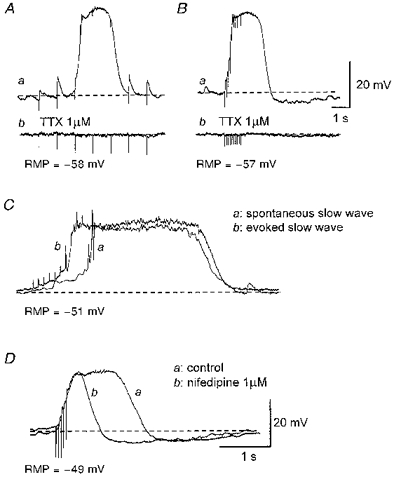
Aa, trains of impulses (supramaximal currents, 100 μs, 1 Hz, 5 s) initiated EJPs and triggered a slow wave at the third impulse. Ab, both EJPs and the evoked slow wave were abolished by 1 μm tetrodotoxin (TTX). Ba, trains of impulses (supramaximal currents, 100 μs, 10 Hz, 1 s) invariably evoked a slow wave which was abolished by 1 μm tetrodotoxin (Bb). An evoked slow wave (Cb) had similar amplitude and time course to a spontaneous slow wave (Ca). Da, nifedipine (1 μm) reduced the duration of the slow wave without reducing its amplitude or rise time (Db). A and B were recorded from one preparation; C and D were recorded from 2 different preparations. The scale bars in B also refer to A. The scale bars in D also refer to C. RMP, resting membrane potential.
STDs occurred irregularly and had smaller amplitudes and faster time courses than did slow waves. In five tissues, STDs had peak amplitudes between 3 and 20 mV (7.2 ± 1.9 mV), rise times between 31 and 450 ms (183 ± 37 ms) and half-widths between 93 and 686 ms (291 ± 54 ms).
Resting membrane potentials were defined as the stable negative potential level between slow waves and lay between -42 and -65 mV (-50.8 ± 4.8 mV, n= 36).
Slow waves and STDs persisted in tetrodotoxin (1 μm; n= 6), phentolamine, an α-adrenergic receptor antagonist (1 μm; n= 5), guanethidine, which inhibits transmitter release from sympathetic nerves (10 μm; n= 5), hyoscine, a muscarinic receptor antagonist (1 μm; n= 3) or α,β-methylene-ATP (10 μm; n= 6), suggesting that both were myogenic events.
Effects of nifedipine on slow waves and STDs
In 11 of 15 preparations studied, nifedipine reduced the duration of slow waves without changing their amplitude, rise time or frequency (Fig. 1A and B). In the presence of nifedipine, slow waves had half-widths of 0.3-0.7 s (0.49 ± 0.15 s, P < 0.05), peak amplitudes between 25 and 41 mV (30.3 ± 4.2 mV, P > 0.05), rise times between 0.3 and 0.8 s (0.53 ± 0.11 s, P > 0.05) and frequencies between 1.6 and 7.3 min−1 (4.95 ± 2.3 min−1, P > 0.05). Figure 1B shows a comparison of the time courses of slow waves recorded in control conditions and in the presence of nifedipine. This indicates that slow waves consist of two components; a nifedipine-insensitive component which initiates a slow wave followed by a nifedipine-sensitive component which contributes to the plateau phase.
In the remaining four preparations studied, however, nifedipine reduced not only the durations but also the peak amplitudes of slow waves (Fig. 1Ca and Cb). Figure 1D shows a comparison of the time courses of slow waves in control conditions and in the presence of nifedipine. In two of four preparations, the amplitudes of slow waves were reduced sufficiently for slow waves not to be distinguished from STDs.
In five preparations in which the effects of nifedipine on STDs was examined, nifedipine did not inhibit STDs. Thus STDs had peak amplitudes between 3 and 19 mV (7.1 ± 1.7 mV, P > 0.05), rise times between 37 and 486 ms (173 ± 38 ms, P > 0.05) and half-widths between 101 and 669 s (283 ± 49 ms, P > 0.05).
Role of membrane chloride conductance in the generation of slow waves and STDs
Since the absolute peak membrane potential of slow waves was found to be close to the equilibrium potential for chloride ions (between -20 and -30 mV; Aickin & Brading, 1982), the contribution of a chloride conductance to the generation of STDs and slow waves was investigated. To test this idea, the effects of low chloride-containing solution and of niflumic acid, a blocker of Ca2+-activated Cl− channels (Large & Wang, 1996), were examined.
Figure 2A shows the effect of low chloride on slow waves and STDs. Slow waves and STDs were abolished and the membrane hyperpolarized (18.5 ± 2.1 mV, n= 3) (Fig. 2Ab). After switching back to physiological saline, membrane potentials gradually recovered to control levels and slow waves and STDs were restored (n= 3).
Figure 2B shows the effect of niflumic acid on slow waves and STDs. Niflumic acid (50 μm) abolished both slow waves and STDs and hyperpolarized the membrane (4.3 ± 1.1 mV, n= 3) (Fig. 2Bb). After washout of niflumic acid, membrane potentials recovered to control levels and slow waves and STDs were restored (n= 3).
Role of intracellular Ca2+ stores in generating slow waves and STDs
Since both slow waves and STDs were abolished by niflumic acid, Ca2+-activated Cl− channels presumably contribute to their generation. To test for the involvement of intracellular Ca2+ stores in the generation of slow waves and STDs, the effects of caffeine, CPA and BAPTA, agents which disrupt the intracellular handling of Ca2+, were studied.
Figure 3A shows the effect of low concentration caffeine. Caffeine, at 1 mM, abolished slow waves, but not STDs, and caused a significant hyperpolarization of the membrane (12 ± 3.4 mV, n= 5). After washout of caffeine, membrane potentials recovered to control levels and slow waves were restored (n= 5). A higher concentration of caffeine (10 mM) abolished both slow waves and STDs with an accompanying membrane hyperpolarization (12.8 ± 2.6 mV, n= 5) (Fig. 3Bb). These effects of caffeine were reversed following washout (n= 5).
Figure 3. Effects of caffeine, CPA and BAPTA on slow waves and STDs.
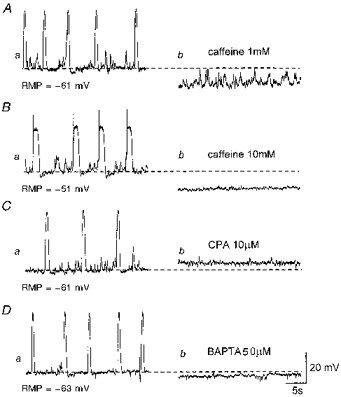
Aa, slow waves and STDs were recorded in the presence of nifedipine (1 μm). Ab, caffeine (1 mM) abolished slow waves but not STDs. Ba, slow waves and STDs were recorded from a separate preparation in control conditions. Bb, caffeine (10 mM) abolished both slow waves and STDs. Ca, slow waves and STDs were recorded in the presence of nifedipine (1 μm). Cb, CPA (10 μm) abolished both slow waves and STDs. Da, slow waves and STDs were recorded in the presence of nifedipine (1 μm). Db, BAPTA (50 μm) abolished both slow waves and STDs. A, C and D were recorded in one preparation; B was recorded in another. The scale bars on the right refer to all traces. RMP, resting membrane potential.
Figure 3C shows the effect of CPA, an inhibitor of Ca2+-ATPase. CPA (10 μm) abolished both slow waves and STDs and depolarized the membrane (6.2 ± 2.2 mV, n= 5) (Fig. 3Cb). After washout of CPA, membrane potentials recovered to control levels and slow waves and STDs were restored (n= 5).
Figure 3D shows the effect of BAPTA, a chelator of intracellular Ca2+. BAPTA (50 μm) irreversibly abolished both slow waves and STDs and hyperpolarized the membrane (4.1 ± 2.1 mV, n= 3) (Fig. 3Db).
Slow waves as summations of STDs
Since slow waves and STDs have similar pharmacological properties, it may be that slow waves arise through the summation of STDs. Indeed, when L-type Ca2+ channels were blocked by nifedipine, multiple steps were often detected on the rising phase of slow waves (see Fig. 4). The amplitudes of single unit STDs would be expected to vary in preparations where neighbouring smooth muscle cells are coupled to compose a syncytium, allowing the propagation of electrical signals. However, remote electrical events have dramatically smaller amplitudes and somewhat slower rise times than similar events occurring near the recording electrode (Tomita, 1970; Purves, 1976). Single unit events were included only when their maximum rate of rise exceeded a specified threshold, so the analysis was restricted to events occurring close to the recording electrode. Single unit STDs which were detected using the procedure described in Methods had peak amplitudes between 2.3 and 7.5 mV (4.7 ± 0.8 mV, n= 8), rise times between 34 and 93 ms (54 ± 12 ms, n= 8) and half-widths between 85 and 221 ms (137 ± 33 ms, n= 8). The steps seen on the rising phase of summed events, including slow waves, frequently had amplitudes and rise times similar to those of single unit STDs (Fig. 4Ac and Bb). Some steps had amplitudes approximately 2 or 3 times as large as those of single unit STDs, suggesting that 2 or 3 units arose simultaneously (Fig. 4Bc).
Figure 4. Summation of single unit STDs.
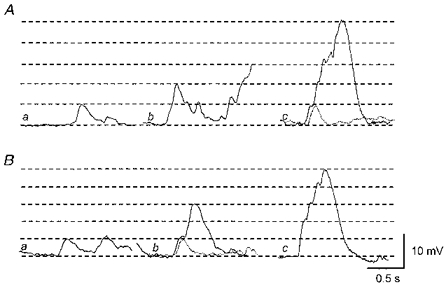
Aa, a single unit STD was recorded in the presence of nifedipine (1 μm). Ab, summation of 2 units. Ac, summation of 5 units. The superimposed dotted trace indicates a single unit. Ba, in a separate preparation, a single unit STD was recorded in the presence of 1 μm nifedipine. Bb, summation of 3 units. The superimposed dotted trace again indicates a single unit. Bc, summation of 5 units. A and B were recorded from 2 different tissues. The scale bars on the right refer to all traces. The horizontal lines indicate amplitudes of single unit STDs in each trace.
Statistics of the generation of STDs
It may be that an accelerating mechanism enhances summation of STDs; however, such summations could be the result of random coincident occurrence of two or three single unit STDs. To see whether STDs occur at random, cumulative distributions were constructed from interval measurements obtained from eight preparations in which L-type Ca2+ channels were blocked by nifedipine. If STDs were random statistically independent events, then they would occur at intervals described by Poisson statistics. In each case, the cumulative distribution function for the intervals was tested against the cumulative distribution function for a Poisson process having the same mean frequency of occurrence, using a single-sided Kolmogorov-Smirnov test (see details in Cohen et al. 1974a). Table 1 shows the results of these tests on data obtained from four preparations in which STDs were present, but slow waves were absent, and from four other preparations which displayed both STDs and slow waves. All eight cases were found to be significantly different to Poisson processes with corresponding mean frequencies.
Table 1.
Results of goodness of fit tests between the data and Poisson distributions
| (Cumulative distribution) | (Durbin's transform) | ||||||
|---|---|---|---|---|---|---|---|
| Cell | Slow waves | λ (s−1) | N | D√N | P | D√N | P |
| I | No | 0.246 | 71 | 1.399 | < 0.05 | 1.448 | < 0.05 |
| II | No | 0.325 | 63 | 1.278 | < 0.05 | 1.296 | < 0.05 |
| III | No | 0.590 | 45 | 3.086 | < 0.01 | 3.440 | < 0.01 |
| IV | No | 0.302 | 51 | 1.621 | < 0.01 | 1.758 | < 0.01 |
| V | Yes | 1.550 | 123 | 1.954 | < 0.01 | 1.981 | < 0.01 |
| VI | Yes | 1.022 | 303 | 3.120 | < 0.01 | 4.048 | < 0.01 |
| VII | Yes | 2.128 | 249 | 4.606 | < 0.01 | 5.792 | < 0.01 |
| VIII | Yes | 0.615 | 116 | 5.021 | < 0.01 | 5.129 | < 0.01 |
Results from 8 preparations, 4 of which displayed no slow waves and 4 with slow waves present. The mean frequency (λ), sample size (N) and results of single-sided Kolmogorov–Smirnov tests on the cumulative distribution of intervals compared with a Poisson process of the same mean frequency are shown. Maximum deviation (D√N) from the Poisson distribution, and the significance of this deviation (P) are given for tests applied to cumulative distributions of intervals, and to the same distributions after application of Durbin's transform.
Applying Durbin's transformation to the cumulative distribution allowed a more powerful test of goodness of fit of the data to a Poisson process of the same mean frequency (Durbin, 1961; Lewis, 1964; Cohen et al. 1974a). The results of applying a single-sided Kolmogorov-Smirnov test to the transformed distributions are shown in Table 1 and in each case the same critical point is exceeded as for the test on the untransformed cumulative distribution. These analyses show that the process which generates STDs is not well described by Poisson statistics.
Having found the statistics of STD generation to be significantly different from Poisson statistics, the nature of the difference was examined by constructing the ln(survivor) function for each data set (see details in Cohen et al. 1974b). For a Poisson process, the ln(survivor) function is a straight line whose gradient depends upon the mean frequency of events. Figure 5 shows typical ln(survivor) curves obtained from two different preparations. Figure 5A shows a curve plotted for the range of intervals obtained from a preparation which exhibited STDs but not slow waves (cell I, Table 1), while Fig. 5B shows the curve obtained from a preparation which exhibited both slow waves and STDs (cell VII, Table 1). Similar curves were obtained from the other six preparations examined. For short intervals, the empirical curves deviated below the straight line corresponding to a Poisson process of the same mean frequency, indicating that STDs occurred with a higher number of short intervals than expected for a Poisson process. This observation, like the tests applied to the cumulative distribution of intervals, suggests that STDs are not random and independent events. Deviation below the Poisson survivor line at short intervals is characteristic of clustered processes, in which the probability of the occurrence of an event is enhanced in the period immediately following an event.
Figure 5. ln(survivor) curves plotted from the data obtained from urethral smooth muscle preparations.
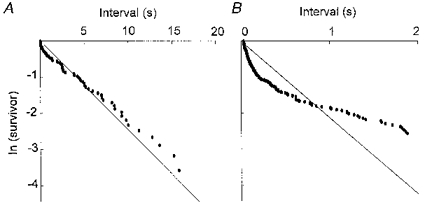
A, the empirical ln(survivor) curve plotted for the whole range of intervals obtained from a preparation which exhibited STDs but not slow waves. B, the empirical ln(survivor) curve plotted for the partial range of intervals obtained from a preparation which exhibited both slow waves and STDs. All data were obtained in the presence of 1 μm nifedipine. In each case, the straight line represents the ln(survivor) curve predicted for a Poisson process of random and statistically independent events of mean frequency equal to that recorded. The empirical curves lie below the Poisson prediction for short intervals, indicating that there is an excess of closely spaced events. A, cell I of Table 1; B, cell VII of Table 1.
Responses produced by transmural nerve stimulation
In six of ten preparations of longitudinal smooth muscle of the urethra where the responses to trains of stimuli applied at low frequency (1 Hz) were examined, a single impulse evoked an excitatory junctional potential (EJP) (Fig. 6Aa). EJPs had peak amplitudes between 1.8 and 4.4 mV (3.3 ± 1.3 mV, n= 6), latencies between 18 and 52 ms (33 ± 6 ms, n= 6), rise times between 27 and 71 ms (38 ± 14 ms, n= 6), and half-widths between 115 and 334 ms (211 ± 39 ms, n= 6). The time course of decay of EJPs could be described by a single exponential with a time constant between 109 and 324 ms (257 ± 36 ms, n= 6). These values are similar to those of purinergic EJPs recorded from other smooth muscle (Bramich & Brading, 1996; Hashitani et al. 1998). EJPs had somewhat faster rise times and longer half-widths than did STDs. In the other four preparations where a single impulse failed to initiate an EJP, EJPs could often be detected by the second or third impulse during trains of stimuli. During a train of stimuli, slow waves were often triggered either with or without obvious EJPs (evoked slow waves) (Fig. 6Aa). In the 25 preparations where trains of stimuli were presented at higher frequency (10 or 20 Hz), evoked slow waves were triggered (Fig. 6Ba) unless the stimulation was applied shortly after the occurrence of a spontaneous slow wave. This interaction between spontaneous slow waves and evoked slow waves suggests that the same intracellular pathway was involved in their generation. Similarly, when two successive trains of impulses were delivered at a short interval, the second train could initiate EJPs but failed to trigger slow waves. This suggested that a depletion of intracellular messengers may be responsible for the failure of slow wave generation, and that neither attenuation of transmitter release nor desensitization of the postjunctional receptors had occurred.
Evoked slow waves had similar properties to spontaneous slow waves (Fig. 6C). Thus evoked slow waves had peak amplitudes between 21 and 38 mV (28.9 ± 3.1 mV, n= 25), rise times between 0.2 and 0.9 s (0.47 ± 0.13 s, n= 23) and half-widths between 0.7 and 4.1 s (1.42 ± 0.54 s, n= 23). In all ten preparations in which nifedipine reduced the duration but not the amplitude of spontaneous slow waves, nifedipine also reduced the duration of evoked slow waves without changing their amplitude or rise time (Fig. 6D). In the presence of nifedipine, evoked slow waves had peak amplitudes between 19 and 36 mV (28.3 ± 4.1, n= 12), rise times between 0.2 and 0.9 s (0.47 ± 0.15, n= 10) and half-widths between 0.3 and 0.9 s (0.52 ± 0.17, n= 10). Similarly, nifedipine reduced not only the duration but also the amplitude of evoked slow waves in all four preparations in which nifedipine reduced the amplitude of spontaneous slow waves.
Both EJPs and evoked slow waves were abolished by tetrodotoxin (1 μm; n= 5) (Fig. 6Ab and Bb). Phenylephrine, an α-adrenergic agonist (1 μm), increased the frequency of spontaneous slow waves and caused a sustained depolarization (11.6 ± 1.6 mV, n= 3, Fig. 7A). However, both EJPs and evoked slow waves were not inhibited by either phentolamine (1 μm; n= 5) or guanethidine (10 μm; Fig. 7Cb, n= 5). Hyoscine (1 μm) also failed to inhibit evoked slow waves (n= 3). α,β-Methylene-ATP increased the frequency of spontaneous slow waves transiently and caused a transient depolarization (16.3 ± 3.8 mV, n= 5, Fig. 7B) which recovered to control levels during continuous exposure to α,β-methylene-ATP. In preparations where purinoceptors were desensitized in this manner, transmural nerve stimulation initiated neither EJPs nor evoked slow waves (Fig. 7C c). EJPs and evoked slow waves were restored after washout of α,β-methylene-ATP (n= 5).
Figure 7. Effects of phenylephrine, α,β-methylene-ATP and guanethidine on slow waves.
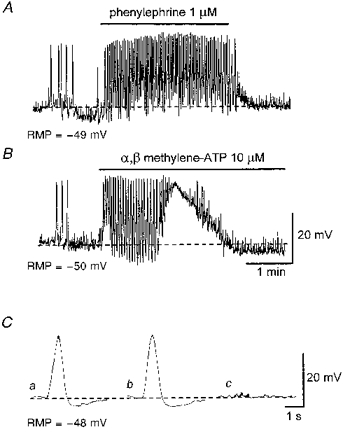
A, phenylephrine (1 μm) increased the frequency of spontaneous slow waves and caused a sustained depolarization. B, α,β-methylene-ATP (10 μm) caused a transient increase in the frequency of spontaneous slow waves and a transient depolarization. Ca, an averaged slow wave recorded in the presence of 1 μm nifedipine. Cb, guanethidine (10 μm) did not effect the evoked slow wave. Cc, α,β-methylene-ATP (10 μm) abolished both the evoked slow wave and EJPs. Each trace in C is an average of 3-5 recordings. The scale bars in B also refer to A. The scale bars in C refer to all traces in C. RMP, resting membrane potential.
Role of intracellular Ca2+ stores in generating evoked slow waves
It is possible that neurally released ATP initiates evoked slow waves using the same pathway as spontaneous slow waves, perhaps involving Ca2+ release from an intracellular store. To test for such an involvement, the following experiments were performed in the presence of 1 μm nifedipine.
Figure 8A shows the effect of caffeine on evoked slow waves. Caffeine (3 mM) hyperpolarized the membrane (13.2 ± 2.8 mV, n= 4) and abolished evoked slow waves (Fig. 8Ab). In the presence of caffeine, the amplitude of EJPs was increased, presumably due to hyperpolarization of the membrane. This suggested that caffeine did not greatly attenuate transmitter release. After washout of caffeine, membrane potentials gradually recovered to control levels and slow waves could again be evoked.
Figure 8. Effects of caffeine, caffeine plus ryanodine and CPA on evoked slow waves.
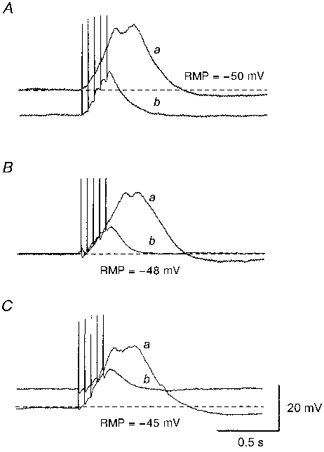
Aa, in the presence of 1 μm nifedipine, slow waves were evoked by trains of impulses (supramaximal currents, 100 μs, 20 Hz, 0.25 s). Ab, caffeine (3 mM) abolished slow waves leaving residual responses which appeared to be summed EJPs. Ba, in the presence of nifedipine (1 μm) slow waves were evoked by similar trains of impulses. Bb, co-application of caffeine (3 mM) and ryanodine (10 μm) irreversibly abolished evoked slow waves and left summed EJPs after 1 h washout. Cb, CPA (10 μm) abolished evoked slow waves, again leaving summed EJPs. All traces were recorded in the same preparation and each trace was an average of 3-5 recordings. The scale bars on the right refer to all traces. RMP, resting membrane potential.
To ensure adequate depletion of intracellular Ca2+ stores, the effect of co-application of 3 mM caffeine and 10 μm ryanodine on evoked slow waves was studied. Co-application of caffeine and ryanodine caused a hyperpolarization of the membrane (14.1 ± 3.3 mV, n= 5) and abolished evoked slow waves. However, EJPs could still be evoked and summed as was the case when caffeine alone was applied. After a 30 min application of caffeine and ryanodine, washout restored membrane potentials to control levels. However, in contrast to the case when caffeine alone was applied, evoked slow waves were not restored 1 h after washout was commenced (Fig. 8Bb).
To further confirm the involvement of intracellular Ca2+ stores, the effect of CPA (10 μm) on the evoked slow waves was studied. CPA depolarized the membrane (5.7 ± 2.1 mV, n= 4) and abolished evoked slow waves (Fig. 8C b). In the presence of CPA, EJPs could still be detected, indicating that CPA did not attenuate the transmitter release. After washout of CPA, the membrane potential recovered to the control level and evoked slow waves were restored.
DISCUSSION
In the longitudinal smooth muscle of the guinea-pig urethra, slow waves and STDs may be generated by the spontaneous release of Ca2+ from intracellular stores, which activates Ca2+-activated Cl− channels. Their pharmacological properties are consistent with spontaneous depolarizations which have been observed in smooth muscle cells of both rabbit and sheep urethra (Hashitani et al. 1996; Cotton et al. 1997). Similar mechanisms to generate either spontaneous depolarizations or underlying spontaneous transient inward currents (STICs) have been confirmed in other smooth muscle preparations (Van Helden, 1991, 1993; Wang et al. 1992; Hogg et al. 1993; Cotton et al. 1997). L-type Ca2+ channels were activated by depolarizations resulting from the opening of Ca2+-activated Cl− channels, and contributed to the plateau of slow waves as reported in both rabbit and sheep urethra (Hashitani et al. 1996; Cotton et al. 1997). Thus two types of channels are activated concurrently to excite urethral smooth muscle as is suggested to occur in variety of smooth muscles (Large & Wang, 1996).
In the present study, the amplitude of nearby single unit STDs was estimated to be approximately 5 mV and STDs having amplitudes that were integral multiples of single unit STDs were often observed. Furthermore, on the upstroke of slow waves, steps that had similar amplitudes and rise times to single unit STDs were often observed, suggesting slow waves may be summed STDs. This idea is supported by the finding that STDs and slow waves have almost identical pharmacological properties.
The results presented here confirm that STDs are clustered rather than random, independent events, suggesting that after a single unit STD had occurred, the probability of the occurrence of an STD was increased. In tissues which displayed both slow waves and STDs, STDs were intensely clustered if slow waves were interpreted as summations of STDs.
Intracellular Ca2+ stores in smooth muscle contain both ryanodine receptors and inositol trisphosphate (InsP3) receptors (Iino et al. 1988; Berridge, 1993), therefore both calcium-induced calcium release (CICR) and InsP3-induced calcium release (IICR) are candidate mechanisms for promoting clustering of STDs and generation of slow waves. An interesting observation was the effect of low concentrations of caffeine, which abolished slow waves but not STDs. Caffeine has various effects on intracellular Ca2+ stores in smooth muscle, e.g. stimulating CICR (Berridge, 1993) and inhibiting InsP3-mediated Ca2+ liberation (Parker & Ivorra, 1991). It is unlikely that low concentrations of caffeine (1 mM) fully depleted Ca2+ stores, therefore caffeine may inhibit slow waves through the inhibition of InsP3-mediated Ca2+ liberation from intracellular stores (Parker & Ivorra, 1991). Caffeine is also known to be a phosphodiesterase inhibitor and might inhibit Ca2+ release, indirectly, through the elevation of intracellular cGMP (Lincoln & Cornwell, 1993). However, this mechanism was reported not to be responsible for the inhibitory action of caffeine on Ca2+ release from intracellular stores (Parker & Ivorra, 1991). Furthermore in rabbit urethral smooth muscle neither sodium nitroprusside nor 8-bromo-cyclic GMP abolished slow waves (Hashitani et al. 1996). Higher concentrations of caffeine (10 mM) were required to stimulate Ca2+ release, leading to the depletion of Ca2+ stores and the disappearance of both slow waves and STDs. Thus slow waves may be generated by large Ca2+ releases either via periodical surges of InsP3 production (Berridge, 1993) or following InsP3-mediated Ca2+ releases which activate Ca2+-mediated positive feedback on InsP3 receptors (Iino et al. 1993). These procedures could occur either within individual cells or across coupled cells by the diffusion of either Ca2+ or InsP3 through gap junctions (Berridge, 1993). Conversely, STDs may be generated by localized Ca2+ release which may involve CICR without activating any further positive feedback mechanisms and, in this case, single unit STDs may arise without involving InsP3.
A voltage-dependent mechanism might be involved in the generation of slow waves. In rabbit urethral smooth muscle, high concentrations of the ATP-sensitive K+ channel opener, levcromakalim (100 μm), hyperpolarized the membrane and prevented the generation of slow waves (Waldeck et al. 1998). It is possible that hyperpolarization abolishes nifedipine-resistant components of slow waves by inhibiting InsP3 production (Itoh et al. 1992) which may be required to activate Ca2+-activated Cl− channels rather than by inhibiting the Ca2+-activated Cl− channels directly. In the present study, low chloride solution, niflumic acid, caffeine and BAPTA hyperpolarized, while CPA depolarized the membrane. If some Ca2+-activated Cl− channels are active under resting conditions, either an inhibition of chloride conductance or a reduction in [Ca2+]i may cause hyperpolarization. Conversely, CPA should prevent uptake of Ca2+ into intracellular stores and may cause a sustained increase in [Ca2+]i so depolarizing the membrane by opening Ca2+-activated Cl− channels. However, slow waves or STDs would not occur since Ca2+ stores could not be refilled and no longer give rise to pulsatile Ca2+ release.
In the longitudinal smooth muscle of the guinea-pig urethra, transmural nerve stimulation initiated EJPs and triggered slow waves which were abolished after the desensitization of purinoceptors by α,β-methylene-ATP. Evoked slow waves, which were presumably triggered by neurally released ATP, were abolished by co-application of caffeine and ryanodine and by CPA, indicating that ryanodine-sensitive Ca2+ stores are involved in the generation of evoked slow waves (Iino et al. 1988). Since a low concentration of caffeine by itself prevented the stimulation of evoked slow waves, it is possible that the activation of purinoceptors stimulates InsP3 production which causes Ca2+ release (Parker & Ivorra, 1991). Indeed, receptors which have been known to activate Ca2+-activated Cl− channels are coupled to a guanine nucleotide-binding protein to produce InsP3 (Large & Wang, 1996). It has been reported that ATP can stimulate InsP3 production through the activation of the P2 receptor; however, this effect was insensitive to α,β-methylene-ATP (Tawada et al. 1987). This is in contrast to responses observed in the present study, suggesting a different subtype of purinoceptor was involved. Thus in urethral smooth muscle, neurally released ATP may initiate slow waves through Ca2+-mediated positive feedback (Iino et al. 1993) which amplifies initial CICR induced by Ca2+ entry through ATP-gated non-selective channels. This is consistent with previous reports in rat portal vein in which ATP increases intracellular Ca2+ through CICR and its effect is blocked by either the co-application of caffeine and ryanodine or the absence of extracellular Ca2+, but not by application of heparin (Pacaud et al. 1994). Nerve stimulation applied shortly after a spontaneous slow wave failed to evoke a slow wave, suggesting that the same population of stores which contain both InsP3 receptors and ryanodine receptors were involved in generating both spontaneous and evoked slow waves.
Noradrenaline (NA) is believed to be the main excitatory transmitter in urethra (Andersson, 1993) and the activation of α-adrenoceptors is generally believed to stimulate Ca2+-activated Cl− channels through InsP3 production (Large & Wang, 1996). Therefore, it would be expected that neurally released NA would initiate slow waves in urethral smooth muscle. As in the case of circular smooth muscle of the rabbit urethra (Hashitani et al. 1996), applied α-agonist increased the frequency of slow waves and depolarized the membrane of the longitudinal smooth muscle of the guinea-pig urethra, showing that this muscle indeed contains α-adrenergic receptors. However, neither phentolamine nor guanethidine inhibited evoked slow waves. This unexpected result might arise from differences in the innervation of the longitudinal and circular smooth muscle in which contractile studies had been carried out. In the longitudinal smooth muscle of the guinea-pig urethra, neurally released NA may be insufficient to activate α-adrenergic receptors.
Nifedipine reduced the duration of slow waves but its effect on the amplitude of slow waves varied amongst preparations. In isolated smooth muscle cells of the sheep urethra, where STDs had uniform amplitude and invariably triggered action potentials, nifedipine reduced not only the duration but also the amplitude of action potentials (Cotton et al. 1997). This observation may apply for individual smooth muscle cells in tissue preparations. However, when recordings are made from a cell in an intact syncytium, electrical signals originating in other cells are detected (Tomita, 1970) and so variations in the shape, amplitude and frequency of STDs are seen.
Together the data suggest that each quantal Ca2+ release from intracellular stores activates Ca2+-activated Cl− channels to cause a single unit STD. STDs can sum either spontaneously or as a consequence of the activation of purinoceptors activating L-type Ca2+ channels which enhance and prolong the depolarization phase of the slow wave.
Acknowledgments
The authors are grateful to Professor G. D. S. Hirst for helpful comments on the manuscript. This project was supported by a research grant from the National Health and Medical Research Council of Australia. H. H. was financially supported by the Uehara Memorial Medical Research Foundation.
References
- Aickin CC, Brading AF. Measurement of intracellular chloride in guinea-pig vas deferens by ion analysis, 36chloride efflux and micro-electrodes. The Journal of Physiology. 1982;326:139–154. doi: 10.1113/jphysiol.1982.sp014182. [DOI] [PMC free article] [PubMed] [Google Scholar]
- Andersson K-E. Pharmacology of lower urinary tract smooth muscles and penile erectile tissues. Pharmacological Reviews. 1993;45:253–307. [PubMed] [Google Scholar]
- Andersson K-E, Pascual AG, Persson K, Forman A, Tøttrup A. Electrically-induced, nerve-mediated relaxation of rabbit urethra involves nitric oxide. Journal of Urology. 1992;147:253–259. doi: 10.1016/s0022-5347(17)37208-7. [DOI] [PubMed] [Google Scholar]
- Berridge MJ. Inositol trisphosphate and calcium signalling. Nature. 1993;361:315–324. doi: 10.1038/361315a0. [DOI] [PubMed] [Google Scholar]
- Bolton TB, Imaizumi Y. Spontaneous transient outward currents in smooth muscle cells. Cell Calcium. 1996;20:141–152. doi: 10.1016/s0143-4160(96)90103-7. [DOI] [PubMed] [Google Scholar]
- Bornstein JC. Spontaneous multiquantal release at synapses in guinea-pig hypogastric ganglia: evidence that release can occur in bursts. The Journal of Physiology. 1978;282:375–398. doi: 10.1113/jphysiol.1978.sp012470. [DOI] [PMC free article] [PubMed] [Google Scholar]
- Bramich NJ, Brading AF. Electrical properties of smooth muscle in the guinea-pig urinary bladder. The Journal of Physiology. 1996;492:185–198. doi: 10.1113/jphysiol.1996.sp021300. [DOI] [PMC free article] [PubMed] [Google Scholar]
- Bridgewater M, MacNeill HF, Brading AF. Regulation of urethral tone in pig urethral smooth muscle. Journal of Urology. 1993;150:223–228. doi: 10.1016/s0022-5347(17)35451-4. [DOI] [PubMed] [Google Scholar]
- Cohen I, Kita H, Van der Kloot W. The intervals between miniature end-plate potentials in the frog are unlikely to be independently or exponentially distributed. The Journal of Physiology. 1974a;236:327–339. doi: 10.1113/jphysiol.1974.sp010437. [DOI] [PMC free article] [PubMed] [Google Scholar]
- Cohen I, Kita H, Van der Kloot W. The stochastic properties of spontaneous quantal release of transmitter at the frog neuromuscular junction. The Journal of Physiology. 1974b;236:341–361. doi: 10.1113/jphysiol.1974.sp010438. [DOI] [PMC free article] [PubMed] [Google Scholar]
- Cotton KD, Holleywood MA, McHale NG, Thornbury KD. Ca2+ current and Ca2+-activated chloride current in isolated smooth muscle cells of the sheep urethra. The Journal of Physiology. 1997;505:121–131. doi: 10.1111/j.1469-7793.1997.121bc.x. [DOI] [PMC free article] [PubMed] [Google Scholar]
- Cox DR, Lewis PAW. The Statistical Analysis of Series of Events. Methuen, London: 1966. [Google Scholar]
- Durbin J. Some methods of constructing exact tests. Biometrika. 1961;48:41–55. [Google Scholar]
- Hashitani H, Van Helden DF, Suzuki H. Properties of spontaneous depolarizations in circular smooth muscle cells of rabbit urethra. British Journal of Pharmacology. 1996;118:1627–1632. doi: 10.1111/j.1476-5381.1996.tb15584.x. [DOI] [PMC free article] [PubMed] [Google Scholar]
- Hashitani H, Windle A, Suzuki H. Neuroeffector transmission in arterioles of the guinea-pig choroid. The Journal of Physiology. 1998;510:209–223. doi: 10.1111/j.1469-7793.1998.209bz.x. [DOI] [PMC free article] [PubMed] [Google Scholar]
- Hogg RC, Wang Q, Helliwell RM, Large WA. Properties of spontaneous inward currents in rabbit pulmonary artery smooth muscle cells. Pflügers Archiv. 1993;425:233–240. doi: 10.1007/BF00374172. [DOI] [PubMed] [Google Scholar]
- Iino M, Kobayashi T, Endo M. Use of ryanodine for functional removal of the calcium store in smooth muscle cells of the guinea-pig. Biochemical and Biophysical Research Communications. 1988;152:417–422. doi: 10.1016/s0006-291x(88)80730-7. [DOI] [PubMed] [Google Scholar]
- Iino M, Yamazawa T, Miyasita Y, Endo M, Kasai H. Critical intracellular Ca2+ concentration for all-or-none Ca2+ spiking in single smooth muscle cells. EMBO Journal. 1993;12:5287–5291. doi: 10.1002/j.1460-2075.1993.tb06224.x. [DOI] [PMC free article] [PubMed] [Google Scholar]
- Ito Y, Kimoto Y. Neural and non-neural mechanisms involved in urethral activity in rabbits. The Journal of Physiology. 1985;367:57–72. doi: 10.1113/jphysiol.1985.sp015814. [DOI] [PMC free article] [PubMed] [Google Scholar]
- Itoh T, Seki N, Suzuki S, Ito S, Kajikuri J, Kuriyama H. Membrane hyperpolarization inhibits agonist-induced synthesis of inositol 1,4,5-trisphosphate in rabbit mesenteric artery. The Journal of Physiology. 1992;451:307–328. doi: 10.1113/jphysiol.1992.sp019166. [DOI] [PMC free article] [PubMed] [Google Scholar]
- Large WA, Wang Q. Characteristics and physiological role of the Ca2+-activated Cl− conductance in smooth muscle. American Journal of Physiology. 1996;217:C435–454. doi: 10.1152/ajpcell.1996.271.2.C435. [DOI] [PubMed] [Google Scholar]
- Lewis PAW. A branching Poisson process model for the analysis of computer failure patterns. Journal of the Royal Statistical Society, Series B. 1964;26:398–456. [Google Scholar]
- Lincoln TM, Cornwell TL. Intracellular cyclic GMP receptor proteins. FASEB Journal. 1993;7:328–338. doi: 10.1096/fasebj.7.2.7680013. [DOI] [PubMed] [Google Scholar]
- Pacaud P, Grégorie G, Loirand G. Release of Ca2+ from intracellular stores in smooth muscle cells of rat portal vein by ATP-induced Ca2+ entry. British Journal of Pharmacology. 1994;113:457–462. doi: 10.1111/j.1476-5381.1994.tb17011.x. [DOI] [PMC free article] [PubMed] [Google Scholar]
- Parker I, Ivorra I. Caffeine inhibits inositol trisphosphate-mediated liberation of intracellular calcium in Xenopus oocytes. The Journal of Physiology. 1991;433:229–240. doi: 10.1113/jphysiol.1991.sp018423. [DOI] [PMC free article] [PubMed] [Google Scholar]
- Purves RD. Current flow and potential in a three-dimentional syncytium. Journal of Theoretical Biology. 1976;60:147–162. doi: 10.1016/0022-5193(76)90160-0. [DOI] [PubMed] [Google Scholar]
- Tawada Y, Furukawa K-I, Shigekawa M. ATP-induced calcium transients in cultured rat aortic smooth muscle cells. Journal of Biochemistry. 1987;102:1499–1509. doi: 10.1093/oxfordjournals.jbchem.a122197. [DOI] [PubMed] [Google Scholar]
- Tomita T. Electrical properties of mammalian smooth muscle. In: Bülbring E, Brading AF, Jones AW, Tomita T, editors. Smooth Muscle. London: Arnold; 1970. pp. 197–243. [Google Scholar]
- Van Helden DF. Spontaneous and noradrenaline-induced transient depolarizations in the smooth muscle of the guinea-pig mesenteric vein. The Journal of Physiology. 1991;437:511–541. doi: 10.1113/jphysiol.1991.sp018609. [DOI] [PMC free article] [PubMed] [Google Scholar]
- Van Helden DF. Pacemaker potentials in lymphatic smooth muscle of the guinea-pig mesentery. The Journal of Physiology. 1993;471:465–478. doi: 10.1113/jphysiol.1993.sp019910. [DOI] [PMC free article] [PubMed] [Google Scholar]
- Waldeck K, Ny L, Persson K, Andersson K-E. Mediators and mechanisms of relaxation in rabbit urethral smooth muscle. British Journal of Pharmacology. 1998;123:617–624. doi: 10.1038/sj.bjp.0701645. [DOI] [PMC free article] [PubMed] [Google Scholar]
- Wang Q, Hogg RC, Large WA. Properties of spontaneous inward currents recorded in smooth muscle cells isolated from the rabbit portal vein. The Journal of Physiology. 1992;451:525–537. doi: 10.1113/jphysiol.1992.sp019177. [DOI] [PMC free article] [PubMed] [Google Scholar]


