

Abstract
Two-dimensional X-ray diffraction patterns were recorded at the European Synchrotron Radiation Facility from central segments of intact single muscle fibres of Rana temporaria with 5 ms time resolution during the development of isometric contraction. Shortening at ca 0.8 times the maximum velocity was also imposed at the isometric tetanus plateau.
The first myosin-based layer line (ML1) and the second myosin-based meridional reflection (M2), which are both strong in resting muscle, were completely abolished at the plateau of the isometric tetanus. The third myosin-based meridional reflection (M3), arising from the axial repeat of the myosin heads along the filaments, remained intense but its spacing changed from 14.34 to 14.56 nm. The intensity change of the M3 reflection, IM3, could be explained as the sum of two components, I14.34 and I14.56, arising from myosin head conformations characteristic of rest and isometric contraction, respectively.
The amplitudes (A) of the X-ray reflections, which are proportional to the fraction of myosin heads in each conformation, changed with half-times that were similar to that of isometric force development, which was 33.5 ± 2.0 ms (mean ±s.d., 224 tetani from three fibres, 4 °C), measured from the end of the latent period. We conclude that the myosin head conformation changes synchronously with force development, at least within the 5 ms time resolution of these measurements.
The changes in the X-ray reflections during rapid shortening have two temporal components. The rapid decrease in intensity of the 14.56 nm reflection at the start of shortening is likely to be due to tilting of myosin heads attached to actin. The slower changes in the other reflections were consistent with a return to the resting conformation of the myosin heads that was about 60% complete after shortening of 70 nm per half-sarcomere.
Force generation in muscle is generally considered to be due to a change in conformation of the myosin head domain while it is attached to the actin filaments. The rate of force development at the start of an isometric tetanus is thought to be limited by a slow transition subsequent to the binding of myosin heads to actin. The existence of this slow transition was suggested by two lines of experimental evidence. First, mechanical measurements on isolated muscle fibres (Cecchi et al. 1982; Ford et al. 1986) showed that fibre stiffness increases faster than force following electrical stimulation. Second, time-resolved X-ray diffraction studies (Haselgrove & Huxley, 1973; Huxley et al. 1982; Cecchi et al. 1991; Martin-Fernandez et al. 1994) suggested that the motions of the myosin heads were also faster than the rise of force following stimulation.
The previous interpretation of the mechanical measurements was based on the assumption that fibre stiffness was proportional to the number of myosin heads attached to actin at any instant. It is now clear that this assumption was incorrect, because the actin and myosin filaments contribute about half of the compliance of each sarcomere (Huxley et al. 1994; Wakabayashi et al. 1994; Linari et al. 1998; Dobbie et al. 1998). Even if binding of myosin to actin and force generation were synchronous, filament compliance would produce a delay between the increase in fibre stiffness and force development.
The X-ray diffraction evidence for the existence of a slow transition between binding of myosin to actin and force generation is also open to question. It is well established that the intensity changes of several of the X-ray reflections are faster than force development, but these intensity changes may not be linearly related to the fraction of heads bound to actin. Moreover, most of the previous X-ray studies used whole muscles because of their intense diffraction, but comparisons of mechanical and structural time courses in whole muscles are compromised by heterogeneity of fibre speeds and substantial tendon compliance, which slows the rate of force development.
Here we report the first measurements of the changes in the axial myosin-based X-ray reflections during sarcomere isometric force development and during imposed rapid shortening in isolated muscle fibres, exploiting the exceptionally high brightness and low divergence of the X-ray beam at the European Synchrotron Radiation Facility. We interpret these changes as the sum of contributions from two populations of myosin heads, one characteristic of resting muscle, the other of the isometric tetanus plateau. Following electrical stimulation, the disappearance of the resting population has the same time course as the appearance of the active population, which is the same as that of force development. These results argue against the existence of a slow step between myosin-actin binding and force generation in muscle, at least within the 5 ms time resolution of our measurements. During high speed shortening the signals associated with the two populations are kinetically distinct: the signal from the active population decreases to near zero simultaneously with the drop in force, whereas those from the resting population reappear slowly during extended shortening.
METHODS
Single fibres were dissected from the lateral head of the tibialis anterior muscle of Rana temporaria after killing by decapitation and pithing (following the official regulations of the European Community Council (Directive 86/609/EEC) assimilated into Italian Government Legislation). Tendon attachments were carefully trimmed and clamped in aluminium foil clips to minimize their compliance. Fibres were mounted horizontally in the experimental trough between a capacitance gauge force transducer (resonant frequency, 35-50 kHz) and a loudspeaker motor servo-system (Lombardi & Piazzesi, 1990). Sarcomere length in the ca 2 mm fibre segment interrogated by X-rays was monitored continuously with a striation follower (Huxley et al. 1981). Two mica windows were moved close to the fibre to reduce the X-ray path in standard Ringer solution; stimulating electrodes were stuck on the top and bottom edges of opposing windows. The length of either the fibre or a selected segment was held constant by feedback from the motor position or segment length signals.
The apparatus was mounted at the ID2-SAXS beamline at the European Synchrotron Radiation Facility (ESRF), Grenoble, France, providing up to 1013 photons s−1 at 0.1 nm wavelength. The beam size at the fibre was 0.6 mm (full width half-maximum, horizontal) and 0.1 mm (vertical), and its divergence was 0.07 mrad (horizontal), 0.025 mrad (vertical). Diffraction patterns were collected on a two-dimensional, multiwire gas-filled detector (dimensions, 16 cm × 16 cm) and the associated histogramming memory. The fibre detector distance was 10 m. A fast shutter ensured that the fibre was exposed to X-rays only during the data collection period, to minimize radiation damage.
Fibres were stimulated for 600 ms at the optimal frequency for a fused tetanus. Resting sarcomere length was 2.15 μm, temperature 4°C. After the isometric plateau force (T0) had been attained, 300 ms after the beginning of stimulation, steady shortening at 2.4 μm s−1 half-sarcomere−1, 0.8 times the maximum shortening velocity (V0), was imposed. Tetani were repeated at 3 min intervals until the first sign of radiation damage (failure to respond to electrical stimulation, after ca 40 s exposure). Force, motor position, striation follower signals and X-ray time framing were recorded at 0.2 ms intervals.
X-ray diffraction data were analysed with BSL and OTOKO software packages kindly provided by Dr G. Mant (Synchrotron Radiation Source, Daresbury, UK). All images were corrected for the non-uniform sensitivity of the detector. The camera background, recorded with the fibre (but not the chamber or solution) moved out of the X-ray beam, was subtracted. Patterns were aligned using the centres of the M3 reflections, centred and mirrored. The background under each reflection was fitted by a straight line and subtracted. The M3 reflection spacing was estimated from the separation of the centres of mass of the two reflections, calibrated by assuming a spacing of 14.34 nm at rest (Haselgrove, 1975). The integration limits for time-resolved reflection intensities were: first myosin layer line (ML1), 0.016-0.070 nm−1 radially and 0.018-0.025 nm−1 along the meridian; second myosin meridional reflection (M2), 0.0048 nm−1 across the meridian and 0.045-0.049 nm−1 along it; M3, 0.014 nm−1 across the meridian and 0.066-0.073 nm−1 along it (Fig. 1A). The integration limits for ML1 were chosen to minimize the influence of the first actin layer line at 38 nm (Fig. 1B); those for M2 were chosen to eliminate the reflections at 22-24 nm (Fig. 1C), which do not index on the fundamental 43 nm periodicity of the myosin-based reflections.
Figure 1. X-ray diffraction patterns at rest and at the isometric tetanus plateau.
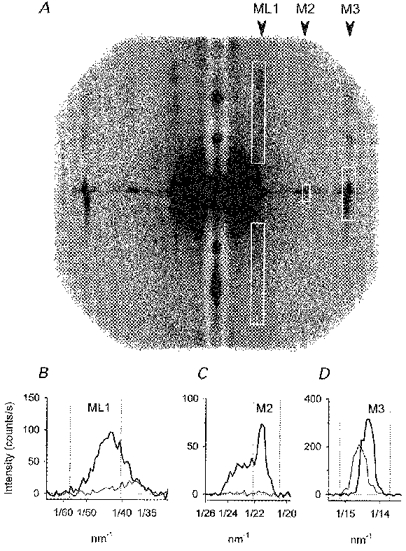
A, two-dimensional diffraction patterns at rest (upper half) and at the plateau of the isometric tetanus (lower half). Total exposure time 11 s, obtained by adding 50 ms time frames collected during 224 tetani in three fibres. The equatorial reflections were attenuated with a vertical aluminium strip in front of the detector. Arrowheads: positions of the myosin-based reflections discussed in the text. White boxes: integration limits for reflection intensities. B, intensity distributions near the first myosin layer line (ML1), obtained by vertical integration of the patterns in A at rest (thick line) and at the isometric tetanus plateau (thin line). Dotted vertical lines: integration limits used for IML1, minimizing the contribution of the first actin layer line at 38 nm. C, intensity distribution along the meridian in the region of the M2 reflection; thick and thin lines as in B; dotted vertical lines: integration limits used for IM2. D, intensity distribution along the meridian in the region of the M3 reflection; thick and thin traces as in B; dotted vertical lines: integration limits used for IM3.
RESULTS
X-ray diffraction patterns at rest and at the isometric tetanus plateau
The two-dimensional X-ray diffraction pattern from a resting muscle fibre (Fig. 1A, upper half) shows a series of layer lines associated with the quasi-helical arrangement of the myosin heads on the surface of the thick filaments. Integration of the two-dimensional patterns to give the intensity distribution in the direction parallel to the meridian (horizontal in Fig. 1A) shows that the first-order layer line (ML1) has a spacing of 43 nm at rest (Fig. 1B, thicker line), corresponding to the axial repeat of the myosin-based helix (Huxley & Brown, 1967). At the plateau of the isometric tetanus (Fig. 1A, lower half) all these layer lines become much weaker (Huxley et al. 1982), and the remaining intensity in the ML1 region (about 15 % of that at rest) was centred on a spacing of about 38 nm (Fig. 1B, thinner line), corresponding to the axial repeat of the actin helix.
The second-order myosin meridional reflection at 21.4 nm (M2; Fig. 1A and C) was not resolved from the nearby reflections at 22-24 nm (Malinchik & Lednev, 1992; Martin Fernandez et al. 1994), but all these components disappeared at the tetanus plateau (Fig. 1C, thin line). In contrast, the third-order myosin meridional reflection (M3), with resting spacing 14.34 nm, remained intense at the tetanus plateau, but its spacing increased to 14.56 nm (Fig. 1A and D). The width of the reflection across the meridian also increased (Fig. 1A), by a factor of about 2.5, indicating a reduction of lateral coherence between myosin filaments (Huxley et al. 1982).
Time course of the changes in the X-ray pattern during isometric force development
Force started to increase 7.5 ms after the start of electrical stimulation (latent period), and the plateau value (T0) was attained with a half-time (t½) of 33.5 ± 2.0 ms (mean ±s.d., 3 fibres, 224 tetani, measured from the end of the latent period). The region of the fibre in the X-ray beam shortened by less than 10 nm half-sarcomere−1 during force development (Fig. 2A). In 48 tetani in the early part of each experiment, the segment length was held constant during force development by feedback to the motor controlling fibre length. The average value of t½ for force development in these tetani was 2.3 ms greater than that in fixed-end tetani, owing to a progressive slight reduction in t½ during the experiments. There was no detectable difference between the time courses of changes in the X-ray pattern between segment length-clamped and fixed-end tetani, so the data from both protocols were combined.
Figure 2. Changes in the X-ray pattern during isometric force development and rapid shortening.
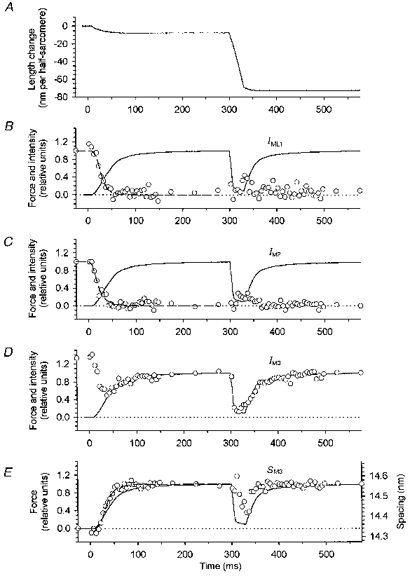
A, sarcomere length change in nanometres per half-sarcomere. B-D, force relative to isometric tetanus plateau value (continuous trace), and X-ray intensity (○) of ML1 (B), M2 (C) and M3 (D);IML1 and IM2 are relative to their resting values, IM3 is relative to the tetanus plateau value; dotted line: zero level for force and intensity. E, superimposed time courses of force and spacing of the M3 reflection; dotted line: zero force and 14.34 nm spacing. Diffraction patterns were collected in 50 ms frames just before the start of stimulation (1 frame), at the plateau of the isometric tetanus before imposed shortening (3 frames) and after force had completely redeveloped (2 frames), and in 5 ms time frames during force development (30 frames), and during the imposed shortening and force redevelopment (40 frames). Each point is the average of the data from three fibres. The total exposure time for the 5 ms time frames was 1.12 s (5 ms × 224 tetani). The dashed line in B, C and E was obtained by fitting the following equation to the X-ray points starting from the third one:
where a and b are fixed parameters representing values at the isometric plateau and at rest, respectively. t½ values in Table 1 were estimated from these fits. Mean force per cross-sectional area was 367 ± 16 kN m−2 (means ±s.e.m.).
The decrease in intensity of the first myosin layer line (IML1, Fig. 2B) and the second myosin meridional reflection (IM2, Fig. 2C) had the same latency as force development, within the resolution of the measurements, but t½ was 19.1 ± 1.1 ms for IML1 and 11.7 ± 1.0 ms for IM2, much less than that of force (Table 1). The intensity of the third myosin meridional reflection (IM3, Fig. 2D) had a more complex time course. After a similar latent period, IM3 decreased rapidly, reaching a minimum of about 50 % of its resting value about 40 ms after the start of stimulation, when force was about 0.5 T0. It then increased with a time course similar to that of the later part of force development. The spacing of the M3 reflection (SM3, Fig. 2E) appeared to decrease slightly during the latent period before increasing to its plateau value of 14.56 nm. t½ for the change in SM3 was 26.2 ± 0.8 ms, intermediate between that of IML1 and IM2 and that of force development.
Table 1.
Half-times (t1/2) of changes in myosin-based reflections during development of an isometric tetanus
| I (ms) | Iw (ms) | A (ms) | |
|---|---|---|---|
| ML1 | 19.1 ± 1.1 | — | 26.7 ± 4.4 |
| M2 | 11.7 ± 1.0 | 18.6 ± 2.7 | 24.6 ± 6.9 |
| 14.34 nm | 15.8 ± 0.5 | 24.3 ± 1.2 | 36.0 ± 4.1 |
| 14.56 nm | 40.5 ± 1.3 | 42.8 ± 1.2 | 29.1 ± 1.4 |
The t1/2 values were calculated from the equation in the legend of Fig. 2, fitted to the X-ray data starting from the third point, corresponding to the end of the latent period. I, observed intensity; Iw, intensity after correction for change in cross-meridional width; A, amplitude as defined in the text. The t1/2 for force development (weighted for the number of tetani per fibre) was 33.5 ± 2.0 ms.
Time course of the amplitudes of the myosin-based reflections
The biphasic change in IM3 (Fig. 2D) can be explained as the sum of a decreasing contribution, I14.34, from the heads with spacing 14.34 nm characteristic of resting muscle, and an increasing contribution, I14.56, from those with spacing 14.56 nm, characteristic of the isometric tetanus plateau. Thus, in each time frame:
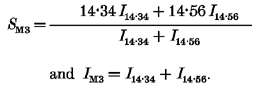 |
During the rising phase of the isometric tetanus, I14.34 fell monotonically with t½= 15.8 ± 0.5 ms (Fig. 3A, ○), intermediate between the t½ values for IML1 and IM2 of 19.1 and 11.7 ms, respectively. I14.56 (•) increased monotonically with t½= 40.5 ± 1.3 ms, slightly slower than the rise of force.
Figure 3. Separation of M3 reflection into two components and time course of the amplitudes of myosin-based reflections.
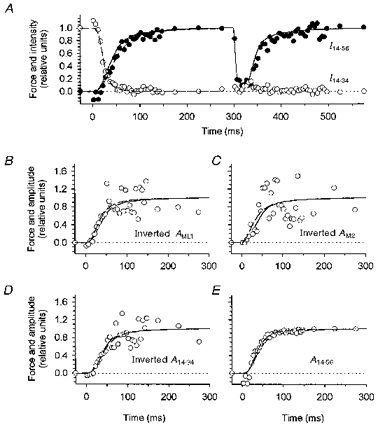
A, time course of the intensity of the 14.34 nm reflection (○, normalized for the value at rest) and the 14.56 nm reflection (•, normalized for the value at the isometric plateau) calculated as described in the text. Continuous line, force; dashed lines superimposed on the X-ray data during force development were obtained as described in Fig. 2. B-E, time course of force development (continuous line) superimposed on that of the amplitude (A) of X-ray reflections (○). For the ML1 (B), M2 (C) and 14.34 (D) reflections the amplitude was inverted for comparison with force development. Dashed lines were obtained as described in Fig. 2.
For a simple mixture of two myosin head conformations with heads leaving or joining the diffracting array at random, the fraction of heads in each conformation is proportional to the amplitude (A) of the associated X-ray reflection, i.e. the square root of its intensity (e.g. Kress et al. 1986). For meridional reflections, the increase in width across the meridian during force development results in a smaller fraction of the three-dimensional Bragg lattice being sampled by the X-ray beam, so the measured intensities should be corrected by multiplying by the width (Huxley et al. 1982). After width correction, the time courses of the amplitudes of the M2 reflection and of the 14.34 and 14.56 components of the M3 reflection were all similar to that of force (Fig. 3C-E;AM2 and A14.34 inverted for comparison with time course of force rise). AML1, AM2 and A14.34 are noisy during the later part of force development, because these reflections become very weak. This may account for the variability in the t½ values (Table 1). Considering these values as independent estimates of the half-time with which the myosin head conformation characteristic of resting muscle is lost, the mean value of t½ for this process is 29 ms. This matches t½ for the rise of the 14.56 nm reflection, 29.1 ± 1.4 ms, and both processes were only slightly faster than force development (t½= 33.5 ± 2.0 ms) and the difference was not significant (P > 0.1).
Changes in the X-ray pattern during rapid shortening
When rapid shortening was imposed from the isometric tetanus plateau, force fell to 0.12 T0, and IML1 (Fig. 2B) and IM2 (Fig. 2C) recovered partially towards their resting values. After force redevelopment, the ML1 and M2 reflections disappeared once more. IM3 decreased rapidly at the start of shortening to about 15 % of its isometric plateau value, accompanying the fall of force at this time resolution (Fig. 2D). Then, as shortening continued, IM3 partially recovered, reaching 30 % of its isometric plateau value at the end of shortening. The cross-meridional width of the reflection decreased during shortening (by about 30 % of its isometric value), but was still about 1.7 times larger than at rest. Force redevelopment was accompanied by full recovery of both the intensity and width. The spacing of the M3 reflection, SM3, also decreased during rapid shortening (Fig. 2E), but lagged the fall of force by 10-15 ms, in contrast with IM3. By the end of shortening, SM3 had reached about 14.4 nm but was still decreasing. After shortening SM3 recovered to its isometric value.
DISCUSSION
Conformation of myosin heads at rest and during isometric contraction
In resting muscle, myosin heads are arranged on a three-stranded 43 nm helix, producing the series of layer lines with this periodicity (Fig. 1A (upper half) and B) and the M3 reflection (Fig. 1D) corresponding to the axial periodicity of 14.34 nm. Systematic deviations from a perfect helix produce ‘forbidden’ meridional reflections like the M2 (Huxley & Brown, 1967; Fig. 1C). These characteristic features of the resting diffraction pattern were completely absent at the isometric tetanus plateau (Fig. 1A, lower half). The 43 nm layer line was replaced by one centred on 38 nm, the pitch of the actin helix (Fig. 1B). The M2 reflection was completely abolished (Fig. 1C), and the M3 reflection moved to a spacing of 14.56 nm (Fig. 1D). This spacing change (1.5 %) is too large to be due to filament elasticity (which implies a change of 0.2 % for a change in force equal to T0; Huxley et al. 1994; Wakabayashi et al. 1994), and the larger spacing is also seen in rigor muscle at zero force (Haselgrove, 1975). There was no evidence for residual myosin heads in the resting conformation, in contrast to previous results from whole muscles (Huxley et al. 1982; Bordas et al. 1993). The difference may be due to the difficulty of activating all the fibres in an intact muscle by electrical stimulation.
Time course of the transition between resting and active isometric conformations
In the absence of substantial sarcomere shortening, and within the 5 ms resolution of the present measurements, the decrease in amplitudes of the meridional and layer line reflections characteristic of the resting state were synchronous with the rise of that of the axial 14.56 nm reflection characteristic of active contraction, and with force development itself. These results, and our interpretation, differ from those of previous X-ray studies on whole muscles at about the same temperature (5°C, Huxley et al. 1982; 8°C, Martin-Fernandez et al. 1994). In the whole muscle studies the rate of force development was slower, probably as a result of sarcomere shortening against tendon compliance during the force increase. This may have been responsible for part of the lag between the changes in X-ray intensities and force development found in those studies.
The present results show that some of this lag is still present in the absence of sarcomere shortening; the decreases in IML1, IM2 and I14.34 are substantially faster than force development (Figs 2 and 3). However, our interpretation of this phenomenon is different from that of previous studies. We analysed the M3 reflection in terms of two components, one characteristic of resting muscle, and the other of the isometric tetanus plateau. Higher resolution studies have shown that the axial X-ray reflections are split into sub-peaks as a result of interference between the two halves of the myosin filament (Haselgrove, 1975; Malinchik & Lednev, 1992; Reconditi et al. 1998), but these effects do not alter the total integrated intensity of the two components of the M3 reflection considered here. We have also argued that it is the amplitude of the reflections, rather than their intensities, that signals the motions of the myosin heads under the present conditions. After correcting for lattice sampling effects, the changes in the amplitudes of the ML1, M2, 14.34 and 14.56 reflections all have the same time course as force development (Fig. 3 and Table 1), suggesting that the motion of the myosin heads between the resting and active conformations is synchronous with force generation at the present 5 ms time resolution. This conclusion supports the original hypothesis of Huxley & Simmons (1971), which implies that force generation follows within 1-2 ms the binding of myosin heads to actin, rather than later modifications that postulated a slow step between actin binding and force generation (Cecchi et al. 1982; Ford et al. 1986).
Changes in myosin head conformation during rapid shortening
In contrast with their behaviour during the rising phase of the isometric tetanus, the axial X-ray reflections showed two distinct temporal components during rapid shortening (Fig. 2). The faster component, which at the present time resolution appears to accompany the force decrease at the start of shortening, is seen in IM3 (Fig. 2D), but not in SM3 (Fig. 2E) or in IM2 and IML1 (Fig. 2B and C). This component was seen previously in experiments using rapid length steps, and is probably due to tilting of myosin heads that were roughly perpendicular to the filament axis during isometric contraction, so that their mass becomes more uniformly spread along the filaments (Irving et al. 1992; Lombardi et al. 1995; Dobbie et al. 1998).
The slower change induced by rapid shortening involves an increase in IML1, IM2 and IM3. The increase in IM3 originates from the head population with axial repeat 14.34 nm (Fig. 3A), which explains the slow decrease in SM3 (Fig. 2). The characteristics of each reflection returned towards their resting values, suggesting that the myosin heads return to their resting conformations. These slow changes were observed previously in whole muscles (Faruqi et al. 1991; Simmons, 1992; Martin-Fernandez et al. 1994). They were not complete during the 30 ms shortening period used here; for example, IML1 had recovered to about 40 % of its resting value. Assuming as above that the fraction of heads in a particular conformation is related to the square root of the relevant X-ray intensity, this suggests that about 60 % of the heads had regained their resting conformation.
The half-time of the transition to the resting conformation was about 25 ms, corresponding, at the shortening velocity imposed, to filament sliding of about 60 nm per half-sarcomere, which is almost one order of magnitude larger than the range over which myosin heads are expected to stay bound to actin (Huxley, 1957; Huxley & Simmons, 1971; Linari et al. 1997). A slow accumulation of myosin heads in a resting conformation may help explain the low rate of ATP turnover during extensive rapid shortening (Homsher et al. 1981; Woledge et al. 1985; Burton, 1992). Relatively little work is produced under these conditions, and a mechanism that returned myosin heads to their resting conformations and therefore prevented them from interacting with actin would minimize inefficient hydrolysis of ATP.
Acknowledgments
We wish to thank Mr A. Aiazzi and Mr M. Dolfi for skilled technical assistance and Mr A. Vannucchi for the preparation of illustrations. This work was supported by grants from Telethon (no. 945), Consiglio Nazionale delle Ricerche, the UK Medical Research Council and the European Molecular Biology Laboratories.
References
- Bordas J, Diakun GP, Diaz FG, Harries JE, Lewis RA, Lowy J, Mant GR, Martin-Fernandez ML, Towns-Andrews E. Two-dimensional time-resolved X-ray diffraction studies of live isometrically contracting frog sartorius muscle. Journal of Muscle Research and Cell Motility. 1993;14:311–324. doi: 10.1007/BF00123096. [DOI] [PubMed] [Google Scholar]
- Burton K. Myosin step size: estimates from motility assays and shortening muscle. Journal of Muscle Research and Cell Motility. 1992;13:590–607. doi: 10.1007/BF01738249. [DOI] [PubMed] [Google Scholar]
- Cecchi G, Griffiths PJ, Bagni MA, Ashley CC, Maeda Y. Time-resolved changes in equatorial X-ray diffraction and stiffness during rise of tetanic tension in intact length-clamped single muscle fibers. Biophysical Journal. 1991;59:1273–1283. doi: 10.1016/S0006-3495(91)82342-6. [DOI] [PMC free article] [PubMed] [Google Scholar]
- Cecchi G, Griffiths PJ, Taylor S. Muscular contraction: kinetics of crossbridge attachment studied by high-frequency stiffness measurements. Science. 1982;217:70–72. doi: 10.1126/science.6979780. [DOI] [PubMed] [Google Scholar]
- Dobbie I, Linari M, Piazzesi G, Reconditi M, Koubassova N, Ferenczi MA, Lombardi V, Irving M. Elastic bending and active tilting of myosin heads during muscle contraction. Nature. 1998;396:383–387. doi: 10.1038/24647. 10.1038/24647. [DOI] [PubMed] [Google Scholar]
- Faruqi AR, Huxley HE, Simmons RM, Bond CC. Time-resolved X-ray measurements on muscle using a fast multiwire linear detector. Nuclear Instruments and Methods in Physics Research. 1991;A310:359–361. [Google Scholar]
- Ford LE, Huxley AF, Simmons RM. Tension transients during the rise of tetanic tension in frog muscle fibres. The Journal of Physiology. 1986;372:595–609. doi: 10.1113/jphysiol.1986.sp016027. [DOI] [PMC free article] [PubMed] [Google Scholar]
- Haselgrove JC. X-ray evidence for conformational changes in the myosin filaments of vertebrate striated muscle. Journal of Molecular Biology. 1975;92:113–143. doi: 10.1016/0022-2836(75)90094-7. [DOI] [PubMed] [Google Scholar]
- Haselgrove JC, Huxley HE. X-ray evidence for radial cross-bridge movement and for the sliding filament model in actively contracting skeletal muscle. Journal of Molecular Biology. 1973;77:549–568. doi: 10.1016/0022-2836(73)90222-2. [DOI] [PubMed] [Google Scholar]
- Homsher E, Irving M, Wallner A. High-energy phosphate metabolism and energy liberation associated with rapid shortening in frog skeletal muscle. The Journal of Physiology. 1981;321:423–436. doi: 10.1113/jphysiol.1981.sp013994. [DOI] [PMC free article] [PubMed] [Google Scholar]
- Huxley AF. Muscle structure and theories of contraction. Progress in Biophysics and Biophysical Chemistry. 1957;7:255–318. [PubMed] [Google Scholar]
- Huxley AF, Lombardi V, Peachey LD. A system for fast recording of longitudinal displacement of a striated muscle fibre. The Journal of Physiology. 1981;317:12–13P. [Google Scholar]
- Huxley AF, Simmons RM. Proposed mechanism of force generation in striated muscle. Nature. 1971;233:533–538. doi: 10.1038/233533a0. [DOI] [PubMed] [Google Scholar]
- Huxley HE, Brown W. The low-angle X-ray diagram of vertebrate striated muscle and its behaviour during contraction and rigor. Journal of Molecular Biology. 1967;30:383–434. doi: 10.1016/s0022-2836(67)80046-9. [DOI] [PubMed] [Google Scholar]
- Huxley HE, Faruqi AR, Kress M, Bordas J, Koch MHJ. Time-resolved X-ray diffraction studies of the myosin layer-line reflections during muscle contraction. Journal of Molecular Biology. 1982;158:637–684. doi: 10.1016/0022-2836(82)90253-4. [DOI] [PubMed] [Google Scholar]
- Huxley HE, Stewart A, Sosa H, Irving T. X-ray diffraction measurements of the extensibility of actin and myosin filaments in contracting muscle. Biophysical Journal. 1994;67:2411–2421. doi: 10.1016/S0006-3495(94)80728-3. [DOI] [PMC free article] [PubMed] [Google Scholar]
- Irving M, Lombardi V, Piazzesi G, Ferenczi MA. Myosin head movements are synchronous with the elementary force-generating process in muscle. Nature. 1992;357:156–158. doi: 10.1038/357156a0. 10.1038/357156a0. [DOI] [PubMed] [Google Scholar]
- Kress M, Huxley HE, Faruqi AR, Hendrix J. Structural changes during activation of frog muscle studied by time-resolved X-ray diffraction. Journal of Molecular Biology. 1986;188:325–342. doi: 10.1016/0022-2836(86)90158-0. [DOI] [PubMed] [Google Scholar]
- Linari M, Dobbie I, Reconditi M, Koubassova N, Irving M, Piazzesi G, Lombardi V. The stiffness of skeletal muscle in isometric contraction and rigor: the fraction of myosin heads bound to actin. Biophysical Journal. 1998;74:2459–2473. doi: 10.1016/S0006-3495(98)77954-8. [DOI] [PMC free article] [PubMed] [Google Scholar]
- Linari M, Lombardi V, Piazzesi G. Cross-bridge kinetics studied with staircase shortening in single fibres from frog skeletal muscle. Journal of Muscle Research and Cell Motility. 1997;18:91–101. doi: 10.1023/a:1018637118052. 10.1023/A:1018637118052. [DOI] [PubMed] [Google Scholar]
- Lombardi V, Piazzesi G. The contractile response during steady lengthening of stimulated frog muscle fibres. The Journal of Physiology. 1990;431:141–171. doi: 10.1113/jphysiol.1990.sp018324. [DOI] [PMC free article] [PubMed] [Google Scholar]
- Lombardi V, Piazzesi G, Ferenczi MA, Thirlwell H, Dobbie I, Irving M. Elastic distortion of myosin heads and repriming of the working stroke in muscle. Nature. 1995;374:553–555. doi: 10.1038/374553a0. 10.1038/374553a0. [DOI] [PubMed] [Google Scholar]
- Malinchik SB, Lednev VV. Interpretation of the X-ray diffraction pattern from relaxed skeletal muscle and modelling of the thick filament structure. Journal of Muscle Research and Cell Motility. 1992;13:406–419. doi: 10.1007/BF01738036. [DOI] [PubMed] [Google Scholar]
- Martin-Fernandez ML, Bordas J, Diakun G, Harries J, Lowy J, Mant GR, Svensson A, Towns-Andrews E. Time-resolved X-ray diffraction studies of myosin head movements in live frog sartorius muscle during isometric and isotonic contractions. Journal of Muscle Research and Cell Motility. 1994;15:319–348. doi: 10.1007/BF00123484. [DOI] [PubMed] [Google Scholar]
- Reconditi M, Dobbie I, Linari M, Narayanan T, Diat O, Piazzesi G, Irving M, Lombardi V. The fine structure of the myosin-based X-ray diffraction pattern from single muscle fibres. Pflügers Archiv. 1998;436:R19–42. [Google Scholar]
- Simmons RM. Structural changes accompanying mechanical events in muscle contraction. In: Simmons RM, editor. Muscular Contraction. Cambridge University Press; 1992. pp. 203–217. [Google Scholar]
- Wakabayashi K, Sugimoto Y, Tanaka H, Ueno Y, Takezawa Y, Amemiya Y. X-ray diffraction evidence for the extensibility of actin and myosin filaments during muscle contraction. Biophysical Journal. 1994;67:2422–2435. doi: 10.1016/S0006-3495(94)80729-5. [DOI] [PMC free article] [PubMed] [Google Scholar]
- Woledge RC, Curtin NA, Homsher E. Energetic Aspects of Muscle Contraction. London: Academic Press; 1985. [PubMed] [Google Scholar]