

Abstract
The expression, distribution and function of P2X purinoceptors in the supraoptic nucleus (SON) were investigated by reverse transcription-polymerase chain reaction (RT-PCR), in situ hybridization, and Ca2+-imaging and whole-cell patch-clamp techniques, respectively.
RT-PCR analysis of all seven known P2X receptor mRNAs in circular punches of the SON revealed that mRNAs for P2X2, P2X3, P2X4, P2X6 and P2X7 receptors were expressed in the SON, and mRNAs for P2X3, P2X4 and P2X7 were predominant.
In situ hybridization histochemistry for P2X3 and P2X4 receptor mRNAs showed that both mRNAs were expressed throughout the SON and in the paraventricular nucleus (PVN).
ATP caused an increase in [Ca2+]i in a dose-dependent manner with an ED50 of 1.7 × 10⁻⁵m. The effects of ATP were mimicked by ATPγS and 2-methylthio ATP (2MeSATP), but not by AMP, adenosine, UTP or UDP. αβ-Methylene ATP (αβMeATP) and ADP caused a small increase in [Ca2+]i in a subset of SON neurones.
The P2X7 agonist 2′- & 3′-O-(4-benzoylbenzoyl)-ATP (BzATP) at 10−4m increased [Ca2+]i, but the potency of BzATP was lower than that of ATP. In contrast, BzATP caused a more prominent [Ca2+]i increase than ATP in non-neuronal cells in the SON.
The effects of ATP were abolished by extracellular Ca2+ removal or by the P2 antagonist pyridoxal phosphate-6-azophenyl-2′,4′-disulphonic acid (PPADS), and inhibited by extracellular Na+ replacement or another P2 antagonist, suramin, but were unaffected by the P2X7 antagonist oxidized ATP, and the inhibitor of Ca2+-ATPase in intracellular Ca2+ stores cyclopiazonic acid.
Two patterns of desensitization were observed in the [Ca2+]i response to repeated applications of ATP: some neurones showed little or moderate desensitization, while others showed strong desensitization.
Whole-cell patch-clamp analysis showed that ATP induced cationic currents with marked inward rectification. The ATP-induced currents exhibited two patterns of desensitization similar to those observed in the [Ca2+]i response.
The results suggest that multiple P2X receptors, including P2X3, are functionally expressed in SON neurones, and that activation of these receptors induces cationic currents and Ca2+ entry. Such ionic and Ca2+-signalling mechanisms triggered by ATP may play an important role in the regulation of SON neurosecretory cells.
The supraoptic nucleus (SON) of the hypothalamus contains cell bodies of two different populations of neurosecretory cells, vasopressin and oxytocin neurones. Release of vasopressin and oxytocin in the neurohypophysis is controlled by the specific electrical activity of these neurones, which is regulated by synaptic inputs into the SON mediated by various neurotransmitters/neuromodulators, such as GABA and glutamate (Decavel & Van den Pol, 1990; Van den Pol et al. 1990; Wuarin & Dudek, 1993). A1 noradrenergic neurones originating from the ventrolateral medulla and directly innervating SON neurones are also thought to play a major role in the regulation of SON neurones (Sawchenko & Swanson, 1981). ATP may serve as a co-transmitter in A1 neurones, because locally applied ATP causes excitation of SON neurones (Day et al. 1993), and A1-induced excitation of vasopressin neurones in the SON was insensitive to adrenergic antagonists (Day et al. 1990), but inhibited by the blocker of P2 receptors suramin (Day et al. 1993; Buller et al. 1996). A study with intracellular recordings of SON neurones in acute hypothalamic explants revealed that ATP evokes membrane depolarization by activating postsynaptic P2 receptors in SON neurones and that non-selective cationic channels are involved in the depolarization (Hiruma & Bourque, 1995). Moreover, it has recently been reported that ATP stimulated vasopressin release from neurohypophysial terminals (Troadec et al. 1998). These lines of evidence suggest that ATP plays a crucial role in the regulation of SON neurones at both the soma and terminals. However, the purinoceptors mediating the ATP-mediated actions and the cellular mechanism of the actions in the SON remain unclear.
There are two major classes of P2 purinoceptors, P2X and P2Y receptors. P2X receptors are ligand-gated cation channels composed of multimers of two transmembrane proteins, while P2Y receptors are seven transmembrane receptors coupled with GTP-binding proteins. cDNAs of both classes of P2 receptors have been cloned and classified into P2X1-7 and P2Y1-8 receptors (North & Barnard, 1997). It has been reported that P2X4 and P2X6 receptors are widely distributed throughout the CNS (Collo et al. 1996; Seguela et al. 1996), whereas P2X3 receptors are expressed exclusively in primary sensory neurones (Chen et al. 1995; Cook et al. 1997). The P2 receptor type formerly known as P2Z receptors were shown to be a subclass of P2X receptors and are now termed P2X7 receptors (Surprenant et al. 1996). It is reported that P2X7 receptors exist in non-neuronal cells such as microglia in the brain (Collo et al. 1997). When examined in cells heterologously expressing cloned P2X receptors, P2X4, P2X6 and P2X7 receptors were insensitive to the P2 antagonists suramin and pyridoxal phosphate-6-azophenyl-2′,4′-disulphonic acid (PPADS), which potently blocked responses mediated by P2X2 and P2X3 receptors (Bo et al. 1995; Buell et al. 1996; Collo et al. 1996). On the other hand, ATP-evoked responses in most neuronal preparations were sensitive to the P2X antagonists suramin and PPADS, although P2X4 and P2X6 receptors predominate in most neuronal cells (Collo et al. 1996; Seguela et al. 1996). These results have been interpreted to mean that multiple P2X receptors can be co-expressed in native neuronal cells and can form heteromultimers (North & Barnard, 1997). In fact, it has been shown that P2X2 and P2X3 receptors form heteromultimers in sensory neurones (Lewis et al. 1995; Radford et al. 1997). Another difference detected in the functional properties of heterologously expressed P2X receptors is that P2X1 and P2X3 receptors exhibit currents with rapid desensitization, whereas currents carried by other P2X receptors show little or no desensitization (Lewis et al. 1995; Collo et al. 1996).
P2 receptors are known to cause an increase in the cytosolic Ca2+ concentration ([Ca2+]i) in various types of cells via two distinct mechanisms: P2X receptor activation causes membrane depolarization, which results in voltage-dependent Ca2+ entry (Mateo et al. 1998); and P2Y receptor activation induces inositol trisphosphate (IP3)-mediated Ca2+ release from internal stores (Strobaek et al. 1996). Although it has been reported that ATP evokes an increase in [Ca2+]i in cultured hypothalamic neurones (Chen et al. 1994), no attempt has been made to elucidate the effects of ATP on [Ca2+]i in magnocellular neurones in the SON.
In the present study, we investigated molecular subtypes and distribution patterns of P2X receptors expressed in the SON by reverse transcription-polymerase chain reaction (RT-PCR) and in situ hybridization histochemistry. We also studied the function of P2X receptors in SON neurones by examining effects of various purinoceptor agonists and antagonists on [Ca2+]i and ionic currents of acutely dissociated SON neurones using the fura-2 [Ca2+]i-imaging and the whole-cell patch-clamp techniques, respectively.
METHODS
Preparation of SON slices
Coronal sections of slices containing the SON were made as previously described (Kabashima et al. 1997). For experiments with Ca2+ imaging and patch clamp in single dissociated neurones, young male Wistar rats at 2-4 weeks of age (50-100 g) were used, and for in situ hybridization histochemistry, male Wistar rats at 6 weeks of age were used. For RT-PCR, male Wistar rats at 3 and 6 weeks were used. Rats were stunned by a blow on the back of the neck, and decapitated, and hypothalamic slices (300 μm thick) were cut coronally. To obtain a homogeneous population of SON neurones, the slices were trimmed with a circular punch (0.6 or 1 mm in diameter) around the SON. For RT-PCR, the trimmed SON slices were frozen by immediately transferring into liquid nitrogen. For dissociation of SON neurones, the trimmed slices were suspended and incubated at room temperature (23°C) for about 1 h with continuous aeration with 95 % O2 and 5 % CO2 in a Krebs-Ringer bicarbonate (KHB) solution before enzyme treatment. KHB solution contained (mM): NaCl, 124; KCl, 5; KH2PO4, 1.24; MgSO4, 1.3; CaCl2, 2.1; NaHCO3, 25.9; and glucose, 10.0.
RT-PCR
Total RNA was extracted from slice preparations of the SON, and tissues obtained from the brain cortex, cerebellum, spinal cord with dorsal root ganglion, and optic chiasma, using RNeasy mini kit (Qiagen, Hilden, Germany). RT-PCR was performed with a thermal cycler (Perkin-Elmer) using an RT-PCR kit (Toyobo, Osaka, Japan). Seven independent sense (S) and antisense (AS) primer pairs specific for P2X1-P2X7 were designed on the basis of the known cloned rat P2X receptor sequences deposited in GenBank. The nucleotide sequence and the length of the expected PCR products for each primer pair are shown in Table 1. Reverse transcription from each total RNA (0.5 μg) was performed in a final volume of 20 μl using random primers and Moloney murine leukaemia virus (M-MLV) reverse transcriptase with the RT-PCR kit. PCR was performed with an RT-PCR buffer containing 1 μm primers, 1 mM each deoxynucleotide triphosphate, 2.5 U recombinant Taq DNA polymerase and each transcribed cDNA, in a final volume of 50 μl. The PCR conditions were 94°C for 5 min, then thirty cycles of 94°C for 30 s, 58°C for 60 s, and 72°C for 90 s. At the end of the PCR, samples were kept at 72°C for 10 min for final extension and then stored at 4°C. Amplification products were separated by electrophoresis (2 % agarose gel) and visualized by ethidium bromide staining. The products amplified with primers for P2X3 and P2X4 receptors were directly sequenced using an automated DNA sequencer and confirmed to be identical to the reported sequence of each mRNA of rats.
Table 1.
Individual P2X receptor primers for RT-PCR
| Primer | Source* | Position | Sequence (5’ to 3’) | Predicted length (bp) |
|---|---|---|---|---|
| P2X1 | X80447 | 776–801 (S) | GAAGTGTGATCTGGACTGGCACGT | 452 |
| 1203–1231 (AS) | GCGTCAAGTCCGGATCTCGACTAA | |||
| P2X2 | U14414 | 826–845 (S) | GAATCAGAGTGCAACCCCAA | 357 |
| 1183–1164 (AS) | TCACAGGCCATCTACTTGAG | |||
| P2X3 | X90651 | 708–731 (S) | TGGCGTTCTGGGTATTAAGATCGG | 440 |
| 1126–1147 (AS) | CAGTGGCCTGGTCACTGGCGA | |||
| P2X4 | X87763 | 749–774 (S) | GAGGCATCATGGGTATCCAGATCAAG | 447 |
| 1170–1195 (AS) | GAGCGGGGTGGAAATGTAACTTTAG | |||
| P2X5 | X92069 | 553–577 (S) | GCCGAAAGCTTCACCATTTCCATAA | 418 |
| 944–970 (AS) | CCTACGGCATCCGCTTTGATGTGATAG | |||
| P2X6 | X92070 | 444–468 (S) | AAAGACTGGTCAGTGTGTGGCGTTC | 520 |
| 938–963 (AS) | TGCCTGCCCAGTGACAAGAATGTCAA | |||
| P2X7 | X95882 | 384–410 (S) | GTGCCATTCTGACCAGGGTTGTATAAA | 354 |
| 711–737 (AS) | GCCACCTCTGTAAAGTTCTCTCCGATT |
Sources are described by the accession number in GenBank. S, sense; AS, antisense.
Generation of cRNA probes for P2X3 and P2X4 receptors
The PCR products were ligated with the pCRII vector using a TA cloning kit (Invitrogen, San Diego, CA, USA). 35S-Labelled riboprobes were generated from the fragments of the PCR products for P2X3 and P2X4 using an Sp6/T7 transcription kit according to the manufacturer's instructions (Boehringer Mannheim GmbH, Mannheim, Germany). Antisense probes for P2X3 and P2X4 were generated by using T7 and Sp6 polymerases, respectively. Sense probes for P2X3 and P2X4 were also generated by using Sp6/T7 polymerase.
In situ hybridization histochemistry
Frozen 12 μm thick sections from rat brain and trigeminal ganglion were cut in the cryostat at -20°C. They were thaw mounted onto gelatin-chrome alum-coated slides and stored at -80°C. Frozen tissue sections were allowed to dry in air for 10 min, then fixed in 4 % formaldehyde in phosphate buffered saline (PBS, pH 7.5) for 5 min and washed twice in PBS. Fixed tissue sections were then incubated for 10 min in 0.9 % saline containing 0.1 M triethanolamine and 0.25 % acetic anhydride, dehydrated by transferring them sequentially through 70 % (1 min), 80 % (1 min), 95 % (2 min) and 100 % ethanol (1 min), and delipidated in 100 % chloroform for 5 min. The slides were then partially rehydrated in 100 % (1 min) followed by 95 % (1 min) ethanol and allowed to dry briefly in air. Hybridization was carried out at 45°C overnight in 46 μl buffer (consisting of 42 μl of: 950 μl 1 M TrisCl pH 7.4, 190 μl 250 mM EDTA pH 8, 3.57 ml 4 M NaCl, 23.8 ml formamide, 9.53 ml 50 % dextran sulphate (500 000 MW), 950 μl Denhardt's solution and 1 ml water; with 2 μl of a solution of: 250 μl 10 mg ml−1 sheared salmon sperm DNA (D7656, Sigma), 250 μl 20 mg ml−1 yeast total RNA (type XI, R6750, Sigma) and 500 μl water; and ∼2 μl of 35S-labelled antisense and sense probes (1 × 10⁶ c.p.m. slide−1)) under Nescofilm (Bando Chemical IMD, Ltd, Osaka, Japan) coverslips. The slides were rinsed in 2 × SSC (1 × SSC: 150 mM NaCl, 15 mM sodium citrate) and washed for 30 min in two changes of 2 × SSC-50 % formamide at 45°C before being incubated at 37°C in 2 × SSC containing 20 μg ml−1 RNase A (Sigma). After a further 45 min wash in three changes of 2 × SSC-50 % formamide at 45°C, the slides were washed for 10 min in two changes of 2 × SSC at room temperature and briefly dipped in water and 70 % ethanol and air dried. Slides hybridized to the riboprobes were dipped in nuclear emulsion (K-5, Ilford, Cheshire, UK) and exposed for 14 days before being developed in D-19 developer (Kodak, Rochester, NY, USA), fixed with Fujifix (Fuji Photo Film Co., Ltd, Tokyo, Japan) and examined with bright- and dark-field microscopy.
Dissociation of SON cells
Single SON neurones were dissociated from the SON slices according to the method described elsewhere (Harayama et al. 1998; Shibuya et al. 1998b). In brief, four to six pieces of the trimmed slices were incubated for 20 min at 30°C with pronase (0.5 mg ml−1) in a Hepes-buffered solution (HBS), which contained (mM): NaCl, 140; KCl, 5; CaCl2, 2; MgCl2, 1; Hepes, 10; and glucose, 10 (pH adjusted to 7.4 with NaOH). The enzymatic treatment was terminated by a further 20 min incubation in HBS containing thermolysin (0.1 mg ml−1). The slices were then incubated in 10 ml of HBS until used. HBS was continuously oxygenated with 100 % O2 gas throughout experiments.
[Ca2+]i measurement
A SON slice treated with enzymes was transferred to a perfusion chamber (volume, ∼100 μl) with a glass coverslip bottom. The slice was gently triturated with the acetoxymethyl ester of fura-2 (fura-2 AM, 5 μm) and maintained in humidified and oxygenated air at room temperature for 1 h. The procedures for measuring [Ca2+]i from SON neurones were described previously in detail (Shibuya et al. 1998b). Briefly, the perfusion chamber was positioned on an inverted microscope (TMD-300, Nikon, Japan) equipped with a Ca2+-imaging system (Quanticell/900, JEOL, Japan). The chamber was perfused with HBS at a rate of 1.5 ml min−1 and drugs were added by changing the bath solution. The half-time for a complete exchange of the solution in the chamber was estimated to be 5-10 s. To make Ca2+-free solution, both Ca2+ and Mg2+ were omitted and 1 mM EGTA was added (the final Ca2+ concentration was estimated to be below 10−8 M). Once cells were selected in the optical field under the microscope, fluorescence intensities with excitation at 340 and 380 nm were recorded at an interval of 5 s. [Ca2+]i was determined from the ratio of the fluorescence measured with excitation at 340 nm to that at 380 nm by the equation of Grynkiewicz et al. (1985). All [Ca2+]i measurements were carried out at room temperature. Unless otherwise noted, Ca2+-imaging data were analysed in cells of more than 20 μm× 15 μm in size, which commonly possessed one or a few dendritic processes. These cells were assumed to be neuronal cells in the SON, as such cells have been histologically identified as either vasopressin or oxytocin neurones (Harayama et al. 1998; Shibuya et al. 1998b). In some experiments, [Ca2+]i was also measured from cells of smaller sizes (10-15 μm in diameter), which did not possess dendritic processes. These cells were assumed to be non-neuronal cells in the SON, as they were immunohistochemically negative with antibodies against vasopressin or oxytocin.
Whole-cell patch clamp
Dissociated SON neurosecretory cells were plated in a culture dish (35 mm diameter) and continuously perfused with HBS at a rate of 1.5 ml min−1. The inner pipette solution contained (mM): caesium methanesulphonate, 140 (or CsCl, 140); EGTA, 10; CaCl2, 2; MgCl2, 1; MgATP, 2; and Hepes, 10 (pH adjusted to 7.2 with Tris). The pipette resistance prior to forming a high resistance seal ranged from 3 to 5 MΩ. An Axopatch 200A amplifier (Axon Instruments) was used to record ionic currents in the tight-seal, whole-cell configuration. Currents were digitized with an analog-to-digital converter (MacLab/8, ADI, Australia) and Chart software (v. 3.5, ADI) at 100 Hz. When current-voltage relationships of ATP-induced currents were examined, a ramp voltage command from -80 to +20 mV lasting for 100 ms was applied and the current in response to the command was recorded with an analog-to-digital converter (ITC-16, Instrutech Corp., USA) and Axodata software (version 1.2.3, Axon Instruments) at 1 kHz. Voltage-dependent Na+ and Ca2+ currents were blocked by adding TTX (1 μm) and Cd2+ (30 μm), respectively, to the perfusion solution in experiments with the ramp command. TTX and Cd2+ at these concentrations did not affect the ATP-induced currents, but virtually abolished voltage-dependent inward currents that appeared at around -30 mV or more depolarized potentials. Drugs were added directly onto the cells using a Y-tube (Nagatomo et al. 1996), whose tip was placed approximately 100 μm upstream of the cell, in patch-clamp experiments. All electrophysiological recordings were made at room temperature.
Chemicals
Adenosine, suramin, 2-methylthio ATP (2MeSATP), and α,β-methylene ATP (αβMeATP) were purchased from Research Biochemicals International, PPADS was from Tocris Cookson Ltd (Bristol, UK), 2′- & 3′-O-(4-benzoylbenzoyl)-ATP (BzATP) and ATP-2′,3′-dialdehyde (oxidized ATP) were from Sigma, and fura-2 AM was from Dojin Laboratory (Kumamoto, Japan). Other chemicals were analytical grade from Nacalai Tesque Inc. (Kyoto, Japan).
Statistics
Results are expressed as the mean ±s.e.m., and n represents the number of experiments. Statistical differences (P < 0.05) were determined by Wilcoxon signed-rank test or by Mann-Whitney U test.
RESULTS
RT-PCR analysis of P2X receptors in the SON
To identify the subtypes of P2X receptors expressed in the SON, RT-PCR using seven pairs of primers was performed. The SON expressed mRNA for the P2X2, P2X3, P2X4, P2X6 and P2X7 receptors, but not for the P2X1 and P2X5 receptors (Fig. 1). Of the five P2X receptor mRNAs, those for P2X3, P2X4 and P2X7 receptors were dominant. A clear signal for P2X7 mRNA was also detected in tissue extracts of the optic chiasma (data not shown). The bands corresponding to the P2X3 and P2X4 receptors were sequenced and confirmed to be identical to the known sequences of mRNAs for rat P2X3 and P2X4 receptors, respectively. P2X mRNAs of the SON obtained from 3 and 6 week old rats were almost identical. As reported previously (Chen et al. 1995; Lewis et al. 1995), mRNAs for all P2X receptor subtypes were expressed in the spinal cord with dorsal root ganglion. Although mRNAs for P2X2, P2X4, P2X6 and P2X7 receptors were also expressed in the brain cortex and the cerebellum, only a faint signal for P2X3 receptor mRNA was detected in the brain cortex and no signal was detected in the cerebellum.
Figure 1. RT-PCR analysis of P2X purinoceptor mRNAs expressed in the SON, the spinal cord with dorsal root ganglion, the brain cortex and the cerebellum.
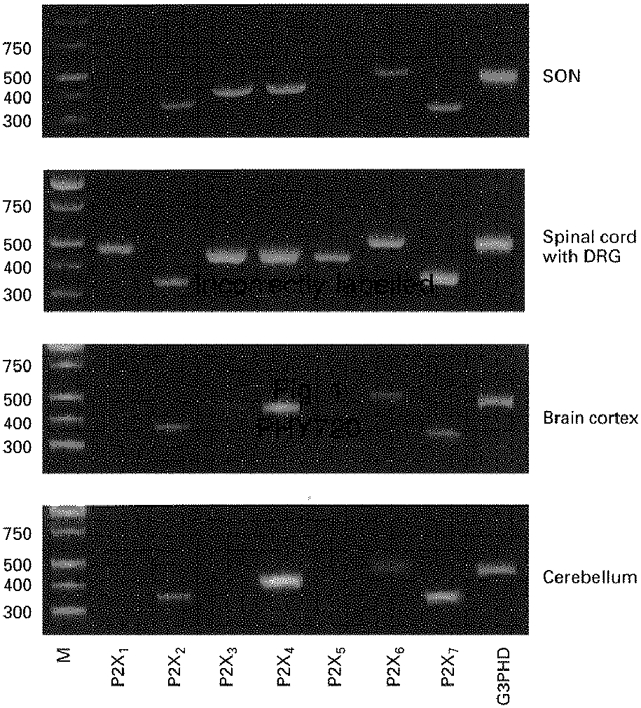
The total RNAs from the SON, brain cortex, spinal cord with dorsal root ganglion (DRG), and cerebellum were reverse transcribed, and amplified by PCR with each primer pair described in Table 1. Primers for a house-keeping gene, glyceraldehyde 3-phosphate dehydrogenase (G3PDH), were used as an internal standard and generated a 450 bp fragment. Amplification products were electrophoresed on 2% agarose gel and visualized by ethidium bromide staining. Lane M, DNA marker. When PCR was performed with each sample without prior reverse transcription, there was no amplification product, indicating that the bands appearing on the gels were not derived from genomic DNA.
In situ hybridization histochemistry of P2X3 and P2X4 receptors
A section of the trigeminal ganglion was used as a positive control of the P2X3 antisense riboprobe. As previously reported (Chen et al. 1995; Lewis et al. 1995), a scattered distribution of P2X3 transcripts was detected in the section of trigeminal ganglion (Fig. 2A). In contrast, expression of both P2X3 and P2X4 transcripts was detected throughout the SON (Fig. 2B and C), and the signal from the P2X3 transcripts was slightly weaker than that from the P2X4 transcripts. Similar patterns of expression of both genes were also observed in the paraventricular nucleus (PVN) (Fig. 3A and B), whereas no signal was detected in the optic chiasma (OC) (Fig. 2B and C). Scattered P2X4 transcripts and only a few P2X3 transcripts were detected in hypothalamic areas other than the SON and the PVN. Sense riboprobes for P2X3 and P2X4 did not detect any signal in the SON and the PVN.
Figure 2. In situ hybridization histochemistry for P2X3 and P2X4 receptor mRNAs in the SON.
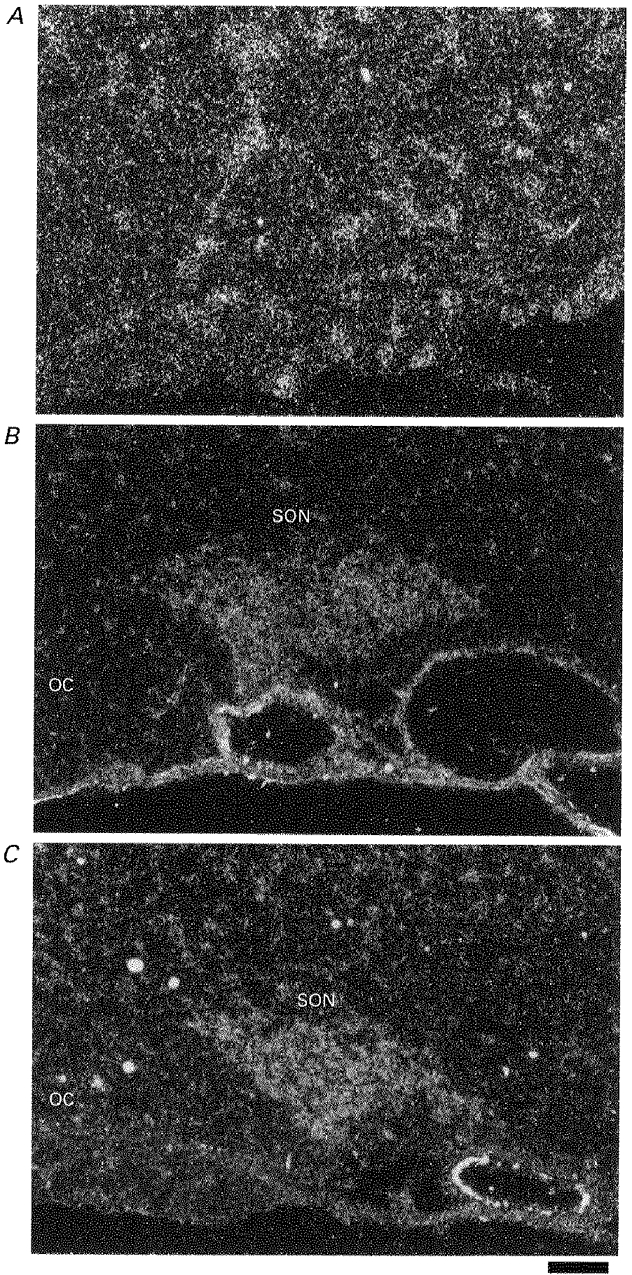
Dark-field photomicrographs of emulsion-dipped slides hybridized with 35S-labelled riboprobes complementary to P2X3 (A and B) and P2X4 (C) mRNA. A, section from rat trigeminal ganglion. B and C, sections from the rat hypothalamus. OC, optic chiasma. Scale bar is 50 μm.
Figure 3. In situ hybridization histochemistry for P2X3 and P2X4 receptor mRNAs in the PVN.
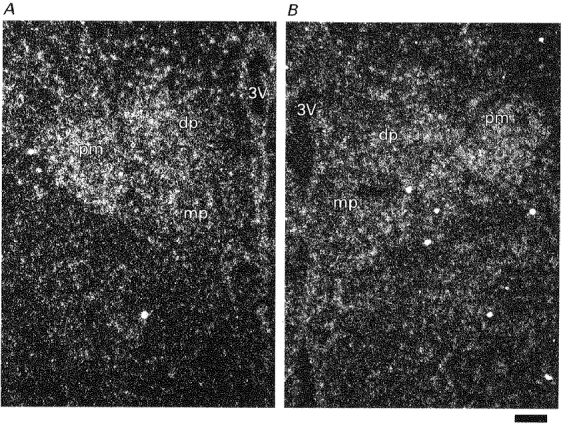
Dark-field photomicrographs of emulsion-dipped slides hybridized with 35S-labelled riboprobes complementary to P2X3 (A) and P2X4 (B) mRNA. 3V, third ventricle; dp, dorsal parvocellular component of PVN; mp, medial parvocellular component of PVN; pm, posterior magnocellular component of PVN. Scale bar is 50 μm.
[Ca2+]i response to ATP
ATP evoked an increase in [Ca2+]i upon 1 min application at concentrations ranging from 10−5 to 10−3 M in 154 of 186 (82.8 %) SON neurones examined. The [Ca2+]i responses to ATP were quickly reversible. As concentrations of ATP increased from 10−7 to 10−3 M, the peak increment of [Ca2+]i from the baseline (Δ[Ca2+]i) increased in a dose-dependent manner (Fig. 4A and B). The ED50 value obtained from the dose-response curve was 1.7 × 10⁻⁵ M. When compared in the same cells (n= 21), the maximum Δ[Ca2+]i value obtained with ATP (10−3 M) was 89.0 % of the value obtained with glutamate at the maximally effective concentration (10−4 M) (Fig. 4C and D), which is the best-characterized excitatory transmitter for SON neurones and consistently caused a large elevation in [Ca2+]i in all SON neurones examined (Shibuya et al. 1998b; Hattori et al. 1998). The maximum Δ[Ca2+]i values in response to ATP (10−4 M) obtained from SON neurones of 12-16, 17-23 and 24-28 day old rats were not significantly different (278 ± 28 nM in 57 cells, 275 ± 39 nM in 25 cells and 320 ± 30 nM in 35 cells, respectively), indicating that P2 receptors do not undergo major postnatal changes during this period.
Figure 4. [Ca2+]i responses to ATP and the dose-response relation.
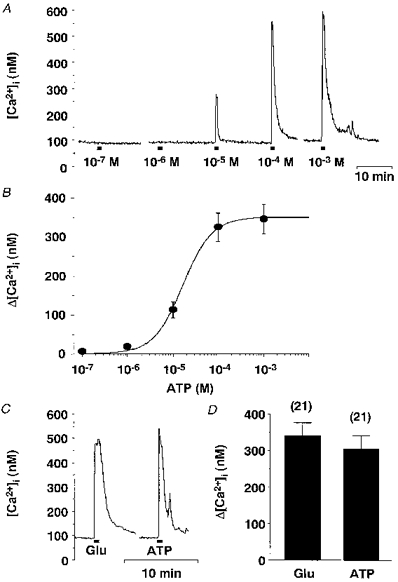
A, representative time courses for [Ca2+]i responses to increasing concentrations of ATP obtained from a single SON neurone. The breaks in the trace are approximately 5 min. Horizontal bars in this and subsequent figures indicate the time during which drugs were applied. B, increments of [Ca2+]i from the baseline (Δ[Ca2+]i) in response to various concentrations of ATP were plotted against the ATP concentrations (n= 33). The sigmoidal curve was calculated with the Hill plot and the ED50 was estimated to be 1.7 × 10⁻⁵ M from the curve. C, representative time courses for [Ca2+]i responses to glutamate (Glu, 10−4 M) and ATP (10−3 M) obtained from a single SON neurone. D, summary data for Δ[Ca2+]i in response to glutamate (10−4 M) and ATP (10−3 M). The numbers in parentheses in this and subsequent figures represent the number of neurones examined.
Desensitization of ATP-induced [Ca2+]i increase
As distinct desensitization patterns were reported for the known P2X receptors (Lewis et al. 1995; Collo et al. 1996), the time course of desensitization of the ATP-induced [Ca2+]i increase was examined by applying ATP (10−4 M) for 30 s in 1 min intervals. In three out of nine neurones examined, the ATP-induced [Ca2+]i increase showed strong desensitization, which was reversible in 10-15 min (Fig. 5A). The remaining six neurones showed moderate or little desensitization in the [Ca2+]i response (Fig. 5B). The time course of desensitization of the [Ca2+]i response is summarized in Fig. 5C, where the decay in the [Ca2+]i response was fitted by a linear equation. The averaged slope of the regression lines for cells with strong desensitization was -20.1 ± 2.2 % and that with moderate or little desensitization was -5.3 ± 1.3 %. To minimize desensitization caused by repeated applications of purinergic agonists, each agonist was added with an interval of at least 15 min in experiments shown below.
Figure 5. Different patterns of desensitization in the ATP-induced [Ca2+]i increases.

To observe the time course of desensitization of the ATP-induced [Ca2+]i increases, 10−4 M ATP was repeatedly added for 30 s in 1 min intervals to the same cells (n= 9). A, an example of the time course of ATP-induced [Ca2+]i changes, where rapid desensitization was observed. A similar pattern of desensitization was seen in two other neurones. B, an example of the time course of ATP-induced [Ca2+]i changes, where little desensitization was observed. Similar desensitization was seen in five other neurones. C, patterns of desensitization in the ATP-induced [Ca2+]i increase observed in nine neurones are plotted by normalizing each response to the first response. The responses obtained from individual neurones (represented by different symbols) were fitted with a linear equation.
[Ca2+]i response to purinergic agonists and antagonists
The increase in [Ca2+]i induced by ATP (10−4 M) was mimicked by 2MeSATP (10−4 M) (Fig. 6A) and ATPγS (10−4 M) (Fig. 6D), whereas UDP (10−4 M) and UTP (10−4 M) showed little effect (Fig. 6A). AMP (10−4 M) and adenosine (10−4 M) caused little or no increase in [Ca2+]i in twenty-three neurones examined (data not shown). αβMeATP (10−4 M) caused an increase in [Ca2+]i in four of fourteen SON neurones (Fig. 6B), while it caused little or no increase in [Ca2+]i in the other ten neurones (Fig. 6A). ADP (10−4 M) caused an increase in [Ca2+]i in only three of ten SON neurones (Fig. 6A). The selective P2X7 receptor agonist BzATP at 10−5 M caused little increase in [Ca2+]i (n= 5), but caused a clear increase in [Ca2+]i when given at 10−4 M (n= 5) (Fig. 6C). The effects of the P2 agonists are summarized in Fig. 6E.
Figure 6. [Ca2+]i responses to purinergic receptor agonists.
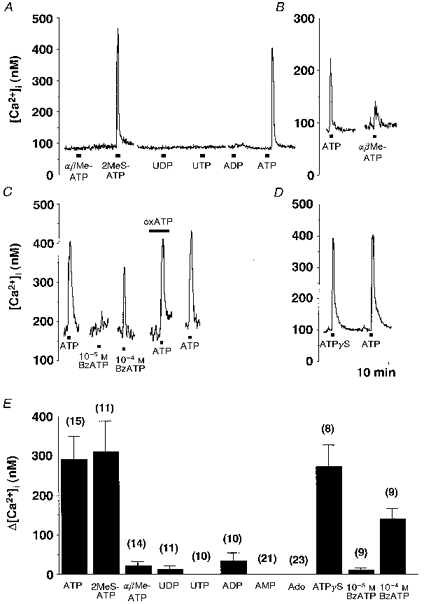
A, representative time course of [Ca2+]i changes in response to αβMeATP (10−4 M), 2MeSATP (10−4 M), UDP (10−4 M), UTP (10−4 M), ADP (10−4 M) and ATP (10−4 M). The responses were obtained from a single SON neurone. The breaks in the trace are approximately 5 min. B, comparison between [Ca2+]i changes in response to ATP (10−4 M) and αβMeATP (10−4 M). C, [Ca2+]i changes in response to BzATP (10−5 and 10−4 M) and effects of oxidized ATP (oxATP, 3 × 10⁻⁴ M) on ATP (10−4 M)-induced [Ca2+]i changes. D, comparison between [Ca2+]i changes in response to ATP (10−4 M) and ATPγS (10−4 M). E, summary data for Δ[Ca2+]i in response to the P2 agonists. Ado, adenosine.
The P2 antagonist suramin (10−4 M) reversibly blocked the ATP (10−4 M)-induced increase in [Ca2+]i by 65.3 ± 5.2 % (n= 7), and another P2 antagonist, PPADS (10−4 M), abolished the ATP (10−4 M)-induced increase in [Ca2+]i, also in a reversible manner (n= 6) (Fig. 7A). Preincubation with the P2X7 antagonist oxidized ATP (3 × 10⁻⁴ M) did not inhibit the response to ATP (10−4 M) (n= 5). The effects of the P2 antagonists are summarized in Fig. 7B.
Figure 7. Effects of purinergic receptor antagonists on the ATP-induced [Ca2+]i increase.
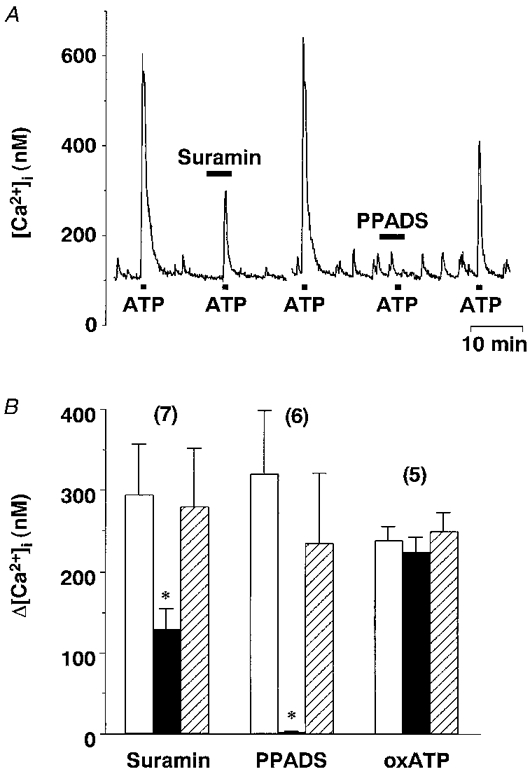
A, representative time courses showing effects of P2 antagonists suramin (10−4 M) and PPADS (10−4 M) on [Ca2+]i increases in response to ATP (10−4 M) obtained from a single neurone. The break in the trace is approximately 5 min. B, summary data for Δ[Ca2+]i in response to ATP (control, □ and  ) and ATP plus the P2 antagonist (▪). Post-controls were obtained 10-20 min after withdrawal of each antagonist. * Significantly different (P < 0.05) from the mean of the pre- and post-control values obtained with ATP alone.
[Ca2+]i response to purinergic agonists and glutamate in non-neuronal cells
In contrast with the relatively weak response to BzATP observed in SON neurones, the response to BzATP (10−4 M) observed in non-neuronal cells dissociated from the SON was more prominent than that to ATP (10−4 M) (Fig. 8). Non-neuronal cells could be readily distinguished from neuronal cells by their size and appearance. These cells were clearly smaller (10-15 μm in diameter) than SON magnocellular neurones and did not possess dendritic processes. Moreover, unlike SON neurones, they did not respond to glutamate (10−4 M) (Fig. 8B, lower panel). The [Ca2+]i responses to ATP, BzATP and glutamate obtained from eight such cells are summarized in Fig. 8C.
Figure 8. [Ca2+]i responses to ATP, BzATP and glutamate in non-neuronal cells.
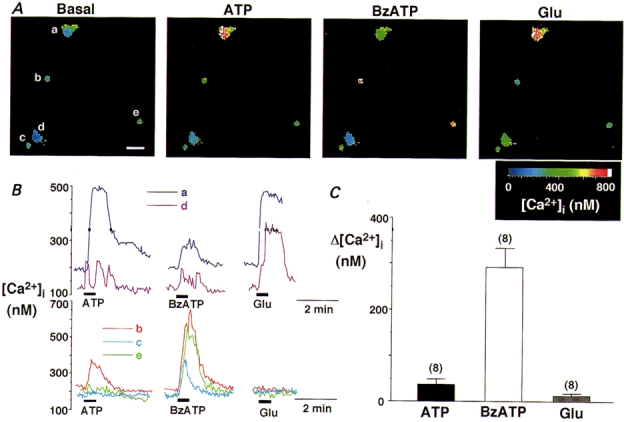
A, pseudo-colour [Ca2+]i images of neuronal and non-neuronal cells dissociated from the SON. The images showing responses to ATP (10−4 M), BzATP (10−4 M) and glutamate (10−4 M) were taken when [Ca2+]i reached a peak. Note that the two neuronal cells (the large cells marked a and d) responded to ATP, BzATP and glutamate, whereas the three other small cells (b, c and e) responded to BzATP (10−4 M) with the largest [Ca2+]i increases but did not respond to glutamate. Scale bar (lower right corner of the left-most panel) represents 25 μm. B, representative time courses of [Ca2+]i changes showing effects of ATP (10−4 M), BzATP (10−4 M) and glutamate (10−4 M) obtained in neuronal (upper panel) and non-neuronal cells (lower panel). C, summary data for Δ[Ca2+]i in response to ATP, BzATP and glutamate obtained in eight non-neuronal cells (including the three in A).
Source of ATP-induced [Ca2+]i increase
In eight of nine SON neurones, the ATP (10−4 M)-induced [Ca2+]i increase was entirely abolished in a Ca2+-free environment, where extracellular Ca2+ was chelated by 1 mM EGTA 30 s to 1 min prior to ATP application (Fig. 9A). With this procedure, large [Ca2+]i increases in response to 50 mM K+ were totally abolished (Hattori et al. 1998), indicating that a [Ca2+]i increase observed during this period can be ascribed to Ca2+ release from internal stores. In one neurone, ATP (10−4 M) caused an increase in [Ca2+]i of 84 nM in the Ca2+-free condition. Upon reintroduction of Ca2+ to the perfusion solution, a large single [Ca2+]i increase was consistently observed, as previously reported (Hattori et al. 1998; Shibuya et al. 1998b). After extracellular Ca2+ was restored, ATP induced an increase in [Ca2+]i, whose amplitude was similar to that observed in the first ATP application, in all nine neurones examined. When extracellular Na+ was replaced with N-methyl-D-glucamine (NMDG), ATP (10−4 M) caused only a small increase in [Ca2+]i (Fig. 9B). Cyclopiazonic acid (CPA, 10−5 M), an inhibitor of Ca2+-ATPase in intracellular Ca2+ stores, caused a sustained increase in [Ca2+]i (Fig. 9C), and the mean increase in [Ca2+]i from baseline was 38.4 ± 7.5 nM (n= 8). CPA (10−5 M) suppressed Ca2+ release in response to caffeine (10 mM) to less than 20 % of the control response (n= 14, data not shown), suggesting that this concentration of CPA effectively blocked Ca2+ uptake into intracellular Ca2+ stores of SON neurones, and thereby inactivated the Ca2+ release mechanism of these neurones. The ATP (10−4 M)-induced [Ca2+]i increase was virtually unaffected by CPA. The effects of extracellular Ca2+ removal, Na+ replacement and CPA are summarized in Fig. 9D.
Figure 9. Analysis of the source of [Ca2+]i increases induced by ATP.
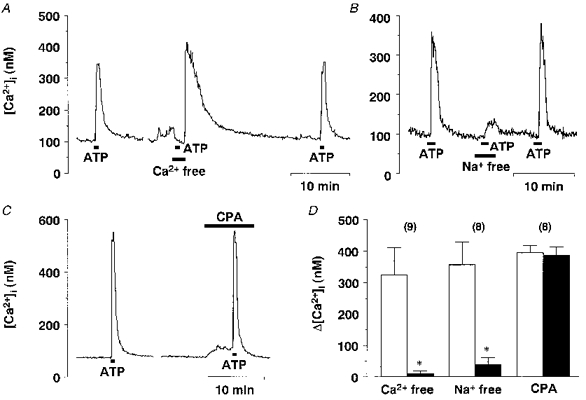
A, representative example of the effect of extracellular Ca2+ removal on the ATP-induced [Ca2+]i increase. Note that a large [Ca2+]i increase seen after the second ATP application is due to Ca2+ reintroduction into the perfusion media. B, representative example of the effects of extracellular Na+ replacement with NMDG on the ATP-induced [Ca2+]i increase. C, representative example of the effects of CPA (10−5 M) on the ATP-induced [Ca2+]i increase. D, summary data for the effects of Ca2+ removal, Na+ replacement and CPA. * Significantly different (P < 0.05) from the value obtained with ATP alone.
Patch-clamp analysis of ATP-induced currents
ATP (10−4 or 10−3 M) induced inward currents when the holding potential was -80 mV (Fig. 10A). The peak amplitude of the currents induced by ATP at 10−4 and 10−3 M was 53.0 and 79.9 %, respectively, of that induced by 10−4 M glutamate. There were two distinct patterns of desensitization of the ATP-induced currents: fifteen of nineteen neurones exhibited currents with slow or no desensitization (Fig. 10A), while the other four neurones showed currents with more rapid desensitization (Fig. 10B). In the latter four neurones, a second application of ATP caused small currents, whereas ATP added repeatedly caused similar currents in the former fifteen neurones. The time constants of decay of the currents were estimated by a single exponential fit and were 28.8 ± 3.8 s (n= 8) and 4.6 ± 0.4 s (n= 4) in neurones showing slow and rapid desensitization, respectively. In contrast, glutamate (10−4 M) caused currents with little desensitization in all thirty-three neurones examined.
Figure 10. Patch-clamp analysis of the ATP-induced currents.
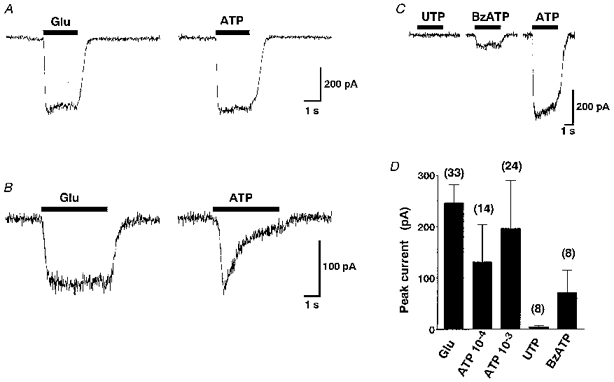
A and B, representative time courses of currents induced by glutamate (Glu, 10−4 M) and ATP (10−3 M) obtained from single SON neurones. A shows little desensitization, but B shows strong desensitization in the ATP-induced currents. In contrast, glutamate induced currents with similar time courses in both neurones. The holding potential was -80 mV. C, representative current responses to UTP (10−3 M), BzATP (10−4 M) and ATP (10−3 M) obtained from a single SON neurone. The breaks in the trace are 3-5 min. The holding potential was -80 mV. D, summary data for the peak inward currents induced by the purinergic agonists or glutamate. The major salt in the pipette used in experiments shown in this figure was caesium methanesulphonate.
BzATP (10−4 M; n= 8) caused inward currents, whereas UTP (10−3 M) caused no current in six neurones examined (Fig. 10C) and induced inward currents of smaller than 20 pA in the other two neurones. The peak currents induced by ATP and the other purinergic ligands as well as by glutamate are shown in Fig. 10D. The current-voltage (I-V) relationship of the ATP-induced currents obtained by applying ramp voltage commands from -80 to +20 mV showed strong inward rectification (Fig. 11A and B; n= 6). A similar I-V relationship was observed when Cl− was used instead of methanesulphonate as the major anion in the pipette (Fig. 11C and D; n= 8).
Figure 11. Current-voltage relationship of the ATP-induced currents.
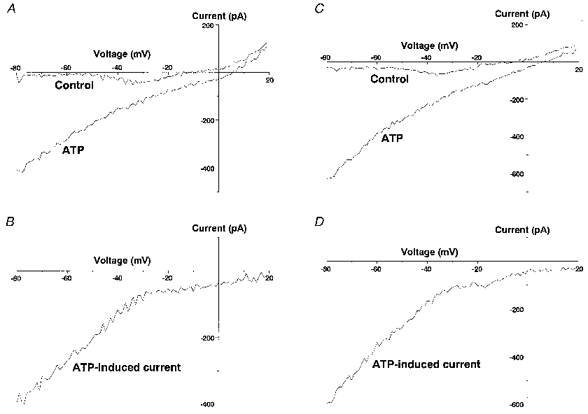
A, representative I-V relationship of membrane currents obtained in the presence and absence of 10−3 M ATP with caesium methanesulphonate as the major salt in the pipette. B, I-V relationship of currents obtained by subtracting the control currents from the currents obtained with 10−3 M ATP shown in A. C, representative I-V relationship of membrane currents obtained in the presence and absence of 10−3 M ATP with CsCl as the major salt in the pipette. D, I-V relationship of currents obtained by subtracting the control currents from the currents obtained with 10−3 M ATP shown in C.
DISCUSSION
P2X receptor mRNA in the SON
The present study demonstrated that mRNAs for P2X2, P2X3, P2X4, P2X6 and P2X7 were present in small (1 mm diameter) punch-out preparations of the SON. Since the SON is the only nucleus contained in the preparations (Kabashima et al. 1997), the mRNA signals can be regarded as those of P2X receptors expressed in neuronal or glial cells in the SON. Of the five mRNAs, the predominant ones were P2X3, P2X4 and P2X7. Using in situ hybridization histochemistry, mRNAs for P2X3 and P2X4 were identified throughout the SON, suggesting that these two P2X receptors may play a key role in the regulation of SON neurones by ATP. The finding was unexpected, since P2X3 receptors are known to be exclusively expressed in primary sensory neurones (Chen et al. 1995; Cook et al. 1997) and, therefore, have been implicated exclusively in nociception. To our knowledge, the present study provides the first evidence that P2X3 receptor mRNA is expressed in CNS neurones. As P2X3 mRNA expression was localized in the SON and PVN, P2X3 receptors could also be involved in the specialized functions of neurones in these two nuclei, such as regulation of body fluid and blood pressure, parturition and milk ejection or stress reactions.
Mechanisms of the ATP-induced [Ca2+]i increase
In this study, [Ca2+]i and ionic responses to ATP and other purinergic receptor agonists were examined in acutely dissociated SON neurones, and data were obtained from the magnocellular neurones identified according to their size and large responses to glutamate. The results of this study show that magnocellular neurones in the SON responded to ATP and other purinergic receptor agonists with an increase in [Ca2+]i. Of the P2 agonists tested, ATPγS and 2MeSATP were the most potent in increasing [Ca2+]i, whereas adenosine and AMP had little effect. These results indicate that P2, but not P1 (adenosine) receptors, are involved in the ATP-mediated [Ca2+]i increase in SON neurones. The finding that extracellular Ca2+ removal almost completely suppressed the ATP-induced [Ca2+]i increase in the majority of SON neurones indicates that the major pathway of [Ca2+]i increase is Ca2+ entry through the plasma membrane. Moreover, the potent inhibition of the ATP-induced [Ca2+]i increase by extracellular Na+ replacement suggests that the ATP-induced [Ca2+]i increase is strongly dependent on depolarization mediated by Na+ entry, and the primary pathway of Ca2+ entry is through voltage-dependent Ca2+ channels. The suggestion is consistent with the result that ATP induced inward currents when the holding potential was held at a negative potential. The I-V relationship of the ATP-induced currents and the lack of effect of the pipette Cl− concentration on the relationship indicate that ATP evokes cationic currents with strong inward rectification. Rat SON neurones possess several distinct types of voltage-dependent Ca2+ channels (T-, N-, P/Q-, L- and R-types) (Fisher & Bourque, 1995; Foehring & Armstrong, 1996; Harayama et al. 1998), and these channels would be activated during membrane depolarization caused by massive Na+ entry through P2X receptors. The residual [Ca2+]i increase observed in the absence of extracellular Na+ may reflect Ca2+ permeation through P2X receptors.
UTP, known as a potent agonist of most P2Y receptors, caused little or no [Ca2+]i response, indicating again that the ATP-induced response in SON neurones is mediated by P2X receptors. The lack of effect of UTP on ionic currents in most SON neurones is consistent with the [Ca2+]i results. Although UTP caused small currents in two neurones, this could also be due to activation of P2X receptors, as it has been reported that UTP can activate P2X1 and P2X3 receptors, although much less potently than ATP (Rae et al. 1998). The predominant role of P2X receptors is further supported by the present results that ATP did not cause a Ca2+ release response in the majority of SON neurones. On the other hand, several lines of evidence suggest that SON neurones possess functional internal Ca2+ stores: oxytocin or metabotropic glutamate agonists induced a [Ca2+]i increase in the absence of extracellular Ca2+ (Lambert et al. 1994; Hattori et al. 1998); and action potentials and synaptic currents observed in SON neurones were greatly influenced by chemicals that interact with Ca2+ stores (Brussaard et al. 1996; Li & Hatton, 1997). As P2Y receptors are known to couple with the Gq-phospholipase C β (PLCβ)-IP3 pathway and activation of P2Y receptors resulted in robust Ca2+ release from intracellular Ca2+ stores in various types of cells (Strobaek et al. 1996; Centemeri et al. 1997), the present results suggest that P2Y receptors are not present, or if present, they do not play a major role in Ca2+ signalling and ionic mechanisms in SON neurones.
Subtypes of P2X receptors mediating ATP-induced responses
The present experiments not only detected mRNAs for multiple P2X receptors in the SON but also provided indications for P2X receptor subtypes mediating the ATP-induced response in SON neurones. The reversible block of the ATP-induced [Ca2+]i response by suramin and PPADS is in good agreement with previous results that ATP-mediated responses in SON neurones are sensitive to these antagonists (Day et al. 1993; Hiruma & Bourque, 1995), and suggests that inhibitor-sensitive P2X receptors, either P2X2 or P2X3, are involved in the response. The results obtained with RT-PCR for P2X2 and P2X3 receptors and those obtained with in situ hybridization for P2X3 receptors support the suggestion. Moreover, two distinct desensitization patterns were observed in both the ATP-induced [Ca2+]i and whole-cell current responses. The results are indicative of involvement of P2X3 receptors in the ATP-induced response in the SON, as P2X1 and P2X3 receptors are the only two P2X receptors shown to exhibit such desensitization (Lewis et al. 1995), and P2X1 mRNA was not detected in the SON. The result that marked desensitization was observed in the minority of SON neurones could be explained if P2X3 and other P2X receptors formed heteromultimers in the majority of SON neurones, as heteromultimers formed by P2X2 and P2X3 receptors resulted in non-desensitizing currents (Lewis et al. 1995). The possibility should be examined by comparing the current response and the molecular subtype of P2X receptors in individual SON neurones.
Marked expression of P2X7 mRNA was detected with RT-PCR in the SON. This result, together with the [Ca2+]i and current responses to the selective P2X7 agonist BzATP observed in the present study, suggests that P2X7 could also function in SON neurones. However, BzATP caused little [Ca2+]i response in SON neurones at 10−5 M, indicating that it is a weaker agonist than ATP. This is in clear contrast to the result obtained in several other preparations that BzATP activated P2X7 receptors at low concentrations (10−6 to 10−5 M) and was approximately one order of magnitude more potent than ATP (Kaiho et al. 1997; Chessell et al. 1997). Moreover, preincubation with the selective P2X7 receptor antagonist oxidized ATP did not affect the response to ATP in SON neurones, although oxidized ATP has been shown to antagonize P2X7-mediated responses irreversibly in several other types of cell (Murgia et al. 1993; Inoue et al. 1998). Furthermore, several other properties reported for P2X7 receptors, such as high Ca2+ permeability and weak inward rectification (Surprenant et al. 1996; Chessell et al. 1997), do not match the properties of the responses to ATP observed in SON neurones. As signals for P2X7 mRNA were also detected in the optic chiasma, the strong signal obtained from the SON with the primers for P2X7 mRNA could be due to expression in glial cells or other non-neuronal cells contained in the punch-out preparations. This interpretation is supported by the present result that a more prominent [Ca2+]i increase was observed in response to BzATP in small cells without dendritic processes, which did not respond to glutamate. Moreover, it is consistent with a report that P2X7 receptors are expressed in microglial or ependymal cells in the brain (Collo et al. 1997).
It has recently been reported that vasopressin release from nerve terminals was enhanced by activation of P2X receptors (Troadec et al. 1998). The authors proposed that ATP co-released with neurohypophysial peptides may serve as a paracrine/autocrine messenger in the posterior pituitary. Although the subtype of P2X receptors responsible for this action at the terminals is still unknown, some of the P2X receptor mRNAs detected in the SON in the present study may reflect presynaptic P2X receptors at the neurohypophysial terminals.
Physiological significance
The block of A1-mediated excitation of SON neurones by suramin observed in vivo (Day et al. 1993; Buller et al. 1996) strongly suggests involvement of ATP in the excitatory regulation of SON neurones. In central and peripheral synapses, it has been shown that postsynaptic P2X receptors mediate fast synaptic inputs (Edwards et al. 1992; Bardoni et al. 1997; LePard et al. 1997; Nieber et al. 1997). In the SON, however, measurements of synaptic currents in slice preparations have revealed that the non-NMDA receptor agonist 6-cyano-7-nitroquinoxaline-2,3-dione (CNQX), applied together with the GABAA antagonist bicuculline, reduced electrically evoked EPSCs by more than 90 % (Kombian et al. 1996), and CNQX totally abolished spontaneous (miniature) EPSCs (Kabashima et al. 1997). These results suggest that purinergic transmission does not contribute significantly to fast synaptic inputs into SON neurones. This could be due to the fact that much fewer synaptic inputs remain in vitro. Alternatively, it could be that ATP acting on postsynaptic P2X receptors causes slow membrane depolarization, thereby increasing the firing frequency of SON neurones. ATP could also play a role in the long-term regulation of SON neurones, as suggested for neuronal as well as glial cells (Neary et al. 1996). The robust rises in [Ca2+]i observed in response to ATP in the present study support the suggestion, as a rise in [Ca2+]i in the soma has been implicated in the regulation of gene transcription or synaptic plasticity in various types of neurones. In SON neurones, it has been reported that an increase in [Ca2+]i regulates membrane potentials (Li & Hatton, 1997) or the amplitude of GABAergic synaptic currents (Brussaard et al. 1996).
It has been implied that [Ca2+]i in not only axon endings but also soma and dendrites plays a crucial role in various functions of neuronal cells. We have previously shown that pituitary adenylate cyclase-activating polypeptide (PACAP) and various glutamate agonists increase the [Ca2+]i of the soma and dendrites of SON neurones, either by enhancing extracellular Ca2+ entry through voltage-dependent Ca2+ channels or by inducing Ca2+ release from intracellular Ca2+ stores (Hattori et al. 1998; Shibuya et al. 1998b), and that there is a close correlation between [Ca2+]i and electrical activity in SON neurones (Shibuya et al. 1998a). Moreover, several other physiologically relevant ligands for SON neurones, such as vasopressin, oxytocin, angiotensin II and noradrenaline, elicit dynamic changes in [Ca2+]i of the soma of SON neurones (Lambert et al. 1994; Dayanithi et al. 1996; Shioda et al. 1997; Shibuya et al. 1998b). The present study revealed that ATP is another neurotransmitter/modulator that causes a large increase in [Ca2+]i of the soma of SON neurones. Taken together, these results suggest that Ca2+ signalling in the soma and dendrites could be a common key mechanism for regulating the function of SON neurones.
In conclusion, the present study indicates that multiple P2X receptors, including P2X3 receptors, are functionally expressed in SON neurosecretory neurones and that activation of these receptors induces cationic currents and Ca2+ entry through the plasma membrane. Such ionic and [Ca2+]i-signalling mechanisms may play an important role in the regulation of the function of SON neurones.
Acknowledgments
The authors are grateful to Dr Kazuhide Inoue (National Institute of Health Sciences, Tokyo, Japan) for helpful comments on the study. This work was supported in part by Grants-in-Aid from the Ministry of Education, Science, Sports and Culture of Japan to I. S. (09470020) and to H. Y. (10470019), and from the Japan Society for Promotion of Science to T. K. (1173).
References
- Bardoni R, Goldstein PA, Lee CJ, Gu JG, MacDermott AB. ATP P2X receptors mediate fast synaptic transmission in the dorsal horn of the rat spinal cord. Journal of Neuroscience. 1997;17:5297–5304. doi: 10.1523/JNEUROSCI.17-14-05297.1997. [DOI] [PMC free article] [PubMed] [Google Scholar]
- Bo X, Zhang Y, Nassar M, Burnstock G, Schoepfer R. A P2X purinoceptor cDNA conferring a novel pharmacological profile. FEBS Letters. 1995;375:129–133. doi: 10.1016/0014-5793(95)01203-q. [DOI] [PubMed] [Google Scholar]
- Brussaard AB, Kits KS, de Vlieger TA. Postsynaptic mechanism of depression of GABAergic synapses by oxytocin in the supraoptic nucleus of immature rat. The Journal of Physiology. 1996;497:495–507. doi: 10.1113/jphysiol.1996.sp021783. [DOI] [PMC free article] [PubMed] [Google Scholar]
- Buell G, Lewis C, Collo G, North RA, Surprenant A. An antagonist-insensitive P2X receptor expressed in epithelia and brain. EMBO Journal. 1996;15:55–62. [PMC free article] [PubMed] [Google Scholar]
- Buller KM, Khanna S, Sibbald JR, Day TA. Central noradrenergic neurons signal via ATP to elicit vasopressin responses to haemorrhage. Neuroscience. 1996;73:637–642. doi: 10.1016/0306-4522(96)00156-x. [DOI] [PubMed] [Google Scholar]
- Centemeri C, Bolego C, Abbracchio MP, Cattabeni F, Puglisi L, Burnstock G, Nicosia S. Characterization of the Ca2+ responses evoked by ATP and other nucleotides in mammalian brain astrocytes. British Journal of Pharmacology. 1997;121:1700–1706. doi: 10.1038/sj.bjp.0701293. [DOI] [PMC free article] [PubMed] [Google Scholar]
- Chen CC, Akopian AN, Sivilotti L, Colquhoun D, Burnstock G, Wood JN. A P2X purinoceptor expressed by a subset of sensory neurons. Nature. 1995;377:428–431. doi: 10.1038/377428a0. [DOI] [PubMed] [Google Scholar]
- Chen ZP, Levy A, Lightman SL. Activation of specific ATP receptors induces a rapid increase in intracellular calcium ions in rat hypothalamic neurons. Brain Research. 1994;641:249–256. doi: 10.1016/0006-8993(94)90151-1. [DOI] [PubMed] [Google Scholar]
- Chessell IP, Michel AD, Humphrey PP. Properties of the pore-forming P2X7 purinoceptor in mouse NTW8 microglial cells. British Journal of Pharmacology. 1997;121:1429–1437. doi: 10.1038/sj.bjp.0701278. [DOI] [PMC free article] [PubMed] [Google Scholar]
- Collo G, Neidhart S, Kawashima E, Kosco Vilbois M, North RA, Buell G. Tissue distribution of the P2X7 receptor. Neuropharmacology. 1997;36:1277–1283. doi: 10.1016/s0028-3908(97)00140-8. [DOI] [PubMed] [Google Scholar]
- Collo G, North RA, Kawashima E, Merlo Pich E, Neidhart S, Surprenant A, Buell G. Cloning of P2X5 and P2X6 receptors and the distribution and properties of an extended family of ATP-gated ion channels. Journal of Neuroscience. 1996;16:2495–2507. doi: 10.1523/JNEUROSCI.16-08-02495.1996. [DOI] [PMC free article] [PubMed] [Google Scholar]
- Cook SP, Vulchanova L, Hargreaves KM, Elde R, McCleskey EW. Distinct ATP receptors on pain-sensing and stretch-sensing neurons. Nature. 1997;387:505–508. doi: 10.1038/387505a0. [DOI] [PubMed] [Google Scholar]
- Day TA, Renaud LP, Sibbald JR. Excitation of supraoptic vasopressin cells by stimulation of the A1 noradrenaline cell group: failure to demonstrate role for established adrenergic or amino acid receptors. Brain Research. 1990;516:91–98. doi: 10.1016/0006-8993(90)90901-m. 10.1016/0006-8993(90)90901-M. [DOI] [PubMed] [Google Scholar]
- Day TA, Sibbald JR, Khanna S. ATP mediates an excitatory noradrenergic neuron input to supraoptic vasopressin cells. Brain Research. 1993;607:341–344. doi: 10.1016/0006-8993(93)91528-z. 10.1016/0006-8993(93)91528-Z. [DOI] [PubMed] [Google Scholar]
- Dayanithi G, Widmer H, Richard P. Vasopressin-induced intracellular Ca2+ increase in isolated rat supraoptic cells. The Journal of Physiology. 1996;490:713–727. doi: 10.1113/jphysiol.1996.sp021180. [DOI] [PMC free article] [PubMed] [Google Scholar]
- Decavel C, Van den Pol A. GABA: a dominant neurotransmitter in the hypothalamus. Journal of Comparative Neurology. 1990;302:1019–1037. doi: 10.1002/cne.903020423. [DOI] [PubMed] [Google Scholar]
- Edwards FA, Gibb AJ, Colquhoun D. ATP receptor-mediated synaptic currents in the central nervous system. Nature. 1992;359:144–147. doi: 10.1038/359144a0. 10.1038/359144a0. [DOI] [PubMed] [Google Scholar]
- Fisher TE, Bourque CW. Voltage-gated calcium currents in the magnocellular neurosecretory cells of the rat supraoptic nucleus. The Journal of Physiology. 1995;486:571–580. doi: 10.1113/jphysiol.1995.sp020835. [DOI] [PMC free article] [PubMed] [Google Scholar]
- Foehring RC, Armstrong WE. Pharmacological dissection of high-voltage-activated Ca2+ current types in acutely dissociated rat supraoptic magnocellular neurons. Journal of Neurophysiology. 1996;76:977–983. doi: 10.1152/jn.1996.76.2.977. [DOI] [PubMed] [Google Scholar]
- Grynkiewicz G, Poenie M, Tsien RY. A new generation of Ca2+ indicators with greatly improved fluorescence properties. Journal of Biological Chemistry. 1985;260:3440–3450. [PubMed] [Google Scholar]
- Harayama N, Shibuya I, Tanaka K, Kabashima N, Ueta Y, Yamashita H. Inhibiton of N- and P/Q-type calcium channels by postsynaptic GABAB receptor activation in rat supraoptic neurones. The Journal of Physiology. 1998;509:371–383. doi: 10.1111/j.1469-7793.1998.371bn.x. [DOI] [PMC free article] [PubMed] [Google Scholar]
- Hattori Y, Shibuya I, Tanaka K, Kabashima N, Ueta Y, Yamashita H. Ionotropic and metabotropic glutamate agonist-induced [Ca2+]i increase in isolated rat supraoptic neurones. Journal of Neuroendocrinology. 1998;10:383–389. doi: 10.1046/j.1365-2826.1998.00219.x. 10.1046/j.1365-2826.1998.00219.x. [DOI] [PubMed] [Google Scholar]
- Hiruma H, Bourque CW. P2 purinoceptor-mediated depolarization of rat supraoptic neurosecretory cells in vitro. The Journal of Physiology. 1995;489:805–811. doi: 10.1113/jphysiol.1995.sp021093. [DOI] [PMC free article] [PubMed] [Google Scholar]
- Inoue K, Nakajima K, Morimoto T, Kikuchi Y, Koizumi S, Illes P, Kohsaka S. ATP stimulation of Ca2+-dependent plasminogen release from cultured microglia. British Journal of Pharmacology. 1998;123:1304–1310. doi: 10.1038/sj.bjp.0701732. [DOI] [PMC free article] [PubMed] [Google Scholar]
- Kabashima N, Shibuya I, Ibrahim Y, Ueta Y, Yamashita H. Inhibition of spontaneous EPSCs and IPSCs by presynaptic GABAB receptors on rat supraoptic magnocellular neurons. The Journal of Physiology. 1997;504:103–126. doi: 10.1111/j.1469-7793.1997.113bf.x. [DOI] [PMC free article] [PubMed] [Google Scholar]
- Kaiho H, Kimura J, Matsuoka I, Kumasaka T, Nakanishi H. ATP-activated nonselective cation current in NG 108–15 cells. Journal of Neurochemistry. 1996;67:398–406. doi: 10.1046/j.1471-4159.1996.67010398.x. [DOI] [PubMed] [Google Scholar]
- Kombian SB, Zidichoudki JA, Pittman QJ. GABAB receptors presynaptically modulate excitatory synaptic transmission in the rat supraoptic nucleus in vitro. Journal of Neurophysiology. 1996;76:1166–1179. doi: 10.1152/jn.1996.76.2.1166. [DOI] [PubMed] [Google Scholar]
- Lambert RC, Dayanithi G, Moos RC, Richard P. A rise in the intracellular Ca2+ concentration of isolated rat supraoptic cells in response to oxytocin. The Journal of Physiology. 1994;478:275–288. doi: 10.1113/jphysiol.1994.sp020249. [DOI] [PMC free article] [PubMed] [Google Scholar]
- LePard KJ, Messori E, Galligan JJ. Purinergic fast excitatory postsynaptic potentials in myenteric neurons of guinea pig: distribution and pharmacology. Gastroenterology. 1997;113:1522–1534. doi: 10.1053/gast.1997.v113.pm9352854. [DOI] [PubMed] [Google Scholar]
- Lewis C, Neidhart S, Holy C, North RA, Buell G, Surprenant A. Coexpression of P2X2 and P2X3 receptor subunits can account for ATP-gated currents in sensory neurons. Nature. 1995;377:432–435. doi: 10.1038/377432a0. 10.1038/377432a0. [DOI] [PubMed] [Google Scholar]
- Li Z, Hatton GI. Ca2+ release from internal stores: role in generating depolarizing after-potentials in rat supraoptic neurones. The Journal of Physiology. 1997;498:339–350. doi: 10.1113/jphysiol.1997.sp021862. [DOI] [PMC free article] [PubMed] [Google Scholar]
- Mateo J, Garcia Lecea M, Miras Portugal MT, Castro E. Ca2+ signals mediated by P2X-type purinoceptors in cultured cerebellar Purkinje cells. Journal of Neuroscience. 1998;18:1704–1712. doi: 10.1523/JNEUROSCI.18-05-01704.1998. [DOI] [PMC free article] [PubMed] [Google Scholar]
- Murgia M, Hanau S, Pizzo P, Rippa M, Di Virgilio F. Oxidized ATP. An irreversible inhibitor of the macrophage purinergic P2Z receptor. Journal of Biological Chemistry. 1993;268:8199–8203. [PubMed] [Google Scholar]
- Nagatomo T, Shibuya I, Kabashima N, Harayama N, Ueta Y, Toyohira Y, Uezono Y, Yanagihara N, Izumi F, Wada A, Yamashita H. Proadrenomedullin N-terminal 20 peptide (PAMP) reduces inward currents and Ca2+ rises induced by nicotine in bovine adrenal medullary cells. Life Sciences. 1996;59:1723–1730. doi: 10.1016/s0024-3205(96)00509-7. 10.1016/S0024-3205(96)00509-7. [DOI] [PubMed] [Google Scholar]
- Neary JT, Rathbone MP, Cattabeni F, Abbracchio MP, Burnstock G. Trophic actions of extracellular nucleotides and nucleosides on glial and neuronal cells. Trends in Neurosciences. 1996;19:13–18. doi: 10.1016/0166-2236(96)81861-3. 10.1016/0166-2236(96)81861-3. [DOI] [PubMed] [Google Scholar]
- Nieber K, Poelchen W, Illes P. Role of ATP in fast excitatory synaptic potentials in locus coeruleus neurones of the rat. British Journal of Pharmacology. 1997;122:423–430. doi: 10.1038/sj.bjp.0701386. [DOI] [PMC free article] [PubMed] [Google Scholar]
- North RA, Barnard EA. Nucleotide receptors. Current Opinion in Neurobiology. 1997;7:346–357. doi: 10.1016/s0959-4388(97)80062-1. 10.1016/S0959-4388(97)80062-1. [DOI] [PubMed] [Google Scholar]
- Radford KM, Virginio C, Surprenant A, North RA, Kawashima E. Baculovirus expression provides direct evidence for heteromeric assembly of P2X2 and P2X3 receptors. Journal of Neuroscience. 1997;17:6529–6533. doi: 10.1523/JNEUROSCI.17-17-06529.1997. [DOI] [PMC free article] [PubMed] [Google Scholar]
- Rae MG, Rowan EG, Kennedy C. Pharmacological properties of P2X3-receptors present in neurones of the rat dorsal root ganglia. British Journal of Pharmacology. 1998;124:176–180. doi: 10.1038/sj.bjp.0701803. [DOI] [PMC free article] [PubMed] [Google Scholar]
- Sawchenko PE, Swanson LW. Central noradrenergic pathways for the integration of hypothalamic neuroendocrine and autonomic responses. Science. 1981;214:685–687. doi: 10.1126/science.7292008. [DOI] [PubMed] [Google Scholar]
- Seguela P, Haghighi A, Soghomonian JJ, Cooper E. A novel neuronal P2X ATP receptor ion channel with widespread distribution in the brain. Journal of Neuroscience. 1996;16:448–455. doi: 10.1523/JNEUROSCI.16-02-00448.1996. [DOI] [PMC free article] [PubMed] [Google Scholar]
- Shibuya I, Kabashima N, Tanaka K, Noguchi J, Harayama N, Ueta Y, Yamashita H. Patch-clamp analysis of PACAP-induced excitation in rat supraoptic neurones. Journal of Neuroendocrinology. 1998a;10:759–768. doi: 10.1046/j.1365-2826.1998.00260.x. 10.1046/j.1365-2826.1998.00260.x. [DOI] [PubMed] [Google Scholar]
- Shibuya I, Noguchi J, Tanaka K, Harayama N, Inoue Y, Kabashima N, Ueta Y, Hattori Y, Yamashita H. PACAP increases the cytosolic Ca2+ concentration and stimulates somatodendritic vasopressin release in rat supraoptic neurons. Journal of Neuroendocrinology. 1998b;10:31–42. doi: 10.1046/j.1365-2826.1998.00168.x. 10.1046/j.1365-2826.1998.00168.x. [DOI] [PubMed] [Google Scholar]
- Shioda S, Yada T, Muroya S, Takigawa M, Nakai Y. Noradrenaline activates vasopressin neurons via α1-receptor-mediated Ca2+ signaling pathway. Neuroscience Letters. 1997;226:210–212. doi: 10.1016/s0304-3940(97)00275-9. 10.1016/S0304-3940(97)00275-9. [DOI] [PubMed] [Google Scholar]
- Strobaek D, Olesen SP, Christophersen P, Dissing S. P2-purinoceptor-mediated formation of inositol phosphates and intracellular Ca2+ transients in human coronary artery smooth muscle cells. British Journal of Pharmacology. 1996;118:1645–1652. doi: 10.1111/j.1476-5381.1996.tb15587.x. [DOI] [PMC free article] [PubMed] [Google Scholar]
- Surprenant A, Rassendren F, Kawashima E, North RA, Buell G. The cytolytic P2Z receptor for extracellular ATP identified as a P2X receptor (P2X7) Science. 1996;272:735–738. doi: 10.1126/science.272.5262.735. [DOI] [PubMed] [Google Scholar]
- Troadec JD, Thirion S, Nicaise G, Lemos JR, Dayanithi G. The effects of ATP on intracellular Ca2+ and vasopressin release from isolated rat neurohypophysial terminals. The Journal of Physiology. 1998;506.P:66–67P. doi: 10.1111/j.1469-7793.1998.089bi.x. [DOI] [PMC free article] [PubMed] [Google Scholar]
- Van den Pol AN, Wuarin JP, Dudek FE. Glutamate, the dominant excitatory transmitter in neuroendocrine regulation. Science. 1990;250:1276–1278. doi: 10.1126/science.1978759. [DOI] [PubMed] [Google Scholar]
- Wuarin JP, Dudek FE. Patch-clamp analysis of spontaneous synaptic currents in supraoptic neuroendocrine cells of the rat hypothalamus. Journal of Neuroscience. 1993;13:2323–2331. doi: 10.1523/JNEUROSCI.13-06-02323.1993. [DOI] [PMC free article] [PubMed] [Google Scholar]