

Abstract
Presynaptic effects of muscarine on neurotransmitter release were studied at the frog neuromuscular junction, using focal depolarization of the presynaptic terminal to different levels.
Muscarine (10 μM) had a dual effect on ACh release: concomitant inhibition and enhancement of release at the same patch of presynaptic membrane.
These two effects were maximal at low depolarizing pulses and diminished as depolarization increased.
At low depolarizing pulses, atropine (1 μM) enhanced release, suggesting that ACh in the synaptic cleft causes a net tonic inhibition of ACh release.
In the presence of the M2 antagonist methoctramine (1 μM), muscarine (10 μM) enhanced ACh release.
In the presence of the M1 antagonist pirenzepine (10 μM), muscarine (10 μM) produced stronger inhibition.
These results show that the M2 receptor is responsible for inhibition of ACh release, while the M1 receptor is responsible for its enhancement.
The inhibitory effect of muscarine did not depend on extracellular [Ca2+]. Enhancement of release was abolished at low extracellular [Ca2+].
The muscarine inhibitory effect was not associated with a reduction of Ca2+ current, while release enhancement was associated with an increase of Ca2+ current.
Presynaptic muscarinic receptors are involved in modulation of neurotransmitter release in cholinergic synapses (for review, see Caulfield, 1993). In some cases, muscarine was found to reduce release (Abbs & Joseph, 1981; Arenson, 1989), in others it increased release (Ganguly & Das, 1979), and in some cases muscarine produced both effects (Wessler et al. 1987b). The types of muscarinic receptors involved in inhibition or enhancement of release are not fully resolved. For example, several authors have suggested that activation of the M2 receptor is responsible for the inhibitory effect of muscarine (Allen & Brown, 1993; Bellingham & Berger, 1996), while others have suggested that M2 and M1 receptors (Vannucchi & Pepeu, 1995) or M2 and M3 (Ren & Harty, 1994) are involved. Hsu et al. (1995) have suggested that the M3 receptor is responsible for the inhibitory effect. Concerning the enhancement of ACh release, studies have shown that only the M1 receptor is involved (Ren & Harty, 1994).
Another unresolved question concerns the mechanisms underlying muscarinic autoreceptor-mediated regulation of ACh release. In particular, it is not clear whether changes in Ca2+ influx are responsible for the inhibitory or the excitatory effects. The following findings were interpreted as indicating that a reduction in Ca2+ influx underlies the muscarinic-mediated inhibition of ACh release: (i) inhibition of ACh release by muscarinic agonists was higher at lower extracellular concentrations of Ca2+ ([Ca2+]o) (Wessler et al. 1987a); (ii) muscarine did not modulate release of ACh induced by a calcium ionophore (Onge et al. 1986); (iii) muscarine-mediated inhibition was higher at low rather than high frequencies of stimulation (Wessler et al. 1987a); (iv) ACh was found to inhibit Ca2+ currents in rat sympathetic neurons (Wanke et al. 1987); and (v) high concentrations of ACh and muscarine (100 μM) reduced Ca2+ currents in motor nerve terminals of the mouse neuromuscular junction (Hamilton & Smith, 1991).
However, other observations suggest that muscarine-mediated inhibition does not involve changes in Ca2+ influx. Scanziani et al. (1995) observed that in hippocampal slices, the frequency of spontaneous miniature excitatory postsynaptic currents decreased after addition of methacholine, a muscarinic agonist. This result was obtained even in the presence of cadmium ions, which block Ca2+ entry. These researchers concluded that inhibition of evoked release, in addition to spontaneous release, is not associated with a reduction in Ca2+ influx. Using the electric organ of Torpedo, Muller et al. (1987) showed that the inhibition of ACh release by oxotremorine, a non-selective agonist of muscarinic receptors, was independent of external Ca2+ concentration. This finding is similar to that of Dolezal & Tu´cek (1993), who found that the effect of muscarine on ACh release from brain synaptosomes remained at essentially the same level within a broad range of extracellular Ca2+ concentrations (0.25-4 mM). In the present study, we investigated the muscarinic regulation of ACh release at the frog neuromuscular junction (NMJ) and found that muscarine had a dual effect, causing both inhibition and enhancement of release. The level of both effects depended on the amplitude of the depolarizing pulse administered to the presynaptic terminal. A stronger inhibitory effect of muscarine was obtained at low depolarizing pulses (slightly above the depolarization threshold for release) than at higher pulses. Similarly, the enhancement of release was also stronger at low depolarizing pulses, and diminished as the pulse amplitude increased. We further found that the M1 receptor subtype was responsible for enhancement of release and that this effect was associated with an increase in Ca2+ currents measured at the presynaptic terminal. The M2 receptor subtype, on the other hand, was responsible for inhibition of release, and this effect was not associated with a reduction in presynaptic Ca2+ currents.
METHODS
Preparation and solutions
Frogs (Rana ridibunda) were killed by stunning followed by double pithing and the cutaneous pectoris nerve-muscle preparation was isolated. The preparation was held by small insect pins in a chamber with a Sylgard bottom (1.5 cm × 4 cm × 0.4 cm). The temperature was kept at 8 ± 1°C by circulating (Gilson Minipuls 3) the fluid through a cooling device. The standard bathing solution was composed of (mM): NaCl, 116; KCl, 2; MgCl2, 1; Hepes, 2. Unless otherwise stated, the CaCl2 concentration was 1 mM. The pH was adjusted to 7.2-7.4 by adding NaOH. When a macropatch electrode (see below) was used to depolarize a presynaptic terminal, tetrodotoxin (TTX) (0.2 μM) was added to block sodium excitability.
Recording and stimulation
Single quanta events were recorded with the macropatch recording system described by Dudel (1981). Focal depolarization was achieved by passing constant, rectangular negative current pulses through the macropatch electrode. These negative current pulses shift the extracellular potential to a more negative value, reducing the difference between the intracellular and extracellular potentials. The fraction of current which flows through the small patch of presynaptic membrane is negligible, hence changes in the membrane potential (which, if they occur at all, should be hyperpolarizing) outside the electrode are practically non-existent. It should be emphasized that the level of depolarization of the membrane below the macropatch electrode does not depend on the input resistance of this membrane (about 1011Ω, if the specific membrane resistance is taken as 10 000 Ω cm2) as long as the input resistance is much higher than the seal resistance (100-150 kΩ). For this reason, small changes in conductance (up to and exceeding 50 %) which may occur during drug application do not significantly affect the final level of depolarization (Dudel, 1981). Three millimetre glass capillaries (Clark Electromedical Instruments, Pangbourne, UK) were used for the macropatch electrodes. The electrodes were pulled on a vertical Narishige puller. The tip of the pulled electrode was cut to give an opening of 30-40 μm and it was heat polished to an opening of ∼15-20 μm. Pulse duration was 1 ms, and the amplitudes of the pulses varied from -0.6 to -2.0 μA. We used a Wild M-5 dissecting microscope with bottom illumination to place the electrode over a terminal (seal resistance, 100-150 kΩ). The electrode was carefully moved over the terminal until a release site that showed quanta with a fast rise time (< 0.6 ms) and an amplitude of approximately 1 nA was found (Fig. 1A).
Figure 1. Effect of muscarine on release.
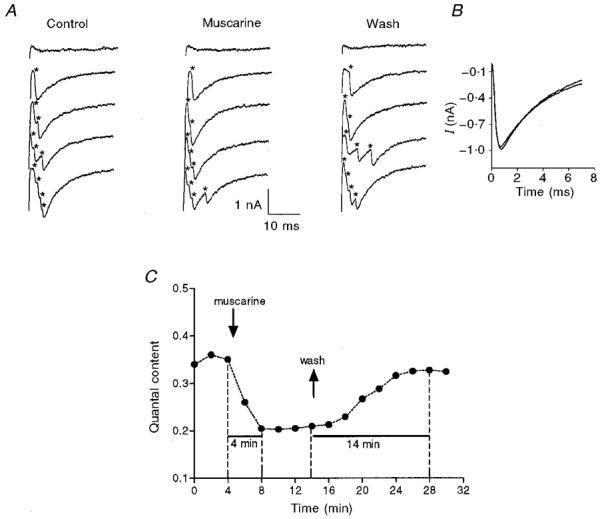
A, traces showing quantum events (marked by *) obtained in control (left), in the presence of 10 μM muscarine (middle) and after wash (right). B, superimposed averages of 100 single quantal events in control, and in the presence of 10 μM muscarine (same experiment as in A). C, time course of the effect of muscarine. Arrows indicate changes of solution.
Determining the quantal content
At 8°C, quanta appeared after the stimulus artifact (Fig. 1A). At a quantal content smaller than three, single quantum events could be discerned even when several quanta were released together. Sample recordings are given in Fig. 1A. These traces were selected to show, from top to bottom, a failure in release, one quantum, two quanta, three and four quanta (the quanta are marked by asterisks). At high quantal contents, it was sometimes difficult to discern single quanta events, especially when several quanta were released simultaneously. This may introduce an error and an underestimation of the number of released quanta at the higher quantal contents. Since in our experiments the quantal content was smaller than three, this error, if it occurs at all, is insignificant. We counted the total number of quanta for a given set of stimuli (from 256 at higher quantal contents to 5000 at low (0.01-0.05) quantal contents). Dividing the total number of quanta released by the number of applied pulses gives the quantal content directly. This method does not depend on the amplitude of the single quantum event, which in any case was not affected by muscarine (Fig. 1B). This latter result shows that at the concentrations used (up to 50 μM), muscarine had no postsynaptic effects.
Current traces were digitized using a neurodata (Neurorecorder DR-484) A/D converter at 50 kHz, and stored on video cassettes. In parallel, the traces were transferred to a Pentium computer (Philips 200 MHz) using the Labview (AT-MIO-16F-5, NI-DAQ 4.9.0 driver software) interface.
Experimental procedure
To determine the time needed to achieve the maximal effect of the added drug, we conducted experiments as shown in Fig. 1C. First, the quantal content (m) of the control was determined. The electrode was perfused with normal Ringer solution (see below) for several sets of pulses given at 3 Hz. After control quantal content stabilized (i.e. varied less than 10 %), the electrode was perfused with a solution containing the agonist or antagonist under study (or a combination of the two), and the quantal content was determined continuously. Figure 1C shows that even though the drug reached the synaptic cleft in a few seconds (Parnas et al. 1996), several minutes elapsed from the moment of drug application (first down arrow) until quantal content stabilized at a new, lower level. In the trial shown in Fig. 1C, quantal content recovered to the control level after 14 min of washing. In all our experiments, the time required to obtain maximal effect of the drug varied from 2 to 5 min, and the time required for maximal recovery varied from 10 to 20 min. We therefore tested for the effect of the drug 10 min after application, and for recovery after 30 min of washing.
Drug application
For local drug application, we used the rapid electrode perfusion technique (for details, see Parnas et al. 1996). In brief, a fine tube was inserted up to the very tip of the macropatch electrode. This tube was connected via a switch to two reservoirs. One reservoir contained the normal Ringer solution, the second reservoir contained the Ringer solution with an agonist, antagonist or both. The drugs were applied to the region below the electrode and its immediate vicinity by a small positive pressure. This technique enabled us to change the solution in the electrode only, or in the electrode and the bath. For example, it was possible to perfuse the electrode with a solution containing TTX, while the bath solution contained no TTX. This enabled us to stimulate the nerve to produce a propagating action potential, but without obtaining an action potential below the electrode. Similarly, it was possible to superfuse the preparation with a solution without Ca2+ while the solution in the electrode contained Ca2+. This latter combination was used to prevent muscle contraction when the nerve was stimulated. Release could still be obtained, since the region below the electrode was exposed to Ca2+. In a similar way, we were able to perfuse both the electrode and the bath with a solution containing the different agonists and/or antagonists.
Statistical evaluation
For each group of experiments, data were normalized to allow comparison between different sites. For each experiment, the control was taken as 100 % and changes were calculated accordingly. Significance was checked by Student's paired (drug treatment in the same experiment) and unpaired (between different experiments) two-tailed t tests. Results are given as mean ±s.d. throughout.
Measuring Ca2+ currents
Ca2+ currents were measured by a macropatch electrode as described by Dudel (1990). An electrode perfused with normal Ringer solution ([Ca2+], 1 mM) containing TTX (0.2 μM) was placed over a release region. To prevent muscle contraction, after nerve stimulation through a suction electrode (3 Hz), the bath solution was without added Ca2+. In order to ensure that Ca2+ currents were measured as close as possible to a release site, the electrode was moved along the terminal until quanta were detected. Then, d-tubocurarine (10-40 μM) was applied to the electrode solution to completely block postsynaptic currents that would otherwise partially mask the measured presynaptic Ca2+ currents. This method of measuring the presynaptic Ca2+ currents is somewhat different to the methods described by Mallart (1984), Hamilton & Smith (1991) or Silinsky & Solsona (1992). We applied the drugs only to the region below the electrode (probably with some small spillover to the vicinity of the electrode due to the positive pressure in the electrode (see above)). This enabled us to stimulate the nerve while the propagating action potential remained essentially unaltered. Changes in currents occurred only in the membrane below the electrode and possibly in its immediate vicinity. The shape of the current could vary from site to site according to the action potential conduction time and the geometrical configuration of the terminal below the electrode. After we blocked the different ionic currents by TEA (10 mM) and 3,4-DAP (100 μM) (potassium channels) and by Co2+ (calcium channels) and after subtractions, the Ca2+ current was revealed as shown in Fig. 2A and B. For the reader's convenience we will first analyse the shape of the currents depicted in Fig. 2A. It should be remembered that experiments were conducted at 8°C, so the currents were slower than those obtained at room temperature (Mallart, 1984; Dudel, 1990; Hamilton & Smith, 1991). Trace 1: the first positive phase (outward current) resulted from the inward current of the action potential at a region somewhat before the electrode. Since TTX was already in the electrode solution, there was no inward sodium current at the patch of membrane below the electrode. This positive phase also contained components of outward potassium currents (the delayed rectifier current) and components of ‘hidden’ inward Ca2+ currents. Trace 2: perfusing the electrode with TEA and 3,4-DAP reduced the positive peak and prolonged the inward current somewhat. Trace 3: application of cobalt had several effects. It further lowered the peak of the positive phase, which also became slower; the latter part of the inward current disappeared. Subtraction of trace 3 from trace 2 in Fig. 2A gave the net Ca2+ current presented in Fig. 2B. The positive phase of the Ca2+ current probably reflects an inward Ca2+ current outside (but near) the electrode (Silinsky & Solsona, 1992). This positive phase was followed by the inward Ca2+ current at the patch of membrane below the electrode. The currents we obtained were similar to those obtained by Dudel (1990, his Fig. 1).
Figure 2. Samples of averaged presynaptic currents recorded from the presynaptic membrane near release zones.
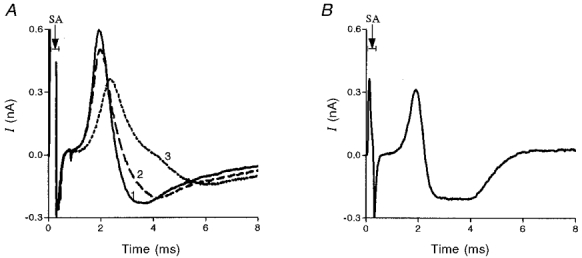
256 single traces were used for each average. SA, stimulus artifact. A, trace 1: electrode perfused with normal Ringer solution containing 0.2 μM TTX and 20 μM d-tubocurarine. Trace 2 represents the current under the conditions of trace 1 together with K+ channel blockers (10 mM TEA and 100 μM 3,4-DAP). Trace 3 represents the current under conditions of trace 2 together with a Ca2+ channel blocker (3 mM Co2+). B, the Ca2+ current obtained by subtracting trace 3 from trace 2.
Drugs
TTX, muscarine, methoctramine, pirenzepine and atropine were purchased from RBI; d-tubocurarine chloride, TEA and 3,4-DAP were purchased from Sigma.
RESULTS
Determining ED50 of muscarine
In order to detect small changes in the effects of muscarine, we found the concentration of muscarine that reduced release by 50 % (ED50). However, as shown below, the effect of muscarine on release depends on the amplitude of the depolarizing pulse administered to the nerve terminal. For a given concentration of muscarine, the effect is larger at low depolarizing pulses, and diminishes as the pulse amplitude increases. In selecting a pulse amplitude we encountered two opposing factors. On the one hand, it was certainly more convenient to use higher depolarizing pulses to obtain larger quantal contents; on the other hand, higher depolarizing pulses required higher concentrations of muscarine to produce substantial inhibition of release. We compromised on a pulse amplitude around -1 μA, which produced a quantal content of about 0.3 to 0.4 (but see Fig. 13 for effects of muscarine at low pulses). Figure 3 shows that for a pulse of -1 μA, a concentration of approximately 9 μM (n = 4) muscarine blocked release by 50 %. We therefore used 10 μM muscarine as the standard dose in subsequent experiments where pulses of -0.8 to -1.4 μA were used.
Figure 3. Dose-response curve of muscarine.
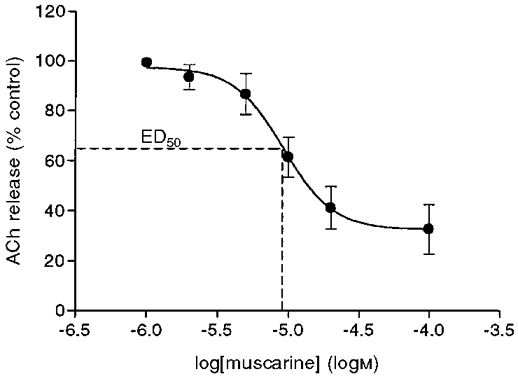
Each point represents the average inhibition (n = 4) presented as a percentage of control release. Vertical bars, s.d. See Table 1 for the statistical evaluation of this and the following figures. Pulse: -1 μA, 1 ms.
Dependence of the effect of muscarine on pulse amplitude
Parnas et al. (1994) found that the presynaptic effects of glutamate and NMDA on release of glutamate in crayfish terminals depended on the amplitude of the depolarizing pulse. We tested whether this finding applied to the cholinergic NMJ as well.
Even though the level of depolarization increases as the amplitude of the negative current pulse increases, the exact level of depolarization for each pulse amplitude is not known. In order to estimate the level of depolarization we compared the quantal content obtained by pulses of 1 ms duration and varying amplitudes with the quantal content produced by an action potential. The results of such experiments are shown in Fig. 4. We first established the quantal content obtained after nerve stimulation. In these experiments, to prevent muscle contractions the bath solution did not contain Ca2+. CaCl2 (1 mM) was present only in the electrode solution. Quantal content was quite constant in all three experiments - varying from 1.1 to 1.2. We then added TTX to the electrode and directly depolarized the region below the electrode. The minimal pulse amplitude that produced a detectable quantal content (1024 pulses) was -0.8 μA. The quantal content varied between 0.05 and 0.1. The quantal content increased in a similar manner in the three curves when the pulse amplitudes increased from -0.8 to -1.1 μA. At pulse amplitudes of between -1.1 and -1.2 μA the quantal contents were similar to those obtained by the action potential (dashed lines, Fig. 4). At higher depolarizations the quantal content continued to increase and the scatter of the points of the three experiments is more prominent. At -1.4 μA, quantal content declined, presumably owing to a reduction in the driving force for Ca2+ influx (Llinas et al. 1981). Thus, we term as low depolarizing pulses those from -0.8 to -0.9 μA, medium depolarizing pulses, -1.1 to -1.2 μA and high depolarizing pulses, -1.3 to -1.4 μA.
Figure 4. Effects of muscarine at different pulse amplitudes.

Comparison between quantal content obtained by an action potential (marked by the filled ellipse) and quantal content obtained by different current pulses (pulse duration is 1 ms, n = 3).
The experiment depicted in Fig. 5A describes the effect of muscarine on the quantal content at different pulse amplitudes. In order to obtain, over the same period of time, the quantal content at several pulse amplitudes, we employed the following procedure. First, the macropatch electrode was perfused with normal Ringer solution. The quantal content was measured concomitantly for four pulse amplitudes (different depolarizations) administered in a random manner at an interval of 300 ms between pulses. The repetition rate was 1.2 s. The curve describing quantal content as a function of pulse amplitude is labelled control (Fig. 5A, •). As already shown in Fig. 4, quantal content first increased with the rise of pulse amplitude to reach a peak at -1.2 μA and declined thereafter at high pulse amplitudes. After we established the control curve, the electrode was perfused with a solution containing 10 μM muscarine (test solution) and the same experimental protocol was repeated (Fig. 5A, ▴). Note that the inhibition of release was prominent for pulses -0.8 and -1.0 μA, while at -1.4 μA the control and test points coincided. Finally, the electrode was perfused again with normal Ringer solution to test for recovery (Fig. 5A, ▪).
Figure 5. Effects of muscarine at four pulse amplitudes.
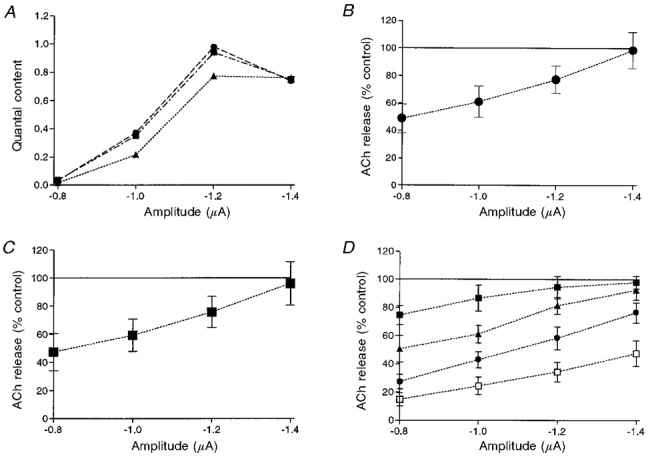
A, quantal content in control (•), after addition of 10 μM muscarine (▴) and after washing (▪). B, averaged data of 12 experiments, presented as a percentage of control release at each pulse amplitude when 10 μM muscarine was applied to the perfused electrode. C, averaged data of 6 experiments, in which 10 μM muscarine was applied to the bath solution. D, effects of muscarine (n = 4) at 4 pulse amplitudes at different concentrations: ▪, 5 μM; ▴, 10 μM; •, 20 μM and □, 50 μM.
Figure 5B illustrates the average results of twelve such experiments. It is clear that the level of inhibition is inversely proportional to the amplitude of the depolarizing pulse: the stronger the depolarization, the smaller the inhibition. With 10 μM muscarine, maximal inhibition (51.4 ± 10.6 %, n = 12, P < 0.001) was obtained at -0.8 μA, while no effect was observed at -1.4 μA. This result shows that, as for glutamate in crayfish (Parnas et al 1994, 1996), the effect of muscarine on neurotransmitter release in the frog NMJ depends on the level of the pulse amplitude. The inhibitory effect is maximal at low depolarization and no inhibition is obtained at higher depolarizations. We repeated these experiments when 10 μM muscarine was applied to the bath solution. Figure 5C shows the average results of six such experiments. The effect of muscarine is very similar (P > 0.7) to that shown in Fig. 5B. This result shows that electrode perfusion is an efficient technique for affecting the patch of membrane below the electrode. In order to check whether higher concentrations of muscarine reduce release at the larger pulse amplitudes, we tested for the effect of different concentrations of muscarine (5, 10, 20 and 50 μM). The averaged results of four such experiments are presented in Fig. 5D. As can been seen, for all pulse amplitudes inhibition was more prominent at the higher concentration. Nevertheless, at all concentrations, inhibition retained its voltage dependence; 50 % inhibition was achieved at higher concentrations as the level of depolarization increased.
Effect of atropine
Since atropine is a non-selective blocker of all five subtypes of the muscarinic receptor, we checked whether atropine blocks the effect produced by 10 μM muscarine. Figure 6A shows that application of 1 μM atropine, without muscarine, increased the level of release. Interestingly, the effect of atropine on release also depended on the pulse amplitude. At low depolarizing pulses, atropine increased release (maximal enhancement of 132.9 ± 30.2; n = 9, P < 0.001), and this effect declined as the pulse amplitude increased. This result suggests that either atropine affects release directly or it removes a tonic inhibitory effect produced by very low (in the nanomolar range) concentrations of endogenous ACh in the synaptic cleft (Katz & Miledi, 1977). It is also possible that atropine affects release in both ways. Whatever the case may be, in the presence of 1 μM atropine, 10 μM muscarine had no effect on release (Fig. 6B and Table 1A).
Figure 6. Effect of atropine.
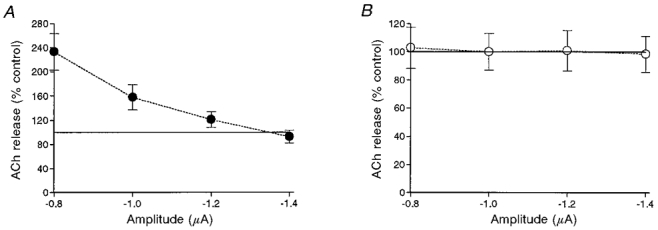
A, effect of 1 μM atropine at different pulse amplitudes on release, given as the percentage of control (n = 9). B, effect of 10 μM muscarine in the presence of 1 μM atropine (n = 9). Here, the control curve represents release in the presence of atropine.
Table 1.
Effects of muscarine and different antagonists on quantal content in 1 mM [Ca2+]o (A) and 0.5 mM [Ca2+]o (B)
| Amplitude (μA) | |||||
|---|---|---|---|---|---|
| Treatment (% control release) | −0.8 | −1.0 | −1.2 | −1.4 | n |
| A. Muscarine | 48.64 ± 10.56* | 60.91 ± 11.54* | 77.00 ± 9.98* | 98.36 ± 13.25 | 12 |
| Atropine | 232.93 ± 30.19* | 157.64 ± 20.84* | 121.03 ± 12.90* | 92.60 ± 10.57 | 9 |
| Atropine + muscarine | 102.78 ± 14.76 | 100.00 ± 13.05 | 100.89 ± 14.52 | 98.44 ± 12.79 | 9 |
| Pirenzepine | 55.95 ± 14.32* | 69.35 ± 12.98* | 79.80 ± 11.07* | 90.10 ± 10.02 | 10 |
| Pirenzepine + muscarine | 24.90 ± 10.16* | 40.50 ± 11.93* | 64.90 ± 13.89* | 94.30 ± 17.28 | 10 |
| Methoctramine | 286.57 ± 17.24* | 214.24 ± 20.77* | 153.13 ± 22.82* | 110.82 ± 16.18 | 11 |
| Muscarine + methoctramine | 123.33 ± 10.97* | 116.42 ± 10.77* | 108.00 ± 11.37 | 100.00 ± 12.76 | 12 |
| Muscarine + methoctramine + pirenzepine | 104.78 ± 17.76 | 96.00 ± 18.05 | 98.89 ± 19.52 | 102.44 ± 16.79 | 7 |
| B. Muscarine | 36.82 ± 11.96* | 54.36 ± 9.08* | 73.64 ± 12.71* | 92.36 ± 9.26 | 11 |
| Pirenzepine + muscarine | 30.23 ± 11.92* | 46.82 ± 14.30* | 67.27 ± 9.68* | 92.09 ± 12.46 | 11 |
| Muscarine + methoctramine | 97.00 ± 14.41 | 98.11 ± 10.78 | 96.78 ± 8.80 | 98.22 ± 9.42 | 12 |
n is the number of experiments. Values, presented as the percentage of control release at each pulse amplitude, are given as mean ± S.D. Quantal content before treatment at each pulse amplitude was taken as the control (100 %).
P < 0.001; where the difference was not significant, it is not indicated (Student's unpaired two-tail t test). The absolute values of quantal content before and after drug treatments were used for comparison.
Which of the muscarinic receptors produces the inhibitory effect?
Five distinct subtypes of muscarinic receptors, M1-M5, have been identified (Fukuda et al. 1987). To find which subtype(s) is (are) responsible for the inhibitory effect, we used blockers specific for the different subtypes (Caulfield, 1993).
Taking into account that M2 is the most common presynaptic subtype (Rouse & Levey, 1997), we tested for the effects of methoctramine, a selective antagonist for the M2 receptor. As for atropine, addition of 1 μM methoctramine, by itself, produced an increase in the level of release (Fig. 7A). The maximal enhancement caused by 1 μM methoctramine (186.6 ± 17.2, n = 11, P < 0.001; Fig. 7A, ▴) was more pronounced than the maximal enhancement of atropine alone (see Fig. 6A). Similar to atropine, the enhancement produced by methoctramine declined as the pulse amplitude increased. In the presence of 1 μM methoctramine, 10 μM muscarine produced an additional slight increase (23.3 ± 11.0 %, n = 12, P < 0.001) in the level of release at the low depolarizing pulses (Fig. 7B; the 100 % line corresponds to the dashed line of Fig. 7A). This additional increase in the presence of the added muscarine suggests that muscarine has more than one effect: (1) it inhibits release by activation of M2 receptors, and (2) it increases release by activation of another muscarinic receptor subtype. As several investigators (see Introduction) have shown that the M1 receptor is involved in enhancement of release, we tested the effect of pirenzepine, a selective M1 antagonist (Caulfield, 1993).
Figure 7. Effect of methoctramine.

A, effect of 1 μM methoctramine on ACh release at different pulse amplitudes, given as the percentage of control (n = 11). B, effect of 10 μM muscarine in the presence of 1 μM methoctramine (n = 12).
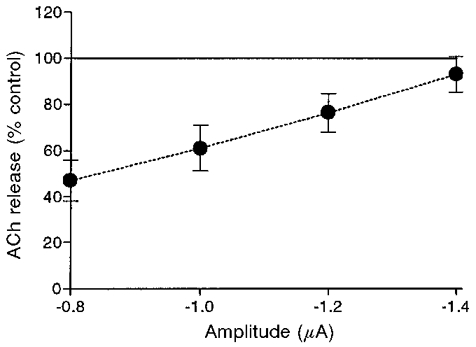
Addition of 10 μM pirenzepine, by itself, produced some reduction in the level of control release (Fig. 8A). Maximal inhibition was obtained at -0.8 μA (44.1 ± 14.3 %, n = 10, P < 0.01), and the degree of inhibition declined as the pulse amplitude increased. This result can be interpreted to mean that the endogenous low level (about 10−9 M) of ACh also produces a tonic enhancement of release. Thus, the endogenous ACh has two opposite effects. One is to produce tonic inhibition which is blocked by methoctramine. The other is to produce a tonic enhancement which is blocked by pirenzepine. Addition of 10 μM pirenzepine strengthened the inhibitory effect of 10 μM muscarine (compare Fig. 8B and Table 1A with Fig. 5B). The average level of inhibition at the smallest pulse amplitude was 75.1 ± 10.2 % (n = 10, P < 0.001), in comparison with 51.4 ± 10.6 % (n = 12, P < 0.001) obtained by muscarine alone (Fig. 5B).
Figure 8. Effect of pirenzepine.
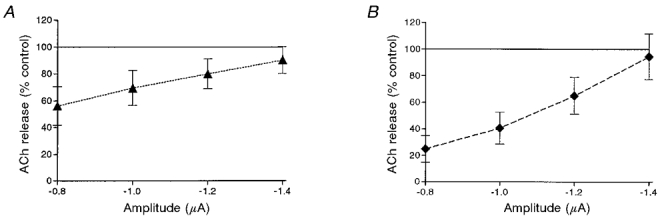
A, effect of 10 μM pirenzepine on release at different pulse amplitudes (n = 10). B, effect of 10 μM muscarine in the presence of 10 μM pirenzepine (n = 10).
The results depicted in Figs 7 and 8 show that the M2 receptor subtype is responsible for inhibition of release, while the M1 receptor subtype is responsible for enhancement of release. The question is whether in the frog NMJ, other subtypes of the muscarinic receptor (M3-M5) are also involved in autoregulation of release.
Addition of the two selective antagonists (methoctramine and pirenzepine) together blocked the effect of 10 μM muscarine completely (Fig. 9 and Table 1A). We may therefore conclude that in the frog NMJ the M1 and M2 receptors are the major subtypes involved in enhancement and inhibition of release, respectively.
Figure 9. Effect of methoctramine and pirenzepine.
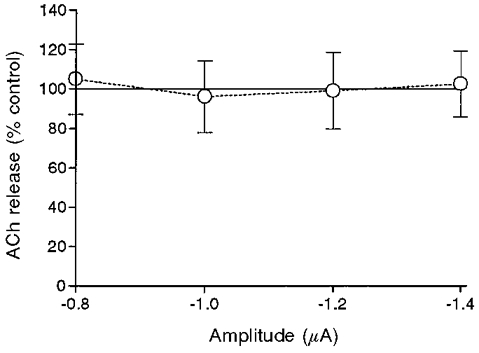
Effect of 10 μM muscarine at different pulse amplitudes in the presence of 1 μM methoctramine and 10 μM pirenzepine, added together (n = 7).
Are the inhibitory and enhancement effects of muscarine associated with a change in Ca2+ entry?
As mentioned (see Introduction), views differ as to whether ACh autoregulation is achieved by affecting Ca2+ entry. To answer this question we employed two different methods: (a) measuring the effect of muscarine on ACh release at low and high [Ca2+]o levels, and (b) measuring Ca2+ currents at the nerve terminal near release sites.
Effect of muscarine on release at two levels of [Ca2+]o
We measured the effect of 10 μM muscarine on release when a terminal was superfused with a solution containing 0.5 mM [Ca2+]o. We then compared the percentage of block obtained for different pulse amplitudes with the values obtained with 1 mM [Ca2+]o (Fig. 5B). The average results of 11 experiments in 0.5 mM [Ca2+]o are depicted in Fig. 10A and Table 1B. As can be seen, maximal inhibition at -0.8 μA was 63.2 ± 11.1 % (n = 11, P < 0.001). With 1 mM [Ca2+]o (Fig. 4B), this value was 51.4 ± 10.6 % (n = 11, P < 0.001). Thus at small pulse amplitudes the level of inhibition at 0.5 mM [Ca2+]o was larger than the inhibition observed at 1 mM [Ca2+]o by about 12 % (P < 0.05). At first glance, these results are quite similar to those reported previously (Wessler et al. 1987a) and may suggest that ACh inhibits its own release through attenuation of Ca2+ influx. However, as shown above, muscarine has a dual effect on release: inhibition and enhancement. To discern whether the stronger inhibition at low [Ca2+]o results from a more pronounced reduction of Ca2+ influx or from an attenuation of the fraction of enhanced release (or perhaps both), the experiments at the two levels of [Ca2+]o were repeated in the presence of the M1 and M2 antagonists, pirenzepine and methoctramine.
Figure 10.
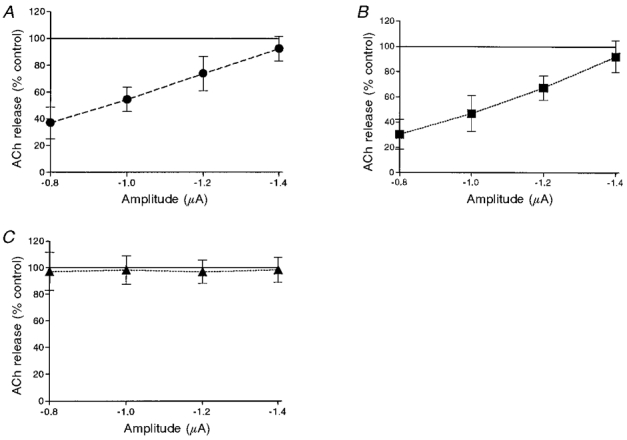
Effects of 10 μM muscarine on release at low [Ca2+]o (0.5 mM) at different pulse amplitudes. A, muscarine alone (n = 11). B, muscarine in the presence of 10 μM pirenzepine (n = 10). C, muscarine in the presence of 1 μM methoctramine (n = 12).
Figure 10B shows the effect on release of 10 μM muscarine in the presence of 10 μM pirenzepine. A comparison of Fig. 10A with B clearly shows that at low [Ca2+]o the inhibitory effect of muscarine alone (Fig. 10A) is very similar to that of muscarine with pirenzepine (Fig. 10B). Moreover, the degree of inhibition was similar at both 1 mM [Ca2+]o and 0.5 mM [Ca2+]o for the entire amplitude range (P > 0.4, obtained by comparing Fig. 10B with Fig. 8B). These results suggest that inhibition does not become stronger at low [Ca2+]o, but rather that enhancement of release becomes weaker at low [Ca2+]o. To further test this possibility, 1 μM methoctramine was added to 10 μM muscarine under low [Ca2+]o (Fig. 10C, Table 1B), and in a total of 12 experiments, the enhancement of release was abolished at 0.5 mM [Ca2+]o.
Effect of muscarine on Ca2+ currents
To measure presynaptic Ca2+ currents at the motor nerve terminal, Na+ and K+ currents must be blocked by TTX and TEA + 3,4-DAP, respectively (see Fig. 2). In the case of hippocampal slices, however, it has been suggested that muscarine increases K+ conductance to produce hyperpolarization of the axon terminal (Allgaier et al. 1992). Therefore, we first needed to find whether muscarine inhibited release in the presence of the K+ channel blockers, TEA and 3,4-DAP. Figure 11 shows that TEA and 3,4-DAP did not alter the blocking effect of muscarine. Both the magnitude of the block and its dependence on pulse amplitude were maintained and did not differ significantly (P > 0.4) from inhibition at control conditions (Fig. 5B).
Figure 11.
Effects of 10 μM muscarine on ACh release in the presence of the K+ channel blockers TEA (10 mM) and 3,4-DAP (100 μM) (n = 4).
This result enabled us to examine whether muscarine affects ACh release by modifying Ca2+ currents. Because the Ca2+ currents varied in the different terminals, we present two examples from different experiments. In Fig. 12A and B, averages (265 sweeps) of Ca2+ currents are superimposed from two nerve terminals before and after treatment with 10 μM muscarine in the presence of 10 μM pirenzepine (to block M1 receptors). In these two experiments (and in 7 additional experiments of this type) the Ca2+ currents (both positive and negative phases) were exactly the same before and after treatment with 10 μM muscarine and 10 μM pirenzepine. In four other experiments we measured the quantal content and found that under these conditions action potential-evoked release was reduced by 33 ± 4.7 % (n = 4, P < 0.001). It can therefore be concluded that inhibition of release mediated by the M2 receptor is not associated with a reduction in Ca2+ entry.
Figure 12. Effects of muscarinic receptor blockers on Ca2+ currents.

A and B, effect of 10 μM muscarine in the presence of 10 μM pirenzepine on Ca2+ currents, recorded from a patch of presynaptic membrane near the release zone from the two different terminals. 256 single traces were used for each average. C and D, effect of 10 μM muscarine in the presence of 1 μM methoctramine (dashed line) on Ca2+ currents, recorded from the two different terminals.
To examine whether the enhancement of release is mediated by an increase in Ca2+ influx, Ca2+ currents were measured as above but this time in the presence of the M2 blocker, methoctramine. Figure 12C and D shows examples of Ca2+ currents from two experiments. Note that now in the presence of muscarine, in one case (Fig. 12C) both the positive and negative phases of the Ca2+ current increased, while in the second case (Fig. 12D) only the negative phase increased. In 12 experiments, the increase of the peak positive phase was on average 19.4 % and the increase of the peak negative phase was 18 %. In three additional experiments there was no change in the shape of the Ca2+ current. These results suggest that an increase in Ca2+ entry is involved in the muscarine-mediated enhancement of ACh release.
The minimal concentration of muscarine that produces a detectable inhibition of release
The finding that atropine produced an increase in the basic level of release suggested to us that the very low concentration of ACh (in the range of 10 nM; Katz & Miledi, 1977) present tonically in the synaptic cleft, is sufficient to produce inhibition of release at resting membrane potential. In order to assign a physiological role for this effect, it was imperative to test for an inhibitory effect on release produced by small depolarizing pulses at very low levels of muscarine. It was difficult to use very small pulses as the quantal content became very small, requiring a very large number of pulses, which at a low frequency of stimulation required a long time (more than 2 h). We used pulses of -0.6 μA and administered 5000 pulses (3 Hz) at each experimental condition (control, drug, wash). Figure 13 shows the average result of four such experiments. In the control, the quantal content was 0.02 ± 0.001. The data presented as a percentage of the control shows that 100 nM muscarine reduced release by 24.3 ± 3.5 % (P < 0.001), and that 200 nM muscarine reduced release by 40.5 ± 4.8 % (P < 0.001). It is thus possible that at even lower depolarizing pulses or at resting membrane potential, lower concentrations of muscarine suffice to produce a substantial inhibition of release.
Figure 13. Effects of low concentrations of muscarine in the presence of 10 μM pirenzepine on ACh release.

The depolarizing pulse was -0.6 μA, 1 ms. The average quantal content in the control was 0.02 ± 0.001. For each determination of quantal content 5000 pulses at 3 Hz were given. Averaged data of four experiments is presented as a percentage of control release. 100 nM of muscarine reduced release by 24.3 ± 3.5 % (P < 0.001) and 200 nM muscarine reduced release by 40.5 ± 4.8 % (P < 0.001).
DISCUSSION
The main experimental results of this study are: (i) in the frog neuromuscular cholinergic junction, muscarinic receptors regulate the release of ACh. The magnitude of this effect depends on the amplitude of the depolarizing pulse; (ii) two subtypes of muscarinic receptor are involved in the feedback process. The M1 receptor mediates enhancement of ACh release, while the M2 is involved in inhibition of release; (iii) these opposite effects are exerted by two independent mechanisms. Activation of the M1 receptor leads to increased entry of Ca2+, while activation of the M2 receptor is not associated with a reduction of Ca2+ entry; and (iv) the normal (in the nanomolar range; Katz & Miledi, 1977) endogenous ACh concentration in the synaptic cleft is sufficient to activate both mechanisms with a net effect of tonic inhibition of release.
Autoinhibition of ACh release is voltage dependent
Our finding that the effect of muscarine depends on the amplitude of the depolarizing pulse agrees with earlier findings using brain synaptosomes and K+-induced depolarization (Dolezal & Tu´cek, 1993). In the crayfish neuromuscular junction, modulation of release by glutamate was also found to depend on the amplitude of the depolarizing pulse (Parnas et al. 1994, 1996). Thus, the voltage dependence of autoregulation of release may be a general phenomenon, not specific to a particular neurotransmitter. The voltage-dependent modulation of release of ACh may explain some inconsistencies in the literature. For instance, Häggblad & Heilbronn (1983) found no effect of muscarine on release at the presynaptic terminals of the phrenic nerve. Contrary to these results, and using the same preparation, Ganguly & Das (1979) reported an enhancing effect (a positive feedback mechanism) of oxotremorine, a muscarinic receptor agonist, while Abbs & Joseph (1981) provided evidence for a negative feedback mechanism. Since in most previous investigations presynaptic depolarization was achieved by an action potential, it is possible that the differences in the obtained results can be explained by the actual level of depolarization at the presynaptic release site. It should be noted that at high concentrations of muscarine, as for glutamate (Parnas et al 1994), release is reduced even at high depolarizations (Fig. 5).
Are the autoreceptors located on the presynaptic terminal?
It is generally accepted that autoregulation of release is achieved by activation of autoreceptors located on the presynaptic terminal itself (reviewed by Starke et al. 1989). But such a conclusion cannot be supported by our previous experiments with glutamate (Parnas et al. 1994, 1996) or the present study of the cholinergic neuromuscular junction. For glutamatergic systems, glutamate receptors were found on non-neuronal elements (Conti et al. 1997), and in the case of the frog neuromuscular junction, addition of muscarine produced an increase in the intracellular Ca2+ concentration in perisynaptic Schwann cells (Robitaille et al. 1997). However, in this latter case as well, direct localization of muscarinic receptors on the membrane of these Schwann cells was not demonstrated. Thus, it is possible that for the glutamatergic system, as well as for the Schwann cells and for the frog presynaptic terminals, the effect of the transmitter (or its agonist) may be indirect. For the crayfish glutamatergic system, however, we recently found (Feinstein et al. 1998), by use of immunogold labelling, that glutamatergic NMDA receptors are located on the presynaptic membrane. Such presynaptic localization is required for the receptors to sense changes in the presynaptic membrane potential. Presynaptic localization of muscarinic receptors was demonstrated for different regions of the rat brain (Rouse & Levey, 1997), but such demonstration at the frog presynaptic neuromuscular junction is still lacking. Thus, at this stage, an indirect effect of muscarine on ACh release cannot be excluded. With this reservation, we refer to the presynaptic effects of muscarine on release, as many others have done, as an automodulation of release by activation of presynaptic autoreceptors.
Effect of atropine and the endogenous concentration of ACh
Arenson (1989) found that action potential evoked release in the frog NMJ was not enhanced by 0.1 μM atropine. We found that 1 μM atropine enhanced the basic level of release produced by low depolarizing pulses. There are several explanations for this difference. Arenson (1989) stimulated the nerve at 20 Hz, and this may cause accumulation of ACh in the synaptic cleft, such that the lower concentration (0.1 μM) of atropine used was insufficient. Also, the depolarization produced by an action potential is fairly high. As shown in Fig. 6A, the effect of atropine declines at higher depolarizing pulses. It is, then, possible that the higher level of depolarization together with the low concentration of atropine (0.1 μM) prevented the unmasking of the tonic inhibitory effect produced by the endogenous ACh.
In various previous studies (Abbs & Joseph, 1981) cholinesterase inhibitors were added in order to unravel ACh autoregulation. These inhibitors cause the accumulation of ACh in the synaptic cleft (about 10−8 M; Katz & Miledi, 1977). ACh, in turn, may bind to the autoreceptors and leave a smaller fraction of the receptors available to bind the added exogenous agonists. Thus, in the presence of the cholinesterase blockers, the effects of exogenous agonists on evoked transmitter release may be reduced or even disappear (Kilbinger & Wessler, 1980). In our study, autoregulation of ACh release was produced without application of cholinesterase inhibitors, and significant enhancement of release was observed following addition of atropine. This result indicates that the concentration of the endogenous ACh is sufficient for tonic activation of presynaptic ACh autoreceptors. Katz & Miledi (1977) estimated the concentration of ACh in the synaptic cleft (in the presence of cholinesterase inhibitor, at room temperature) to be around 10−8 M. This concentration is lower without the cholinesterase inhibitor, and may be in the region of 10−9 M. The question is whether the concentration of 10−8 to 10−9 M ACh is sufficient to activate the presynaptic M2 muscarinic receptors. Katz & Miledi (1977) showed that such a low concentration of ACh has a minimal effect on the postsynaptic nicotinic receptors, which are known to have a low affinity for ACh (Colquhoun & Ogden, 1988). The affinity of the M2 presynaptic muscarinic receptors of the frog NMJ to ACh is not known, but we found that 100 nM muscarine produced significant inhibition of release (24.3 ± 3.5 %) when the depolarizing pulses were low and it should be remembered that ACh is about 4 times more potent than muscarine (Birdsall et al. 1978; Freedman et al. 1988). In the brain, the affinity of the M2 muscarinic receptors was found to be in the range of a few tens of nanomoles (Birdsall et al. 1978; Freedman et al. 1988; Cohen-Armon et al. 1988). Thus a concentration of 20 nM ACh may produce substantial inhibition of release, especially at resting potential. We could not measure the effect of such a low concentration of ACh on release, because anticholinesterases must be added. The use of such inhibitors may well increase the concentration of ACh in the synaptic cleft to levels of 10-20 nM (Katz & Miledi, 1977). Under such a condition, addition of 20 nM ACh will not produce additional inhibition of release. Similar to the observation of Katz & Miledi (1977) that curare produced postsynaptic hyperpolarization, our finding that atropine increased the basic level of release suggests a tonic presynaptic effect produced by the endogenous ACh in the synaptic cleft. This result suggests that the presynaptic muscarinic receptors of the frog NMJ must have a high affinity for ACh. Indeed the M2 muscarinic receptor exhibits different affinities to ACh, having a low affinity (∼10 μM), high affinity (∼100 nM), and superhigh affinity (∼10 nM) (Birdsall et al. 1978). The ratio between these three types of receptors differs in different tissues (Birdsall et al. 1978; Freedman et al. 1988; Cohen-Armon et al. 1988). It is interesting to quote the last sentence of the discussion of Katz & Miledi (1977): ‘Although normally, in the absence of esterase inhibitors no effect on the postsynaptic membrane could be detected, nevertheless the possibility of a long-term regulatory role … should be borne in mind‘.
Two subtypes of muscarinic receptors are involved, M1 and M2
Our finding that in the frog NMJ two subtypes of presynaptic muscarinic receptor, M1 and M2, are involved in regulation of ACh release supports early reports of Ren & Harty (1994) and Vannucchi & Pepeu (1995). The local depolarization and recording technique enabled us to demonstrate the co-existence (within a radius of 10 μm) of facilitatory and inhibitory mechanisms of muscarinic autoreceptors on the same terminal branch. The more usual method of nerve stimulation and intracellular recording from the postsynaptic cell lacks this resolution. Nerve stimulation activates many release sites along the different branches of the endplate, and intracellular recording detects release all along the muscle fibre. The antagonists we used, pirenzepine and methoctramine, completely abolished the effect of muscarine and fully mimicked the effect of atropine. These results indicate that the effect of muscarine is produced mainly by the activation of M1 and M2 receptor subtypes. However, the possibility of M4 subtype involvement cannot be excluded, as there is significant overlap between the affinity of pirenzepine for M1 and M4 receptors (Caulfield, 1993).
Different mechanisms underlie the modulatory effects of M2 and M1 receptor subtypes
The finding that activation of the M1 receptor enhances entry of Ca2+ while activation of M2 does not affect Ca2+ entry may resolve some of the discrepancies between various reports (see Introduction). For example, the observation that muscarine produced a stronger inhibition of release at low [Ca2+]o (Wessler et al. 1987a) was interpreted to reflect reduction of Ca2+ influx. We obtained the same results, but further analysis showed that the stronger inhibition at low [Ca2+]o resulted from attenuation of the fraction of enhanced release, while inhibition remained unaltered. Hamilton & Smith (1991) reported a reduction of Ca2+ currents following application of 100 μM muscarine. This concentration is 10 times higher than the concentration used in our work. It is possible that muscarine at such high concentration also affects Ca2+ entry.
It may be argued that the lack of inhibitory effect of muscarine (together with pirenzepine) on Ca2+ currents results from the high level of depolarization produced by the action potential. This argument is untenable, however, because under the same conditions release was reduced by about 33 %. It might also be argued that the expected reduction in Ca2+ currents is too small to be detected by the method used. This explanation is unlikely as small increases in Ca2+ currents could be detected.
What could be the physiological role of these presynaptic receptors?
For the enhancement of release we cannot offer a physiological role at this stage. However, the finding of a muscarine-mediated voltage-dependent feedback inhibition at the vertebrate NMJ supports and generalizes the suggestion of Parnas et al. (1994) concerning the role of autoreceptors in controlling neurotransmitter release. In that study, it was suggested that at resting potential, the low concentration of endogenous transmitter in the synaptic cleft, in fast synapses, maintains the release machinery in a tonically blocked state. When an action potential reaches the nerve terminal, the block is relieved. The unblocked release machinery, together with the entered Ca2+, enable evoked release to commence. As soon as the action potential is over and the membrane repolarizes, evoked release stops owing to restoration of the block. A possible molecular implementation of the above idea was demonstrated by Linial et al. (1997). It was shown in rat brain synaptosomes that the presynaptic muscarinic receptor(s) is an integral part of the exocytic machinery and that its interaction with syntaxin and SNAP-25 is voltage dependent; interaction is strong at resting potential and weakened as depolarization increases.
Acknowledgments
This work was supported by Sonderforschungsbereich 191 der Deutschen Forschungsgemeinschaft to I. Parnas, H. Parnas and J. Dudel. We are grateful to the Goldie Anna trust fund for its continuous support. I. Parnas is the Greenfield Professor of Neurobiology.
References
- Abbs ET, Joseph DN. The effects of atropine and oxotremorine on acetylcholine release in rat phrenic nerve- diaphragm preparations. British Journal of Pharmacology. 1981;73:481–483. doi: 10.1111/j.1476-5381.1981.tb10446.x. [DOI] [PMC free article] [PubMed] [Google Scholar]
- Allen TG, Brown DA. M2 muscarinic receptor-mediated inhibition of the Ca2+ current in rat magnocellular cholinergic basal forebrain neurones. The Journal of Physiology. 1993;466:173–189. [PMC free article] [PubMed] [Google Scholar]
- Allgaier C, Hertting G, Gottsien P. Muscarinic receptor-mediated regulation of electrically evoked ACh release in hippocampus: effects of K channel blockers. Pharmaceutical and Pharmacological Letters. 1992;2:191–194. [Google Scholar]
- Arenson MS. Muscarinic inhibition of quantal transmitter release from the magnesium-paralysed frog sartorius muscle. Neuroscience. 1989;30:827–836. doi: 10.1016/0306-4522(89)90174-7. 10.1016/0306-4522(89)90174-7. [DOI] [PubMed] [Google Scholar]
- Bellingham MC, Berger AJ. Presynaptic depression of excitatory synaptic inputs to rat hypoglossal motoneurons by muscarinic M2 receptors. Journal of Neurophysiology. 1996;76:3758–3770. doi: 10.1152/jn.1996.76.6.3758. [DOI] [PubMed] [Google Scholar]
- Birdsall NJM, Burgen ASV, Hulme EC. The binding of agonists to brain muscarinic receptors. Molecular Pharmacology. 1978;14:723–736. [PubMed] [Google Scholar]
- Caulfield MP. Muscarinic receptors – characterization, coupling and function. Pharmacology and Therapeutics. 1993;58:319–379. doi: 10.1016/0163-7258(93)90027-b. [DOI] [PubMed] [Google Scholar]
- Cohen-Armon M, Garty H, Sokolovsky M. G-protein mediates voltage regulation of agonist binding to muscarinic receptors: effects on receptor-Na+ channel interaction. Biochemistry. 1988;27:368–374. doi: 10.1021/bi00401a055. [DOI] [PubMed] [Google Scholar]
- Colquhoun D, Ogden DC. Activation of ion channels in the frog end-plate by high concentrations of acetylcholine. The Journal of Physiology. 1988;395:131–159. doi: 10.1113/jphysiol.1988.sp016912. [DOI] [PMC free article] [PubMed] [Google Scholar]
- Conti F, Minelli A, Debiasi S, Melone M. Neuronal and glial localization of NMDA receptors in the cerebral cortex. Molecular Neurobiology. 1997;14:1–18. doi: 10.1007/BF02740618. [DOI] [PubMed] [Google Scholar]
- Dolezal V, Tu´cek S. Presynaptic muscarine receptors and the release of acetylcholine from cortical prisms: roles of Ca2+ and K+ concentration. Naunyn-Schmiedeberg's Archives of Pharmacology. 1993;348:228–233. doi: 10.1007/BF00169149. [DOI] [PubMed] [Google Scholar]
- Dudel J. The effect of reduced calcium on quantal unit current and release at the crayfish neuromuscular junction. Pflügers Archiv. 1981;391:35–40. doi: 10.1007/BF00580691. [DOI] [PubMed] [Google Scholar]
- Dudel J. Inhibition of Ca2+ inflow at nerve terminals of frog muscle blocks facilitation while phasic transmitter release is still considerable. Pflügers Archiv. 1990;415:566–574. doi: 10.1007/BF02583507. [DOI] [PubMed] [Google Scholar]
- Feinstein N, Parnas D, Parnas H, Dudel J, Parnas I. Functional and immunocytochemical identification of glutamate autoreceptors of an NMDA type in crayfish neuromuscular junction. Journal of Neurophysiology. 1998 doi: 10.1152/jn.1998.80.6.2893. in the Press. [DOI] [PubMed] [Google Scholar]
- Freedman SB, Beer MS, Harley EA. Muscarinic M1, M2 receptor binding. Relationship with functional efficacy. European Journal of Pharmacology. 1988;156:133–142. doi: 10.1016/0014-2999(88)90155-0. [DOI] [PubMed] [Google Scholar]
- Fukuda K, Kubo T, Akiba I, Maeda A, Mishina M, Numa S. Molecular distinction between muscarinic acetylcholine receptor subtypes. Nature. 1987;327:623–625. doi: 10.1038/327623a0. [DOI] [PubMed] [Google Scholar]
- Ganguly DK, Das M. Effects of oxotremorine demonstrate presynaptic muscarinic and dopaminergic receptors on motor nerve terminals. Nature. 1979;278:645–646. doi: 10.1038/278645a0. [DOI] [PubMed] [Google Scholar]
- Häggblad J, Heilbronn E. Release of acetylcholine at the motor endplate of the rat – evidence against a muscarinic acetylcholine autoreceptor. British Journal of Pharmacology. 1983;80:471–476. doi: 10.1111/j.1476-5381.1983.tb10717.x. [DOI] [PMC free article] [PubMed] [Google Scholar]
- Hamilton BR, Smith DO. Autoreceptor-modulated purinergic and cholinergic inhibition of motor nerve terminal calcium currents in the rat. The Journal of Physiology. 1991;432:327–341. doi: 10.1113/jphysiol.1991.sp018387. [DOI] [PMC free article] [PubMed] [Google Scholar]
- Hsu KS, Huang CC, Gean PW. Muscarinic depression of excitatory synaptic transmission mediated by the presynaptic M3 receptors in the rat neostriatum. Neuroscience Letters. 1995;197:141–144. doi: 10.1016/0304-3940(95)11915-j. [DOI] [PubMed] [Google Scholar]
- Katz B, Miledi R. Transmitter leakage from motor nerve endings. Proceedings of the Royal Society B. 1977;196:59–72. doi: 10.1098/rspb.1977.0029. [DOI] [PubMed] [Google Scholar]
- Kilbinger H, Wessler I. Pre- and postsynaptic effects of muscarinic agonists in the guinea-pig ileum. Naunyn-Schmiedeberg's Archives of Pharmacology. 1980;314:259–266. doi: 10.1007/BF00498547. [DOI] [PubMed] [Google Scholar]
- Linial M, Ilouz N, Parnas H. Voltage-dependent interaction between the muscarinic ACh receptor and proteins of the exocytic machinery. The Journal of Physiology. 1997;504:251–258. doi: 10.1111/j.1469-7793.1997.251be.x. [DOI] [PMC free article] [PubMed] [Google Scholar]
- Llinas R, Steinberg IZ, Walton K. Presynaptic calcium currents in squid giant synapse. Biophysical Journal. 1981;33:289–321. doi: 10.1016/S0006-3495(81)84898-9. [DOI] [PMC free article] [PubMed] [Google Scholar]
- Mallart A. Presynaptic currents in frog motor endings. Pflügers Archiv. 1984;400:8–13. doi: 10.1007/BF00670529. [DOI] [PubMed] [Google Scholar]
- Muller D, Loctin F, Dunant Y. Inhibition of evoked acetylcholine release: two different mechanisms in the Torpedo electric organ. European Journal of Pharmacology. 1987;33:225–234. doi: 10.1016/0014-2999(87)90154-3. [DOI] [PubMed] [Google Scholar]
- Onge ES, Otero DA, Bottiglieri DF, Meyer EM. Effects of different secretagogues and intracellular messengers on the muscarinic modulation of [3H]-acetylcholine release. Neurochemical Research. 1986;11:1547–1556. doi: 10.1007/BF00965773. [DOI] [PubMed] [Google Scholar]
- Parnas I, Dudel J, Parnas H, Ravin R. Glutamate depresses release by activating non-conventional glutamate receptors at crayfish nerve terminals. European Journal of Neuroscience. 1996;8:116–126. doi: 10.1111/j.1460-9568.1996.tb01172.x. [DOI] [PubMed] [Google Scholar]
- Parnas H, Parnas I, Ravin R, Yudilevich B. Glutamate and N-methyl-D-aspartate affect release from crayfish axon terminals in a voltage-dependent manner. Proceedings of the National Academy of Sciences of the USA. 1994;91:11586–11590. doi: 10.1073/pnas.91.24.11586. [DOI] [PMC free article] [PubMed] [Google Scholar]
- Ren J, Harty RF. Presynaptic muscarinic receptors modulate acetylcholine release from rat antral mucosal/submucosal nerves. Digestive Disease and Sciences. 1994;39:1099–1106. doi: 10.1007/BF02087564. [DOI] [PubMed] [Google Scholar]
- Robitaille R, Jahromi BS, Charlton MP. Muscarinic Ca2+ responses resistant to muscarinic antagonists at presynaptic Schwann cells of the frog neuromuscular junction. The Journal of Physiology. 1997;504:337–347. doi: 10.1111/j.1469-7793.1997.337be.x. [DOI] [PMC free article] [PubMed] [Google Scholar]
- Rouse ST, Levey AI. Muscarinic acetylcholine receptor immunoreactivity after hippocampal commissural/associational pathway lesions: evidence for multiple presynaptic receptor subtypes. Journal of Comparative Neurology. 1997;380:382–394. [PubMed] [Google Scholar]
- Scanziani M, Gähwiler BH, Thompson SM. Presynaptic inhibition of excitatory synaptic transmission by muscarinic and metabotropic glutamate receptor activation in the hippocampus: are Ca2+ channels involved? Neuropharmacology. 1995;34:1549–1557. doi: 10.1016/0028-3908(95)00119-q. [DOI] [PubMed] [Google Scholar]
- Silinsky EM, Solsona CS. Calcium currents at motor nerve endings: absence of effects of adenosine receptor agonists in the frog. The Journal of Physiology. 1992;457:315–328. doi: 10.1113/jphysiol.1992.sp019380. [DOI] [PMC free article] [PubMed] [Google Scholar]
- Starke K, Göthert M, Kilbinger H. Modulation of neurotransmitter release by presynaptic autoreceptors. Physiological Reviews. 1989;69:864–989. doi: 10.1152/physrev.1989.69.3.864. [DOI] [PubMed] [Google Scholar]
- Vannucchi MG, Pepeu G. Muscarinic receptor modulation of acetylcholine release from rat cerebral cortex and hippocampus. Neuroscience Letters. 1995;190:53–56. doi: 10.1016/0304-3940(95)11498-l. [DOI] [PubMed] [Google Scholar]
- Wanke E, Ferroni A, Malgaroli A, Ambrosini A, Pozann T, Meldolesi J. Activation of muscarinic receptor selectively inhibits a rapidly inactivated Ca2+ current in rat sympathetic neurons. Proceedings of the National Academy of Sciences of the USA. 1987;84:4313–4317. doi: 10.1073/pnas.84.12.4313. [DOI] [PMC free article] [PubMed] [Google Scholar]
- Wessler I, Eschenbruch V, Halim S, Kilbinger H. Presynaptic effects of scopolamine, oxotremorine, noradrenaline and morphine on [3H]-acetylcholine release from the myenteric plexus at different stimulation frequencies and calcium concentrations. Naunyn-Schmiedeberg's Archives of Pharmacology. 1987a;335:597–604. doi: 10.1007/BF00166974. [DOI] [PubMed] [Google Scholar]
- Wessler I, Karl M, Mai M, Diener A. Muscarine receptors on the rat phrenic nerve, evidence for positive and negative muscarinic feedback mechanisms. Naunyn-Schmiedeberg's Archives of Pharmacology. 1987b;335:605–612. doi: 10.1007/BF00166975. [DOI] [PubMed] [Google Scholar]