

Abstract
The kinetics of exocytosis and endocytosis were studied in the giant synaptic terminal of depolarizing bipolar cells from the goldfish retina. Two techniques were applied: capacitance measurements of changes in membrane surface area, and fluorescence measurements of exocytosis using the membrane dye FM1-43.
Three phases of exocytosis occurred during maintained depolarization to 0 mV. The first component was complete within about 10 ms and involved a pool of 1200–1800 vesicles (with a total membrane area equivalent to about 1.6% of the surface of the terminal). The second component of exocytosis involved the release of about 4400 vesicles over 1 s. The third component of exocytosis was stimulated continuously at a rate of about 1000 vesicles s−1.
After short depolarizations (< 200 ms), neither the FM1-43 signal nor the capacitance signal continued to rise, indicating that exocytosis stopped rapidly after closure of Ca2+ channels. The fall in capacitance could therefore be used to monitor endocytosis independently of exocytosis. The capacitance measured after brief stimuli began to fall immediately, recovering to the pre-stimulus baseline with a rate constant of 0.8 s−1.
The amount of exocytosis measured using the capacitance and FM1-43 techniques was similar during the first 200 ms of depolarization, suggesting that the most rapidly released vesicles could be detected by either method.
After a few seconds of continuous stimulation, the net increase in membrane surface area reached a plateau at about 5%, even though continuous exocytosis occurred at a rate of 0.9% s−1. Under these conditions of balanced exocytosis and endocytosis, the rate constant of endocytosis was about 0.2 s−1. The average rate of endocytosis during maintained depolarization was therefore considerably slower than the rate observed after a brief stimulus.
After longer depolarizations (> 500 ms), both the capacitance and FM1-43 signals continued to rise for periods of seconds after closure of Ca2+ channels. The continuation of exocytosis was correlated with a persistent increase in [Ca2+]i in the synaptic terminal, as indicated by the activation of a Ca2+-dependent conductance and measurements of [Ca2+]i using the fluorescent indicator furaptra.
The delayed fall in membrane capacitance after longer depolarizations occurred along a double exponential time course indicating the existence of two endocytic processes: fast endocytosis, with a rate constant of 0.8 s−1, and slow endocytosis, with a rate constant of 0.1 s−1.
Increasing the duration of depolarization caused an increase in the fraction of membrane recovered by slow endocytosis. After a 100 ms stimulus, all the membrane was recycled by fast endocytosis, but after a 5 s depolarization, about 50% of the membrane was recycled by slow endocytosis.
These results demonstrate the existence of fast and slow endocytic mechanisms at a synapse and support the idea that prolonged stimulation leads to an increase in the amount of membrane retrieved by the slower route. The rise in cytoplasmic Ca2+ that occurred during longer depolarizations was correlated with stimulation of continuous exocytosis and inhibition of fast endocytosis. The results also confirm that transient and continuous components of exocytosis coexist in the synaptic terminal of depolarizing bipolar cells.
Communication between neurons at synapses occurs through the Ca2+-triggered exocytosis of small synaptic vesicles filled with neurotransmitter (Zucker, 1996). The maintenance of normal synaptic function requires these vesicles to be recycled by endocytosis, but we have a relatively poor understanding of this process. Two basic models of endocytosis at the synapse have been proposed on the basis of electron microscopy of the neuromuscular junction. Heuser & Reese (1973) suggested that exocytosis was associated with full collapse of the synaptic vesicle into the plasma membrane, while retrieval required the slow formation of coated pits at sites removed from the active zone. In contrast, Ceccarelli et al. (1973) proposed that vesicles were rapidly retrieved at the active zone by the rapid closure of a fusion pore. Structural evidence suggests that the faster mechanism (sometimes coined ‘kiss-and-run’) operates after weak stimulation, while slow endocytosis through coated pits occurs after stronger stimulation (reviewed by Fesce et al. 1994). The relationship between these electron microscopic studies and normal events at the synapse is still not clear and several important questions remain unresolved. Do exocytosis and endocytosis at the synapse occur simultaneously? Is there normally more than one mechanism of endocytosis? How is endocytosis modulated by stimulation of exocytosis?
Answering these questions requires the measurement of exocytosis and endocytosis in living neurons. Two techniques now make this possible. The first is the capacitance method, in which electrical measurements are made of changes in membrane surface area associated with vesicle cycling (Gillis, 1995). The second technique is the optical imaging of vesicular membrane stained with fluorescent dyes such as FM1-43 (Betz et al. 1996). Capacitance measurements have been used to study the cycling of large granules in neuroendocrine cells secreting catecholamines (Neher & Zucker, 1993) and peptides (Thomas et al. 1994), but only recently has it been possible to study the cycling of small vesicles containing fast-acting neurotransmitters, such as glutamate. The most amenable preparation for this purpose has been depolarizing bipolar cells isolated from the goldfish retina (von Gersdorff & Matthews, 1994a; Mennerick & Matthews, 1996; Sakaba et al. 1997). A potential problem with the capacitance technique, however, is that it measures the net difference between exocytosis and endocytosis, so the quantification of these processes must be done carefully if it is suspected that the two occur simultaneously. Smith & Betz (1996) tackled this problem in bovine chromaffin cells by combining fluorescence measurements of cumulative exocytosis using FM1-43 with capacitance measurements of the net difference between exocytosis and endocytosis. This approach demonstrated that balanced exocytosis and endocytosis prevented any increase in membrane surface area during continuous stimulation. A similar situation may arise in goldfish bipolar cells, where FM1-43 measurements have demonstrated the existence of continuous exocytosis balanced by endocytosis (Lagnado et al. 1996), while capacitance measurements have only detected transient components of exocytosis (von Gersdorff & Matthews, 1994a; Heidelberger et al. 1994).
In this study, we have made a comparison of capacitance and FM1-43 measurements in the giant terminal of depolarizing bipolar cells from the goldfish retina. This combination of techniques has allowed us to (i) characterize the relationship between transient and continuous exocytosis, and (ii) make independent measurements of exocytosis and endocytosis. Our results provide a physiological demonstration that fast and slow mechanisms of endocytosis coexist at a synapse and provide direct support for the idea that prolonged stimulation causes an increase in the fraction of membrane retrieved by the slower route. A build-up of cytoplasmic Ca2+ was correlated with two effects: inhibition of the rapid endocytic mechanism and stimulation of the continuous component of exocytosis.
METHODS
Basic electrophysiology
Depolarizing bipolar cells were acutely dissociated from the retinae of goldfish (Carassius auratus) by papain digestion and mechanical trituration, using methods described previously (Burrone & Lagnado, 1997). Goldfish were killed by decapitation followed by immediate pithing of the brain and spinal cord. The standard Ringer solution contained the following (mM): 120 NaCl, 2.5 CaCl2, 2.5 KCl, 1 MgCl2, 10 glucose and 10 Hepes (pH 7.3). Solutions were applied to cells on the coverslip bottom of a recording chamber (Warner Instrument Corp., FL, USA) using an array of quartz pipes (100 μm i.d.; World Precision Instruments), or a perfusion manifold (MP-8, Warner Instrument Corp.) connected to a single quartz pipe (250 μm i.d.).
Synaptic terminals that had pinched off from the rest of the cell were voltage clamped using the perforated-patch technique (Korn et al. 1991). Recordings were made using an Axopatch 200A amplifier (Axon Instruments) and acquired with a Power Macintosh 7100/80 computer equipped with an ITC-16 interface (Instrutech Corp., NY, USA) controlled by the Pulse Control extension (Herrington & Bookman, 1994) of Igor Pro software (Wavemetrics, OR, USA). The solution in the patch pipette contained the following (mM): 110 caesium gluconate, 4 MgCl2, 3 Na2ATP, 1 Na2GTP, 0.4 BAPTA and 20 Hepes, with 250 μg ml−1 nystatin or amphotericin B (260 mosmol l−1; pH 7.2). Electrodes had resistances of between 2 and 4 MΩ, and the series resistance typically fell to 20-30 MΩ within 5 min. Input resistances at the holding potential of -70 mV were 1-10 GΩ. Series resistance (Rs) and membrane capacitance (Cm) were estimated using the RC Check tool of Pulse Control, and corrected using the whole-cell compensation controls of the patch-clamp amplifier. Some voltage-clamp recordings were also made from intact cells by placing the electrode on the cell body. This recording configuration was used when making fluorescence measurements from the terminal. Changes in membrane capacitance recorded in this configuration were only used to measure the rate constant of endocytosis (see below). Some isolated terminals were voltage clamped using the conventional whole-cell technique, when the antibiotic was omitted from the solution in the patch pipette.
Where appropriate, measurements are given as means ±s.e.m.
Measurements of membrane capacitance and conductance
Measurements of changes in membrane capacitance were performed using the piecewise linear technique (Neher & Marty, 1982; Gillis, 1995), with a dual-phase digital lock-in amplifier (model SR850 DSP; Stanford Research Systems) controlled through the RS232 interface by macros written in Igor Pro. A sinusoidal command generated by the lock-in amplifier was added to the command potential generated by the ITC-16 interface using a summing amplifier, both inputs of which could be gated by a transistor- transistor logic (TTL) signal. The peak-to-peak amplitude of the sinusoid was 50 mV and the frequency was fixed at 2 kHz. The output from the patch-clamp amplifier was low-pass filtered at 10 kHz (4-pole Bessel) before input to the lock-in amplifier. The two orthogonal outputs from the lock-in amplifier were filtered digitally within the instrument (3 ms time constant, 4-pole Bessel) and acquired at 1 kHz. The phase angle (α) of the lock-in amplifier was set using a modification of the whole-cell capacitance compensation circuitry of the patch-clamp amplifier, allowing a 100 fF increase in compensation to be added in response to a TTL signal (‘capacitance dither’). An iterative Igor macro compared the signal from the two orthogonal outputs of the lock-in amplifier and corrected α until the capacitance dither was only apparent on one output. Capacitance recordings were only begun once Rs had fallen below 30 MΩ. The phase angle was regularly re-calculated during the course of an experiment, but rarely changed appreciably because once Rs had fallen below 30 MΩ it tended to be stable. Experiments were ended if Rs began to increase. Each individual capacitance response was calibrated by dithering the capacitance by 100 fF at the beginning of the recording episode (e.g. Fig. 4B). Unless otherwise stated, capacitance recordings were filtered digitally by convolution with a Gaussian function with a standard deviation of 10 ms. An increase in capacitance was only observed when depolarizing beyond -40 mV, the threshold for activation of the L-type Ca2+ conductance in the synaptic terminal (Burrone & Lagnado, 1997).
Figure 4. Changes in membrane capacitance in response to depolarization.
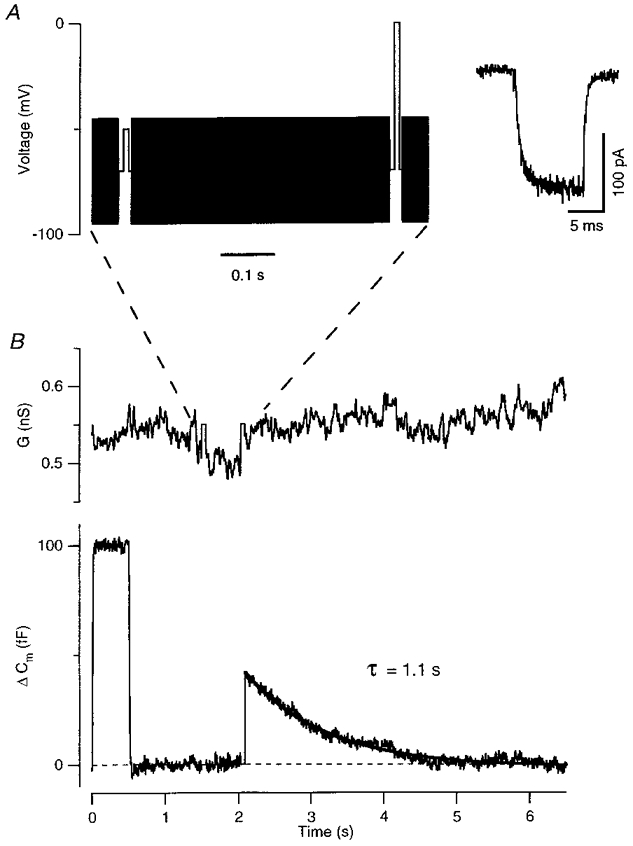
A, an example of the stimulation protocol. A sinusoidal voltage (50 mV peak to peak, 2 kHz) was applied on top of the holding potential (-70 mV). The sinusoid was briefly interrupted to apply two 10 ms depolarizing pulses. The first, to -50 mV, measured the leak conductance. The second, to 0 mV, activated an inward Ca2+ current, which is shown in the inset after leak subtraction. B, measurements of conductance (G) and capacitance change (ΔCm) provided by a dual-phase digital lock-in amplifier that analysed the current evoked by the sinusoidal command voltage and measured the amplitude at two orthogonal phases. The capacitance trace shows a 100 fF calibration applied at the beginning of the recording episode by dithering the whole-cell capacitance compensation. The calibration for the conductance trace was derived from the voltage and current records by assuming that the leak conductance reversed at 0 mV (see Methods). All capacitance records shown in Figs 4 and 6 were obtained from isolated terminals.
Relatively large conductance increases occurred after long depolarizing stimuli, but these conductance changes were not large enough to corrupt capacitance measurements from isolated terminals (see text). The net reversal potential of these conductances was measured by applying voltage ramps (-90 to -45 mV at a rate of 0.45 mV ms−1) before, and at various times after, long depolarizing stimuli (such as those shown in Fig. 5). The Ca2+-activated conductance was linear, with an extrapolated reversal potential of 0 mV. The membrane conductance could therefore be measured from the DC holding current simply by assuming that the membrane behaved ohmically, allowing calibration of the output of the lock-in amplifier. The DC holding current was obtained by low-pass filtering the current record.
Figure 5. Changes in membrane conductance did not evoke artifactual changes in capacitance.
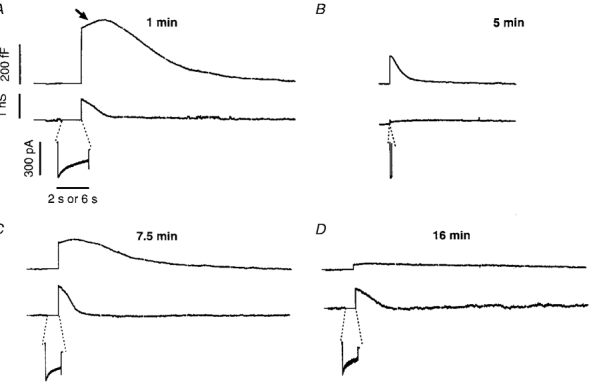
Measurements of changes in capacitance (top trace) and conductance (bottom trace) in an isolated synaptic terminal voltage clamped using the conventional whole-cell technique. The stimuli were applied 1 min (A), 5 min (B), 7.5 min (C) and 16 min (D) after obtaining the whole-cell configuration. The calcium currents (leak subtracted) evoked by each depolarization to 0 mV are shown on an expanded time scale below each record. The durations of the depolarizations were 2 s (A), 100 ms (B) and 1 s (C and D). The scale bar for time represents 6 s for the capacitance and conductance traces, and 2 s for the Ca2+ currents. Note that the continuation of the capacitance increase after repolarization became smaller as the secretory response declined, even though the conductance increase caused by Ca2+ influx was maintained.
Most of the results reported in this paper were obtained using the perforated-patch technique, but some experiments were also carried out using the conventional whole-cell method. The initial amplitudes of capacitance responses were similar, but they began to run down noticeably within a few minutes of beginning a conventional recording, while capacitance responses could be maintained for tens of minutes using the perforated-patch technique. Endocytosis appeared to be particularly susceptible to whole-cell dialysis, as has been previously reported for hair cells (Parsons et al. 1994) and chromaffin cells (Smith & Neher, 1997).
Measurements of the rate constant of endocytosis were also made from intact cells using the perforated-patch technique with the pipette sealed to the cell body. Intact cells can behave as two electrical compartments: the cell body and synaptic terminal separated by the resistance of the axon (Mennerick et al. 1997). An admittance analysis indicated that an axonal resistance greater than 10-20 MΩ would cause underestimation of the capacitance changes occuring in the synaptic terminal measured using the piecewise linear technique. Although we sought to minimize this problem by rejecting records in which the two outputs of the lock-in amplifier were correlated, in the present paper capacitance measurements from intact cells were only used to measure the relative rate at which the capacitance signal recovered after stimulation, i.e. the rate constant of endocytosis. To maximize the signal-to-noise ratio of measurements in intact cells, the frequency of the sinusoidal command voltage was set according to the expression f = 1/(2πRsCm) (see Gillis, 1995). Thus for a typical intact cell (Cm = 12 pF; Rs = 25 MΩ), f was 530 Hz.
Measurements of FM1-43 fluorescence
FM1-43 is an amphiphilic dye that partitions from water into membranes, but cannot cross membranes (Betz et al. 1996). The dye is much more strongly fluorescent in membrane, so, when added to the medium around a cell, an increase in fluorescence can be measured representing the staining of the surface membrane (e.g. Lagnado et al. 1996). If vesicles undergo exocytosis and come into contact with the external medium, vesicular membrane also becomes stained and an increase in fluorescence can be measured. The increase in fluorescence persists if the dye is internalized when vesicles undergo endocytosis, so the rise in the fluorescence signal provides a cumulative record of exocytosis.
Measurements of FM1-43 fluorescence were made with a photomultiplier tube (Thorn EMI, Middlesex, UK) attached to an inverted microscope (Zeiss Axiovert 100) using a × 40 Fluar oil-immersion objective (NA 1.3). The exciting beam passed through a bandpass filter centred on 490 nm (7 nm half-bandwidth; Ealing Electro Optics) and emitted light was collected through a wider bandpass filter (515-565 nm; Zeiss) using a dichroic mirror (505 DRLP; Omega Optical, VT, USA). A high-intensity beam was obtained from a 250 W tungsten-halogen lamp driven by a stable DC power supply. Cells were only exposed to light during a stimulation episode. Background fluorescence was minimized by stopping down the exciting beam to a diameter of 20 μm and placing a circular pinhole (0.8 mm diameter) in the front of the photomultiplier tube, thus limiting light collection to a 20 μm circle in the object plane. The output of the photomultiplier tube was connected to a current-to-voltage converter, low-pass filtered at 100 Hz (4-pole Bessel; Warner Instrument Corp.) and acquired at 1 kHz. The ‘Decimate’ function in Igor Pro was then used to reduce the sample interval to 10 or 20 ms by averaging every 10 or 20 points. Intact cells were perfused with 5 or 10 μM FM1-43 (Molecular Probes) only after establishing the whole-cell voltage-clamp configuration with the membrane held at -70 mV. At this potential, Ca2+ channels are closed and there is no vesicle cycling, so only the plasma membrane becomes stained (Lagnado et al. 1996). The initial size of the fluorescence signal could therefore be used to normalize subsequent fluorescence changes triggered by depolarization to the initial surface area of the terminal. All signals were corrected for background fluorescence, which was measured under similar recording conditions. It was important to minimize this background by choosing a cell remote from membranous dirt on the coverslip and placing the electrode on the cell body rather than the terminal. Experiments were carried out on cells where the terminal was remote from the cell body, so that only fluorescence from the terminal, and a small part of the axon, was collected.
Voltage-dependent changes in FM1-43 fluorescence
The fluorescence of FM1-43 in the plasma membrane was sensitive to changes in membrane potential. Figure 1 shows the response to a 35 mV hyperpolarization from -50 mV averaged from 13 cells immediately after staining the plasma membrane (that is, before any stimulation of vesicle cycling). The fluorescence increased by 2.75 %, representing a change of 7.85 % per 100 mV. In comparison, a change of 3.3 % per 100 mV has been measured in bovine chromaffin cells (Smith & Betz, 1996). The response in Fig. 1 was not quite square, 20 % of the fluorescence change occurring with a time constant of 0.28 s (bold line). The line describing the decrease in fluorescence on depolarization at the end of the pulse is an inversion of that fitted to the increase in fluorescence on hyperpolarization at the start of the pulse, showing that there was no hysteresis in the response. Fluorescence changes of FM1-43 in the plasma membrane scaled linearly with voltage. To obtain the signal generated by the stimulation of exocytosis in response to a 70 mV depolarization, the idealized response in Fig. 1 was multiplied by -2 and subtracted from the total averaged FM1-43 signal measured in the same group of cells (see Fig. 3C and text). The mechanism underlying the slower component of the voltage-dependent fluorescence change shown in Fig. 1 is unclear, but similar behaviour has been observed in other voltage-sensitive dyes used at concentrations close to saturation (Cohen et al. 1974). The signal-to-noise ratio in individual records, such as those shown in Figs 3A and 9, was not good enough to measure the slower component of the voltage response of FM1-43 in the plasma membrane. We therefore assumed that the time course of the voltage-dependent change in fluorescence was the same as that shown in Fig. 1, with an amplitude measured in the individual trial.
Figure 1. The voltage dependence of FM1-43 fluorescence.
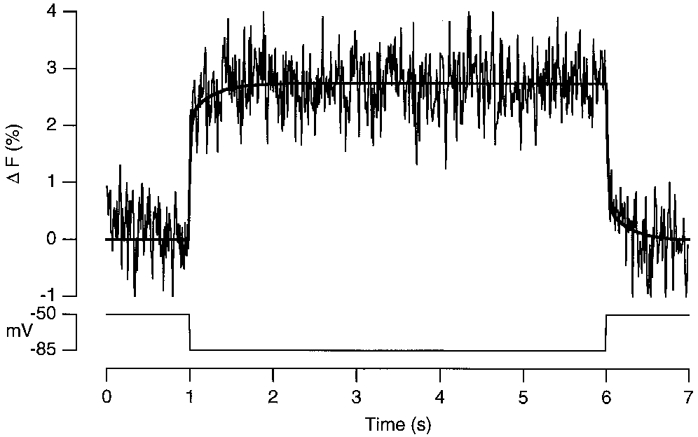
The change in fluorescence of FM1-43 in the plasma membrane in response to a 5 s hyperpolarization from -50 to -85 mV. Averaged from the same 13 cells used to measure the average time course of exocytosis in Fig. 3C and D. Twenty per cent of the change in fluorescence occurred with a time constant of 0.28 s.
Figure 3. Fluorescence measurements of exocytosis.
A, single trace showing the stimulation protocol. FM1-43 (5 μM) was present throughout. The fluorescence change is expressed as a percentage of the fluorescence associated with the plasma membrane (see Methods). The membrane potential is shown in the lower axis. The holding potential was -70 mV. First, a 35 mV hyperpolarization from -50 mV was applied for 5 s to measure the voltage-dependent change in FM1-43 fluorescence. Next, a 70 mV depolarization to 0 mV was applied for 5 s to activate Ca2+ influx and stimulate vesicle cycling. The trace was decimated to 20 ms per point and smoothed by convolution with a Gaussian function of s.d. = 64 ms. B, the fluorescence change associated with the stimulation of exocytosis for the cell shown in A. The voltage-dependent change in fluorescence of FM1-43 in the plasma membrane was subtracted from the total fluorescence change during the 5 s depolarization to 0 mV (see Methods). The grey line describing the time course of exocytosis has three linear components. First, a rapid initial increase of 3.6 %. Second, a linear phase with slope of 3.6 % s−1 and capacity of 5 %. Third, a continuous component occurring at 0.77 % s−1. Note the relatively sharp discontinuity between the second and third components of exocytosis. C, average exocytic response from 13 cells to a 5 s depolarization to 0 mV. Only the first response from a given experiment was used. The voltage-dependent change in FM1-43 fluorescence in the plasma membrane (shown in Fig. 1) was subtracted. The depolarization began at 1 s. The averaged Ca2+ current (after leak subtraction) is shown in the lower axis, and inactivates with a time constant of 1.2 s. Note that exocytosis continues for about 4 s after the closure of Ca2+ channels. The trace was decimated to 10 ms per point and smoothed by convolution with a Gaussian function of s.d. = 11.5 ms. D, the average time course of exocytosis on an expanded time scale. The grey line describing the response has three components. First, a rapid increase of 1.6 %. Second, a linear phase with slope of 3.8 % s−1 and capacity of 3.7 %. Third, a continuous component occurring at 0.86 % s−1. The inset shows the initial increase on an expanded time scale. All records were obtained using the permeabilized-patch technique. The permeabilized-patch technique was also used in Figs 4, 6, 9A and B, 10 and 11A.
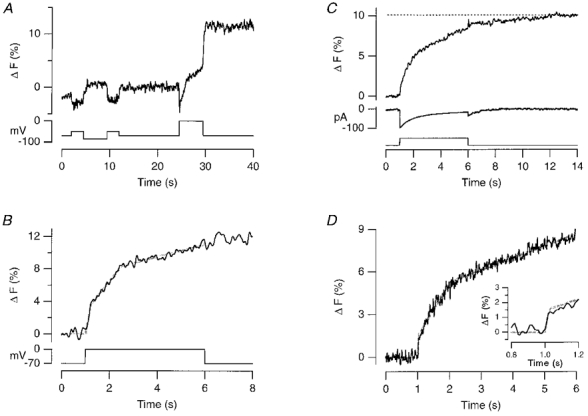
Figure 9. Exocytosis after closure of Ca2+ channels.

A, exocytosis continued after long depolarizations. An FM1-43 measurement of exocytosis showing that exocytosis stopped almost immediately after a depolarizing pulse lasting 200 ms, but continued for at least 5 s after a 2 s stimulus. FM1-43 concentration was 5 μM. Average of three experiments from three different cells. B, continuous exocytosis did not require open Ca2+ channels. A single FM1-43 record of exocytosis elicited by a 5 s depolarization to 0 mV. Exocytosis continued for 6 s after repolarization. The smooth line was fitted to the fluorescence increase during the last 3 s of depolarization and then extrapolated. The rate of exocytosis did not significantly decrease until 4 s after the closure of Ca2+ channels. The slope of the line measures the rate of continuous exocytosis as 0.76 % of membrane area per second. C, capacitance measurements also indicated that exocytosis continued after closure of Ca2+ channels. Measurements of changes in conductance (G, thin trace) and capacitance (ΔCm, thick trace) in response to a 2 s depolarization to 0 mV. The traces are an expansion of those shown in Fig. 5A. The smooth line was fitted to the capacitance increase occurring over the first 2 s after repolarization. The slope gives a lower limit for the rate of continuous exocytosis as 20 fF s−1 (0.4 % of membrane area per second for this terminal with a capacitance of 4.7 pF). Note that over this period the Ca2+-activated conductance recovers to basal levels, indicating that the [Ca2+] near the membrane is continuously falling (see Fig. 10).
The rate of membrane staining with FM1-43
To assess the temporal resolution with which measurement of FM1-43 fluorescence could be used to monitor exocytosis, it was necessary to know the rate at which the dye stains membrane. To measure this quantity we used the stopped-flow technique to mix goldfish retinal membranes rapidly with various concentrations of FM1-43 while monitoring the increase in fluorescence. Attempts to measure the rate of staining of bipolar cells in our experimental chamber were unsuccessful because of the difficulties associated with stepping to a steady FM1-43 concentration on a time scale that was rapid enough.
The mixing reaction was performed using an Applied Photophysics stopped-flow apparatus. To prepare retinal membranes, pieces of goldfish retina were triturated into 2.5 ml of Ringer solution, as was done when preparing isolated bipolar cells. The membrane-containing solution was diluted into Ringer solution containing different FM1-43 concentrations at a ratio of 1:1 to give final dye concentrations between 0.5 and 10 μM. The apparatus mixed the two solutions at close to the diffusion limit of about 1 ms. The exciting beam was provided by a monochromator and was centred at 470 nm (10 nm bandwidth). Emitted light was collected by a photomultiplier tube through a bandpass filter (512-558 nm; Omega Optical). All measurements were performed at temperatures between 20 and 25°C. The fluorescence traces in Fig. 2A show the increase in fluorescence observed when retinal membranes were diluted into three different concentrations of FM1-43. All these traces were corrected by subtraction of traces obtained when the membranes were diluted in Ringer solution with no FM1-43. A significant part of the staining reaction occurred within the mixing time of the apparatus (2-3 ms), but the rest of the fluorescence increase could be described as the sum of two exponentials, as shown by the fitted lines. The fast component accounted for 70-80 % of the increase in fluorescence, and its rate varied linearly with changes in FM1-43 concentration, as shown in Fig. 2B. Using 5 μM FM1-43, the fast time constant averaged 3.4 ms. The slow time constant averaged 48 ms, but it did not show any systematic dependence on the concentration of FM1-43, suggesting that this component of the fluorescence increase reflected the staining of membrane within clumps of cells or debris that was not in contact with the bulk solution. Putting aside any possible distinctions between these two components of staining, at least 80 % of the membrane was stained within 20 ms of adding 5 μM FM1-43, as shown by the inset in Fig. 2A. These results confirmed that FM1-43 stained membranes rapidly enough to allow the first component of exocytosis to be distinguished from the second, and placed a limit of about 20 ms on the time it takes for the rapidly releasable pool of vesicles to be exhausted in response to a depolarization to 0 mV (see Results).
Figure 2. Stopped-flow measurements of membrane staining by FM1-43.

A, the time course of the increase in fluorescence observed after mixing goldfish retinal membranes with various concentrations of FM1-43. A significant part of the reaction occurred within the mixing time of the apparatus (2-3 ms), but the remainder of the records could be described as the sum of two exponentials, as shown by the fitted lines. Each record is expressed as a percentage of the maximum increase in fluorescence, rather than an absolute fluorescence increase, because measurements at different concentrations of FM1-43 were necessarily carried out using different volumes of membrane-containing solutions. The inset shows that 80 % of the membrane was stained within 20 ms of mixing with 5 μM FM1-43. B, the rate constant of the rapid component of the fluorescence increase plotted against the concentration of FM1-43. The line fitted to the points has a slope of 35 μM−1 s−1, and intercepts with the y-axis at 123 s−1. Bars show ±s.e.m.
We assume that in our experiments FM1-43 was in excess, so that staining of membrane (Mem) can be described as a pseudo-first order reaction of the type:
Scheme 1.

According to this model, the rate of equilibration when stepping to a given FM1-43 concentration is k-1+k1[FM1-43]. The slope of the line in Fig. 2B gives k1 as 35 μM−1 s−1, and the intercept gives k-1 as 123 s−1. This indicates that the dissociation constant, Kd = k-1/k1, is 3.5 μM. This value is close to the Kd of 3.8 μM obtained from steady-state measurements of the fluorescence in bipolar cell membranes measured with a CCD camera at different external FM1-43 concentrations. In comparison, Smith & Betz (1996) measured the Kd of FM1-43 in chromaffin cells as 1.3 μM.
Comparison of FM1-43 and capacitance measurements
Was the stimulus-induced increase in FM1-43 fluorescence linearly related to the amount of exocytosis? We considered three scenarios in which this might not be the case.
(1) Vesicles might undergo endocytosis before becoming fully loaded with FM1-43. The time constant of membrane staining using 5 μM FM1-43 (3.4 ms; Fig. 2) was much shorter than the fastest time constant of endocytosis measured using the capacitance technique (about 1 s), suggesting that all vesicles undergoing exocytosis become fully loaded with the dye. This conclusion was supported by the observation that within 200 ms of depolarization, the amount of exocytosis measured with FM1-43 was similar to the amount measured using the capacitance technique (see Fig. 7).
Figure 7. Comparison of FM1-43 and capacitance measurements during maintained depolarization.
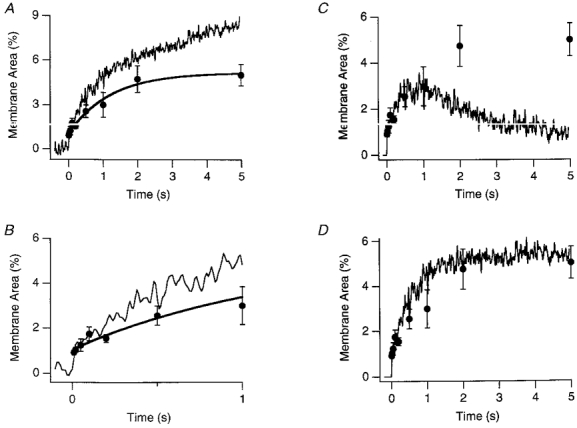
A, capacitance responses expressed as a percentage increase in membrane area (•) compared with the time course of exocytosis measured using FM1-43 (continuous noisy line). The capacitance measurements are from the results used to plot Fig. 6E. Each measurement was normalized to the resting capacitance of the synaptic terminal before stimulation to measure the percentage increase in membrane surface area. Error bars show ±s.e.m. The FM1-43 trace is from Fig. 3D The FM1-43 signal indicates that after 2 s of stimulation, exocytosis proceeds at a constant rate of 0.86 % of the surface area per second. The capacitance signal indicates that the surface area over this period is fixed at a steady level, indicating that exocytosis and endocytosis were balanced. The maximum increase in surface area averaged 5 %. B, expansion of A to show the capacitance and FM1-43 signals during the first second of stimulation. The two measurements agree closely over the first 200 ms. C and D, comparison between measured and predicted increases i.n surface area. The predicted increases in surface area (continuous noisy lines) were calculated from the FM1-43 signal, assuming a fixed rate constant of endocytosis (see text). A rate constant of 0.84 s−1, the mean rate of rapid endocytosis, did not fit the results well (C). A rate constant of 0.13 s−1, the mean rate constant of slow endocytosis, provided a better description (D).
(2) Vesicles loaded with the dye might recycle with a short time constant, so that exocytosis during the later part of a 5 s stimulus causes a smaller increase in fluorescence than exocytosis at early times. This seems unlikely because Lagnado et al. (1996) found that the increase in FM1-43 fluorescence during continuous depolarization occurred at a relatively constant rate for about 1 min before gradually falling. In that study, the time constant of recycling was estimated as about 3 min and it appeared that endocytosed vesicles mixed into a pool of 740 000 vesicles.
(3) Photobleaching of dye within loaded vesicles might cause a gradual decrease in fluorescence of endocytosed vesicles. Photobleaching did not occur on the time scale of the stimuli used in this study (up to 5 s), because the stimulus-induced increase in FM1-43 fluorescence did not decrease for periods of 10 s or more after exocytosis had ceased (e.g. Figs 3A and 9A).
It therefore seems likely that the increase in FM1-43 fluorescence caused by activation of the Ca2+ current was directly proportional to the total amount of exocytosis.
To allow direct comparison of FM1-43 measurements of exocytosis and capacitance measurements of the net change in membrane surface area, the two signals were normalized to the total membrane area of the terminal. In the case of FM1-43 measurements, this was done within each experiment using the fluorescence measured after staining of the plasma membrane, before the stimulation of vesicle cycling. In the case of capacitance measurements from isolated terminals, responses were normalized to the resting capacitance of the terminal measured before stimulation. It was assumed that the specific capacitance of the vesicle membrane is the same as that of the plasma membrane. The mean capacitance of a population of 17 isolated terminals was 3.1 ± 0.2 pF.
Estimates of vesicle numbers from capacitance measurements require an estimate of the mean capacitance of a single vesicle, which is subject to uncertainties in estimates of both vesicle diameter and the specific capacitance of the membrane. The diameter of small vesicles in the bipolar cell terminal has been measured as 36 nm by Lagnado et al. (1996) and 29 nm by von Gersdorff et al. (1996). Although the specific membrane capacitance is generally assumed to be 1 μF cm−2 (Mennerick et al. 1997), Solsona et al. (1998) have recently measured a value of 0.52 μF cm−2 in mast cells and chromaffin cells. Assuming intermediate values of 0.8 μF cm−2 for the specific membrane capacitance and 32.5 nm for the diameter of a vesicle yields an estimate of 26 aF for the capacitance of a single vesicle. Comparison of this value with the mean capacitance of a terminal (3.1 pF) indicates that the exocytosis of a single vesicle will cause the membrane surface area to increase by a factor of 8.5 × 10⁻⁶. This conversion factor was used to express percentage increases in FM1-43 fluorescence as numbers of vesicles.
Measurements of [Ca2+]i with furaptra
Cells were loaded with furaptra (Molecular Probes) by incubation in 1 μM of the acetoxymethyl ester for 20 min. The light source was a 75 W xenon lamp, connected to the microscope through a shutter- filter wheel assembly (Ludl Electronic Products, NY, USA) and light-guide. Excitation wavelengths were alternated between 340 and 380 nm using filters of 10-12 nm bandwidth (Ealing Electro-Optics). Furaptra fluorescence was collected by a photomultiplier through a wide bandpass filter (515-565 nm; Zeiss) using a dichroic mirror (505 DRLP; Omega Optical). The background fluorescence was minimized by stopping down the exciting beam and limiting light collection to a 20 μm circle in the object plane. The output of the photomultiplier tube was connected to a current-to-voltage converter, low-pass filtered at 100 Hz (4-pole Bessel) and acquired at 1 kHz.
The emission collected using the 340 and 380 nm beams was background subtracted and the ratio (R = F340/F380) used to calculate the [Ca2+]i according to the expression [Ca2+]i = Kdβ(R -Rmin)/(Rmax - R). The Kd of furaptra was taken as 50 μM (Raju et al. 1989; Konishi et al. 1991). The other constants were measured in cells permeabilized with 5 μM ionomycin. Rmin was measured in Ringer solution containing 0 Ca2+ and 1 mM EGTA, and Rmax was measured in the presence of 2.5 mM Ca2+. β is the fluorescence measured using the 380 nm beam at Rmin relative to Rmax. Rmin was 0.27, Rmax was 1.81 and β was 3.72.
RESULTS
Three kinetic components of exocytosis measured with FM1-43
Previous measurements with the fluorescent membrane marker FM1-43 have demonstrated the existence of continuous exocytosis balanced by endocytosis in the synaptic terminal of depolarizing bipolar cells (Lagnado et al. 1996), while capacitance measurements have only detected transient components of exocytosis (von Gersdorff & Matthews, 1994a; Heidelberger et al. 1994). To investigate the relationship between these observations, the time course of exocytosis was monitored by making FM1-43 measurements of improved temporal resolution.
The protocol is shown in Fig. 3A. FM1-43 (5 μM) was applied to an isolated cell voltage clamped at a holding potential of -70 mV. First, the voltage-dependent change in fluorescence of FM1-43 in the plasma membrane was measured by applying a 35 mV hyperpolarization from -50 mV for 5 s. FM1-43 fluorescence was rapidly increased by hyperpolarization and then rapidly decreased by depolarization. Next, exocytosis was stimulated by applying a 70 mV depolarization to 0 mV to activate Ca2+ channels. The change in fluorescence had two components: a rapid decrease caused by dye in the plasma membrane responding to the depolarization, followed by an increase in fluorescence associated with the staining of additional membrane following exocytosis. The voltage-dependent change in fluorescence measured with the hyperpolarizing pulse was used to correct the record in Fig. 3A to obtain the fluorescence change associated with the staining of additional membrane (see Methods). The resulting signal, shown in Fig. 3B, is thought to represent cumulative exocytosis (Lagnado et al. 1996; Smith & Betz, 1996). In this cell there were three components to the fluorescence increase: the first was equivalent to 3.6 % of the initial surface area, the second was equivalent to 5 %, and a continuous component occurred at a rate of 0.77 % s−1 over the remainder of the 5 s depolarization.
To improve the time resolution of these measurements, the first response to a 5 s depolarization was averaged from 13 cells (Fig. 3C). The first component of exocytosis had a mean capacity equivalent to 1.6 % of the initial membrane area and was complete within 20 ms (Fig. 3D and inset). Assuming that the membrane area of a single vesicle is 8.5 × 10⁻⁶ times the area of the average terminal (see Methods), this was equivalent to the release of about 1880 vesicles. The second component of exocytosis occurred at a mean rate of about 4470 vesicles s−1, and was complete in about 1 s, having a capacity of about 4350 vesicles. The continuous component of exocytosis occurred at a constant rate of 1010 vesicles s−1. Both individual and averaged records of exocytosis measured with FM1-43 could be described as two linear sequences following the initial rapid component (Fig. 3B and D). The third (continuous) component of exocytosis measured with FM1-43 was described with a line because it does not fatigue appreciably during depolarizations lasting 20 s or more (Lagnado et al. 1996). The time course of the second component of exocytosis was also described well with a line (Fig. 3B and D). This description was used because there was a relatively distinct discontinuity between the second and third components of exocytosis in 6 of the 13 records averaged in Fig. 3C and D (one of these examples is shown in Fig. 3A and B). These results indicate that the bipolar cell terminal contains three kinetically distinct pools of releasable vesicles. The first was exhausted within 20 ms of depolarization to 0 mV, and the second within about 1 s. After this time, exocytosis occurred at a constant rate, indicating that there was no significant depletion of the third pool of vesicles over a 5 s period.
Depolarizing bipolar cells in the retina do not generate action potentials. In response to a step of light there is a transient depolarization at light onset, followed by a maintained response of smaller amplitude (Ashmore & Falk, 1980; Saito & Kujiraoka, 1982). It seems possible that both transient and continuous components of exocytosis will normally contribute to signal transmission from depolarizing bipolar cells, because postsynaptic ganglion cells exhibit both transient and maintained components in the spike discharge elicited by a step of light (Hubel, 1995).
Measurements of membrane capacitance and conductance
To monitor the most rapid components of exocytosis with better time resolution, changes in membrane capacitance were measured in isolated terminals voltage clamped using the perforated-patch technique. An example of the stimulation protocol is shown in Fig. 4A, and associated changes in conductance and cell capacitance are shown in Fig. 4B. After calibrating the capacitance record with a 100 fF signal, two 10 ms depolarizations were applied from the holding potential of -70 mV. The first depolarization, to -50 mV, did not activate any voltage-dependent conductances or elicit a capacitance change. The second depolarization, to 0 mV, activated an inward Ca2+ current of about 150 pA. The Ca2+ channels all closed within 5 ms of repolarization to -70 mV (Fig. 4A) and the cell capacitance measured 50 ms later increased by 39 fF, reflecting the exocytosis of about 1500 vesicles. The capacitance then recovered to baseline with a time constant of 1.1 s, reflecting rapid endocytosis. The capacitance responses we measured were grossly similar to those observed by von Gersdorff & Matthews (1994a) and Sakaba et al. (1997).
Brief depolarizations, such as that shown in Fig. 4, did not elicit any change in conductance, but longer depolarizations that introduced a large amount of Ca2+ into the terminal were usually followed by an increase in conductance that decayed over a few seconds. An example of this behaviour is given in Fig. 5, which shows a series of capacitance responses and associated conductance changes from an isolated terminal voltage clamped using the conventional whole-cell technique. The first response, obtained 1 min after the beginning of whole-cell dialysis, was elicited by a 2 s depolarization to 0 mV (Fig. 5A). The initial increase in capacitance was 280 fF. The capacitance then continued to increase after the closure of Ca2+ channels, at a rate of 20 fF s−1 for a period of 2 s (marked by arrow). The stimulus also caused the conductance to jump from 0.9 to 1.8 nS. The conductance then recovered to basal levels over the period during which the capacitance continued to rise. In contrast, a 100 ms depolarization did not cause the capacitance to rise after closure of Ca2+ channels, or a significant increase in conductance (Fig. 5B). This difference between the responses to short and long depolarizations was also consistently observed in recordings using the perforated-patch technique. The conductances activated after long depolarizations can be blocked by the introduction of the Ca2+ buffers BAPTA (Okada et al. 1995) and EGTA (A. Gomis & L. Lagnado, unpublished observations), indicating that they are activated by the accumulation of Ca2+. When Ca2+-activated K+ channels are blocked by internal Cs+, the principal Ca2+-activated conductances are a Ca2+-dependent Cl− conductance and Na+-Ca2+ exchange (Okada et al. 1995). These conductances can be readily distinguished from the preceding Ca2+ current, because on repolarization Ca2+ channels in this terminal deactivate very rapidly (Fig. 4A; see also Mennerick & Matthews, 1996).
Is the increase in capacitance observed after longer depolarizations really a reflection of continued exocytosis, or might it be an artifact generated by the associated conductance change? Such an artifact might arise when using the piecewise linear technique because the change in membrane resistance (Rm) and capacitance (Cm) elicited by the stimulus will generate a phase error, causing conductance changes to appear as capacitance changes. The following calculation indicates that such an error cannot account for the continued rise in capacitance.
The phase angle at which capacitance changes can be detected independently of conductance changes is given by eqn (33) in Gillis (1995):
where
Rs is the access resistance through the patch pipette and wc = 2πf, where f is the frequency of the sinusoidal command voltage. In the example shown in Fig. 5, Rs was 10 MΩ, Rm was 1.1 GΩ, Cm was 4.7 pF, and f was 2 kHz. After the stimulus shown in Fig. 5A, Rm fell to 0.56 GΩ and Cm increased to 4.98 pF, so the change in θ(αerr) was 2.49 deg (defining αerr as the resting value of θ minus the value of θ after stimulation). The artifactual change in Cm (ΔCart) caused by αerr is given by eqn (35) of Gillis (1995):
 |
A phase error of 2.49 deg is therefore expected to cause a decrease in the apparent capacitance of only 1.5 fF, under the conditions of this experiment.
Experimental verification that the continued rise in capacitance was not due to the conductance increase is shown in Fig. 5C and D, which illustrates capacitance responses and associated conductance changes 7.5 and 16 min after the beginning of whole-cell dialysis. Both responses were elicited by 1 s depolarizations. During the course of whole-cell dialysis the secretory response gradually declined, until after 16 min there was a very small capacitance increase immediately after the stimulus, and no continued rise afterwards. In contrast, the Ca2+ current and Ca2+-activated conductance changes were maintained. If these conductance changes were the cause of an artifactual rise in capacitance after closure of Ca2+ channels, a similar rise in capacitance should have been observed later in the experiment. Rather it seems that the continued rise in capacitance was due to the continuation of exocytosis. The temporal correlation between the Ca2+-dependent conductance and continuation of exocytosis probably reflects the fact that both processes are activated by Ca2+ loads introduced into the terminal by prolonged depolarizations. Below we present measurements made with FM1-43 that confirm that exocytosis can continue after closure of Ca2+ channels following long depolarizations (Fig. 9). We also demonstrate that the Ca2+-activated conductance reflects the accumulation of intracellular Ca2+ in the terminal (Fig. 10).
Figure 10. The Ca2+-activated conductance and Ca2+ accumulation.

A, measurements of spatially averaged [Ca2+]i in the synaptic terminal of an intact bipolar cell made with the low-affinity fluorescent indicator furaptra. Shown are responses to depolarizations from -70 to 0 mV lasting 0.2, 1 and 5 s (thick line). The corresponding Ca2+ currents are shown in B. The fall in [Ca2+]i at the end of each stimulus could be described as a single exponential, as shown by the fitted curves. The time constants of recovery were 0.93, 0.67 and 0.78 s after the 0.2, 1 and 5 s stimuli, respectively. After the 5 s stimulus, [Ca2+]i did not return to baseline during the recording period (baseline for exponential fit, 1.5 μM) indicating that slower components of Ca2+ extrusion may be active after these strong stimuli. The [Ca2+]i at the end of stimulation was correlated with the amplitude of the Ca2+-activated conductance, which recovered with time constants of 1.06 s after the 1 s stimulus, and 1.09 s after the 5 s stimulus (as shown by the smooth curves).
The increase in membrane capacitance during maintained depolarization
The time course of the capacitance increase was monitored by delivering a series of depolarizing pulses of different durations and measuring the increase in capacitance within 100 ms of repolarization. Figure 6A shows capacitance responses to depolarizations lasting 10, 100 and 500 ms. The relationship between the duration of the pulse and the capacitance increase for this terminal is shown in Fig. 6B, where each point is the mean of two measurements. The line fitted through the points shows that after an initial jump of about 21 fF, the capacitance increased at a rate of about 44 fF s−1. The time course of the fastest component of the capacitance increase is shown in more detail in Fig. 6C and D. In this example, the increase could be described as a saturating exponential with a time constant of 2.2 ms and a maximum amplitude of 16 fF. This rate of depletion is probably limited by the rate at which the L-type Ca2+ channels in the bipolar cell open in response to depolarization (Mennerick & Matthews, 1996).
Figure 6. Changes in membrane capacitance evoked by depolarizations of different durations.

A, capacitance responses to depolarizing pulses lasting 10, 100 and 500 ms. B, capacitance change as a function of pulse duration, incorporating results shown in A. Each point is the mean of two measurements. The line fitted to the points gives the initial rate of the second component of exocytosis as 44 fF s−1. Extrapolation of this line back to time zero yields an estimate of 21 fF for the capacity of the first component of exocytosis. C, capacitance responses to depolarizing pulses lasting 1, 3 and 10 ms. D, capacitance change as a function of the pulse duration for the responses shown in C. The exponential curve through the points has a time constant of 2.2 ms and capacity of 16 fF. The point at 0 ms is the response to the tail current through Ca2+ channels closing at the end of these depolarizing pulses. This was estimated by depolarizing to +140 mV for 5 ms to open Ca2+ channels maximally without Ca2+ influx, and then repolarizing to -70 mV, allowing Ca2+ entry during the fraction of a millisecond that these channels remained open (see also Mennerick & Matthews, 1996). E, the mean capacitance change elicited by depolarizing pulses of different durations (from 10 ms to 5 s) plotted as a function of pulse duration. Each point is the mean of between 8 and 69 observations, and error bars are ± 1 s.e.m. The time course of the averaged capacitance increase could be described empirically by the function: ΔC(t) = ΔCmax - ΔC1exp(-k1t), with ΔCmax = 207 fF, ΔC1 = 175 fF and k1 = 1.03 s−1. This is plotted as a continuous line. F, expansion of E to show the increase in capacitance over the first 500 ms of depolarization in more detail. The dashed line, representing the initial rate of the second component of exocytosis, has a slope of 160 fF s−1. Extrapolation of this line back to time zero yields an estimate of 33 fF for the capacity of the first component of exocytosis. All measurements included in the averaged results shown in E and F and Fig. 8 were obtained from isolated synaptic terminals voltage clamped using the permeabilized-patch or the conventional whole-cell techniques.
The averaged time course of the capacitance increase during a 5 s depolarization to 0 mV is shown in Fig. 6E, and responses over the first 500 ms are shown in more detail in Fig. 6F. The capacitance increase after 10 ms averaged 30 ± 3 fF (n = 24 terminals), corresponding to the release of about 1200 vesicles during the first phase of exocytosis. The initial rate of the second component of capacitance increase, measured as the slope of the line fitted between 10 and 500 ms (Fig. 6F) averaged 160 fF s−1, corresponding to the release of about 6200 vesicles s−1. Estimates of the rates of the first and second components of exocytosis made using the capacitance technique were therefore similar to those made using FM1-43, as shown in Table 1 which summarizes measurements of exocytosis performed with FM1-43 and capacitance techniques. The continuous component of exocytosis could not, however, be detected in these averaged capacitance responses. The line fitted through the points in Fig. 6E is an empirical description of the time course of the averaged capacitance increase provided by the function: ΔC(t) = ΔCmax - ΔC1exp(-k1t), with ΔCmax = 207 fF, ΔC1 = 175 fF and k1 = 1.03 s−1.
Table 1.
Three components of exocytosis measured using FM1-43 and the capacitance technique
| FM1-43 | Capacitance | ||
|---|---|---|---|
| First transient | Capacity (vesicles) | 1800 | 1200† |
| Rate of depletion (s−1) | > 150* | 500 | |
| Second transient | Capacity (vesicles) | 4400 | — |
| Rate (vesicles s−1) | 4500 | 6200‡ | |
| Continuous | Rate (vesicles s−1) | 1010 | > 350§ |
The rapid jump in FM1-43 fluorescence occurred within 20 ms (inset Fig. 3D). Here we assume that depletion of the rapidly releasable pool of vesicles occurred exponentially over this period, and that the 20 ms limit represents at least three time constants.
Measured as the averaged capacitance increase to a 10 ms depolarization (Fig. 6F).
Measured as the initial rate of the second component of the capacitance increase (Fig. 6F).
Measured as the mean initial rate of capacitance increase after depolarizations longer than 500 ms (Fig. 8B).
Endocytosis during maintained stimulation
Relatively little is known about the temporal relationship between exocytosis and endocytosis at the synapse (Fesce et al. 1994). We therefore compared capacitance and FM1-43 measurements to estimate the time course of endocytosis during a 5 s depolarization. Each measurement of the change in capacitance used in Fig. 6E was expressed as a percentage change in membrane surface area by normalizing to the resting capacitance of the terminal. This allowed direct comparison with averaged measurements of exocytosis made using FM1-43, also expressed as a percentage of the resting plasma membrane area (Fig. 3; see Methods). The only assumption we made was that the mean terminal size was not significantly different in the two populations, which seems reasonable given the relatively small variability in size. In a population of 17 isolated terminals, the resting capacitance was 3.1 ± 0.2 pF (mean ±s.e.m.). Further, the mean diameter of isolated terminals (9.5 ± 0.1 μm; n = 37 terminals) was similar to terminals still attached to the cell body through the axon (10.0 ± 0.2 μm; n = 32 cells).
Figure 7A compares the time course of exocytosis (continuous noisy line) and increase in surface area (•) during a 5 s depolarization. The two quantities agreed closely during the first 200 ms of stimulation (Fig. 7B; Table 1), indicating that the same population of vesicles was detectable by fluorescence staining and capacitance measurements. Within 1 s, however, the amount of exocytosed membrane exceeded the increase in surface area. The difference can be attributed to internalization of membrane by endocytosis (Smith & Betz, 1996).
Measurements of capacitance immediately following a depolarizing stimulus demonstrate that endocytosis can follow exocytosis within hundreds of milliseconds (von Gersdorff & Matthews, 1994a; Figs 4, 5 and 6). Lagnado et al. (1996) have previously shown that exocytosis and endocytosis in the bipolar cell terminal are balanced on the time scale of minutes. The results in Fig. 7 extend these observations by demonstrating that exocytosis and endocytosis become balanced within a few seconds of continuous stimulation. This does not appear to be the case for chromaffin cells, where simultaneous measurement of exocytosis and endocytosis carried out by Smith & Betz (1996) indicated that endocytosis usually occurs after exocytosis.
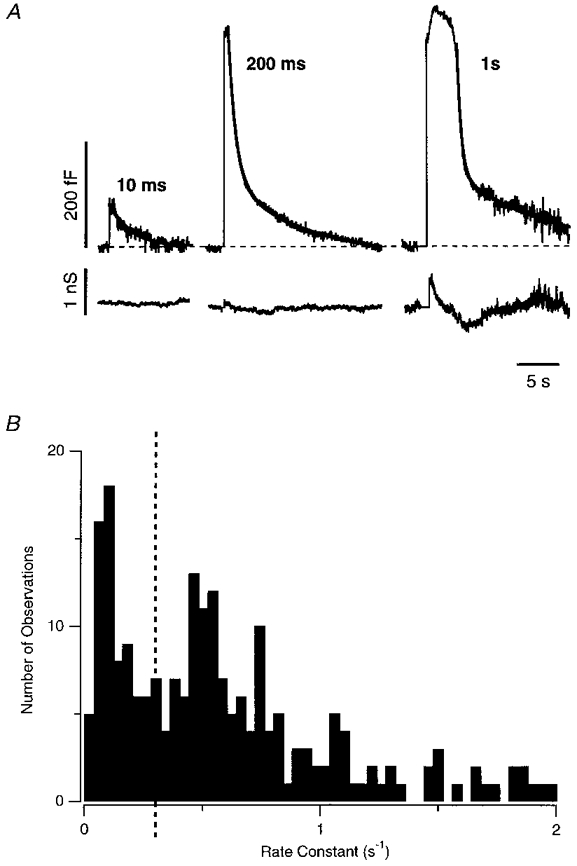
After a brief stimulus, the fall in membrane capacitance occurred with a rate constant of about 0.8 s−1 (Fig. 4 and below). How rapidly does endocytosis occur during maintained stimulation?Fig. 7A indicates that over the period from 2 to 5 s after the beginning of the stimulus, exocytosis occurred at a rate of about 0.86 % s−1, while the increase in membrane area was approximately constant at 5 %. The rate of endocytosis over this period was therefore also 0.86 % s−1, and the rate constant was about 0.17 s−1. This calculation indicates that the rate of endocytosis during maintained stimulation is considerably slower than that observed after a brief stimulus. This point is also illustrated in Fig. 7C and D, which shows an attempt to predict the increase in membrane surface area from the time course of exocytosis measured with FM1-43. If the rate of change of surface area (S) is the difference between the rate of exocytosis (Exo) and endocytosis (Endo), then:
 |
where F is the amount of exocytosis measured with FM1-43 and kendo is the rate constant of endocytosis. This expression was integrated numerically to obtain the increase in surface area that would be predicted assuming a fixed value of kendo. Figure 7C shows that the prediction deviates substantially from the measured increase with kendo = 0.84 s−1 (the mean rate constant of rapid endocytosis measured after a brief stimulus). Figure 7D shows that a considerably better description of the time course of the increase in surface area was obtained assuming kendo = 0.13 s−1. A slightly better description was obtained using the value of kendo = 0.17 s−1 calculated above, but here we illustrate the fit obtained with kendo = 0.13 s−1 because this was the mean rate of the slow endocytic process described below. It is the faster mechanism of membrane retrieval that appears to be particularly strongly inhibited by a prolonged stimulus.
Exocytosis after closure of Ca2+ channels
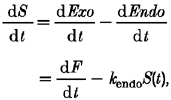
The capacitance signal observed after a depolarizing stimulus reflected both exocytosis and endocytosis. After depolarizations lasting up to about 200 ms, the capacitance usually began to recover immediately with a single time constant (e.g. Fig. 4). After longer depolarizations, however, the capacitance often continued to rise for periods of seconds before recovering (e.g. Figs 5A and 9C), indicating that exocytosis continued for some time after closure of Ca2+ channels. The graph in Fig. 8A illustrates how the delay between repolarization and the fall in capacitance depended on the duration of the depolarization. For depolarizations less than 500 ms there was rarely a delay, but for depolarizations of 5 s the delay averaged 2.0 ± 0.6 s. The graph in Fig. 8B illustrates how the initial rate of capacitance increase depended on the duration of the preceding depolarization. A continued rise in capacitance was only observed after depolarizations lasting longer than 500 ms. Note the large errors in these measurements (error bars show ±s.e.m.), indicating the considerable variability observed between cells. The mean rate of capacitance increase after a 1 s depolarization was 10 ± 7 fF s−1, reflecting the exocytosis of at least 370 vesicles s−1.
Figure 8. The delayed fall in membrane capacitance.
A, the delay between the end of a depolarizing stimulus and the beginning of the fall in capacitance plotted as a function of the duration of the stimulus. B, the initial rate of rise of capacitance after repolarization plotted as a function of the duration of the stimulus. The rate was measured by fitting a line to the first 0.5-2 s of the capacitance increase. All depolarizations were to 0 mV. Bars show ±s.e.m. Note logarithmic scale for pulse duration.
To assess accurately how long exocytosis continued after depolarizations of different durations, it was necessary to measure exocytosis independently of endocytosis by using FM1-43. In the example shown in Fig. 9A (an averaged response from 3 cells), exocytosis stopped almost immediately after a 200 ms depolarization, but continued for at least 5 s after a 2 s depolarization. The characteristic differences in the capacitance signals observed after short and long depolarizations in Fig. 8 could therefore also be observed by measuring exocytosis with FM1-43. The length of time for which exocytosis continued varied between cells. For instance, Fig. 3A shows an example where there was no obvious continuation of exocytosis after a 5 s depolarization, while Fig. 9B shows an example where exocytosis continued for at least 6 s after a stimulus of the same duration. On average, exocytosis continued for at least 4 s after a 5 s depolarization (Fig. 3C).
Accumulation of [Ca2+]i in the synaptic terminal
The fact that long stimuli activated a Ca2+-dependent conductance but short stimuli did not (Fig. 5) suggested that accumulation of Ca2+ in the terminal might account for the continuation of exocytosis after closure of Ca2+ channels. To investigate this idea further, we measured the time course of changes in [Ca2+]i using furaptra, a Ca2+-sensitive dye with a low affinity for Ca2+ (Kd = 50 μM). Typical responses are shown in Fig. 10. The thick trace in Fig. 10A shows the rise in [Ca2+]i elicited by a 5 s depolarization, and Fig. 10B shows the Ca2+ current elicited during this stimulus. [Ca2+]i reached a maximum within 2 s, then stayed relatively constant. After closure of Ca2+ channels, [Ca2+]i began to fall immediately, with a time constant of 0.78 s (fitted curve). The Ca2+-activated conductance, apparent as the inward tail current, also began to decay immediately, with a time constant of 1.09 s (that is, over a similar time course to the decline in [Ca2+]i). The peak rise in [Ca2+]i was similar after a 1 s depolarization, as was the fall in [Ca2+]i after closure of Ca2+ channels. Again, the Ca2+-activated conductance decayed over a similar time course to the fall in [Ca2+]i. The peak rise in [Ca2+]i was much smaller after a 200 ms depolarization, and this was mirrored by the smaller and briefer Ca2+-activated tail current. These results support the idea that differences in the secretory response observed after short and long depolarizations reflect differences in the Ca2+ load introduced into the terminal.
The changes in [Ca2+]i that we measured with furaptra show two important differences compared with measurements made with fura-2, a Ca2+ indicator with a higher affinity (Kd = 200 nM). First, the peak rise in [Ca2+]i during maintained depolarization does not rise above 1-2 μM when measured with fura-2 (Heidelberger & Matthews, 1992; Kobayashi & Tachibana, 1995; Burrone & Lagnado, 1997), whereas it appeared to rise to levels of 20-30 μM when measured with furaptra (Fig. 10). Second, the fall in [Ca2+]i measured with fura-2 occurs on the time scale of many seconds (von Gersdorff & Matthews, 1994b; Burrone & Lagnado, 1997), and is considerably slower than the decay of the Ca2+-activated conductance (Okada et al. 1995), whereas using furaptra, the decline in [Ca2+]i after closure of Ca2+ channels occurred with a time constant of less than 1 s, and, if anything, was somewhat faster than the decay of the Ca2+-activated conductance. These differences may be related to the difference in the Ca2+ affinity of the two dyes. Fura-2, because of its higher affinity, will cause a larger increase in the buffering capacity of the terminal than would furaptra (mole for mole), and this might be expected to both attenuate the Ca2+ signal and slow its decline (Neher & Augustine, 1992; Regehr & Atluri, 1995). Changes in [Ca2+]i measured with furaptra are therefore more likely to reflect the normal changes in [Ca2+]i occurring in a bipolar cell with no exogenous Ca2+ buffers.
It is interesting to compare the kinetics of the decline in [Ca2+]i and the continuation of exocytosis after closure of Ca2+ channels. The Ca2+-activated conductance always began to decay immediately after closure of Ca2+ channels (e.g. Figs 5, 9C and 10), whereas exocytosis often continued at a fixed rate for a period of a few seconds. Figure 9B shows an example where the rate of exocytosis measured with FM1-43 did not slow until about 4 s after the closure of Ca2+ channels. Figure 9C shows an example of the capacitance increase after a 2 s depolarization (thick trace), and the associated decline in the Ca2+-activated conductance (thin trace). The rise in capacitance occurred at a fixed rate until the Ca2+-activated conductance had almost fully declined. Further, the averaged FM1-43 responses in Fig. 3C indicate that the continuation of exocytosis after a 5 s depolarization outlasts the increase in conductance (monitored using the inward tail current). These observations suggest that the Ca2+ levels required to cause a conductance increase are higher than those driving the continuation of exocytosis, although further experiments would be required to test this idea properly.
Fast and slow endocytosis
When the fall in membrane capacitance was delayed after a longer stimulus, it could be described as the sum of two exponentially decaying quantities. An example of this behaviour is shown in Fig. 11A, which is a perforated-patch recording made in an intact cell with the patch pipette on the cell body (see Methods). In this cell, the capacitance recovery after a 10 ms depolarization began without any obvious delay with a rate constant of 0.4 s−1. After a 200 ms depolarization, which caused a capacitance increase 5 times as large, the fall in surface area was briefly delayed, but, once it had begun, was best described as the sum of two exponentials, with 67 % of the membrane being endocytosed at a rate of 1.1 s−1, and the remainder at 0.1 s−1. After a 1 s depolarization, the fall in capacitance was delayed by about 3.7 s, after which it was best described as the sum of two exponentials, with 63 % of the membrane being endocytosed at a rate of 2 s−1, and the remainder at 0.08 s−1.
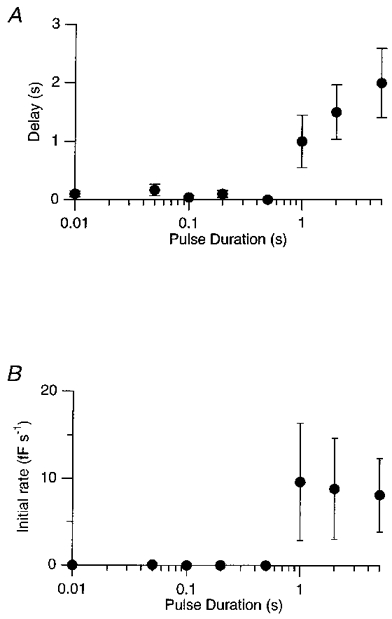
Figure 11. Capacitance measurements of fast and slow endocytosis.
A, capacitance responses to depolarizing pulses lasting 10 ms, 200 ms and 1 s from an intact bipolar cell. Lower traces show conductance changes elicited by these stimuli. The recovery phase of the capacitance response after the short stimulus could be fitted with a single exponential function, but a double exponential function provided a better description after the longer stimuli (thick lines). The rate constants of endocytosis were 0.36 s−1 after the 10 ms pulse, 1.1 s−1 and 0.11 s−1 after the 200 ms pulse and 2.0 s−1 and 0.08 s−1 after the 1 s pulse. The percentage of membrane endocytosed through the faster mechanism was 67 % after the 200 ms pulse and 63 % after the 1 s pulse. Capacitance recordings were decimated to 100 points per second and smoothed by convolution with a Gaussian function of s.d. = 23 ms. B, histogram of the rate constants obtained from single and double exponential fits to 168 capacitance responses. The dashed line at 0.3 s−1 separating the two peaks illustrates how the rate constants were divided into two populations (slow < 0.3 s−1 and fast > 0.3 s−1). Results in B and Fig. 12 include measurements made in intact cells (with the patch pipette on the cell body) as well as isolated terminals.
Examination of residual plots indicated that in 25 out of 26 responses to 100 ms pulses, the capacitance recovered without delay as a single exponential (e.g. Fig. 4B), while in 12 of 19 responses to 1 s pulses, the fall in capacitance was described better as the sum of two exponentials. In making these fits we did not assume that the capacitance necessarily recovered to pre-stimulus levels. In 168 measurements, the capacitance recovered to a level 3 ± 1 fF below the pre-stimulus level. The distribution of rate constants measured from both single and double exponential fits to the fall in capacitance is plotted in Fig. 11B. The histogram displays two peaks. The description of the fall in membrane surface area by the sum of two exponentially decaying quantities is consistent with the idea that there are two mechanisms of endocytosis, one fast and one slow, and that vesicles destined for slow endocytosis cannot undergo fast endocytosis.
The rate constants of fast and slow endocytosis are plotted as a function of stimulus duration in Fig. 12A. For all responses in which the recovery of capacitance was best described as a double exponential, the faster of the two rate constants was pooled into the ‘fast’ group, and the slower rate constant into the ‘slow’ group. The rate constants measured from single exponential fits were pooled in the ‘slow’ group if they were below 0.3 s−1, and into the ‘fast’ group if they were above 0.3 s−1. The averaged rate constant of fast endocytosis was 0.84 ± 0.04 s−1 (n = 152 measurements), and the rate constant of slow endocytosis was 0.13 ± 0.01 s−1 (n = 68 measurements). The rates of fast and slow endocytosis were independent of the duration of the preceding stimulus.
Figure 12. Increasing stimulus duration increased the amount of membrane recycled by slow endocytosis.
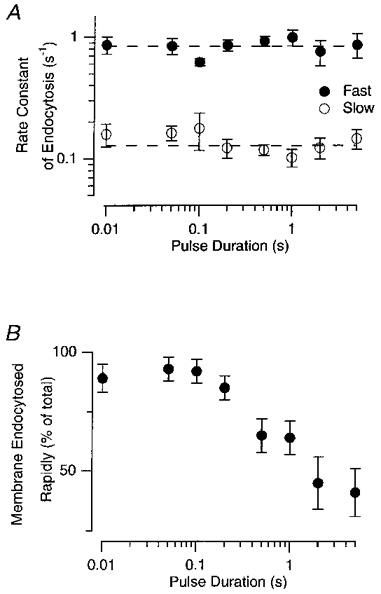
A, the values of the fast and slow rate constants plotted as a function of stimulus duration. Each point is the mean of between 15 and 27 measurements, and error bars show ± 1 s.e.m. The dashed lines represent the values of the fast and slow rate constants averaged over all pulse durations (fast = 0.84 s−1 and slow = 0.13 s−1). Note the logarithmic axes. B, the percentage of membrane endocytosed through the fast mechanism plotted as a function of stimulus duration. Note that the results only apply to the period over which the fall in capacitance was described by the fitted function, which was the great majority of the falling phase. This method of analysis did not, therefore, take into account membrane that was recycled during the depolarizing pulse or in the delay period between closure of Ca2+ channels and the cessation of exocytosis.
Prolonged stimulation increased the proportion of membrane recycled by slow endocytosis
An estimate of the relative contributions of fast and slow endocytosis to the recovery of surface area is shown as a function of stimulus duration in Fig. 12B. For recoveries described by double exponentials, the amplitude of the fast component relative to the total is plotted. When recovery was described as a single exponential, it was considered to be 100 % fast if occurring at a rate constant > 0.3 s−1, and 100 % slow at a rate constant < 0.3 s−1. Figure 12B shows that the effect of increasing stimulus duration was to decrease the fraction of membrane recycled through the faster route. This switch from fast to slow endocytosis began within about 200 ms of continuous stimulation, until, after a stimulus lasting 5 s, about 50 % of the excess membrane was recycled through the slower route. How do these measurements of endocytosis after stimulation compare with estimates of endocytosis during stimulation? During continuous stimulation, the mean rate constant of endocytosis was about 0.17 s−1 (Fig. 7A), indicating that rapid endocytosis was inhibited at least 5-fold by the time that the transient components of exocytosis were exhausted. Fast endocytosis recovered after repolarization, because 50 % or more of membrane was recycled with a fast time constant (e.g. Fig. 11A).
DISCUSSION
In this study we have made independent measurements of exocytosis and endocytosis at a synapse by using a combination of the capacitance technique and FM1-43 measurements of improved temporal resolution. These methods have allowed us to define three components of exocytosis and two mechanisms of endocytosis, as well as the temporal relationship between these processes. Our results demonstrate that the behaviour of the bipolar cell synapse depends on the duration of the stimulus. A brief depolarization from rest causes rapid exocytosis from two vesicle pools of limited size, and these vesicles are rapidly endocytosed. Longer depolarizations associated with an accumulation of cytoplasmic Ca2+ lead to the stimulation of a third component of exocytosis that is slower but occurs continuously. Simultaneously, rapid endocytosis is inhibited and there is an increase in the proportion of vesicles that are recycled by slow endocytosis.
Transient and continuous exocytosis in the bipolar cell terminal
Transient exocytosis in the bipolar cell terminal occurs at a rate of around 600 000 vesicles s−1 (Table 1), and is driven by a [Ca2+] of the order of 100 μM, which can only be achieved within tens of nanometres of open Ca2+ channels (Heidelberger et al. 1994; Mennerick & Matthews, 1996). This suggests that the L-type Ca2+ channels in the bipolar cell terminal are localized to release sites at the ribbons that tether synaptic vesicles close to the plasma membrane. Indeed, L-type Ca2+ channels in hair cells of the frog have been directly shown to localize at these structures (Roberts et al. 1990). In contrast, continuous exocytosis is stimulated by a significantly lower [Ca2+]i. Lagnado et al. (1996) used the caged Ca2+ compound nitrophenyl-EGTA (Ellis-Davies & Kaplan, 1994) to raise cytoplasmic [Ca2+] while simultaneously monitoring FM1-43 fluorescence and found that exocytosis could be driven at rates of 1000- 2000 vesicles s−1 by an [Ca2+]i of about 1 μM. Continuous exocytosis occurred at similar rates during depolarization (Fig. 3), and persisted for several seconds after long depolarizations causing an appreciable rise in bulk cytoplasmic [Ca2+]i (Figs 8 and 9).
It would be interesting if the Ca2+-activated conductance in bipolar cells could be used as an indicator of the [Ca2+] immediately under the membrane. The Ca2+ dependence of this conductance might best be established by using caged Ca2+ to achieve spatially uniform rises in [Ca2+]i that can be measured accurately by averaging the fluorescence signal from the whole terminal. If Ca2+ gradients within the terminal dissipate rapidly after closure of Ca2+ channels, our measurements with furaptra would suggest that the Ca2+-activated conductance is activated half-maximally by at least 5-10 μM Ca2+ (Fig. 10). The [Ca2+]i that drives the continuation of exocytosis may be lower than this, because exocytosis can occur at a high rate for several seconds after closure of Ca2+ channels (e.g. Fig. 9B), while the Ca2+-activated conductance immediately declines with a time constant of about 1 s (Fig. 10).
The bipolar cell terminal contains about 50 ribbons, each of which has 22 vesicles docked at the plasma membrane, and about 90 vesicles attached further back (von Gersdorff et al. 1996). As pointed out by Mennerick & Matthews (1996), the number of docked vesicles in a bipolar cell terminal at rest (∼1100) is similar to the size of the first releasable pool. The number of vesicles further up the ribbon (∼4500) is similar to the size of the second pool of releasable vesicles that we have measured using FM1-43 (Table 1). The size of this second pool and the time course over which it is depleted is difficult to estimate using the capacitance technique because, as shown in Fig. 7, endocytosis occurs simultaneously with exocytosis. It may therefore be that this pool of vesicles is not depleted exponentially, as has been suggested from capacitance measurements (Mennerick & Matthews, 1996). Our measurements with FM1-43 actually suggest that these vesicles are exocytosed at a constant rate and then suddenly exhausted (Fig. 3B). Perhaps the ribbon acts as a conveyor belt that replenishes release sites on the plasma membrane at a fixed rate until the last vesicle on the ribbon has been exocytosed. To distinguish reliably between an exponential and a linear time course of depletion it will be necessary to make FM1-43 measurements with an improved signal-to-noise ratio.
Exocytosis in bipolar cells compared with exocytosis in neurons that fire action potentials
Depolarizing bipolar cells, like other sensory neurons possessing ribbon synapses, do not fire sodium-dependent action potentials. In the retina, the voltage response to light has a phasic component that lasts about 100 ms and rarely exceeds 20 mV in amplitude, followed by a tonic component that is determined by the duration of the stimulus (Ashmore & Falk, 1980; Saito & Kujiraoka, 1982). This voltage signal is generated by the action of L-type Ca2+ channels and voltage- and Ca2+-dependent K+ channels (Burrone & Lagnado, 1997). We expect that the phasic component of the depolarizing response will trigger the rapid, transient components of exocytosis described in this paper and by Mennerick & Matthews (1996). It seems likely that continuous exocytosis which follows depletion of the rapidly releasable pools will be driven by the maintained component of the depolarizing response.
The kinetics of exocytosis have been characterized in several neurons where the voltage signal controlling transmitter release is the action potential, including the neuromuscular junction of frogs (Barrett & Stevens, 1972) and crayfish (Delaney & Tank, 1994), as well as hippocampal neurons (Goda & Stevens, 1994) and retinal amacrine cells (Borges et al. 1995). In each case, the initial burst (phasic component) is followed by a smaller increase in the rate of release that continues for hundreds of milliseconds after closure of Ca2+ channels (asynchronous component). Asynchronous release is correlated with short-term synaptic plasticity and the increase in cytoplasmic [Ca2+] induced by prolonged stimulation (reviewed by Zucker, 1996). Thus transient and continuous exocytosis at the ribbon synapse of bipolar cells may be analogous to phasic and asynchronous exocytosis in neurons that fire action potentials. Continuous exocytosis in bipolar cells is likely to be of functional importance, given the time scales over which depolarizing bipolar cells signal changes in light intensity (Ashmore & Falk, 1980; Hubel, 1995).
Goda & Stevens (1994) estimated the peak rate of the phasic component in hippocampal neurons to be about 0.033 vesicles per bouton per millisecond, while the asynchronous component occurred at a peak rate of about 0.0012 vesicles per bouton per millisecond. Release rates in retinal amacrine cells are considerably greater, the phasic and asynchronous components occurring at 0.15 and 0.022 vesicles per site per millisecond, respectively (Borges et al. 1995). The maximum release rate in the goldfish bipolar cell appears to be greater still. Assuming that there are 22 release sites associated with each ribbon (von Gersdorff et al. 1996), then the first component of exocytosis occurred at a peak rate of about 0.5 vesicles per site per millisecond. The second transient component of exocytosis corresponded to a release rate of about 0.004 vesicles per site per millisecond, and continuous exocytosis, if it also occurred at the ribbon, proceeded at 0.001 vesicles per site per millisecond.
Fast and slow endocytosis in the bipolar cell terminal
Electron microscopy of the neuromuscular junction indicates the existence of two basic mechanisms of endocytosis at the synapse: a slow process, involving the formation of clathrin-coated pits after the collapse of the vesicle into the plasma membrane (Heuser & Reese, 1973), and a fast process (‘kiss-and-run’) in which the vesicle is briefly connected to the plasma membrane by a fusion pore that rapidly closes (Ceccarelli et al. 1973). Evidence for fast and slow recycling pathways within a single terminal also comes from electron microscopy of synaptic terminals in photoreceptors of Drosophila, which possess ribbon synapses similar to those in bipolar cells (Koenig & Ikeda, 1996). The relative importance of these two mechanisms has been the subject of much debate (Fesce et al. 1994; Koenig & Ikeda, 1996; Cremona & De Camilli, 1997). Our results provide a clear demonstration that fast and slow mechanisms of endocytosis co-exist in a synaptic terminal. Fast endocytosis in the bipolar cell terminal occurred with a rate constant of about 1 s−1 and slow endocytosis with a rate constant of 0.1 s−1. We do not know if fast endocytosis in the bipolar cell terminal occurs by a mechanism that might be termed ‘kiss-and-run’, or whether slow endocytosis occurs by a clathrin-mediated mechanism, but these are obviously important questions.
Electron microscopy also indicates that increased stimulation of exocytosis at the neuromuscular junction causes a shift from the ‘kiss-and-run’ mechanism of endocytosis to the slower mechanism involving coated pits (reviewed by Fesce et al. 1994). This may represent the structural basis of the observation that all vesicles in the bipolar cell terminal were rapidly endocytosed after a brief stimulus, but, as the duration of the stimulus increased, about 50 % of the membrane was endocytosed by the slow mechanism (Fig. 12B). We also found that fast endocytosis was inhibited during continuous stimulation (Fig. 7), but recovered with a delay after the closure of Ca2+ channels (Fig. 11). The slowing of the mean rate of endocytosis therefore occurred through two mechanisms; inhibition of fast endocytosis, and an increased fraction of membrane retrieved by the slower route. The fast mechanism of endocytosis was used to recover all the vesicles released during the first, most rapid, components of exocytosis, but only about 50 % of vesicles released during the slower, continuous, component of exocytosis.
Membrane retrieval with a rate constant of 1 s−1 has also been observed in bipolar cells by von Gersdorff & Matthews (1994a, b) and Sakaba et al. (1997). Von Gersdorff & Matthews (1994b) also found that increasing the stimulus duration caused the decline in membrane area to begin with a delay after the closure of Ca2+ channels and then proceed more slowly. These effects were associated with sub-micromolar rises in [Ca2+], leading to the suggestion that these Ca2+ levels regulate endocytosis on a moment-by-moment basis, and cause endocytosis to be blocked until [Ca2+] falls after the closure of Ca2+ channels. Our results confirm that there is a strong inhibition of endocytosis during prolonged stimulation, but differ from those of von Gersdorff & Matthews (1994b) in three regards. First, we found that exocytosis and endocytosis occur simultaneously. Second, we found that the delayed recovery in membrane area after the closure of Ca2+ channels is closely correlated with the continued stimulation of exocytosis driven by residual Ca2+. Third, the decline in membrane area, once it begins, occurs through both the fast and slow mechanisms of endocytosis, the rate constants of which are independent of the duration of the preceding stimulus. Thus, the slower rate of membrane retrieval is primarily due to an increased fraction of membrane labelled for endocytosis by the slower route, rather than the prolonged inhibition of a single endocytic process.
Endocytosis in the bipolar cell terminal compared with endocytosis in other cells
FM1-43 has been used to measure endocytosis at the neuromuscular junction (Wu & Betz, 1996) and in hippocampal neurons (Ryan et al. 1996). In both synapses, membrane recycling with a rate constant of about 0.05 s−1 has been observed, which is similar to the rate of slow endocytosis that we observe in bipolar cells. Recently, Klingauf et al. (1998) have provided evidence that there is also a rapid form of endocytosis in hippocampal neurons, with a rate constant of 0.2-0.5 s−1. Wu & Betz (1996) found that the relatively slow form of endocytosis at the neuromuscular junction was inhibited by intense stimulation, although this effect was not related to rises in cytoplasmic [Ca2+]. In contrast, Ryan et al. (1996) did not observe any effect of stimulus intensity on the slow form of endocytosis in hippocampal synapses. Our results do not allow us to assess whether the slow form of endocytosis in the bipolar cell terminal is modulated during prolonged stimulation. Fast endocytosis was, however, inhibited during maintained depolarization (Fig. 7). In contrast, the results of Klingauf et al. (1998) suggest that rapid endocytosis in hippocampal neurons is accelerated by increasing the strength of the stimulus.
Recent experiments indicate that there are also two mechanisms of endocytosis in chromaffin cells that secrete catecholamines from large granules (Smith & Neher, 1997; Engisch & Nowycky, 1998). ‘Compensatory’ endocytosis occurs with rate constants of 0.05-0.2 s−1, and is accelerated by increasing the strength of stimulation. This mechanism brings the membrane surface area back to pre-stimulus levels. In contrast, ‘excess’ retrieval has two rate constants, of about 0.2 and 1 s−1, and brings the membrane surface area below the pre-stimulus level (Smith & Neher, 1997; Engisch & Nowycky, 1998). This more rapid form of endocytosis was first reported in pituitary cells (Thomas et al. 1994), which also secrete the contents of large granules. There are two important differences between the rapid forms of endocytosis in chromaffin cells and bipolar cells. First, rapid endocytosis in bipolar cells brings the membrane area back to pre-stimulus levels and does not retrieve excess membrane. Second, rapid endocytosis in bipolar cells is inhibited by prolonged stimulation, while excess retrieval in chromaffin cells appears to require a threshold stimulus (Smith & Neher, 1997). Indeed, Artalejo et al. (1996) suggest that excess retrieval in chromaffin cells is stimulated by Ca2+ acting through calmodulin. These observations suggest that there may be important differences in the mechanisms of endocytosis operating on small vesicles at the synapse and large granules in neuroendocrine cells.
Acknowledgments
We thank Professor Alan Fersht and Andreas Ladurner for their assistance with stopped-flow measurements. G. N. is a student of the Gulbenkian PhD Program in Biology and Medicine and is supported by a grant from Fundaçáo para a Ciencia e Tecnologia.
References
- Artalejo CR, Elhamdani A, Palfrey HC. Calmodulin is the divalent cation receptor for rapid endocytosis, but not exocytosis, in adrenal chromaffin cells. Neuron. 1996;16:195–205. doi: 10.1016/s0896-6273(00)80036-7. 10.1016/S0896-6273(00)80036-7. [DOI] [PubMed] [Google Scholar]
- Ashmore JF, Falk G. Responses of rod bipolar cells in the dark-adapted retina of the dogfish, Schyliorhinus canicula. The Journal of Physiology. 1980;300:115–150. doi: 10.1113/jphysiol.1980.sp013155. [DOI] [PMC free article] [PubMed] [Google Scholar]
- Barrett EF, Stevens CF. The kinetics of transmitter release at the frog neuromuscular junction. The Journal of Physiology. 1972;227:691–708. doi: 10.1113/jphysiol.1972.sp010054. [DOI] [PMC free article] [PubMed] [Google Scholar]
- Betz WJ, Mao F, Smith CB. Imaging exocytosis and endocytosis. Current Opinion in Neurobiology. 1996;6:365–371. doi: 10.1016/s0959-4388(96)80121-8. [DOI] [PubMed] [Google Scholar]
- Borges S, Gleason E, Turelli M, Wilson M. The kinetics of quantal transmitter release from retinal amacrine cells. Proceedings of the National Academy of Sciences of the USA. 1995;92:6896–6900. doi: 10.1073/pnas.92.15.6896. [DOI] [PMC free article] [PubMed] [Google Scholar]
- Burrone J, Lagnado L. Electrical resonance and Ca2+ influx in the synaptic terminal of depolarizing bipolar cells from the goldfish retina. The Journal of Physiology. 1997;505:571–584. doi: 10.1111/j.1469-7793.1997.571ba.x. [DOI] [PMC free article] [PubMed] [Google Scholar]
- Ceccarelli B, Hurlbut WP, Mauro A. Turnover of transmitter and synaptic vesicles at the frog neuromuscular junction. Journal of Cell Biology. 1973;57:499–524. doi: 10.1083/jcb.57.2.499. [DOI] [PMC free article] [PubMed] [Google Scholar]
- Cohen LB, Salzberg BM, Davila HV, Ross WN, Landowne D, Waggoner AS, Wang CH. Changes in axon fluorescence during activity: molecular probes of membrane potential. Journal of Membrane Biology. 1974;19:1–36. doi: 10.1007/BF01869968. [DOI] [PubMed] [Google Scholar]
- Cremona O, de Camilli P. Synaptic vesicle endocytosis. Current Opinion in Neurobiology. 1997;7:323–330. doi: 10.1016/s0959-4388(97)80059-1. [DOI] [PubMed] [Google Scholar]
- Delaney KR, Tank DW. A quantitative measurement of the dependence of short-term synaptic enhancement on presynaptic residual calcium. Journal of Neuroscience. 1994;14:5885–5902. doi: 10.1523/JNEUROSCI.14-10-05885.1994. [DOI] [PMC free article] [PubMed] [Google Scholar]
- Ellis-Davies GCR, Kaplan JH. Nitrophenyl-EGTA, a photolabile chelator that selectively binds Ca2+ with high affinity and releases it rapidly upon photolysis. Proceedings of the National Academy of Sciences of the USA. 1994;91:187–191. doi: 10.1073/pnas.91.1.187. [DOI] [PMC free article] [PubMed] [Google Scholar]
- Engisch KL, Nowycky MC. Compensatory and excess retrieval: two types of endocytosis following single step depolarizations in bovine adrenal chromaffin cells. The Journal of Physiology. 1998;506:591–608. doi: 10.1111/j.1469-7793.1998.591bv.x. [DOI] [PMC free article] [PubMed] [Google Scholar]
- Fesce R, Grohovaz F, Valtorta F, Meldolesi J. Neurotransmitter release: fusion or ‘kiss-and-run’? Trends in Cell Biology. 1994;4:1–4. doi: 10.1016/0962-8924(94)90025-6. 10.1016/0962-8924(94)90025-6. [DOI] [PubMed] [Google Scholar]
- Gillis KD. Techniques for membrane capacitance measurements. In: Sakmann B, Neher E, editors. Single Channel Recording. New York: Plenum Press; 1995. pp. 155–198. [Google Scholar]
- Goda Y, Stevens CF. Two components of transmitter release at a central synapse. Proceedings of the National Academy of Sciences of the USA. 1994;91:12942–12946. doi: 10.1073/pnas.91.26.12942. [DOI] [PMC free article] [PubMed] [Google Scholar]
- Heidelberger R, Heinemann C, Neher E, Matthews G. Calcium dependence of the rate of exocytosis in a synaptic terminal. Nature. 1994;371:513–515. doi: 10.1038/371513a0. 10.1038/371513a0. [DOI] [PubMed] [Google Scholar]
- Heidelberger R, Matthews G. Calcium influx and calcium current in single synaptic terminals of goldfish retinal bipolar neurons. The Journal of Physiology. 1992;447:235–256. doi: 10.1113/jphysiol.1992.sp019000. [DOI] [PMC free article] [PubMed] [Google Scholar]
- Herrington J, Bookman RJ. Pulse Control: IGOR XOPs for Patch Clamp Data Acquisition and Capacitance Measurements. Miami, FL, USA: University of Miami; 1994. [Google Scholar]
- Heuser JE, Reese TS. Evidence for recycling of synaptic vesicle membrane during transmitter release at the frog neuromuscular junction. Journal of Cell Biology. 1973;57:315–344. doi: 10.1083/jcb.57.2.315. 10.1083/jcb.57.2.315. [DOI] [PMC free article] [PubMed] [Google Scholar]
- Hubel DH. Eye, Brain and Vision. New York: Scientific American Library; 1995. [Google Scholar]
- Klingauf J, Kavalali ET, Tsien RW. Kinetics and regulation of fast endocytosis at hippocampal synapses. Nature. 1998;394:581–585. doi: 10.1038/29079. 10.1038/29079. [DOI] [PubMed] [Google Scholar]
- Kobayashi K, Tachibana M. Ca2+ regulation in the presynaptic terminals of goldfish retinal bipolar cells. The Journal of Physiology. 1995;483:79–94. doi: 10.1113/jphysiol.1995.sp020569. [DOI] [PMC free article] [PubMed] [Google Scholar]
- Koenig JH, Ikeda K. Synaptic vesicles have two distinct recycling pathways. Journal of Cell Biology. 1996;135:797–808. doi: 10.1083/jcb.135.3.797. 10.1083/jcb.135.3.797. [DOI] [PMC free article] [PubMed] [Google Scholar]
- Konishi M, Hollingworth S, Harkins AB, Baylor SM. Myoplasmic calcium transients in intact frog skeletal muscle fibers monitored with the fluorescent indicator furaptra. Journal of General Physiology. 1991;97:271–301. doi: 10.1085/jgp.97.2.271. 10.1085/jgp.97.2.271. [DOI] [PMC free article] [PubMed] [Google Scholar]
- Korn SJ, Marty A, Connor JA, Horn R. Perforated patch recording. Methods in Neuroscience. 1991;4:264–373. [Google Scholar]
- Lagnado L, Gomis A, Job C. Continuous vesicle cycling in the synaptic terminal of retinal bipolar cells. Neuron. 1996;17:957–967. doi: 10.1016/s0896-6273(00)80226-3. 10.1016/S0896-6273(00)80226-3. [DOI] [PubMed] [Google Scholar]
- Mennerick S, Matthews G. Ultrafast transmitter release elicited by calcium current in synaptic terminals of retinal bipolar neurons. Neuron. 1996;17:1241–1249. doi: 10.1016/s0896-6273(00)80254-8. 10.1016/S0896-6273(00)80254-8. [DOI] [PubMed] [Google Scholar]
- Mennerick S, Zenisek D, Matthews G. Static and dynamic properties of large terminal bipolar cells from goldfish retina: experimental test of a compartment model. Journal of Neurophysiology. 1997;78:51–62. doi: 10.1152/jn.1997.78.1.51. [DOI] [PubMed] [Google Scholar]
- Neher E, Augustine GJ. Calcium gradients and buffers in bovine chromaffin cells. The Journal of Physiology. 1992;450:273–301. doi: 10.1113/jphysiol.1992.sp019127. [DOI] [PMC free article] [PubMed] [Google Scholar]
- Neher E, Marty A. Discrete changes of cell membrane capacity observed under conditions of enhanced secretion in bovine adrenal chromaffin cells. Proceedings of the National Academy of Sciences of the USA. 1982;79:6712–6716. doi: 10.1073/pnas.79.21.6712. [DOI] [PMC free article] [PubMed] [Google Scholar]
- Neher E, Zucker RS. Multiple calcium-dependent processes related to secretion in bovine chromaffin cells. Neuron. 1993;10:21–30. doi: 10.1016/0896-6273(93)90238-m. 10.1016/0896-6273(93)90238-M. [DOI] [PubMed] [Google Scholar]
- Okada T, Horiguchi H, Tachibana M. Ca2+-dependent Cl− current at the presynaptic terminals of goldfish retinal bipolar cells. Neuroscience Research. 1995;23:297–303. doi: 10.1016/0168-0102(95)00955-8. 10.1016/0168-0102(95)00955-8. [DOI] [PubMed] [Google Scholar]
- Parsons TD, Lenzi D, Almers W, Roberts WM. Calcium-triggered exocytosis and endocytosis in an isolated presynaptic cell: Capacitance measurements in saccular hair cells. Neuron. 1994;13:875–883. doi: 10.1016/0896-6273(94)90253-4. 10.1016/0896-6273(94)90253-4. [DOI] [PubMed] [Google Scholar]
- Raju B, Murphy E, Levy LA, Hall RD, London RE. A fluorescent indicator for measuring cytosolic free magnesium. American Journal of Physiology. 1989;256:C540–548. doi: 10.1152/ajpcell.1989.256.3.C540. [DOI] [PubMed] [Google Scholar]
- Regehr WG, Atluri PP. Calcium transients in cerebellar granule cell presynaptic terminals. Biophysical Journal. 1995;68:2156–2170. doi: 10.1016/S0006-3495(95)80398-X. [DOI] [PMC free article] [PubMed] [Google Scholar]
- Roberts WM, Jacobs RA, Hudspeth AJ. Colocalization of ion channels involved in frequency selectivity and synaptic transmission at presynaptic active zones of hair cells. Journal of Neuroscience. 1990;10:33664–33684. doi: 10.1523/JNEUROSCI.10-11-03664.1990. [DOI] [PMC free article] [PubMed] [Google Scholar]
- Ryan TA, Smith SJ, Reuter H. The timing of synaptic vesicle endocytosis. Proceedings of the National Academy of Sciences of the USA. 1996;93:5567–5571. doi: 10.1073/pnas.93.11.5567. 10.1073/pnas.93.11.5567. [DOI] [PMC free article] [PubMed] [Google Scholar]
- Saito T, Kujiraoka T. Physiological and morphological identification of two types of ON-center bipolar cells in the carp retina. Journal of Comparative Neurology. 1982;205:161–170. doi: 10.1002/cne.902050207. [DOI] [PubMed] [Google Scholar]
- Sakaba T, Tachibana M, Matsui K, Minami N. Two components of transmitter release in retinal bipolar cells: exocytosis and mobilization of synaptic vesicles. Neuroscience Research. 1997;27:357–370. doi: 10.1016/s0168-0102(97)01168-1. 10.1016/S0168-0102(97)01168-1. [DOI] [PubMed] [Google Scholar]
- Smith CB, Betz WJ. Simultaneous independent measurement of exocytosis and endocytosis. Nature. 1996;380:531–534. doi: 10.1038/380531a0. 10.1038/380531a0. [DOI] [PubMed] [Google Scholar]
- Smith C, Neher E. Multiple forms of endocytosis in bovine adrenal chromaffin cells. Journal of Cell Biology. 1997;139:885–894. doi: 10.1083/jcb.139.4.885. 10.1083/jcb.139.4.885. [DOI] [PMC free article] [PubMed] [Google Scholar]
- Solsona C, Innocenti B, Fernandez JM. Regulation of exocytic fusion by cell inflation. Biophysical Journal. 1998;74:1061–1073. doi: 10.1016/S0006-3495(98)74030-5. [DOI] [PMC free article] [PubMed] [Google Scholar]
- Thomas P, Lee AK, Wong JG, Almers W. A triggered mechanism retrieves membrane in seconds after Ca2+-stimulated exocytosis in single pituitary cells. Journal of Cell Biology. 1994;124:667–675. doi: 10.1083/jcb.124.5.667. 10.1083/jcb.124.5.667. [DOI] [PMC free article] [PubMed] [Google Scholar]
- van Gersdorff H, Matthews G. Dynamics of synaptic vesicle fusion and membrane retrieval in synaptic terminals. Nature. 1994a;367:735–739. doi: 10.1038/367735a0. 10.1038/367735a0. [DOI] [PubMed] [Google Scholar]
- van Gersdorff H, Matthews G. Inhibition of endocytosis by elevated internal calcium in a synaptic terminal. Nature. 1994b;370:652–655. doi: 10.1038/370652a0. 10.1038/370652a0. [DOI] [PubMed] [Google Scholar]
- van Gersdorff H, Vardi E, Matthews G, Sterling P. Evidence that vesicles on the synaptic ribbon of retinal bipolar neurons can be rapidly released. Neuron. 1996;16:1221–1227. doi: 10.1016/s0896-6273(00)80148-8. 10.1016/S0896-6273(00)80148-8. [DOI] [PubMed] [Google Scholar]
- Wu LG, Betz WJ. Nerve activity but not intracellular calcium determines the time course of endocytosis at the frog neuromuscular junction. Neuron. 1996;17:769–779. doi: 10.1016/s0896-6273(00)80208-1. 10.1016/S0896-6273(00)80208-1. [DOI] [PubMed] [Google Scholar]
- Zucker RS. Exocytosis: a molecular and physiological perspective. Neuron. 1996;17:1049–1055. doi: 10.1016/s0896-6273(00)80238-x. 10.1016/S0896-6273(00)80238-X. [DOI] [PubMed] [Google Scholar]