

Abstract
Voltage-gated Na+ channels undergo two types of inactivation in response to depolarization. One type, fast inactivation, occurs with a time scale of milliseconds. The other, slow inactivation, occurs over seconds to minutes. In addition, these two processes appear to be distinct at the molecular level. However, the molecular mechanism of Na+ channel slow inactivation is unknown.
We used patch clamp techniques to study slow inactivation, activation and fast inactivation in α-subunit cDNA clones for wild-type human heart Na+ channels (hH1) and rat skeletal muscle Na+ channels (μ1) transiently expressed in human embryonic kidney (HEK) cells. Our experiments showed that the Na+ channel slow inactivation phenotype (development, steady state and recovery) differed dramatically between hH1 and μ1. Slow inactivation in μ1 had a faster onset, a steeper voltage dependence, and was more complete compared with hH1. In addition, recovery from slow inactivation was much slower for μ1 than for hH1. Activation and fast inactivation kinetics were also different in hH1 and μ1. In hH1, fast inactivation was slower and V½ values of activation and steady-state fast inactivation (h∞) were more negative than in μ1.
To better understand the molecular basis of Na+ channel slow inactivation, Na+ channel chimaeras were constructed with domains from hH1 and μ1. The slow inactivation phenotype in the chimaeras (domains denoted by subscripts) μ1(1)hH1(2,3,4), μ1(1,2)hH1(3,4) and μ1(1,2,3)hH1(4) was intermediate compared with that of wild-type. However, the chimaera μ1(1)hH1(2,3,4) was more like wild-type hH1, while the chimaeras μ1(1,2)hH1(3,4) and μ1(1,2,3)hH1(4) were more similar to wild-type μ1. In the chimaeras, activation resembled that of μ1, fast inactivation resembled that of hH1, and steady-state fast inactivation fell between that of hH1 and μ1.
The data demonstrate that all four domains can modulate the Na+ channel slow inactivation phenotype. However, domains D1 and D2 may play a more prominent role in determining Na+ channel slow inactivation phenotype than D3 and D4. The results also support previous conclusions that D3 and D4 (and the D3–D4 linker) play an important role in Na+ channel fast inactivation, and that activation may require non-equivalent contributions from all four domains.
Voltage-gated Na+ channels are found in excitable tissues (e.g. brain, heart and muscle). In response to membrane depolarization, Na+ channels open rapidly, then close and enter an inactivated state from which they rarely open. Inactivation of Na+ channels is important in terms of active and passive membrane properties in excitable tissues. Two types of Na+ channel inactivation have been identified: fast and slow. Fast inactivation occurs within milliseconds of membrane depolarization and plays an important role in the termination of action potentials (Hille, 1992). In contrast, slow inactivation occurs over a time scale of seconds to minutes (Rudy, 1978). Slow inactivation is thought to be an important factor in membrane excitability and firing properties (Ruff et al. 1988; Sawczuk et al. 1995). When the membrane is repolarized, Na+ channels recover from the inactivated state to the closed or resting state (i.e. available for activation). Recovery from the fast-inactivated state occurs within milliseconds, while recovery from slow inactivation takes seconds to minutes (Rudy, 1978; Hille, 1992).
Fast and slow inactivation are structurally distinct processes. Fast inactivation can be eliminated by internal perfusion with protease (Rudy, 1978), or by amino acid substitutions in the D3-D4 linker (Featherstone et al. 1996). However, neither of these treatments eliminates slow inactivation (Rudy, 1978; Featherstone et al. 1996). These results suggest that slow and fast inactivation are dependent on different molecular entities.
In addition to the normal physiological role of Na+ channel inactivation, disruption or alteration of inactivation has been implicated in several inheritable diseases. For example, a mutation that alters slow inactivation in the human skeletal muscle Na+ channel results in hyperkalaemic periodic paralysis (Cummins & Sigworth, 1996), and in the human heart, inheritable Na+ channel mutations that alter fast inactivation produce the long QT syndrome (Wang et al. 1996b). Therefore, a better understanding of the molecular basis of Na+ channel inactivation can have important clinical implications.
Na+ channels from several excitable tissues have been cloned and sequenced (Noda et al. 1986; Trimmer et al. 1989; George et al. 1992; Gellens et al. 1992). The protein structure of mammalian Na+ channels consists of a large (230-270 kDa) α-subunit and smaller (37-39 kDa) β-subunits. The Na+ channel α-subunit has four homologous domains (D1-D4), and each domain has six transmembrane segments (S1-S6). The Na+ channel α-subunit can be expressed in mammalian cells such as human embryonic kidney (HEK293t) cells. The kinetics of whole-cell Na+ current observed in these cells are comparable to those of Na+ current in native tissues (Ukomadu et al. 1992).
Experimental manipulation of the primary sequence of cloned Na+ channels has demonstrated that specific regions of the Na+ channel molecule play important roles in distinct kinetic functions. For example, the S4 regions of the four domains are important in voltage sensing and activation (Sigworth, 1994), and the cytoplasmic linker between D3 and D4 is necessary for fast inactivation (Patton et al. 1992). Other studies have provided some insight into the molecular basis of slow inactivation in Na+ channels. In rat skeletal muscle Na+ channels, the mutation N434A (asparagine to alanine in D1, S6) accelerates slow inactivation (Wang & Wang, 1997). Another mutation, M1585V (methionine to valine in D4, S6), increases the rate of recovery from slow inactivation (Hayward et al. 1997). However, our understanding of the molecular basis of Na+ channel slow inactivation is limited.
Recent evidence suggests that slow inactivation differs among Na+ channel isoforms. For example, slow inactivation in rat brain Na+ channels (Fleidervish et al. 1996; Toib et al. 1998) appears to be similar to slow inactivation in rat skeletal muscle Na+ channels (μ1) (Wang & Wang, 1997; Hayward et al. 1997), while slow inactivation in a human heart Na+ channel (hH1a) is slower and less complete than in either brain or muscle Na+ channels (Townsend & Horn, 1997; Richmond et al. 1998). To better understand the molecular basis of the differences in Na+ channel slow inactivation, we directly compared the slow inactivation phenotypes of the wild-type human heart Na+ channel (hH1), the wild-type rat skeletal muscle Na+ channel (μ1) and Na+ channel chimaeras constructed with domains from hH1 and μ1: μ1(1)hH1(2,3,4), μ1(1,2)hH1(3,4) and μ1(1,2,3)hH1(4) (domains denoted by subscripts). cDNA clones for wild-type and chimaeric Na+ channels were transfected into HEK cells and whole-cell patch clamp techniques (Hamill et al. 1981) were used to study slow inactivation of the expressed Na+ channels. We tested the hypothesis that one or more domains of the Na+ channel determined the physiological phenotype of slow inactivation, i.e. the slow inactivation phenotype in the chimaeras would resemble the phenotype of the origin (hH1 or μ1) of a particular domain or domains. To further understand and compare the role of different domains in gating kinetics, we also studied activation and fast inactivation in wild-type and chimaeric Na+ channels. The results demonstrate that slow inactivation, as well as activation and fast inactivation, can be modulated by all four domains of the Na+ channel. Some of these data have been presented previously in abstract form (O'Reilly et al. 1998).
METHODS
Construction of chimaeras and transient transfection of cDNA clones
The Na+ channel chimaeras were constructed as previously described (Frohnwieser et al. 1997; Wright et al. 1999). The sites of ligation (sequence numbers based on hH1 sequence from Gellens et al. 1992) for the chimaeras (domains denoted by subscripts) were 417 (μ1(1)hH1(2,3,4)), 940 (μ1(1,2)hH1(3,4)) and 1472 (μ1(1,2,3)hH1(4)). We also attempted to study the reverse chimaeras, i.e. hH1(1)μ1(2,3,4), hH1(1,2)μ1(3,4) and hH1(1,2,3)μ1(4). However, these chimaeras expressed little to no Na+ current. All chimaeras were confirmed with restriction mapping and sequencing. The cDNA clones of wild-type hH1, wild-type μ1 and Na+ channel chimaeras were transiently expressed in HEK293t cells. The cells were maintained in a standard medium consisting of Dulbecco's modified Eagle's medium (Gibco Labs, Grand Island, NY, USA) supplemented with 1 % taurine, 1 % penicillin-streptomycin, and 10 % heat-inactivated fetal bovine serum (HyClone Labs, Logan, UT, USA). Transient transfection (Cannon & Strittmatter, 1993) was performed as follows: 1 μg of CD8 (cell surface antigen) and 5-10 μg of Na+ channel cDNA subcloned in the pcDNA1/amp vector (Invitrogen, San Diego, CA, USA) were added to a tube with 315 μl H2O. A 45 μl volume of 250 mM CaCl2 was added to the tube, and the contents were transferred to another tube containing 365 μl of Hanks' balanced salt solution (× 2) (mM: 274 NaCl, 40 Hepes, 12 dextrose, 10 KCl, 1.4 Na2HPO4; pH 7.05). The mixture was incubated at 22°C for 30 min. The DNA solution was then added to a 30-50 % confluent cell culture in a Ti-25 flask containing 7 ml of standard medium. The transfected cells were plated 15 h later onto 35 mm culture dishes containing 2 ml of fresh standard medium. Cells were used 1-3 days after plating. Cells that expressed CD8 antigen were selected for recording. Expression of CD8 was visualized by means of immunobeads (Dynabeads M-450 CD8; Dynal A.S., Oslo, Norway) coated with monoclonal antibody (ITI-5C2) specific for CD8 antigen.
Na+ current recordings
Whole-cell Na+ current (typically 1-10 nA) was recorded from transiently transfected HEK cells with patch clamp techniques (Hamill et al. 1981). The Na+ current stabilized within 5-15 min after rupture of the membrane, and recordings were obtained after this time. Activation and fast inactivation were recorded 15-20 min after whole-cell access was established. Micropipettes (Drummond Scientific, Broomall, PA, USA) were pulled on a Flaming-Brown puller (Model P-87; Sutter Instruments, Novato, CA, USA). The pipettes were fire polished and had resistances of 0.5-1.5 MΩ. Series resistance was compensated at 80-95 %, resulting in voltage errors of < 5 mV. The liquid junction potential was not corrected. Any endogenous K+ currents were blocked with Cs+ in the pipette, and HEK cells expressed no native Ca2+ current (Ukomadu et al. 1992). The typical extracellular recording solution was (mM): 150 choline chloride, 2 CaCl2, 10 Hepes; titrated to pH 7.4 with TMA-OH. The pipette intracellular solution was (mM): 100 NaF, 30 NaCl, 10 EGTA, 10 Hepes; titrated to pH 7.2 with CsOH. These solutions create an outward Na+ gradient and current, further reducing potential problems associated with series resistance errors (Cota & Armstrong, 1989). To obtain conductance-voltage curves, recordings were made with a Na+ gradient ([Na+]o/[Na+]i) of 65 mM/130 mM. Whole-cell recordings were maintained for up to 2 h in this preparation with little or no run-down of the Na+ current.
Electrophysiology protocols
Activation and fast inactivation
The holding potential (Vhold) for all experiments was -140 mV. A test pulse to +30 mV (8 ms) was used to record peak Na+ current (INa). Activation curves were obtained from the peak current recorded with test pulses from Vhold to voltages over the range -90 to +30 mV in 5 mV increments. V½ (mid-point) of the curve and slope factor k were obtained from a fit of the mean data with a Boltzmann function:
where conductance (G) = INa/(V - Vrev). The reversal potential (Vrev) was experimentally determined for each cell. Macroscopic fast inactivation was determined with a fit of the current decay from the test pulse (to +30 mV). Current decay in hH1 and the chimaeras was fitted with a double exponential function:
where Imax is the peak current, x is time and A1 and A2 are the components for the time constants τ1 and τ2, respectively. Current decay in μ1 was fitted with a single exponential:
where the variables are the same as above. Steady-state fast inactivation (h∞) was determined with a test pulse to +30 mV to record INa following a prepulse (300 ms) from -140 mV (or -160 mV) to 0 mV in 10 mV increments. V½ and k were obtained from a fit of the mean data obtained with a Boltzmann function:
Slow inactivation
To induce slow inactivation, the voltage was stepped to 0 mV. Preliminary experiments verified that there was no significant increase in slow inactivation development with larger voltage steps (up to +30 mV). During protocols for slow inactivation, cells were held at Vhold (-140 mV) for > 2 min between pulses. In addition, INa was checked between pulses to ensure recovery to initial INa and to check for possible time-dependent cumulative effects. Preliminary experiments verified that non-sequential time or voltage steps produced results identical to those obtained with sequential steps. Three protocols were used to determine the slow inactivation phenotype in hH1, μ1 and the chimaeras. (1) To measure the development of slow inactivation, the voltage was stepped (from Vhold = -140 mV) to 0 mV for various times (8 ms to 300 s), then to -140 mV for 50 ms to allow recovery from fast inactivation, and then to +30 mV (8 ms) to record INa. Preliminary experiments verified that wild-type and chimaeric Na+ channels recovered from fast inactivation induced with an 8 ms pulse to +30 mV by ∼30 ms. INa was normalized to the initial value recorded before the start of the protocol. The data were fitted with a double exponential function:
where I0 is the non-inactivating component, and Imax, x, A1, A2, τ1 and τ2 are the same as above. (2) The voltage dependence of steady-state slow inactivation (s∞) was determined with the following protocol: a prepulse (120 s) in 20 mV increments from -140 mV (or -160 mV) to 0 mV, a 50 ms step to -140 mV, then a test pulse to +30 mV to record INa. INa was normalized to the initial value recorded before the start of the protocol. The prepulse duration (120 s) for s∞ was based on the slow inactivation development curve for hH1, i.e. a relatively steady-state level of slow inactivation was reached by this time in hH1. For consistency, 120 s was used to determine s∞ for all Na+ channels. The data from steady-state slow inactivation were fitted with a Boltzmann function:
where V½ and k have the same meanings as above, and I1 and I2 are the maximum and minimum values in the fit, respectively. (3) To assess recovery from slow inactivation, the voltage was stepped to 0 mV for 120 s, then to -140 mV for various times (50 ms to 300 s), with a subsequent test pulse to +30 mV to record INa. INa was normalized to the value recorded after 300 s at Vhold (-140 mV). Preliminary experiments confirmed that recovery from slow inactivation was essentially identical at a more negative voltage (i.e. -160 mV). The data were fitted with a double exponential function:
where Imax, I0, x, A1, A2, τ1 and τ2 are the same as above.
Data were collected with an Axopatch 200A amplifier (filtered at 5 kHz) and pCLAMP software (Axon Instruments). Curve fits and data analysis were performed with pCLAMP and Origin software (MICROCAL Software, Inc., Northampton, MA, USA). Differences were considered significant at P < 0.05 (ANOVA). Grouped data are presented as means ±s.e.m.
RESULTS
Activation, fast inactivation and steady-state fast inactivation
Our initial studies characterized activation and fast inactivation kinetics in wild-type and chimaeric Na+ channels (Fig. 1). Data from these experiments are shown in Table 1. The results show that the values for V½ of activation for the chimaeras more closely resembled that for μ1 than that for hH1. The slope factor k for activation was similar for hH1 and μ1, but was greater for the chimaeras (i.e. the curve was less steep). The V½ of steady-state fast inactivation (h∞) was more negative for hH1 than for μ1. For the chimaeras, V½ of h∞ fell between the values obtained for hH1 and μ1. Macroscopic current decay was best fitted with a double exponential for hH1 and the chimaeras and with a single exponential for μ1. The time constants τ1 and τ2 of the macroscopic current decay for the chimaeras were similar to τ1 and τ2 for hH1. These results are comparable to previously published data (Chahine et al. 1996; Wang et al. 1996a; Deschenes et al. 1998; Wright et al. 1999).
Figure 1. Wild-type (hH1 and μ1) and chimaeric Na+ channels.
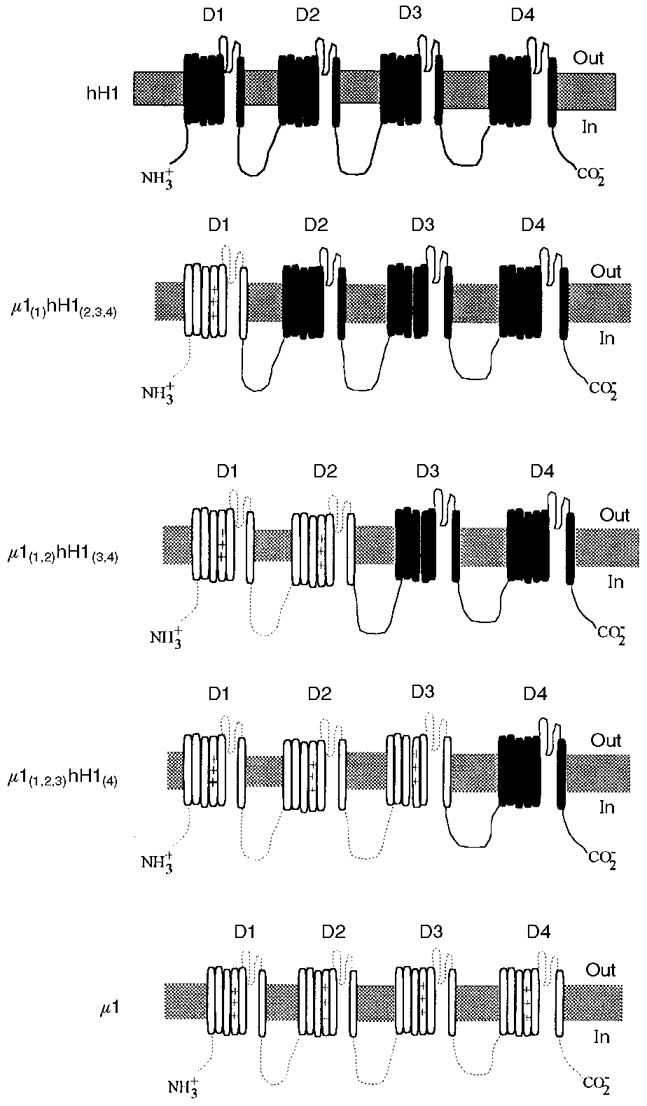
Na+ channel chimaeras were constructed with domains from wild-type hH1 (continuous lines) and wild-type μ1 (dotted lines). The α-subunits consisting of four domains (D1-D4) each with six transmembrane segments are shown.
Table 1.
Kinetic parameters of activation and fast inactivation for hH1, μ1 and hH1-μ1 chimaeras
| Activation | Steady-state fast inactivation (h∞) | Fast inactivation current decay | ||||
|---|---|---|---|---|---|---|
| Channel | V1/2(mV) | Slope (k) | V1/2(mV) | Slope (k) | τ1 (ms) | τ2 (ms) |
| hH1 | −46.0 ± 0.4(6)† | 8.3 ± 0.5(6) | −101.6 ± 2.5(6)† | 5.9 ± 0.5(6) | 0.47 ± 0.02(6)† | 2.6 ± 0.3(6) |
| μ1(1)hH1(2,3,4) | −31.3 ± 0.8(6)* | 10.6 ± 0.4(6)*† | −98.0 ± 0.9(6)† | 5.7 ± 0.2(6) | 0.44 ± 0.02(6)† | 2.4 ± 0.3(6) |
| μ1(1,2)hH1(3,4) | −26.0 ± 1.4(6)*† | 10.8 ± 0.7(6)*† | −90.2 ± 2.1(6)*† | 5.8 ± 0.2(6) | 0.49 ± 0.03(6)† | 2.5 ± 0.8(6) |
| μ1(1,2,3)hH1(4) | −27.7 ± 0.7(6)*† | 11.1 ± 0.3(6)*† | −93.1 ± 0.2(6)*† | 5.4 ± 0.1(6) | 0.44 ± 0.03(6)† | 2.4 ± 0.6(6) |
| μ1 | −32.9 ± 0.9(8)* | 7.4 ± 0.4(8) | −81.5 ± 1.1(8)* | 5.7 ± 0.1(8) | 0.30 ± 0.02(8)* | — |
V1/2 and k for activation and steady-state fast inactivation were obtained from a Boltzmann fit of the mean data. Time constants (τ1 and τ2) were obtained with a double exponential fit for hH1 and the chimaeras. Fast decay in μ1 was fitted with a single exponential. Data are presented as means ± s.e.m. (n), where n is the number of cells.
P < 0.05 vs. hH1
P < 0.05 vs. μ1.
Development of slow inactivation is slower and less complete in hH1 than in μ1
The slow inactivation phenotype was first characterized by examining the time dependence of development of slow inactivation in hH1 and μ1. Cells were held at -140 mV, then stepped to 0 mV for various times (8 ms to 300 s), to -140 mV for 50 ms, and then peak available Na+ current (INa) was recorded with a step to +30 mV for 8 ms (see Fig. 2B, inset). INa recorded with the test pulse was normalized to the value obtained before the protocol was started. Sufficient time (> 120 s) was allowed between episodes for the current to recover to the peak value (see Fig. 6). The mean data for development of slow inactivation were fitted with a double exponential function. The results show that slow inactivation in μ1 (n = 10) developed much faster and to a greater degree than in hH1 (n = 11; Fig. 2). The first time constant (τ1) for μ1 (1.6 ± 0.06 s) was significantly less than τ1 for hH1 (6.9 ± 0.6 s; P < 0.001; Table 2). The second time constant (τ2) for μ1 was not different from that of hH1 (Table 2). The amount of current that ‘slow inactivated’ was significantly greater in μ1 (to ∼63 % of initial INa) after 1 s depolarization to 0 mV than in hH1 (to ∼96 %; P < 0.001; Fig. 2B). With longer depolarization (up to 300 s), slow inactivation in μ1 was always greater than that in hH1 (Fig. 2B). However, neither hH1 (to ∼36 %) nor μ1 (to ∼11 %) showed complete slow inactivation, even after 300 s at 0 mV (Fig. 2B).
Figure 2. Slow inactivation develops faster and more completely in μ1 than in hH1.
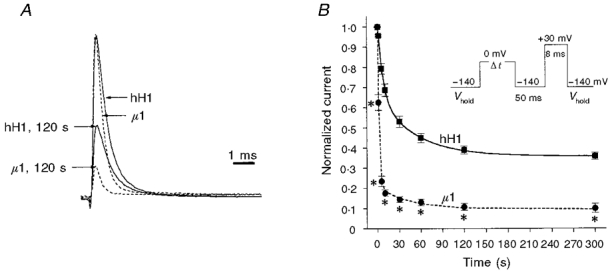
Peak Na+ current was recorded with a test pulse to +30 mV after various times at 0 mV, with an intervening step to -140 mV for 50 ms to allow recovery from fast inactivation (inset in B). Current was normalized to the initial peak value. Cells were held at -140 mV for > 2 min between pulses. A, normalized traces of outward Na+ current from hH1 (continuous lines) and μ1 (dashed lines) recorded at +30 mV from Vhold of -140 mV. Note that μ1 decays faster than hH1. The smaller traces were recorded after slow inactivation was induced with depolarization to 0 mV for 120 s. B, mean ±s.e.m. values for development of slow inactivation in hH1 (▪; n = 11) and μ1 (•; n = 10). The voltage protocol is shown in the inset. The data were fitted with a double exponential function. *P < 0.05vs. hH1.
Figure 6. hH1 recovers from slow inactivation faster than μ1, while recovery in the chimaeras falls between that in hH1 and in μ1.

Cells were depolarized to 0 mV for 120 s, then stepped to -140 mV for various times before the test pulse to +30 mV (inset in A). Current was normalized to peak current recorded after 300 s at -140 mV. Mean ±s.e.m. values were fitted with a double exponential function. A, hH1 (▪; n = 6) recovers from slow inactivation much faster and sooner (by 30 s) than μ1 (by 120 s; •; n = 10). B, recovery in μ1(1)hH1(2,3,4) (□, dashed line; n = 8) was slower but not statistically different from that in hH1 (continuous line). Both hH1 and μ1(1)hH1(2,3,4) recovered by 30 s. C, recovery in the chimaeras μ1(1,2)hH1(3,4) (▵, dotted line; n = 6) and μ1(1,2,3)hH1(4) (○, dashed line; n = 6) is similar to that in μ1 (continuous line), although μ1(1,2)hH1(3,4) recovers sooner (by 60 s) than μ1(1,2,3)hH1(4) or μ1 (by 120 s).
Table 2.
Kinetic parameters of slow inactivation for hH1, μ1 and hH1-μ1 chimaeras
| Development of slow inactivation | Recovery from slow inactivation | Steady-state slow inactivation (δ∞) | ||||
|---|---|---|---|---|---|---|
| Channel | τ1 (s) | τ2 (s) | τ1 (s) | τ2 (s) | V1/2 (mV) | Slope (k) |
| hH1 | 6.9 ± 0.6(11)† | 52.0 ± 5.9(11) | 0.54 ± 0.1(6)† | 12.1 ± 3.0(6)† | −78.3 ± 2.8(6)† | 23.1 ± 2.5(6)† |
| 35%† | 30%† | 48%† | 14% | |||
| μ1(1)hH1(2,3,4) | 6.0 ± 0.7(8)*† | 87.5 ± 8.9(8)*† | 0.52 ± 0.1(8)† | 14.1 ± 2.6(8)† | −60.8 ± 1.4(10)*† | 18.8 ± 1.2(10)*† |
| 60%* | 15% | 50%† | 17% | |||
| μ1(1,2)hH1(3,4) | 1.6 ± 0.1(8)* | 53.8 ± 18.7(8) | 0.72 ± 0.2(6)* | 15.2 ± 7.1(6)† | −62.9 ± 0.6(6)*† | 10.4 ± 0.6(6)* |
| 73%* | 11% | 69%* | 19% | |||
| μ1(1,2,3)hH1(4) | 1.3 ± 0.1(10)* | 65.6 ± 17.0(10) | 0.89 ± 0.1(8)* | 14.5 ± 4.8(8)† | −87.9 ± 0.3(8)*† | 9.5 ± 0.3(8)* |
| 73%* | 16%* | 66%† | 23%*† | |||
| μ1 | 1.6 ± 0.1(10)* | 39.4 ± 10.9(10) | 1.0 ± 0.1(10)* | 34.0 ± 8.3(10)* | −73.1 ± 1.1(8)* | 10.3 ± 0.8(8)* |
| 80%* | 10%* | 72%* | 19% | |||
V1/2 and k for steady-state slow inactivation (s∞) were obtained from a Boltzmann fit of the mean data. Time constants (τ1 and τ2) were obtained with a double exponential fit of the mean data. Data are presented as means ± s.e.m. (n), where n is the number of cells. The percentage values are the percentage component of the curve described by the exponential.
P < 0.05 vs. hH1
P < 0.05 vs. μ1.
Na+ channel chimaeras exhibit an intermediate slow inactivation development phenotype
Development of slow inactivation was studied in the three Na+ channel chimaeras constructed with domains from hH1 and μ1: μ1(1)hH1(2,3,4), μ1(1,2)hH1(3,4) and μ1(1,2,3)hH1(4). All three chimaeras exhibited slow inactivation development phenotypes that were intermediate relative to hH1 and μ1. However, development of slow inactivation in μ1(1)hH1(2,3,4) (n = 8) was more similar to that in hH1 than to that in μ1 (Fig. 3A and B). Although the onset of slow inactivation in the chimaera μ1(1)hH1(2,3,4) appeared similar to that in hH1, τ1 was less in μ1(1)hH1(2,3,4) (6.0 vs. 6.9 s) and τ2 was greater (87.5 vs. 52.0 s) than in hH1 (Table 2). In addition, depolarization to 0 mV for 5 s or more produced significantly more slow inactivation in μ1(1)hH1(2,3,4) (to ∼66 % at 5 s and to ∼26 % at 300 s) than in hH1 (to ∼79 % at 5 s and to ∼36 % at 300 s; P < 0.01; Fig. 3B).
Figure 3. Development of slow inactivation in Na+ channel chimaeras is intermediate relative to that in hH1 and in μ1.
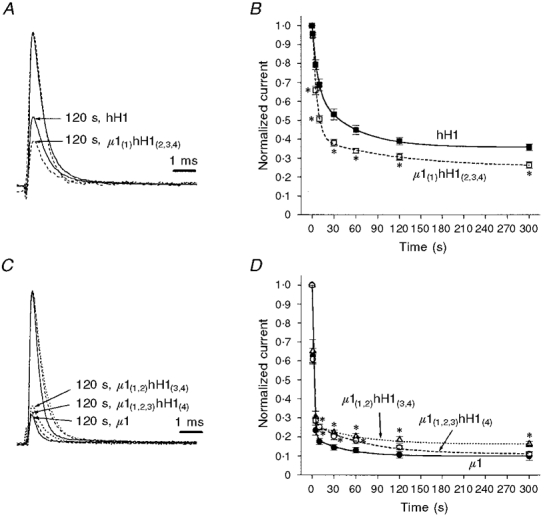
Data were collected as described in Fig. 2. A, development of slow inactivation in μ1(1)hH1(2,3,4) is more similar to that in hH1 than to that in μ1. Normalized representative traces for hH1 (continuous lines) and μ1(1)hH1(2,3,4) (dashed lines) before (larger traces) and after (smaller traces) depolarization to 0 mV for 120 s are shown. B, mean ±s.e.m. values for hH1 (▪, continuous line; n = 11) and μ1(1)hH1(2,3,4) (□, dashed line; n = 8) were fitted with a double exponential function. *P < 0.05vs. hH1. C, normalized traces from μ1 (continuous lines), μ1(1,2)hH1(3,4) (dotted lines), and μ1(1,2,3)hH1(4) (dashed lines) before and after depolarization to 0 mV for 120 s to induce slow inactivation. D, mean ±s.e.m. values for μ1 (•, continuous line; n = 10), μ1(1,2)hH1(3,4) (▵, dotted line; n = 8) and μ1(1,2,3)hH1(4) (○, dashed line; n = 10) were fitted with a double exponential function. *P < 0.05vs.μ1.
The other two chimaeras, μ1(1,2)hH1(3,4) (n = 8) and μ1(1,2,3)hH1(4) (n = 10), expressed a slow inactivation phenotype more similar to that of μ1 than to that of hH1 (Fig. 3C and D). The time constants τ1 and τ2 did not differ significantly among μ1(1,2)hH1(3,4), μ1(1,2,3)hH1(4) and μ1 (Table 2). However, both μ1(1,2)hH1(3,4) (to ∼26 %) and μ1(1,2,3)hH1(4) (to ∼25 %) showed less slow inactivation than μ1 (to ∼18 %; P < 0.01) after 10 s depolarization (Fig. 3D). With longer depolarization (>120 s), slow inactivation was less in μ1(1,2)hH1(3,4) (to ∼16-19 %) than in μ1(1,2,3)hH1(4) or μ1 (to ∼11-14 %; P < 0.05; Fig. 3D).
Steady-state slow inactivation is less voltage dependent in hH1 than in μ1
Steady-state slow inactivation (s∞) was determined with a modification of the h∞ protocol. Cells were held at the prepulse potential for 120 s, stepped to -140 mV for 50 ms to allow recovery from fast inactivation, and then stepped to +30 mV to measure INa (see Fig. 4A, inset). As with the development of slow inactivation, steady-state slow inactivation differed between hH1 (n = 6) and μ1 (n = 8). A Boltzmann fit of the mean data for steady-state inactivation showed that the V½ for hH1 was more negative than that for μ1 (-78.3 vs. -73.1; Fig. 4A and Table 2). In addition, the s∞ curve for μ1 was much steeper than that for hH1 (k = 10.3vs. 23.1; P < 0.001; Fig. 4A and Table 2).
Figure 4. Voltage dependence of steady-state slow inactivation (s∞) differs among wild-type and chimaeric Na+ channels.

Peak available current was obtained with a test pulse to +30 mV after a 120 s prepulse at the voltages shown on the abscissa. An intervening step to -140 mV for 50 ms allowed recovery from fast inactivation. Mean ±s.e.m. values were fitted with a Boltzmann function. A, voltage dependence of steady-state slow inactivation is much less steep for hH1 (▪; n = 6) than for μ1 (•; n = 8). B, the s∞ curve for μ1(1)hH1(2,3,4) (□, dashed line; n = 10) is similar to that for hH1 (continuous line) although the slope is steeper in μ1(1)hH1(2,3,4). C, the s∞ curves for μ1(1,2)hH1(3,4) (▵, dotted line; n = 6) and μ1(1,2,3)hH1(4) (○, dashed line; n = 8) are similar to that for μ1 (continuous line), although V½ is more positive in μ1(1,2)hH1(3,4) and more negative in μ1(1,2,3)hH1(4) than in μ1.
Steady-state slow inactivation in Na+ channel chimaeras is different from that in hH1 and μ1
s∞ in the chimaera μ1(1)hH1(2,3,4) (n = 10) was more similar to that in hH1 than μ1 (Fig. 4B). However, V½ of the s∞ curve was significantly more positive for μ1(1)hH1(2,3,4) than for hH1 (Table 2). In addition, the slope of the s∞ curve was steeper for μ1(1)hH1(2,3,4) than for hH1 (Table 2 and Fig. 4B).
The s∞ curves for the chimaeras μ1(1,2)hH1(3,4) and μ1(1,2,3)hH1(4) were more like that for μ1 than that for hH1. However, V½ of the s∞ curves for the chimaeras was shifted compared with μ1 (Fig. 4C). The s∞ curve for μ1(1,2)hH1(3,4) (n = 6) was shifted > 10 mV in a positive direction relative to that for μ1 (P < 0.05), while the s∞ curve for μ1(1,2,3)hH1(4) (n = 8) was shifted > 10 mV in a negative direction relative to that for μ1 (Table 2). The slopes of the s∞ curves were not different for μ1, μ1(1,2)hH1(3,4) and μ1(1,2,3)hH1(4) (Table 2).
Steady-state slow inactivation shows little time-dependent shift
A well-known feature of steady-state fast inactivation is the time-dependent shift of V½ in the negative direction (Wang et al. 1996a). This shift is not readily apparent in steady-state slow inactivation. For example, during 45 min of whole-cell recording from one cell expressing μ1, the h∞ curve showed a shift in V½ of ∼-15 mV (Fig. 5A). In contrast, the V½ of s∞ shifted < -3 mV in the same cell. The mean shift in s∞ between 15 and 60 min of whole-cell recording for five cells expressing μ1 was -2.7 ± 1.0 mV (Fig. 5B). In three cells expressing hH1, the shift was -1.4 ± 1.3 mV (Fig. 5C). Similar negligible shifts in s∞ over time (i.e. < -3 mV h−1) were seen in the chimaeras (data not shown).
Figure 5. Steady-state slow inactivation (s∞) changes little with time.
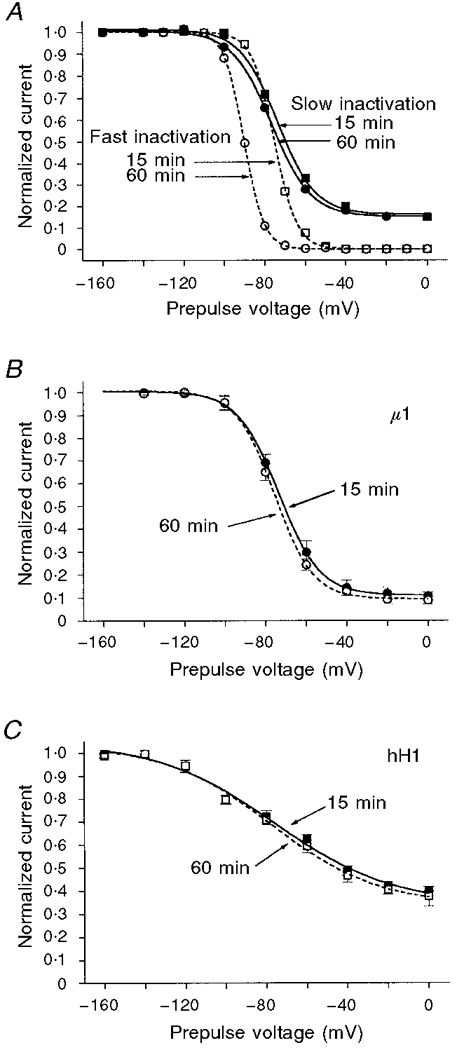
Slow inactivation data were obtained as described in Fig. 4. Steady-state fast inactivation (h∞) curves were obtained with a 300 ms prepulse to the voltage on the abscissa, then a test pulse to +30 mV. A, curves (s∞ and h∞) from one cell expressing μ1. The s∞ curve (continuous lines) changes little (ΔV½ < -3 mV) between 15 min (▪) and 60 min (•) of whole-cell recording, while V½ of the h∞ curve shifts by ≈-15 mV between 15 min (□) and 60 min (○). B, mean ±s.e.m. values of s∞ for five cells expressing μ1were fitted with a Boltzmann equation; curves shown are at 15 min (•) and 60 min (○) of whole-cell recording. C, mean ±s.e.m. values of s∞ for three cells expressing hH1 were fitted with a Boltzmann equation; curves are at 15 min (▪) and 60 min (□) of whole-cell recording.
Recovery from slow inactivation is faster in hH1 than in μ1
Na+ channels recover from the slow-inactivated state when the membrane is repolarized. Mean data for recovery from slow inactivation were fitted with a double exponential function. Following depolarization to 0 mV for 120 s to induce slow inactivation (Fig. 6A, inset), INa in hH1 (n = 6) at -140 mV recovered faster than that in μ1 (n = 10; Fig. 6A). The time constants of recovery from slow inactivation were significantly less for hH1 than for μ1 (Table 2). Also, recovery from slow inactivation (P > 0.05 compared with INa at 300 s) occurred much sooner in hH1 (by 30 s) than in μ1 (by 120 s; Fig. 6A).
Recovery from slow inactivation is intermediate in Na+ channel chimaeras
Recovery from slow inactivation appeared to be slower in the chimaera μ1(1)hH1(2,3,4) (n = 8) than in hH1 (Fig. 6B). However, the recovery time constants for μ1(1)hH1(2,3,4) and hH1 were not statistically different (Table 2). Recovery was complete for both hH1 and μ1(1)hH1(2,3,4) by 30 s at the holding potential of -140 mV following induction of slow inactivation (i.e. 120 s at 0 mV).
The recovery time constant τ1 was similar for μ1(1,2)hH1(3,4) (n = 6), μ1(1,2,3)hH1(4) (n = 8), and μ1 (Table 2). However, τ2 for μ1 was greater than τ2 for the chimaeras (Table 2). The chimaera μ1(1,2)hH1(3,4) recovered sooner (by 60 s) than either μ1(1,2,3)hH1(4) or μ1 (by 120 s; Fig. 6C). However, all wild-type and chimaeric Na+ channels recovered from slow inactivation (0 mV, 120 s) by 120 s at the holding potential of -140 mV (Fig. 6).
DISCUSSION
This study compared slow inactivation in wild-type human heart Na+ channels (hH1), wild-type rat skeletal muscle Na+ channels (μ1) and Na+ channel chimaeras constructed with domains from hH1 and μ1 (μ1(1)hH1(2,3,4), μ1(1,2)hH1(3,4) and μ1(1,2,3)hH1(4)). In addition, activation and fast inactivation kinetics were also studied in wild-type and chimaeric Na+ channels. The results showed that development of slow inactivation in μ1 has a faster onset, a steeper voltage dependence and is more complete compared with hH1. In addition, recovery from slow inactivation was much slower for μ1 than for hH1. Slow inactivation in the chimaeras was intermediate to that of wild-type. However, the chimaera μ1(1)hH1(2,3,4) was more like hH1, while the chimaeras μ1(1,2)hH1(3,4) and μ1(1,2,3)hH1(4) were more similar to μ1. Activation and fast inactivation of the wild-type Na+ channels (hH1 and μ1) also differed, while the chimaeras exhibited kinetics that were, in general, intermediate between those of the wild-type isoforms. Fast inactivation was slower, and V½ of activation and steady-state inactivation were more negative, in hH1 compared with μ1. The chimaeras were more similar to μ1 in activation, more similar to hH1 in fast inactivation, and intermediate to hH1 and μ1 in steady-state fast inactivation. The results demonstrate that Na+ channel kinetics can be modulated by all four domains of the Na+ channel protein. In particular, slow inactivation appears to be a process that may involve participation of all four domains of the α-subunit of the Na+ channel molecule.
Activation and fast inactivation
Initial experiments determined the kinetics of activation and fast inactivation in wild-type and chimaeric Na+ channels. Some previous studies have presented data on these parameters in cloned hH1, μ1 and chimaeric Na+ channels (Chahine et al. 1996; Wang et al. 1996a; Wright et al. 1999). The data from our study are similar to those previously reported. For example, the activation and steady-state fast inactivation (h∞) curves (i.e. V½) for hH1 were more negative than those for μ1, and the macroscopic current decay (from +30 mV) was slower for hH1 than for μ1. In the chimaeras, activation was similar to that in μ1. Because all three chimaeras contained D1 from μ1, one could speculate that D1 is ‘dominant’ in determining the voltage dependence of activation in Na+ channels. However, the chimaera μ1(2,3)hH1(1,4) also exhibits a μ1 activation phenotype (Chahine et al. 1996), suggesting that the presence of any μ1 domain in a hH1-μ1 chimaera can produce a μ1 activation phenotype. In addition, point mutations in the S4 segment of all four domains affect the V½ of activation (Chen et al. 1996; Kontis et al. 1997). Taken together, these results suggest that activation is a complex process that probably involves all four domains of the Na+ channel molecule.
It should also be noted that the activation curve for the chimaeras was less steep than that for either hH1 or μ1. If it is assumed that hH1 and μ1 domains do not differ in net charge, a possible explanation for the difference in slope is a shift in the equilibrium of voltage-dependent activation steps (Sigworth, 1994). This shift might be due to disruption of interactions between domains that are important for stabilization of transitional conformation states (McCormack et al. 1991). Fast inactivation in the chimaeras (as measured by macroscopic current decay from +30 mV) resembled fast inactivation in hH1. All three chimaeras contained D4 and the D3-D4 linker from hH1. These results support the conclusion of other investigators that this region of the Na+ channel α-subunit is involved in fast inactivation gating (Stuhmer et al. 1989; Chen et al. 1996; McPhee et al. 1998). Steady-state fast inactivation (h∞) for the chimaeras fell between that for hH1 and that for μ1. As proposed previously, the intermediate V½ of h∞ for the chimaeras suggests that all four domains contribute to the voltage dependence of Na+ channel steady-state fast inactivation (Chen et al. 1996; Deschenes et al. 1998; Wright et al. 1999).
Development of slow inactivation
Having examined activation and fast inactivation, we determined the slow inactivation phenotype (development, steady state and recovery) in wild-type and chimaeric Na+ channels. Slow inactivation differs from fast inactivation in the time frame of onset and recovery (seconds vs. milliseconds) and in the amount of current that slow inactivates (slow inactivation is less complete than fast inactivation). In addition, slow inactivation appears to be structurally separate from fast inactivation (Rudy, 1978; Featherstone et al. 1996), although slow inactivation can be enhanced when fast inactivation is removed (Rudy, 1978; Featherstone et al. 1996). Comparison of hH1 and μ1 expressed in HEK cells showed a marked difference in slow inactivation phenotype between the two isoforms. Slow inactivation developed much faster and more completely in μ1 than in hH1. As only the α-subunit of the respective Na+ channel was expressed in HEK cells and the same protocols were used to compare slow inactivation, the difference between hH1 and μ1 is probably due to molecular differences between the α-subunits of the two isoforms (Trimmer et al. 1989; Gellens et al. 1992). In particular, several studies have shown that mutations in and around the pore region of Na+ channels can alter the slow inactivation phenotype (Balser et al. 1996; Hayward et al. 1997; Wang & Wang, 1997). Therefore, amino acid differences between hH1 and μ1 in and/or around the pore region may underlie the difference in slow inactivation phenotype of these two Na+ channel isoforms.
The results in this report complement several previous studies on slow inactivation in heart and muscle Na+ channels. Richmond et al. (1998) recently reported on slow inactivation in a human heart α-subunit, hH1a, expressed in Xenopus oocytes and recorded with on-cell macropatches. The results are similar to the data in this study, although hH1a expressed in the oocyte system appears to reach a steady-state level of slow inactivation faster (60 s) than hH1 expressed in HEK cells in this study (∼120 s). In addition, onset of and recovery from slow inactivation in hH1a expressed in oocytes was fitted with a single exponential (Richmond et al. 1998). In hH1 expressed in HEK cells, a double exponential function best described both development of and recovery from slow inactivation (this study). In SkM1 (i.e. μ1) expressed with the β1-subunit in oocytes, onset of and recovery from slow inactivation apparently also followed a single exponential (Featherstone et al. 1996), whereas slow inactivation in μ1 expressed in HEK cells is described by (at least) a double exponential function (this study; Hayward et al. 1997). Regardless of potential differences due to different expression systems, these studies demonstrate that there are dramatic differences in slow inactivation between hH1 and μ1.
To explore the molecular basis for these differences, we studied slow inactivation in Na+ channel chimaeras. These experiments tested the hypothesis that the molecular mechanism for slow inactivation is localized to one or more domains of the Na+ channel molecule. The results showed that slow inactivation in the Na+ channel chimaeras is intermediate relative to that in hH1 and in μ1. This result demonstrates that all four domains can influence or modulate the slow inactivation phenotype of the Na+ channel α-subunit. However, slow inactivation of the chimaeras μ1(1,2)hH1(3,4) and μ1(1,2,3)hH1(4), which have D1 and D2 from μ1, resemble the μ1 phenotype much more than the hH1 phenotype. Therefore, D1 and D2 (or the combination of D1 and D2) may play a more prominent role than D3 and D4 in the development of Na+ channel slow inactivation. This conclusion could be further tested in chimaeras with D1 and/or D2 from hH1, e.g. hH1(1)μ1(2,3,4), hH1(1,2)μ1(3,4) and hH1(1,2,3)μ1(4). These chimaeras were constructed but, despite repeated transfections, expressed little to no Na+ current. It should be noted that while the data from the chimaera studies show that the slow inactivation phenotype can be altered by different combinations of domains in the chimaeras, the data do not determine the specific regions directly involved in the slow inactivation process.
Interaction between domains is found in other aspects of Na+ channel function. For example, all four domains appear to contribute to the voltage dependence of steady-state fast inactivation, although the respective contributions of each domain may not be equivalent (this study; Chen et al. 1996; Kontis & Goldin, 1997; Wright et al. 1999). In addition, activation gating is dependent on the S4 segment from all four domains of the Na+ channel, probably with unequal contributions (Kontis et al. 1997). The data from this study describe another kinetic process in Na+ channels, i.e. slow inactivation, that may be dependent on interactions involving all four domains.
Steady-state slow inactivation
The voltage dependence of steady-state slow inactivation (s∞) also appears to be dependent on all four domains of the Na+ channel. As with the development of slow inactivation, the chimaera μ1(1)hH1(2,3,4) was more similar to hH1, while the chimaeras μ1(1,2)hH1(3,4) and μ1(1,2,3)hH1(4) were more similar to μ1 (at least in slope k). These results again suggest that D1 and D2 may play a more prominent role than D3 and D4 in determining Na+ channel slow inactivation phenotype. The reason for the differences in V½ between μ1(1,2)hH1(3,4), μ1(1,2,3)hH1(4) and μ1 is unclear. While the s∞ of μ1(1,2)hH1(3,4) could be interpreted as being intermediate relative to those of hH1 and μ1, the negative shift of μ1(1,2,3)hH1(4) (relative to μ1) is more difficult to explain. One possible explanation is that an alteration in a co-operative interdomain mechanism in μ1(1,2,3)hH1(4) promotes stabilization of the slow-inactivated state(s) (McCormack et al. 1991).
An interesting feature of the s∞ curve is that it does not exhibit the same time-dependent negative shift as the h∞ curve. Although the time-dependent shift in h∞ has been described in detail in heart and muscle Na+ channels, the reason for the negative shift is unknown (Hanck & Sheets, 1992; Wang et al. 1996a). One possible explanation for the time-dependent difference between s∞ and h∞ is that the fast inactivation gate is accessible to a cellular process (e.g. phosphorylation) that produces the shift, while the slow inactivation gate is not modulated by or is not accessible to the same or similar processes.
Recovery from slow inactivation
After 120 s at 0 mV, recovery from slow inactivation appears to depend on the amount of current that is slow inactivated, i.e. the less slow-inactivated current, the faster the recovery. For example, hH1 and μ1(1)hH1(2,3,4) showed a similar amount of slow-inactivated current after 120 s at 0 mV, and the rate of recovery was essentially identical for these two Na+ channels. The chimaeras μ1(1,2)hH1(3,4) and μ1(1,2,3)hH1(4) were more like μ1 in the amount of slow inactivation and rate of recovery. The greatest difference in recovery from slow inactivation was between μ1 and the other Na+ channels. μ1 had a much greater recovery time constant τ2 than either hH1 or the chimaeras. One possible explanation is that disruption of domain interaction by substitution of another domain into the μ1 background enhances the speed of recovery by destabilizing the slow inactivation state(s).
Relation of Na+ channel slow inactivation to C-type inactivation in K+ channels
Na+ channels are structurally similar and evolutionarily related to voltage-gated K+ channels (Hille, 1989) in which slow (C-type) inactivation has been described (Hoshi et al. 1991). K+ channels are homotetramers, and mutation studies have determined that C-type inactivation occurs by a co-operative mechanism involving all four identical subunits (Yellen et al. 1994; Ogielska et al. 1995; Panyi et al. 1995). The proposed mechanism for C-type inactivation is a constriction of the outer mouth of the channel pore with each subunit contributing equally (Panyi et al. 1995), perhaps altering the ion selectivity of the pore (Starkus et al. 1997). In contrast to K+ channels, Na+ channels are formed from a single protein with four homologous, but not identical, domains (Noda et al. 1986). However, studies show that Na+ channel slow inactivation is altered with point mutations in and around the pore region (Balser et al. 1996; Wang & Wang, 1997; Hayward et al. 1997). Therefore, slow inactivation in Na+ channels and C-type inactivation in K+ channels may occur via a similar molecular mechanism (Townsend & Horn, 1997; Wang & Wang, 1997).
Physiological and pathophysiological significance of slow inactivation
Slow inactivation is thought to play an important role in membrane excitability and firing properties (Ruff et al. 1988; Sawczuk et al. 1995). In brain, Na+ channel slow inactivation may contribute to spike frequency adaptation (Sawczuk et al. 1995; Fleidervish et al. 1996), and may encode information of previous neuronal activity (Toib et al. 1998). In skeletal muscle, Na+ channel slow inactivation may figure prominently in muscle fatigue (Ruff et al. 1988). Compared with brain and muscle Na+ channels, hH1 undergoes little slow inactivation (this study; Townsend & Horn, 1997; Richmond et al. 1998). The ‘resistance’ to slow inactivation of hH1 may avoid a potential reduction in Na+ channel availability during the relatively long cardiac action potential (∼300 ms). Therefore, Na+ channel slow inactivation may play only a minor role in normal cardiac function, while playing a more prominent and physiologically important role in brain and muscle.
Inheritable mutations that alter slow inactivation in Na+ channels have been identified in human skeletal muscle. These mutations underlie such diseases as hyperkalaemic periodic paralysis (Cannon, 1997). To date, no similar mutations have been identified in brain or heart Na+ channels. It is interesting to speculate that mutations in human brain or heart Na+ channels that alter or disrupt slow inactivation could have profound effects on normal physiological function in these tissues.
In summary, hH1 and μ1 exhibit dramatically different slow inactivation phenotypes. The difference is probably due to molecular differences between the α-subunits of hH1 and μ1. Studies of Na+ channel chimaeras constructed with domains from hH1 and μ1 demonstrate that the slow inactivation phenotype can be modulated by all four Na+ channel domains. The data suggest that slow inactivation in Na+ channels may occur via a mechanism similar to that involved in C-type inactivation of voltage-gated K+ channels, i.e. a co-operative interaction involving all four domains. Future studies with site-directed mutagenesis (single, double or multiple mutations) in and around the pore region may provide further information on the molecular basis of Na+ channel slow inactivation.
Acknowledgments
This work was supported by the National Institutes of Health (NIH) grants GM 35401 and GM 49090. Dr R. G. Kallen was supported by NIH grant AR 41762, the American Heart Association, Muscular Dystrophy Association and the University of Pennsylvania Research Foundation.
References
- Balser JR, Nuss HB, Chiamvimonvat N, Pérez-García MT, Marban E, Tomaselli GF. External pore residue mediates slow inactivation in μ1 rat skeletal muscle sodium channels. The Journal of Physiology. 1996;494:431–442. doi: 10.1113/jphysiol.1996.sp021503. [DOI] [PMC free article] [PubMed] [Google Scholar]
- Cannon SC. From mutation to myotonia in sodium channel disorders. Neuromuscular Disorders. 1997;7:241–249. doi: 10.1016/s0960-8966(97)00430-6. [DOI] [PubMed] [Google Scholar]
- Cannon SC, Strittmatter SM. Functional expression of sodium channel mutations identified in families with periodic paralysis. Neuron. 1993;10:317–326. doi: 10.1016/0896-6273(93)90321-h. [DOI] [PubMed] [Google Scholar]
- Chahine M, Deschenes I, Chen L-Q, Kallen RG. Electrophysiological characteristics of cloned skeletal and cardiac muscle sodium channels. American Journal of Physiology. 1996;271:H498–506. doi: 10.1152/ajpheart.1996.271.2.H498. [DOI] [PubMed] [Google Scholar]
- Chen L-Q, Santarelli V, Horn R, Kallen RG. A unique role for the S4 segment of domain 4 in the inactivation of sodium channels. Journal of General Physiology. 1996;108:549–556. doi: 10.1085/jgp.108.6.549. [DOI] [PMC free article] [PubMed] [Google Scholar]
- Cota G, Armstrong CM. Sodium channel gating in clonal pituitary cells. The inactivation step is not voltage dependent. Journal of General Physiology. 1989;94:213–232. doi: 10.1085/jgp.94.2.213. [DOI] [PMC free article] [PubMed] [Google Scholar]
- Cummins TR, Sigworth FJ. Impaired slow inactivation in mutant sodium channels. Biophysical Journal. 1996;71:227–236. doi: 10.1016/S0006-3495(96)79219-6. [DOI] [PMC free article] [PubMed] [Google Scholar]
- Deschenes I, Chen L-Q, Kallen RG, Chahine M. Electrophysiological study of chimeric sodium channels from heart and skeletal muscle. Journal of Membrane Biology. 1998;164:25–34. doi: 10.1007/s002329900390. 10.1007/s002329900390. [DOI] [PubMed] [Google Scholar]
- Featherstone DE, Richmond JE, Ruben PC. Interaction between fast and slow inactivation in Skm1 sodium channels. Biophysical Journal. 1996;71:3098–3109. doi: 10.1016/S0006-3495(96)79504-8. [DOI] [PMC free article] [PubMed] [Google Scholar]
- Fleidervish IA, Friedman A, Gutnick MJ. Slow inactivation of Na+ current and slow cumulative spike adaptation in mouse and guinea-pig neocortical neurones in slices. The Journal of Physiology. 1996;493:83–97. doi: 10.1113/jphysiol.1996.sp021366. [DOI] [PMC free article] [PubMed] [Google Scholar]
- Frohnwieser B, Chen L-Q, Schreibmayer W, Kallen RG. Modulation of the human cardiac sodium channel α-subunit by cAMP-dependent protein kinase and the responsible sequence domain. The Journal of Physiology. 1997;498:309–318. doi: 10.1113/jphysiol.1997.sp021859. [DOI] [PMC free article] [PubMed] [Google Scholar]
- Gellens ME, George ALJ, Chen L-Q, Chahine M, Horn R, Barchi RL, Kallen RG. Primary structure and functional expression of the human cardiac tetrodotoxin-insensitive voltage-dependent sodium channel. Proceedings of the National Academy of Sciences of the USA. 1992;89:554–558. doi: 10.1073/pnas.89.2.554. [DOI] [PMC free article] [PubMed] [Google Scholar]
- George ALJ, Komisarof J, Kallen RG, Barchi RL. Primary structure of the adult human skeletal muscle voltage-dependent sodium channel. Annals of Neurology. 1992;31:131–137. doi: 10.1002/ana.410310203. [DOI] [PubMed] [Google Scholar]
- Hamill OP, Marty A, Neher E, Sakmann B, Sigworth FJ. Improved patch-clamp techniques for high-resolution current recording from cells and cell-free membrane patches. Pflügers Archiv. 1981;391:85–100. doi: 10.1007/BF00656997. [DOI] [PubMed] [Google Scholar]
- Hanck DA, Sheets MF. Time-dependent changes in kinetics of Na+ current in single canine cardiac Purkinje cells. American Journal of Physiology. 1992;262:H1197–1207. doi: 10.1152/ajpheart.1992.262.4.H1197. [DOI] [PubMed] [Google Scholar]
- Hayward LJ, Brown RHJ, Cannon SC. Slow inactivation differs among mutant Na channels associated with myotonia and periodic paralysis. Biophysical Journal. 1997;72:1204–1219. doi: 10.1016/S0006-3495(97)78768-X. [DOI] [PMC free article] [PubMed] [Google Scholar]
- Hille B. The Sharpey-Schafer lecture. Ionic channels: evolutionary origins and modern roles. Quarterly Journal of Experimental Physiology. 1989;74:785–804. doi: 10.1113/expphysiol.1989.sp003349. [DOI] [PubMed] [Google Scholar]
- Hille B. Ionic Channels of Excitable Membranes. Sunderland, MA, USA: Sinauer Associates; 1992. [Google Scholar]
- Hoshi T, Zagotta WN, Aldrich RW. Two types of inactivation in Shaker K+ channels: effects of alterations in the carboxy-terminal region. Neuron. 1991;7:547–556. doi: 10.1016/0896-6273(91)90367-9. [DOI] [PubMed] [Google Scholar]
- Kontis KJ, Goldin AL. Sodium channel inactivation is altered by substitution of voltage sensor positive charges. Journal of General Physiology. 1997;110:403–413. doi: 10.1085/jgp.110.4.403. [DOI] [PMC free article] [PubMed] [Google Scholar]
- Kontis KJ, Rounaghi A, Goldin AL. Sodium channel activation gating is affected by substitutions of voltage sensor positive charges in all four domains. Journal of General Physiology. 1997;110:391–401. doi: 10.1085/jgp.110.4.391. [DOI] [PMC free article] [PubMed] [Google Scholar]
- McCormack K, Tanouye MA, Iverson LE, Lin JW, Ramaswami M, McCormack T, Campanelli JT, Mathew MK, Rudy B. A role for hydrophobic residues in the voltage-dependent gating of Shaker K+ channels. Proceedings of the National Academy of Sciences of the USA. 1991;88:2931–2935. doi: 10.1073/pnas.88.7.2931. [DOI] [PMC free article] [PubMed] [Google Scholar]
- McPhee JC, Ragsdale DS, Scheuer T, Catterall WA. A critical role for the S4-S5 intracellular loop in domain IV of the sodium channel α-subunit in fast inactivation. Journal of Biological Chemistry. 1998;273:1121–1129. doi: 10.1074/jbc.273.2.1121. [DOI] [PubMed] [Google Scholar]
- Noda M, Ikeda T, Suzuki H, Takeshima H, Takahashi T, Kuno M, Numa S. Expression of functional sodium channels from cloned cDNA. Nature. 1986;322:826–828. doi: 10.1038/322826a0. [DOI] [PubMed] [Google Scholar]
- Ogielska EM, Zagotta WN, Hoshi T, Heinemann SH, Haab J, Aldrich RW. Cooperative subunit interactions in C-type inactivation of K channels. Biophysical Journal. 1995;69:2449–2457. doi: 10.1016/S0006-3495(95)80114-1. [DOI] [PMC free article] [PubMed] [Google Scholar]
- O'Reilly JP, Wang GK, Wang S-Y. Na channel slow inactivation differs between human heart and rat skeletal muscle isoforms. Society for Neuroscience Abstracts. 1998;18(1077):427.7. [Google Scholar]
- Panyi G, Sheng Z, Deutsch C. C-type inactivation of a voltage-gated K+ channel occurs by a cooperative mechanism. Biophysical Journal. 1995;69:896–903. doi: 10.1016/S0006-3495(95)79963-5. [DOI] [PMC free article] [PubMed] [Google Scholar]
- Patton DE, West JW, Catterall WA, Goldin AL. Amino acid residues required for fast Na+-channel inactivation: charge neutralizations and deletions in the III-IV linker. Proceedings of the National Academy of Sciences of the USA. 1992;89:10905–10909. doi: 10.1073/pnas.89.22.10905. [DOI] [PMC free article] [PubMed] [Google Scholar]
- Richmond JE, Featherstone DE, Hartmann HA, Ruben PC. Slow inactivation in human cardiac sodium channels. Biophysical Journal. 1998;74:2945–2952. doi: 10.1016/S0006-3495(98)78001-4. [DOI] [PMC free article] [PubMed] [Google Scholar]
- Rudy B. Slow inactivation of the sodium conductance in squid giant axons. Pronase resistance. The Journal of Physiology. 1978;283:1–21. doi: 10.1113/jphysiol.1978.sp012485. [DOI] [PMC free article] [PubMed] [Google Scholar]
- Ruff RL, Simoncini L, Stuhmer W. Slow sodium channel inactivation in mammalian muscle: a possible role in regulating excitability. Muscle and Nerve. 1988;11:502–510. doi: 10.1002/mus.880110514. [DOI] [PubMed] [Google Scholar]
- Sawczuk A, Powers RK, Binder MD. Spike frequency adaptation studied in hypoglossal motoneurons of the rat. Journal of Neurophysiology. 1995;73:1799–1810. doi: 10.1152/jn.1995.73.5.1799. [DOI] [PubMed] [Google Scholar]
- Sigworth FJ. Voltage gating of ion channels. Quarterly Reviews of Biophysics. 1994;27:1–40. doi: 10.1017/s0033583500002894. [DOI] [PubMed] [Google Scholar]
- Starkus JG, Kuschel L, Rayner MD, Heinemann SH. Ion conduction through C-type inactivated Shaker channels. Journal of General Physiology. 1997;110:539–550. doi: 10.1085/jgp.110.5.539. [DOI] [PMC free article] [PubMed] [Google Scholar]
- Stuhmer W, Conti F, Suzuki H, Wang XD, Noda M, Yahagi N, Kubo H, Numa S. Structural parts involved in activation and inactivation of the sodium channel. Nature. 1989;339:597–603. doi: 10.1038/339597a0. [DOI] [PubMed] [Google Scholar]
- Toib A, Lyakhov V, Marom S. Interaction between duration of activity and time course of recovery from slow inactivation in mammalian brain Na+ channels. Journal of Neuroscience. 1998;18:1893–1903. doi: 10.1523/JNEUROSCI.18-05-01893.1998. [DOI] [PMC free article] [PubMed] [Google Scholar]
- Townsend C, Horn R. Effect of alkali metal cations on slow inactivation of cardiac Na+ channels. Journal of General Physiology. 1997;110:23–33. doi: 10.1085/jgp.110.1.23. [DOI] [PMC free article] [PubMed] [Google Scholar]
- Trimmer JS, Cooperman SS, Tomiko SA, Zhou JY, Crean SM, Boyle MB, Kallen RG, Sheng ZH, Barchi RL, Sigworth FJ. Primary structure and functional expression of a mammalian skeletal muscle sodium channel. Neuron. 1989;3:33–49. doi: 10.1016/0896-6273(89)90113-x. [DOI] [PubMed] [Google Scholar]
- Ukomadu C, Zhou J, Sigworth FJ, Agnew WS. μ1 Na+ channels expressed transiently in human embryonic kidney cells: biochemical and biophysical properties. Neuron. 1992;8:663–676. doi: 10.1016/0896-6273(92)90088-u. [DOI] [PubMed] [Google Scholar]
- Wang DW, George ALJ, Bennett PB. Comparison of heterologously expressed human cardiac and skeletal muscle sodium channels. Biophysical Journal. 1996a;70:238–245. doi: 10.1016/S0006-3495(96)79566-8. [DOI] [PMC free article] [PubMed] [Google Scholar]
- Wang DW, Yazawa K, George ALJ, Bennett PB. Characterization of human cardiac Na+ channel mutations in the congenital long QT syndrome. Proceedings of the National Academy of Sciences of the USA. 1996b;93:13200–13205. doi: 10.1073/pnas.93.23.13200. [DOI] [PMC free article] [PubMed] [Google Scholar]
- Wang S-Y, Wang GK. A mutation in segment I-S6 alters slow inactivation of sodium channels. Biophysical Journal. 1997;72:1633–1640. doi: 10.1016/S0006-3495(97)78809-X. [DOI] [PMC free article] [PubMed] [Google Scholar]
- Wright SW, Wang S-Y, Xiao Y-F, Wang GK. State-dependent cocaine block of Na channel isoforms, chimeras, and channels coexpressed with the β1 subunit. Biophysical Journal. 1999;76:233–245. doi: 10.1016/S0006-3495(99)77192-4. [DOI] [PMC free article] [PubMed] [Google Scholar]
- Yellen G, Sodickson D, Chen TY, Jurman ME. An engineered cysteine in the external mouth of a K+ channel allows inactivation to be modulated by metal binding. Biophysical Journal. 1994;66:1068–1075. doi: 10.1016/S0006-3495(94)80888-4. [DOI] [PMC free article] [PubMed] [Google Scholar]