

Abstract
The objectives of this study were (1) to investigate whether glucose ingestion during prolonged exercise reduces whole body muscle glycogen oxidation, (2) to determine the extent to which glucose disappearing from the plasma is oxidized during exercise with and without carbohydrate ingestion and (3) to obtain an estimate of gluconeogenesis.
After an overnight fast, six well-trained cyclists exercised on three occasions for 120 min on a bicycle ergometer at 50% maximum velocity of O2 uptake and ingested either water (Fast), or a 4% glucose solution (Lo-Glu) or a 22% glucose solution (Hi-Glu) during exercise.
Dual tracer infusion of [U-13C]-glucose and [6,6-2H2]-glucose was given to measure the rate of appearance (Ra) of glucose, muscle glycogen oxidation, glucose carbon recycling, metabolic clearance rate (MCR) and non-oxidative disposal of glucose.
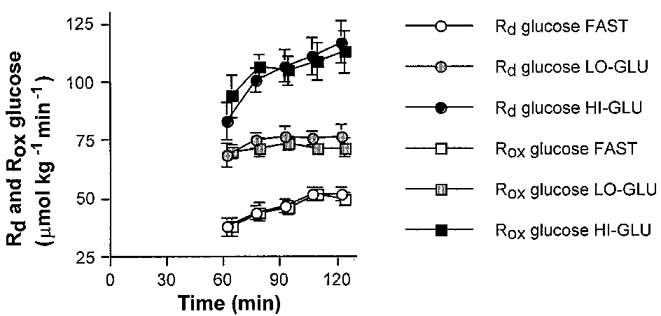
Glucose ingestion markedly increased total Ra especially with Hi-Glu. After 120 min Ra and rate of disappearance (Rd) of glucose were 51-52 μmol kg−1 min−1 during Fast, 73-74 μmol kg−1 min−1 during Lo-Glu and 117–119 μmol kg−1 min−1 during Hi-Glu. The percentage of Rd oxidized was between 96 and 100% in all trials.
Glycogen oxidation during exercise was not reduced by glucose ingestion. The vast majority of glucose disappearing from the plasma is oxidized and MCR increased markedly with glucose ingestion. Glucose carbon recycling was minimal suggesting that gluconeogenesis in these conditions is negligible.
During the past 15 years many studies have shown that carbohydrate (CHO) feedings during prolonged exercise can delay the onset of fatigue and enhance exercise performance (Coyle et al. 1983, 1986; Hargreaves et al. 1984; Coggan & Coyle, 1987, 1988; Murray et al. 1987; Jeukendrup et al. 1997a). The observed improvements in performance with carbohydrate ingestion have been attributed to a maintenance of plasma glucose availability and of high rates of carbohydrate oxidation during the later stages of exercise, when muscle glycogen is nearly depleted (Coggan & Coyle, 1987, 1988). However, other studies suggested that carbohydrate ingestion may improve endurance performance by slowing the rate of muscle glycogen degradation (Coyle et al. 1983; Hargreaves et al. 1984; Bjorkman et al. 1984; Tsintzas et al. 1995, 1996). For example Tsintzas et al. (1995, 1996) showed that net muscle glycogen breakdown after carbohydrate ingestion during running at 70% maximum velocity of O2 uptake (V̇O2,max) was reduced and this ‘glycogen sparing’ occurred almost exclusively in type I muscle fibres. These results are in contrast with findings of Coyle et al. (1986) who showed that glycogen breakdown was not reduced by carbohydrate ingestion in trained cyclists exercising at 70%V̇O2,max.
Net glycogen synthesis during exercise would imply that glucose taken up by the muscle from the blood is used for glycogen synthesis instead of being oxidized. Coggan et al. (1991) reported data of one subject showing that 93% of glucose disappearing from the plasma was oxidized when glucose was ingested during the second hour of exercise at 70%V̇O2,max. However, others have reported oxidation rates that exceeded the Rd glucose rate (Bosch et al. 1994) or values that were considerably lower (33-50 μmol kg−1 min−1) (Colberg et al. 1994; Roberts et al. 1996). The second aim of the present study, therefore, was to investigate how much of the glucose that is disappearing from the plasma is oxidized in the presence and absence of glucose ingestion.
Little is known about the role of gluconeogenesis during exercise (MacRae et al. 1995) and the effect of glucose ingestion on gluconeogenesis. Glucose carbon recycling measured by double tracers has been used as a method to estimate gluconeogenesis. To study glucose carbon recycling, we compared the rate of appearance of glucose (Ra) measured with a [6,6-2H2]-glucose tracer (GC-MS) and a [U-13C]-glucose tracer (GC-IRMS) during exercise. With glucose ingestion, gluconeogenesis may be suppressed and we hypothesised that glucose carbon recycling would decrease with glucose ingestion.
In summary, the primary purpose of the present study was to investigate whether carbohydrate ingestion can reduce muscle glycogen oxidation measured at whole body level with the indirect stable isotope tracer method. The secondary purpose was to determine the percentage of glucose disappearing from the plasma that is oxidized during exercise and to quantify non-oxidative glucose disposal with or without carbohydrate ingestion. A third purpose was to investigate glucose carbon recycling as a measure of gluconeogenesis and to see whether glucose ingestion could suppress gluconeogenesis.
METHODS
Subjects
Six highly trained cyclists participated in this study. Their mean age and weight were 24 ± 2 years and 68 ± 1 kg. After explaining the nature and the risks of the experimental procedures to the subjects, their informed written consent was obtained. The study was approved by the local Medical Ethical Committee.
Pre-testing
Subjects’V̇O2,max was measured on an electronically braked cycle ergometer (Lode Excalibur Sport, Groningen, The Netherlands) during an incremental exhaustive exercise test (Kuipers et al. 1985) one week before the first experimental trial and was found to be 76 ± 1 ml kg−1 min−1. Maximal work rate during the incremental exercise test was 397 ± 10 W. The results of this test were used to determine the 50%VO2,max workload which was later employed in the experimental trials.
Experimental trials
Each subject performed six exercise trials, each separated by at least seven days. The order of the trials was determined by a Latin square design. Each trial consisted of 120 min cycling at ∼50%V̇O2,max. Subjects ingested drinks containing no glucose (Fast), a 4.4% glucose solution (Lo-Glu) or a 22.0% (Hi-Glu) glucose solution. Each trial with one of these drinks was repeated, once with isotope infusion and once without infusion in order to allow correction for changes in breath 13CO2 background enrichment during exercise.
Protocol
Subjects reported to the laboratory at 08.00 h after an overnight fast. A Teflon catheter (Baxter Quick Cath Dupont, Uden, The Netherlands) was inserted into an antecubital vein of one arm and at 08.30 h a resting blood sample of 10 ml was drawn. In the contralateral antecubital vein a second Teflon catheter was inserted for isotope infusion. Resting breath gases were collected over 5 min periods (Oxycon β, Mijnhardt, Mannheim, Germany) and vacutainer tubes were filled directly from the mixing chamber to determine the 13C/12C ratio in expired CO2. In all figures, time point 0 min refers to this resting sample. At 08.55 h subjects started a warming-up of 5 min at 100 W. Also, at 08.55 h a sodium bicarbonate prime was given (5.5 μmol.kg−1 Na H13CO3; Cambridge Isotope Laboratories, USA) followed by a [6,6-2H2]-glucose (Cambridge Isotope Laboratories, USA) and a [U-13C]-glucose (Cambridge Isotope Laboratories, USA) prime (dose equal to one hour infusion). Thereafter a continuous infusion of sterile pyrogen free [6,6-2H2]-glucose and [U-13C]-glucose was started via a calibrated IVAC 560 pump (San Diego, CA). The concentration of isotopes in the infusate was measured for each experiment so that the exact infusion rate could be determined. Infusion rates were 0.234 ± 0.01 and 0.032 ± 0.002 μmol kg−1 min−1 for [6,6-2H2]-glucose and [U-13C]-glucose, respectively.
At 09.00 h the workload was increased to 50%V̇O2,max for 120 min. During the first minute subjects drank an initial bolus (8 ml kg−1) of one of the glucose solutions (24 g glucose during Lo-Glu and 120 g glucose during Hi-Glu). Thereafter every 15 min a beverage volume of 2 ml kg−1 (6 g glucose during Lo-Glu; 30 g glucose during Hi-Glu) was provided. This feeding schedule has been shown to result in high rates of gastric emptying (Rehrer et al. 1990). The mean amount of glucose provided during the 120 min of exercise was 72 ± 1 g in the Lo-Glu trial and 360 ± 7 g in the Hi-Glu trial. Blood samples were drawn at 15 min intervals until the end of exercise. Expiratory gases were collected every 15 min.
Glucose solutions
Subjects ingested glucose solutions prepared from potato-derived glucose (AVEBE, The Netherlands) containing either 44 or 220 g l−1 glucose. This glucose had a 13C-enrichment of -26.1 parts per thousand (δ per mil) versus PDB (the international standard, Pee Dee Bellemnitella; determined by on-line combustion-IRMS, Carlo-Erba-Finnigan MAT 252, Bremen, Germany) which is similar to the 13C-enrichment of expired air of Europeans (Wagenmakers et al. 1993). To minimize shifts in background enrichment as a result of changes in endogenous substrate utilization, standard procedures were followed (Jeukendrup et al. 1995, 1996b). Subjects were instructed not to consume any products with a high natural abundance of 13C during the entire experimental period. Furthermore, subjects were instructed to keep their diet as constant as possible during the days before the trials.
Analysis
Blood (10 ml) was collected into tubes containing EDTA and was centrifuged for 4 min at 4°C. Aliquots of plasma were frozen immediately in liquid nitrogen and stored at -40°C until analysis of glucose (Roche, Uni Kit III, 0710970), lactate (Gutmann & Wahlefeld, 1974) and free fatty acids (FFA; Wako NEFA-C test kit, Wako Chemicals, Neuss, Germany) which were performed with the COBAS BIO semi automatic analyser. Insulin was analysed by radioimmuno assay (Nuclilab Ultrasensitive Human Insulin RIA kit).
Breath samples were analysed for 13C/12C ratio by gas chromatography continuous flow isotope ratio mass spectrometry (GC-IRMS; Finnigan MAT 252, Bremen, Germany).
For determination of 13C/12C ratios of plasma glucose, glucose was derivatized to its trimethylsilyl derivative using TriSil Z® (Pierce). Thereafter the derivative was measured by GC-IRMS (Finnigan MAT 252, Bremen, FRG). By establishing the relationship between the enrichment of a series of glucose standards of variable enrichment (by combustion-IRMS; Carlo Erba-Finnigan MAT 252, Bremen, Germany) and the enrichment of the glucose trimethylsilyl derivative of these standards, the enrichment of plasma glucose samples was determined.
Plasma [2H]-glucose enrichment was determined by gas chromatography-mass spectrometry (GC-MS) analysis of the glucose penta-acetate derivatives on a Finnigan INCOS-XL (Bremen, Germany). For [2H]-glucose enrichment, ion masses of 200 and 202 were selectively monitored.
From indirect calorimetry (respiratory exchange ratio (RER), rate of oxygen consumption (V̇O2)) and stable isotope measurements (13CO2/12CO2) (IRMS, Finnigan MAT 252), total energy expenditure and oxidation rates of total fat, total carbohydrates and exogenous glucose were calculated.
Calculations
From the volume of CO2 production per unit time, (l min−1; V̇CO2) and V̇O2, total carbohydrate and fat oxidation rates (g min−1) were calculated using the non-protein respiratory quotient (Péronnet & Massicotte, 1991).
| (1) |
| (2) |
The isotopic enrichment was expressed as δ per mil difference between the 13C/12C ratio of the sample and a known laboratory reference standard according to the formula of Craig (1957):
| (3) |
The δ13C will then be related to an international standard Pee Dee Bellemnitella (PDB).
The total rate of appearance (i.e. total Ra) and rates of disappearance (i.e. total Rd) of glucose were calculated using the single-pool non-steady state equations of Steele (1959) adapted for use with stable isotopes as described elsewhere (Wolfe, 1992). Total Ra represents the splanchnic Ra from ingested CHO, hepatic glycogenolysis and gluconeogenesis.
| (4) |
| (5) |
where Ḟ is the infusion rate (μmol kg−1 min−1), V is the volume of distribution (= 160 ml kg−1), C2 and C1 are the glucose concentrations at times 2 and 1 (i.e. t2, t1), respectively, and E2 and E1 are the plasma glucose enrichments at times 2 and 1 (i.e. t2, t1), respectively.
The V̇13CO2production from the tracer infusion was calculated as:
| (6) |
where ECO2 is the breath 13C/12C ratio at a given time and Ebkg is the breath 13C/12C ratio at the same time during the trial with no tracer infusion for correction of background (i.e. bkg) shifts. V̇CO2 is CO2 production per minute per millilitre. The conversion factor is 1 mol CO2= 22.4 l.
The percentage of the infused [U-13C] tracer oxidized was calculated as:
| (7) |
Plasma glucose oxidation was calculated as:
| (8) |
Muscle glycogen oxidation was calculated as:
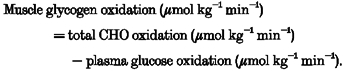 |
(9) |
Glucose carbon recycling was calculated as the difference between Ra measured with a [6,6-2H2]-glucose tracer and a [U-13C]-glucose tracer:
| (10) |
Metabolic clearance rate (MCR) was calculated as the Rd glucose divided by the mean glucose concentration over that time period.
| (11) |
Statistics
Analysis of variance for repeated measures was performed to study differences between the three conditions. A Scheffé‘s post hoc test was applied in case of a significant (P < 0.05) F-ratio to locate the differences. Comparisons between results from two different tracer methods were compared by a Student's paired t test. All results are expressed as means ±s.e.m.
RESULTS
Plasma glucose, insulin, lactate, free fatty acids and glycerol
In the Fast trial, plasma glucose concentrations were in the range of 4.2-4.6 mM at rest and throughout the exercise bout (Fig. 1). With glucose ingestion in the Hi-Glu and Lo-Glu trial plasma glucose concentrations peaked at 10-20 min at values of 5.5-5.8 mM. Plasma glucose concentrations were higher throughout exercise with glucose ingestion compared with Fast, although only Hi-Glu versus Fast reached statistical significance at all time points (P < 0.05).
Figure 1. Plasma glucose, insulin FFA and glycerol.
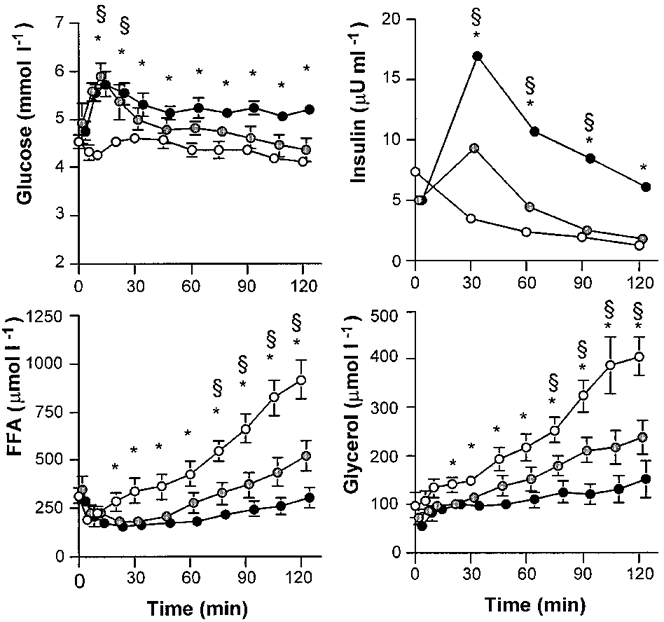
Values are means ±s.e.m. Plasma glucose, insulin FFA and glycerol concentrations during 120 min of exercise at 50% VO2,max with water ingestion (Fast; ○), a low dose of glucose (Lo-Glu;  ) or a high dose of glucose (Hi-Glu;•). * Denotes a significant difference between Fast and Hi-Glu, P < 0.05. § Denotes a significant difference between Fast and Lo-Glu; P < 0.05.
Plasma insulin was low at rest and during exercise when fasted (i.e. 5-7 μU ml−1; Fig. 1), but was significantly elevated by glucose ingestion during exercise. The highest insulin values were observed after 30 min (9 ± 2 μU ml−1 with Lo-Glu and 17 ± 4 μU ml−1 with Hi-Glu). Plasma insulin decreased in all trials but remained elevated in the Glu trials in comparison with Fast. In all conditions plasma insulin decreased to, or below, the resting fasting level at the end of the trials.
Plasma lactate at rest was 0.9 ± 0.1, 0.9 ± 0.1 and 0.8 ± 0.2 mM for Fast, Lo-Glu and Hi-Glu, respectively, and did not change during exercise (data not shown in Fig. 1). After 120 min of exercise the values were 0.9 ± 0.1, 0.8 ± 0.1 and 0.8 ± 0.1 mM, respectively.
During the Fast trial, plasma free fatty acid (FFA) concentration initially decreased during the first 10 min and thereafter gradually increased during exercise to about three times basal level (914 ± 99 μM at 120 min; Fig. 1). Plasma FFA in both Glu conditions followed a similar pattern but was significantly suppressed during Lo-Glu (to 522 ± 79 μM at 120 min; P < 0.05) compared with Fast and even more when Hi-Glu was ingested (to 301 ± 51 μM at 120 min; P < 0.05).
Plasma glycerol concentrations were increased during exercise from resting values in the range of 55-97 μM to 406 ± 39 μM at 120 min during Fast, 238 ± 35 μM during Lo-Glu and 152 ± 38 μM during Hi-Glu (Fig. 1; P < 0.05).
Whole body fat and carbohydrate oxidation
VO2 was similar during each exercise session (38-39 ml kg−1 min−1) and elicited approximately 51 ± 2%V̇O2,max (Table 1). RER decreased in the Fast trial (P < 0.05) and remained stable with Glu ingestion. RER was slightly higher with the Hi-Glu feeding (Table 1). Carbohydrate oxidation decreased during Fast, decreased less with Lo-Glu and remained stable with Hi-Glu (Fig. 2). After 120 min of exercise, total CHO oxidation rates were 130 ± 11, 154 ± 10 and 179 ± 6 μmol kg−1 min−1 for Fast, Lo-Glu and Hi-Glu, respectively (Fig. 2). Total fat oxidation was markedly suppressed by the Glu feedings (Fig. 2; P < 0.05). After 120 min of exercise total fat oxidation rates were 40 ± 2, 33 ± 3 and 26 ± 2 μmol kg−1 min−1 for Fast, Lo-Glu and Hi-Glu, respectively (P < 0.05).
Table 1.
Whole body oxygen consumption (V̇O2), respiratory exchange ratio, total carbohydrate oxidation, V̇13CO2 production and oxidation rates of the intravenously infused [U-13C]-glucose tracer during the 90–120 min period of exercise
| Trial | Time(min) | V̇O2(ml kg−1 min−1) | Respiratory exchange ratio | Carbohydrate oxidation(μmol kg−1 min−1) | V̇13CO2 production(μmol kg−1 min−1) | Percentage of infused tracer oxidized |
|---|---|---|---|---|---|---|
| Fast | 90–105 | 38.9 ± 0.7 | 0.83 ± 0.01 | 130 ± 13 | 0.209 ± 0.024 | 98.6 ± 3.4 |
| 105–120 | 39.3 ± 0.7 | 0.83 ± 0.01 | 130 ± 11 | 0.210 ± 0.026 | 98.6 ± 3.4 | |
| Lo-Glu | 90–105 | 38.2 ± 0.3 | 0.86 ± 0.01* | 156 ± 10* | 0.194 ± 0.007 | 98.7 ± 1.4 |
| 105–120 | 38.5 ± 0.3 | 0.85 ± 0.01* | 155 ± 10* | 0.192 ± 0.006 | 97.9 ± 1.0 | |
| Hi-Glu | 90–105 | 37.7 ± 0.5 | 0.89 ± 0.01*† | 182 ± 5*† | 0.187 ± 0.003 | 98.3 ± 1.0 |
| 105–120 | 37.9 ± 0.5 | 0.89 ± 0.01*† | 179 ± 6*† | 0.183 ± 0.004 | 96.1 ± 1.3 |
Values are means ± s.e.m.V̇13CO2 production is the product of breath 13CO2 enrichment above baseline and V̇CO2 production. Percentage of infused tracer oxidized is calculated as (V13CO2 production/intravenous tracer infusion rate).
Glu trials significantly different from Fast at that time; P < 0.05.
Hi-Glu trial significantly different from the Lo-Glu trial at that time; P < 0.05.
Figure 2. Carbohydrate and fat oxidation.
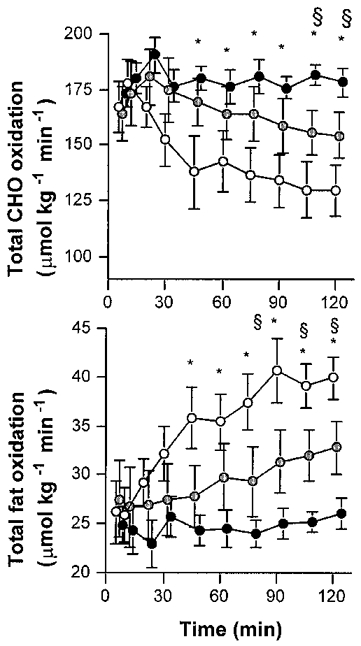
Values are means ±s.e.m. The rates of total CHO and fat oxidation during 120 min of exercise at 50% VO2,max with water ingestion (Fast; 1), a low dose of glucose (Lo-Glu;  ) or a high dose of glucose (Hi-Glu; •). * Denotes a significant difference between Fast and Hi-Glu, P < 0.05. § Denotes a significant difference between Fast and Lo-Glu; P < 0.05.
Breath ratio of 13CO2/12CO2
In the exercise trials without tracer infusion, used to measure shifts in background or endogenous 13CO2 production, the subjects displayed only a very slight non-significant elevation in 13CO2/12CO2 breath ratio both when fasted and when receiving glucose (Fig. 3). The glucose ingestion and oxidation did not alter 13CO2/12CO2 breath ratio during the background trial (i.e. without tracer infusion). The breath ratios during the experimental trials with [U-13C]-glucose tracer infusion are shown in Fig. 3. The NaH13CO3 prime, given just prior to beginning exercise during each trial, as expected, markedly raised breath 13CO2/12CO2 during the first 10 min. However, 13CO2/12CO2 breath ratios reached a plateau after ∼60 min (Fig. 3).
Figure 3. Breath and plasma glucose enrichments.
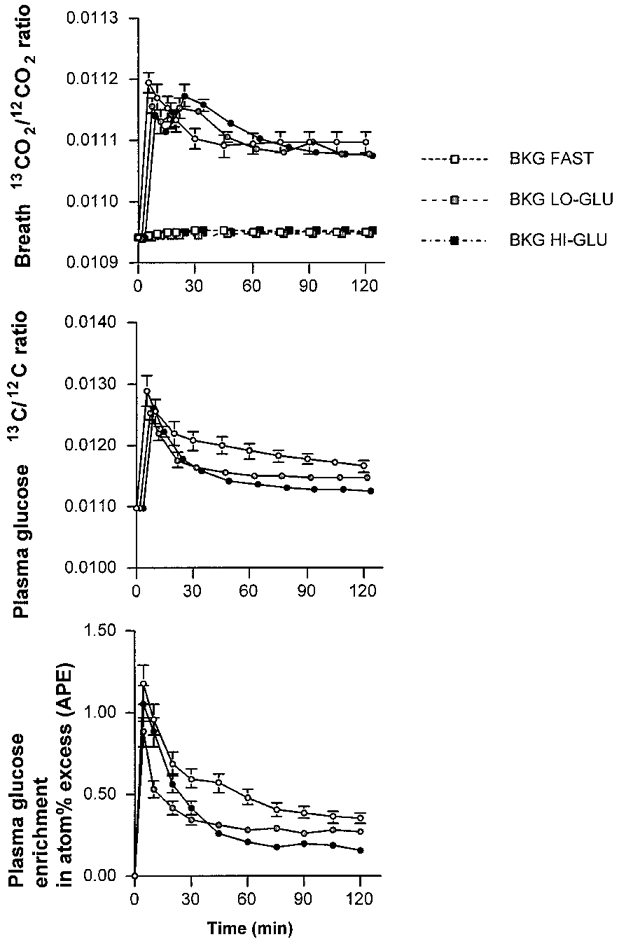
Values are means ±s.e.m. Plateau in the breath 13CO2/12CO2 enrichment, the plasma glucose 13C-enrichment and the plasma 2H2-glucose enrichment during exercise at 50% VO2,max with water ingestion (Fast; ○), a low dose of glucose (Lo-Glu;  ) or a high dose of glucose (Hi-Glu; •). Breath 13CO2/12CO2 enrichment is also displayed for the background (BKG) correction trials (squares).
[U-13C]-tracer oxidation
No differences were observed between the 13CO2 production rates of the three trials (Table 1). During the 105-120 min period of exercise, the mean percentage oxidation of the infused tracer was 99 ± 3% for Fast, 98 ± 1% for Lo-Glu and 96 ± 1% for Hi-Glu. The exact values for the percentage oxidation of the infused tracer for the 90-105 and 105-120 min period are displayed in Table 1.
Rate of appearance and disappearance of plasma glucose, glucose carbon recycling and metabolic clearance rate
The increase in plasma 13C/12C-glucose ratio and 2H-enrichment as a result of the tracer infusion was stable during the 60-120 min period in all trials (Fig. 3). Ra and Rd glucose were calculated from both tracers ([6,6-2H2]-glucose and [U-13C]-glucose) and were slightly lower when using the plasma 13C-glucose enrichment (Table 3, Fig. 4). Both Ra and Rd glucose were markedly elevated with glucose ingestion (44% with Lo-Glu and 125% with Hi-Glu; P < 0.05; Table 2).
Table 3.
Comparison of tracers
| Trial | Time(min) | Ra glucose(μmol kg−1 min−1)[6,6-2H2]-glucose | Ra glucose(μmol kg−1 min−1)[U-13C]-glucose | Rd glucose(μmol kg−1 min−1)[6,6-2H2]-glucose | Rd glucose(μmol kg−1 min−1)[U-13C]-glucose |
|---|---|---|---|---|---|
| Fast | 90–105 | 51 ± 3 | 42 ± 4 | 53 ± 3 | 44 ± 4 |
| 105–120 | 51 ± 3 | 46 ± 5 | 52 ± 3 | 46 ± 5 | |
| Lo-Glu | 90–105 | 71 ± 1* | 65 ± 5* | 73 ± 1* | 67 ± 5* |
| 105–120 | 73 ± 3* | 67 ± 5* | 74 ± 3* | 68 ± 6* | |
| Hi-Glu | 90–105 | 109 ± 8*† | 105 ± 5*† | 111 ± 8*† | 107 ± 5*† |
| 105–120 | 119 ± 10*† | 113 ± 6*† | 117 ± 9*† | 111 ± 6*† |
The rate of appearance of plasma glucose (Ra glucose) and the rate of disappearance of plasma glucose (Rd glucose) calculated from the [6, 6-2H2]-glucose tracer compared with the [U-13C]-glucose tracer. Values are means ±s.e.m. for 6 subjects.
Glu trials significantly different from the fast trial; P < 0.05.
Hi-Glu trial significantly different from the Lo-Glu trial; P < 0.05.
Figure 4. Ra and Rd glucose.
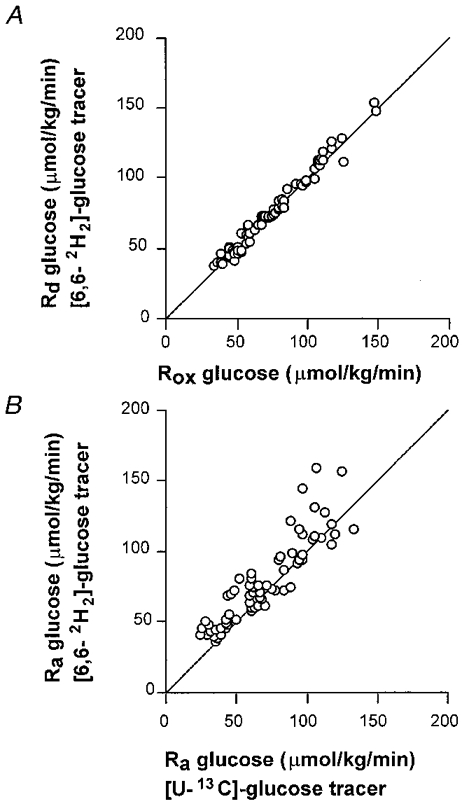
All values are means ±s.e.m.A, comparison of the rate of disappearance of glucose (Rd) measured by a [2H2]-glucose tracer and the rate of plasma glucose oxidation (Rox). B, comparison of two different tracers to measure the rate of appearance of glucose (Ra). The line represents the 1:1 relationship.
Table 2.
Effects of ingestion of a low dose of glucose (Lo-Glu) or a high dose (Hi-Glu) during exercise compared with fasting (Fast) on various aspects of CHO metabolism during exercise including total CHO oxidation, the rate of appearance of plasma glucose (Ra glucose), the rate of disappearance of plasma glucose (Rd glucose), plasma glucose oxidation, glycogen oxidation and/or lactate oxidation
| Trial | Time(min) | Total CHO oxidation(μmol kg−1 min−1) | Ra glucosea(μmol kg−1 min−1) | Rd glucosea (μmol kg−1 min−1) | Plasma glucose oxidation(μmol kg−1 min−1) | Percentage of Rd oxidized(%) | Muscle glycogen and/or lactate oxidation(μmol kg−1 min−1) |
|---|---|---|---|---|---|---|---|
| Fast | 90–105 | 130 ± 13 | 51 ± 3 | 53 ± 3 | 52 ± 3 | 99 ± 3 | 78 ± 12 |
| 105–120 | 130 ± 11 | 51 ± 3 | 52 ± 3 | 50 ± 2 | 99 ± 3 | 79 ± 11 | |
| Lo-Glu | 90–105 | 156 ± 10 | 71 ± 1* | 73 ± 1* | 72 ± 2 | 99 ± 1 | 84 ± 11 |
| 105–120 | 155 ± 10 | 73 ± 3* | 74 ± 3* | 72 ± 4 | 98 ± 1 | 82 ± 13 | |
| Hi-Glu | 90–105 | 182 ± 5 | 109 ± 8*† | 111 ± 8*† | 109 ± 8*† | 98 ± 1 | 73 ± 9 |
| 105–120 | 179 ± 6 | 119 ± 10*† | 117 ± 9*† | 113 ± 9*† | 97 ± 1 | 66 ± 6 |
Values are means ±s.e.m. for six subjects. Plasma glucose oxidation is calculated as the product of Rd glucose and the percentage of infused [U-13C]-glucose tracer oxidized. Glycogen and direct or indirect oxidation via lactate is calculated as the difference between total CHO oxidation and plasma glucose oxidation.
Ra glucose and Rd glucose are calculated using the [6,6 2H2]-glucose tracer.
Glu trials significantly different from the Fast trial; P < 0.05.
Hi-Glu trial significantly different from the Lo-Glu trial; P < 0.05.
Glucose carbon recycling was similar in all conditions. At 105-120 min, recycling rates were 5 ± 3, 6 ± 6 and 6 ± 8 μmol kg−1 min−1 during Fast, Lo-Glu and Hi-Glu, respectively, representing 4-10% of total Ra glucose.
MCR was significantly higher with ingestion of glucose (Fast versus Lo-Glu) and was further increased when large amounts of glucose were ingested (Hi-Glu; Table 3). During Hi-Glu MCR was almost twice the MCR during Fast.
Oxidation of plasma glucose
Plasma glucose oxidation showed an identical pattern to that of the Ra and Rd glucose. Lo-Glu caused a 44% increase in plasma glucose oxidation compared with Fast and Hi-Glu produced a 126% increase. The rate of disappearance ([6,6-2H2]-glucose tracer) and the rate of oxidation ([U-13C]-glucose tracer) during the second hour of exercise are displayed in Fig. 5. Plasma oxidation was not significantly different from Rd glucose.
Figure 5. Rd glucose versus plasma glucose oxidation.
Values are means ±s.e.m. The rate of disappearance of glucose (Rd) and the rate of plasma glucose oxidation (Rox) during the 60-120 min period with ingestion of water (Fast; open circles and squares), a low dose of glucose (Lo-Glu; shaded circles and squares) or a high dose of glucose (Hi-Glu; filled circles and squares). The Rd presented is calculated from measurements of [6,6-2H2]-glucose with GC-MS.
Muscle glycogen oxidation
Furthermore, whole body muscle glycogen oxidation (total CHO oxidation minus plasma glucose oxidation) was not reduced by CHO ingestion. Figure 6 describes the shifts in substrate utilization as a result of glucose ingestion. It should be noted that glucose feedings, markedly reduced fat oxidation and increased plasma glucose oxidation but did not alter the rate of muscle glycogen (and lactate) oxidation.
Figure 6. The energetic contribution of substrates.
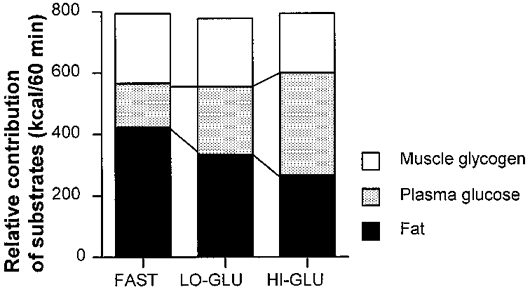
Values are means ±s.e.m. The energetic contribution of substrates during the 60-120 min period of exercise at 50% VO2,max with water ingestion (Fast), a low dose of glucose (Lo-Glu) or a high dose of glucose (Hi-Glu).
DISCUSSION
Effect of carbohydrate ingestion on muscle glycogen oxidation
Here we report that muscle glycogen oxidation during exercise, measured using an indirect tracer approach, was not reduced by glucose ingestion. Even when large amounts of glucose were ingested (180 g h−1) and plasma glucose and insulin levels were slightly, but significantly elevated, glycogen oxidation was similar to the fasted condition. This is in agreement with several direct measurements of muscle glycogen concentrations in muscle biopsies before and after continuous cycling exercise with or without carbohydrate ingestion (Fielding et al. 1985; Coyle et al. 1986; Flynn et al. 1987; Hargreaves & Briggs, 1988; Bosch et al. 1994). However, studies in runners showed that carbohydrate ingestion reduced the net glycogen breakdown in type I fibres and this might have been responsible for the observed improvements in endurance capacity (Tsintzas et al. 1995, 1996). Tsintzas & Williams (1998) suggested that continuous cycling would cause less marked changes in plasma glucose concentration and insulin concentrations compared with running and that these differences might play an important role in the effect on glycogen utilization to be observed. However, in the present study we observed a large insulin response to the carbohydrate feedings and also plasma glucose concentration was increased. Yet, this did not result in ‘glycogen sparing’ as proposed by Tsintzas & Williams (1998). Therefore, we feel that factors other than insulin are responsible for the discrepant findings in running (Tsintzas et al. 1995, 1996) and cycling (Fielding et al. 1985; Coyle et al. 1986; Flynn et al. 1987; Hargreaves & Briggs, 1988; Bosch et al. 1994).
It could be argued the exercise intensity in the present study was too low to increase glycogen breakdown and therefore the effects of glucose ingestion on glycogenolysis were small and not measurable. However, other studies (Coyle et al. 1986; Bosch et al. 1994) showed that exercise intensities of 70-75%V̇O2,max did not result in glycogen sparing with glucose ingestion. In addition, higher exercise intensities might have abolished the insulin effect and, therefore, it would be more likely that glycogen sparing at lower exercise intensities was observed.
Percentage of Rd oxidized
Another important finding of this study was that the rate of disappearance (Rd) of glucose was closely matched by the plasma glucose oxidation rate (Figs 4 and 5). The percentages of Rd glucose oxidized were very high in the present study (96-100%), but are in agreement with studies by Coggan et al. (1991, 1992), who observed that 93% of Rd glucose was oxidized during exercise at 70%V̇O2,max (Coggan et al. 1991). Others have found that lower percentages of Rd glucose were oxidized during exercise at intensities comparable with the intensity in the present study (50%V̇O2,max) (Colberg et al. 1994; Roberts et al. 1996; Friedlander et al. 1997). For instance Roberts et al. (1996) observed that only 33-38% of Rd glucose was oxidized and Colberg et al. (1994) reported 33-50% of Rd was oxidized. However, these studies were performed at lower absolute exercise intensities and did not prime the bicarbonate pool as was done in the present study and it is thus possible that a fair amount of 13CO2 was temporarily trapped in the bicarbonate pool which may have caused a marked underestimation of the true plasma glucose oxidation. Other studies in which a bicarbonate prime was given showed values more comparable with those in the present study (88-94%) (Coggan et al. 1992).
It has been reported that when using a 13C-tracer for studying fatty acid metabolism part of the tracer may be trapped in exchange reactions with the tricarboxylic acid (TCA) cycle (Sidossis et al. 1995; Schrauwen et al. 1998). For example, some 13C-label may be incorporated into the glutamate-glutamine pool via α-ketoglutarate, or into phosphoenolpyruvate via oxaloacetate. This label fixation results in a decreased recovery of label in the expired gases and in order to correct for this loss, the acetate correction factor has been proposed (Sidossis et al. 1995). The label loss is dependent on metabolic rate and at high oxygen uptakes (38-39 ml kg−1 in the present study) recovery of the [1-14C]-acetate label has been shown to be 85-90% (Sidossis et al. 1995). Besides that, [U-13C]-glucose has six labelled carbons of which two will appear directly in 13CO2 and, therefore, do not enter the TCA cycle. Only two-thirds (66%) of the glucose carbons is subject to label fixation. Therefore the recovery of carbons from [U-13C]-glucose will be higher than the recovery of [1-13C]-palmitate (Sidossis et al. 1995) or [U-13C]-palmitate (Schrauwen et al. 1998), explaining why we find that 96-100% of the infused glucose tracer is oxidized. The small difference from 100% may be explained by the acetate correction factor implying that all glucose molecules disappearing from the plasma might have been oxidized both in the presence and absence of glucose ingestion.
Plasma glucose turnover and the rate of ingestion
Plasma glucose has been shown to be an important substrate during exercise, especially during the later stages when muscle glycogen levels are reduced (Coggan, 1991). Here we observed that plasma glucose contributed 19% to energy expenditure during fasting and this value increased to 42% during Hi-Glu ingestion (Fig. 6). During Hi-Glu ingestion, plasma glucose was the most important substrate from a quantitative point of view.
Glucose turnover was markedly increased by the glucose ingestion as evidenced by increased Ra and Rd glucose, increased plasma glucose oxidation and metabolic clearance rate (MCR). The Lo-Glu ingestion increased Ra glucose by 44% and Hi-Glu ingestion increased Ra glucose by 126%. However, whereas glucose ingestion during Hi-Glu was five times larger than during Lo-Glu, the Ra glucose increased only less than twofold (72 μmol kg−1 min−1 during Lo-Glu and 109-113 μmol kg−1 min−1 during Hi-Glu). Mean ingestion during the second hour of exercise was 0.3 g min−1 in the Lo-Glu and 1.5 g min−1 in the Hi-Glu trials. The total rates of appearance of glucose were 0.84 and 1.36 g min−1, respectively, suggesting that with the Lo-Glu feeding the liver was still producing glucose whereas with the Hi-Glu feeding it is theoretically possible that hepatic glucose production was completely suppressed. Dual tracer studies with infusion of one glucose tracer and ingestion of another are needed to distinguish between gut-derived Ra and hepatic glucose output. Without glucose ingestion the hepatic glucose production was approximately 0.5 g min−1 indicating that the liver during the second hour of exercise may have produced about 30 g glucose. This is a relatively large amount since it is believed that the liver contains approximately 80 g of glycogen (Hultman & Nilsson, 1971). Glucose ingestion during exercise may reduce hepatic glucose production (i.e. spare liver glycogen) at 70%V̇O2,max as shown by Bosch et al. (1994) and McConell et al. (1994).
Limitations of exogenous carbohydrate oxidation
These results also indicate that, with large doses of ingested glucose (360 g in the 2 h exercise period), not all the glucose appears in the plasma. This is in agreement with previous suggestions that the rate of exogenous glucose oxidation may be limited by the rate of digestion, absorption, maximal hepatic glucose output and subsequent transport of glucose into the systemic blood supply rather than by glucose uptake and oxidation by the muscle (Hawley et al. 1994). Several studies showed that oral carbohydrate oxidation is limited to about 1 g min−1 (Hawley et al. 1992). Even when large amounts of carbohydrate were ingested oxidation rates did not exceed 1 g min−1 (Rehrer et al. 1992; Wagenmakers et al. 1993).
Effects of carbohydrate ingestion on fat and carbohydrate oxidation
Glucose ingestion also markedly suppressed fat oxidation compared with fasting and this effect was dose dependent; Hi-Glu suppressed fat oxidation more than Lo-Glu. The lower rates of fat oxidation may be at least in part insulin mediated (Fig. 1). Insulin has been shown to be a potent inhibitor of lipolysis and Ra FFA (Montain et al. 1991; Campbell et al. 1992; Horowitz et al. 1997). Here, higher insulin levels after glucose ingestion reduced whole body lipolysis as indirectly indicated by lower plasma glycerol and FFA concentrations (Fig. 1). Decreased FFA availability and higher plasma insulin concentrations along with an increased glycolytic flux have been shown to reduce FFA oxidation at rest (Sidossis & Wolfe, 1996) and during exercise (Coyle et al. 1997). Although in this study we observed that glucose ingestion during exercise increased total CHO oxidation, McConell et al. (1994) and Bosch et al. (1994) did not observe increased CHO oxidation rates with CHO ingestion during exercise. This may, in part, be explained by the differences in the exercise intensity and possibly the difference in plasma insulin concentration, which may have been higher in the present study. Whereas in their studies the exercise intensities were 70%V̇O2,max, we employed an exercise intensity of 50%V̇O2,max. At low to moderate exercise intensities (50%V̇O2,max) glucose utilization may be enhanced by CHO ingestion whereas during more intense exercise (> 70%V̇O2,max) exogenous CHO simply seems to substitute for endogenously produced glucose, with no overall increase in CHO oxidation (Bosch et al. 1994; McConell et al. 1994).
Gluconeogenesis (glucose carbon recycling)
When measured by GC-IRMS [U-13C]-glucose carbon may recycle during the process of gluconeogenesis and this may lead to an underestimate of the Ra of glucose. The reason for this is the following. One molecule of uniformly labelled glucose produces two molecules of uniformly labelled pyruvate. This pyruvate may be converted into lactate or alanine (predominantly lactate) which are precursors for gluconeogenesis and this may lead to the incorporation of label into newly synthezised glucose. Fifty percent of the carbon atoms will be 13C in the newly synthezised glucose. In GC-combustion-IRMS analysis the whole molecule is oxidized to CO2 prior to the enrichment measurement and therefore the increase in ratio 13C/12C of all carbons of the glucose molecule is measured. Tracer dilution measurements by GC-combustion-IRMS analyses of this tracer therefore exclude gluconeogenesis and consequently represent a possible underestimation of the true Ra of glucose. It is believed that a more appropriate method of measuring total Ra glucose is the use of a [6,6-2H2]-glucose tracer which measures total glucose production when the enrichment is measured by GC-MS as the tracer atoms do not recycle during gluconeogenesis (Wolfe, 1992). To compare the above mentioned methods we also infused a [6,6-2H2]-glucose tracer. The difference between the two methods theoretically gives an estimate of glucose carbon recycling and a rough estimate of gluconeogenesis (Tserng & Kalhan, 1983). In this study we found that Ra and Rd glucose were similar, regardless of the tracer used (i.e. [U-13C]-glucose measured by GC-IRMS or [6,6-2H2]-glucose measured by GC-MS) (Table 3). In Fig. 4, Ra glucose calculated from the [6,6-2H2]-glucose tracer is plotted against the Ra glucose calculated from the [U-13C]-glucose tracer (total enrichment). This figure shows that, generally, Ra glucose calculated from the [U-13C]-glucose tracer gave slightly lower numbers, which is in agreement with the expectations. The recycling rate of 13C was low (∼4-10% of total Ra glucose) and was not reduced by the glucose feedings, suggesting that independently of the amount of glucose ingested, gluconeogenesis was minimal. These low rates of recycling may have resulted from low precursor availability (i.e. low lactate concentrations as observed in previous studies with similar designs (Jeukendrup et al. 1996a, c, 1997b). Gluconeogenesis may also be lower in trained individuals (Coggan, 1997) and since the training level of the subjects in the present study was very high, the rates of gluconeogenesis may have been very low. Friedlander et al. (1997) also suggested that adrenoceptors were downregulated in response to endurance training and this may be a mechanism for the blunted gluconeogenesis. With the high training level of the athletes in the present study this could be an explanation for the low levels of glucose carbon recycling as well.
General overview: effect of carbohydrate feedings on substrate metabolism
The results of the present study indicate that glucose ingestion during exercise leads to a decreased fat oxidation, partly because of an inhibition of lipolysis (Horowitz et al. 1997) and an increased carbohydrate oxidation. The increased carbohydrate oxidation was explained by an accelerated plasma glucose turnover. The appearance of glucose in the blood stream increased with carbohydrate feedings and this increase was dose dependent. However, at very high ingestion rates the appearance of glucose in plasma levelled off.
The increased rate of appearance of glucose did not lead to a large increase in the plasma glucose concentration because the rate of disappearance is also increased. Higher glucose concentrations may have been partly responsible for the increased glucose uptake during Hi-Glu, simply by mass action. However, the augmented glucose uptake was mainly explained by an increased clearance of glucose from the bloodstream. This seems to suggest that glucose transport was activated by mechanisms involving GLUT4 translocation, activation of the oxidative enzymes (phosphofructokinase (PFK) and/or activation of the pyruvate dehydrogenase (PDH) complex).
The glucose that disappeared from the plasma (and most likely was taken up by active skeletal muscle) was oxidized and not used for glycogen synthesis. Muscle glycogen oxidation was not reduced by the glucose feedings. Gluconeogenesis in the liver was negligible in all conditions.
In summary, a method was developed to measure Ra glucose and plasma glucose oxidation by using small amounts of a [U-13C]-glucose tracer and measuring plasma tracer enrichment with GC-IRMS. The method seems to be valid to make estimates of glucose turnover and for indirect estimates of muscle glycogen consumption at whole body level. The results of this study indicate that carbohydrate feeding during cycling exercise at 50%V̇O2,max in highly trained subjects decreased fat oxidation and increased the Ra of glucose, the MCR and plasma glucose oxidation. Muscle glycogen oxidation was not reduced even when large amounts of glucose were ingested and non-oxidative glucose disposal was negligible. A large percentage (96-100%) of glucose disappearing from the plasma was oxidized. Comparison of Ra glucose calculated from [6,6-2H2]- and [U-13C]-glucose tracers revealed that only a small quantity of glucose carbons is recycled in the process of gluconeogenesis.
Acknowledgments
This study was supported by a NOVARTIS nutrition research grant (NOVARTIS Nutrition, Bern, Switzerland). We also greatly appreciate the co-operation of the subjects and the excellent technical and analytical support of Mr Frank van de Vegt and Mr Joan Senden.
References
- Bjorkman O, Sahlin K, Hagenfeldt L, Wahren J. Influence of glucose and fructose ingestion on the capacity for long term exercise in well trained men. Clinical Physiology. 1984;4:483–494. doi: 10.1111/j.1475-097x.1984.tb00134.x. [DOI] [PubMed] [Google Scholar]
- Bosch AN, Dennis SC, Noakes TD. Influence of carbohydrate ingestion on fuel substrate turnover and oxidation during prolonged exercise. Journal of Applied Physiology. 1994;76:2364–2372. doi: 10.1152/jappl.1994.76.6.2364. [DOI] [PubMed] [Google Scholar]
- Campbell PJ, Carlson MG, Hill JO, Nurjhan N. Regulation of free fatty acid metabolism by insulin in humans: role of lipolysis and reesterification. American Journal of Physiology. 1992;26:E1063–1069. doi: 10.1152/ajpendo.2006.263.6.E1063. [DOI] [PubMed] [Google Scholar]
- Coggan AR. Plasma glucose metabolism during exercise in humans. Sports Medicine. 1991;11:102–124. doi: 10.2165/00007256-199111020-00003. [DOI] [PubMed] [Google Scholar]
- Coggan AR. Plasma glucose metabolism during exercise: effect of endurance training in humans. Medicine and Science in Sports and Exercise. 1997;29:620–627. doi: 10.1097/00005768-199705000-00006. [DOI] [PubMed] [Google Scholar]
- Coggan AR, Coyle EF. Reversal of fatigue during prolonged exercise by carbohydrate infusion or ingestion. Journal of Applied Physiology. 1987;63:2388–2395. doi: 10.1152/jappl.1987.63.6.2388. [DOI] [PubMed] [Google Scholar]
- Coggan AR, Coyle EF. Effect of carbohydrate feedings during high-intensity exercise. Journal of Applied Physiology. 1988;65:1703–1709. doi: 10.1152/jappl.1988.65.4.1703. [DOI] [PubMed] [Google Scholar]
- Coggan AR, Kohrt WM, Spina RJ, Kirwan JP, Bier DM, Holloszy JO. Plasma glucose kinetics during exercise in subjects with high and low lactate thresholds. Journal of Applied Physiology. 1992;73:1873–1880. doi: 10.1152/jappl.1992.73.5.1873. [DOI] [PubMed] [Google Scholar]
- Coggan AR, Spina RJ, Kohrt WM, Bier DM, Holloszy JO. Plasma glucose kinetics in a well trained cyclist fed glucose throughout exercise. International Journal of Sport Nutrition. 1991;1:279–288. doi: 10.1123/ijsn.1.3.279. [DOI] [PubMed] [Google Scholar]
- Colberg SR, Casazza GA, Horning MA, Brooks GA. Increased dependence on blood glucose in smokers during rest and sustained exercise. Journal of Applied Physiology. 1994;76:26–32. doi: 10.1152/jappl.1994.76.1.26. [DOI] [PubMed] [Google Scholar]
- Coyle EF, Coggan AR, Hemmert MK, Ivy JL. Muscle glycogen utilization during prolonged strenuous exercise when fed carbohydrate. Journal of Applied Physiology. 1986;61:165–172. doi: 10.1152/jappl.1986.61.1.165. [DOI] [PubMed] [Google Scholar]
- Coyle EF, Hagberg JM, Hurley BF, Martin WH, Ehsani AA, Holloszy JO. Carbohydrate feeding during prolonged strenuous exercise. Journal of Applied Physiology. 1983;55:230–235. doi: 10.1152/jappl.1983.55.1.230. [DOI] [PubMed] [Google Scholar]
- Coyle EF, Jeukendrup AE, Wagenmakers AJM, Saris WHM. Fatty acid oxidation is directly regulated by carbohydrate metabolism during exercise. American Journal of Physiology. 1997;273:E268–275. doi: 10.1152/ajpendo.1997.273.2.E268. [DOI] [PubMed] [Google Scholar]
- Craig H. Isotopic standards for carbon and oxygen and correction factors. Geochimica Cosmochimica Acta. 1957;12:133–149. [Google Scholar]
- Fielding RA, Costill DL, Fink WJ, King DS, Hargreaves M, Kovaleski JE. Effect of carbohydrate feeding frequencies and dosage on muscle glycogen use during exercise. Medicine and Science in Sports and Exercise. 1985;17:472–476. doi: 10.1249/00005768-198508000-00012. [DOI] [PubMed] [Google Scholar]
- Flynn MG, Costill DL, Hawley JA, Fink WJ, Neufer PD, Fielding RA, Sleeper MD. Influence of selected carbohydrate drinks on cycling performance and glycogen use. Medicine and Science in Sports and Exercise. 1987;19:37–40. [PubMed] [Google Scholar]
- Friedlander AL, Casazza GA, Ma H, Huie MJ, Brooks GA. Training induced alterations of glucose flux in men. Journal of Applied Physiology. 1997;82:1360–1369. doi: 10.1152/jappl.1997.82.4.1360. [DOI] [PubMed] [Google Scholar]
- Gutmann I, Wahlefeld AW. L-(+)-Lactate, determination with lactate dehydrogenase and NAD. In: Bergmeyer HU, editor. Methods in Enzymatic Analysis. 2. New York: Academic Press; 1974. pp. 1464–1468. [Google Scholar]
- Hargreaves M, Briggs CA. Effect of carbohydrate ingestion on exercise metabolism. Journal of Applied Physiology. 1988;65:1553–1555. doi: 10.1152/jappl.1988.65.4.1553. [DOI] [PubMed] [Google Scholar]
- Hargreaves M, Costill DL, Coggan A, Fink WJ, Nishibata I. Effect of carbohydrate feedings on muscle glycogen utilisation and exercise performance. Medicine and Science in Sports and Exercise. 1984;16:219–222. [PubMed] [Google Scholar]
- Hawley JA, Bosch AN, Weltan SM, Dennis SD, Noakes TD. Effects of glucose ingestion or glucose infusion on fuel substrate kinetics during prolonged exercise. European Journal of Applied Physiology. 1994;68:381–389. doi: 10.1007/BF00843733. [DOI] [PubMed] [Google Scholar]
- Hawley JA, Dennis SC, Noakes TD. Oxidation of carbohydrate ingested during prolonged endurance exercise. Sports Medicine. 1992;14:27–42. doi: 10.2165/00007256-199214010-00003. [DOI] [PubMed] [Google Scholar]
- Horowitz JF, Mora-Rodriguez R, Byerley LO, Coyle EF. Lipolytic suppression following carbohydrate ingestion limits fat oxidation during exercise. American Journal of Physiology. 1997;273:E768–775. doi: 10.1152/ajpendo.1997.273.4.E768. [DOI] [PubMed] [Google Scholar]
- Hultman E, Nilsson LH. Liver glycogen in man: effects of different diets and muscular exercise. In: Pernow B, Saltin B, editors. Muscle Metabolism During Exercise. II. New York: Plenum; 1971. pp. 143–151. [Google Scholar]
- Jeukendrup AE, Borghouts L, Saris WHM, Wagenmakers AJM. Reduced oxidation rates of orally ingested glucose during exercise after low CHO intake and low muscle glycogen. Journal of Applied Physiology. 1996a;81:1952–1957. doi: 10.1152/jappl.1996.81.5.1952. [DOI] [PubMed] [Google Scholar]
- Jeukendrup AE, Brouns F, Wagenmakers AJM, Saris WHM. Carbohydrate feedings improve 1 H time trial cycling performance. International Journal of Sports Medicine. 1997a;18:125–129. doi: 10.1055/s-2007-972607. [DOI] [PubMed] [Google Scholar]
- Jeukendrup AE, Mensink M, Saris WHM, Wagenmakers AJM. Exogenous glucose oxidation during exercise in endurance-trained and untrained subjects. Journal of Applied Physiology. 1997b;82:835–840. doi: 10.1152/jappl.1997.82.3.835. [DOI] [PubMed] [Google Scholar]
- Jeukendrup AE, Saris WHM, Schrauwen P, Brouns F, Wagenmakers AJM. Metabolic availability of medium chain triglycerides co-ingested with carbohydrates during prolonged exercise. Journal of Applied Physiology. 1995;79:756–762. doi: 10.1152/jappl.1995.79.3.756. [DOI] [PubMed] [Google Scholar]
- Jeukendrup AE, Saris WHM, Van Diesen R, Brouns F, Wagenmakers A J M. Effect of endogenous carbohydrate availability on oral medium-chain triglyceride oxidation during prolonged exercise. Journal of Applied Physiology. 1996b;80:949–954. doi: 10.1152/jappl.1996.80.3.949. [DOI] [PubMed] [Google Scholar]
- Jeukendrup AE, Wagenmakers AJM, Brouns F, Halliday D, Saris WHM. Effects of carbohydrate (CHO) and fat supplementation on CHO metabolism during prolonged exercise. Metabolism. 1996c;45:915–921. doi: 10.1016/s0026-0495(96)90169-9. 10.1016/S0026-0495(96)90169-9. [DOI] [PubMed] [Google Scholar]
- Kuipers H, Verstappen FTJ, Keizer HA, Geurten P, Van Kranenburg G. Variability of aerobic performance in the laboratory and its physiologic correlates. International Journal of Sports Medicine. 1985;6:197–201. doi: 10.1055/s-2008-1025839. [DOI] [PubMed] [Google Scholar]
- McConell G, Fabris S, Proietto J, Hargreaves M. Effect of carbohydrate ingestion on glucose kinetics during exercise. Journal of Applied Physiology. 1994;77:1537–1541. doi: 10.1152/jappl.1994.77.3.1537. [DOI] [PubMed] [Google Scholar]
- MacRae HH-S, Noakes TD, Dennis SC. Effects of endurance training on lactate removal by oxidation and gluconeogenesis during exercise. Pflügers Archiv. 1995;430:964–970. doi: 10.1007/BF01837410. [DOI] [PubMed] [Google Scholar]
- Montain SJ, Hopper MK, Coggan AR, Coyle EF. Exercise metabolism at different time intervals after a meal. Journal of Applied Physiology. 1991;70:882–888. doi: 10.1152/jappl.1991.70.2.882. [DOI] [PubMed] [Google Scholar]
- Murray R, Eddy DE, Murray TW, Seifert JG, Paul GL, Halaby GA. The effect of fluid and carbohydrate feedings during intermittent cycling ecxercise. Medicine and Science in Sports and Exercise. 1987;19:597–604. [PubMed] [Google Scholar]
- Péronnet F, Massicotte D. Table of nonprotein respiratory quotient: An update. Canadian Journal of Sport Science. 1991;16:23–29. [PubMed] [Google Scholar]
- Rehrer NJ, Brouns F, Beckers EJ, ten Hoor F, Saris W H M. Gastric emptying with repeated drinking during running and bicycling. International Journal of Sports Medicine. 1990;11:238–243. doi: 10.1055/s-2007-1024799. [DOI] [PubMed] [Google Scholar]
- Rehrer NJ, Wagenmakers AJM, Beckers EJ, Halliday D, Leiper JB, Brouns F, Maugham RJ, Westerterp K, Saris WHM. Gastric emptying, absorption and carbohydrate oxidation during prolonged exercise. Journal of Applied Physiology. 1992;72:468–475. doi: 10.1152/jappl.1992.72.2.468. [DOI] [PubMed] [Google Scholar]
- Roberts AC, Reeves JT, Butterfield GE, Mazzeo RS, Sutton JR, Wolfel EE, Brooks GA. Altitude and β-blockade augment glucose utilisation during submaximal exercise. Journal of Applied Physiology. 1996;80:605–615. doi: 10.1152/jappl.1996.80.2.605. [DOI] [PubMed] [Google Scholar]
- Schrauwen P, van Aggel-Leijssen DPC, van Marken Lichtenbelt WD, van Baak MA, Gijsen AP, Wagenmakers AJM. Validation of the [1,2-13C]-acetate recovery factor for correction of [U-13C]-palmitate oxidation rates. The Journal of Physiology. 1998;513:215–223. doi: 10.1111/j.1469-7793.1998.215by.x. [DOI] [PMC free article] [PubMed] [Google Scholar]
- Sidossis LS, Coggan AR, Gastadelli A, Wolfe RR. Pathways of free fatty acid oxidation in human subjects: implications for tracer studies. Journal of Clinical Investigation. 1995;95:278–284. doi: 10.1172/JCI117652. [DOI] [PMC free article] [PubMed] [Google Scholar]
- Sidossis LS, Wolfe RR. Glucose and insulin-induced inhibition of fatty acid oxidation: the glucose-fatty acid cycle reversed. American Journal of Physiology. 1996;270:E733–738. doi: 10.1152/ajpendo.1996.270.4.E733. [DOI] [PubMed] [Google Scholar]
- Steele R. Influences of glucose loading and of injected insulin on hepatic glucose output. Annals of the New York Academy of Sciences. 1959;82:420–430. doi: 10.1111/j.1749-6632.1959.tb44923.x. [DOI] [PubMed] [Google Scholar]
- Tserng K-Y, Kalhan SC. Estimation of glucose carbon recycling and glucose turnover with [U-13C]-glucose. American Journal of Physiology. 1983;245:E476–482. doi: 10.1152/ajpendo.1983.245.5.E476. [DOI] [PubMed] [Google Scholar]
- Tsintzas K, Williams C. Human muscle glycogen metabolism during exercise; effect of carbohydrate supplementation. Sports Medicine. 1998;25:7–23. doi: 10.2165/00007256-199825010-00002. [DOI] [PubMed] [Google Scholar]
- Tsintzas OK, Williams C, Boobis L, Greenhaff P. Carbohydrate ingestion and glycogen utilization in different muscle fibre types in man. The Journal of Physiology. 1995;489:243–250. doi: 10.1113/jphysiol.1995.sp021046. [DOI] [PMC free article] [PubMed] [Google Scholar]
- Tsintzas O-K, Williams C, Boobis L, Greenhaff P. Carbohydrate ingestion and single muscle fiber glycogen metabolism during prolonged running in men. Journal of Applied Physiology. 1996;81:801–809. doi: 10.1152/jappl.1996.81.2.801. [DOI] [PubMed] [Google Scholar]
- Wagenmakers AJM, Brouns F, Saris WHM, Halliday D. Oxidation rates of orally ingested carbohydrates during prolonged exercise in man. Journal of Applied Physiology. 1993;75:2774–2780. doi: 10.1152/jappl.1993.75.6.2774. [DOI] [PubMed] [Google Scholar]
- Wolfe RR. Radioactive and Stable Isotope Tracers in Biomedicine. New York: Wiley-Liss; 1992. [Google Scholar]