

Abstract
Excitatory junction currents (EJCs) were used to measure ATP release; noradrenaline (NA) oxidation currents and fractional overflow of labelled NA, [3H]NA, were used to monitor the release of endogenous and exogenous NA, respectively, from post-ganglionic sympathetic nerves of rat tail artery.
During nerve stimulation with 100 pulses at 5-20 Hz the EJCs initially grew in size (maximally by 23%, at 2–10 Hz), and then depressed, maximally by 68% at 20 Hz.
The peak amplitude of NA oxidation currents in response to nerve stimulation with 100 pulses at 2–20 Hz grew in size with frequency, while the area was independent of frequency and roughly constant.
The size of the NA oxidation currents evoked by nerve stimulation with 4–100 pulses at 20 Hz grew linearly with train length between pulses 4–16. Between pulses 20–100 there was a train length-dependent depression of the signal.
Fractional overflow of [3H]NA in response to nerve stimulation with 5–100 pulses at 20 Hz behaved similarly to the EJCs. It initially grew roughly linearly between pulses 5–25, and then showed a dramatic depression similar to that of the EJCs.
The α2-adrenoceptor antagonists rauwolscine and yohimbine increased the overflow of [3H]NA and the amplitude of NA oxidation currents, but not that of the EJCs.
It is concluded that during high-frequency stimulation (i) the release of ATP and NA is first briefly facilitated then markedly depressed, (ii) facilitation and depression of the two transmitters are similar in magnitude and time course, and (iii) α2-adrenoceptor antagonists differentially modify EJCs and the NA signals. The results obtained in the absence of drugs are compatible with the hypothesis that ATP and NA are released in parallel, while the effects of α2-adrenoceptor antagonists seem to suggest dissociated release.
In many synapses, when the presynaptic axon is stimulated with a train of pulses at sufficiently high frequencies, neurotransmitter output initially increases (facilitation) and then progressively decreases (depression) as stimulation is continued. Facilitation and depression of synaptic transmission have been extensively studied in the skeletal neuromuscular junction (for reviews, see Martin, 1977; Atwood & Wojtowicz, 1986; Zucker, 1989). Numerous electrophysiological studies have shown that facilitation and depression are closely related to the initial probability of release and to the amount of transmitter previously released (Thies, 1965; Msghina et al. 1998). Furthermore, it has been shown that synaptic facilitation or depression can occur in the absence of changes in the presynaptic action potential (Betz, 1970), or changes in the sensitivity of postsynaptic membrane (Otsuka et al. 1962). In synapses where these conditions have been demonstrated, it is generally assumed that facilitation and depression of postsynaptic potentials or currents is primarily due to increased or decreased output of neurotransmitter from presynaptic terminals.
Sympathetic nerves are useful models for studies of activity-dependent changes in transmitter release because they allow the study of facilitation and depression of two or more substances that are released from the same nerve terminal. Besides their principal transmitter noradrenaline (NA), sympathetic nerves store and release a nucleotide co-transmitter, generally assumed to be ATP, and one or more neuropeptide transmitters (reviewed in Stjärne, 1989). Currently, it is still unclear whether ATP and NA are released in parallel from the same, or from different neuronal sites (Ellis & Burnstock, 1989; von Kügelgen & Starke, 1991; Msghina et al. 1992; Msghina & Stjärne, 1993; Gonçalves et al. 1996; Brock et al. 1997). The present work addresses this issue, i.e. the question of whether sympathetic nerves store the co-transmitters ATP and NA together and release them in parallel, by studying the facilitation and depression of the release of ATP and NA under different experimental conditions.
METHODS
Male Sprague-Dawley rats (180-300 g) were humanely killed by a sudden stunning blow to the head, after which they were bled to death. Two to four centimetres of the proximal region of the central tail artery was dissected out, carefully cleaned of excessive connective tissue and pinned to the Sylgard layer covering the bottom of a 2-3 ml Perspex organ bath. The bath was perfused at 1 ml min−1 with modified Tyrode solution of the following composition (mmol l−1): 136.9 NaCl, 2.7 KCl, 1.3 CaCl2, 0.5 MgCl2, 5.6 glucose and 20 Tris (pH 7.4); the solution was gassed with 100% O2 and the bath temperature held at 35-37°C. Prazosin (0.1-1 μmol l−1) was added to block neurogenic contractions.
Nerve stimulation
In the electrophysiological and amperometric experiments, a tightly fitting suction electrode into which the proximal end of the tail artery was drawn was used for electrical stimulation of the post-ganglionic sympathetic nerves, via an NL 800 constant-current (Neurolog), or a DS2 constant-voltage (Digitimer) isolation unit. Rectangular pulses (0.1-20 Hz, 0.3 ms, 0.1-0.4 mA) were delivered between chlorided silver wires inside and outside polyethylene tubing. To avoid artifacts disturbing the amperometric detection of the NA oxidation currents, electrical stimulation was triggered by the ‘Biopulse’ (see below) and applied in the interval between signal recordings. In the overflow experiments, field stimulation (120 V, 0.5 ms) with platinum wire electrodes positioned on the two sides of the preparation was applied.
Electrophysiological analysis of ATP release
Extracellularly recorded excitatory junction currents (EJCs) were used to monitor ATP release on a pulse-by-pulse basis (Brock & Cunnane, 1988). The recording electrode, a glass micropipette (tip diameter, 80-150 μm), was gently applied to the exposed surface of the tail artery and continuously perfused at a rate of 0.1-0.5 μl min−1 using a peristaltic pump (Minipuls 3). A sintered Ag-AgCl pellet in the bath served as indifferent electrode to the Ag-AgCl wire inside the recording electrode. The electrical activity was recorded through an AC amplifier (Neurolog NL 104, low-frequency cut-off at 0.1 Hz), fed through a low-pass filter (Neurolog NL 125) with cut-off frequency at 1-5 kHz, and stored on magnetic tape (Racal Store 4). A system based on an IBM AT personal computer and a data translation DT2801A analog-to-digital converter card was used to digitize the data at 1.5-4 kHz, 512 points. The amplitude and duration of the EJCs was analysed by computer and selected traces were measured directly on the oscilloscope screen for verification of the computer measurements.
Electrochemical analysis of NA release
The method used, differential pulse amperometry (DPA), has been described in detail elsewhere (Gonon et al. 1993). Briefly, a conventional three-electrode system consisting of an electrochemically treated carbon fibre electrode (working electrode), a stainless-steel wire (auxiliary electrode) and a Ag-AgCl wire (reference electrode) was connected to an electrochemical detector (‘Biopulse’, Solea Tacussel, France). Before the start of each experiment the active part of the working electrode, a pyrolytic carbon fibre (50-100 μm in length, and 8 μm in diameter), was electrochemically treated by applying an anodic potential of triangular waveform (2.0 V, 70 Hz for 20 s). The technique does not measure NA release per se, but monitors the difference between the amount of NA released to, and that removed from, sites near the recording electrode. To estimate the contribution of different pulses within a train (of 100 pulses) to the cumulative response, we recorded different stimulus epochs (trains of 4, 8, 12 and 16, and trains of 20, 40, 60, 80 and 100) in ascending and descending order.
Overflow of [3H]noradrenaline ([3H]NA)
The method for perfusion and estimation of the evoked release of [3H]NA has been described in detail elsewhere (Stjärne & Brundin, 1975; Alberts et al. 1981). Briefly, preparations about 3 cm in length were pre-incubated at 37°C with 0.67 μmol l−1 1-[7, 8-3H]NA (specific activity 30 Ci mmol−1) for 40 min in 1 ml Tyrode solution containing 113 μmol l−1 sodium ascorbate. After washing for 10 min, the vessels were mounted in a cylindrical chamber under a resting tension of 5 mN and perfused at 1 ml min−1 with Tyrode solution of the composition described above, except that prazosin was omitted and cocaine (3 μmol l−1) and corticosterone (30 μmol l−1) were added to block neuronal and extraneuronal uptake. The effluent was collected in 4 min periods. After adding 2.5 ml Instagel (Packard Instruments) the [3H] activity of an aliquot of the effluent and of the tissue extract was determined by counting in a Packard liquid scintillation spectrometer.
Each experiment contained five or six stimulation periods (S1-S5, or S1-S6). The nerves were stimulated with 5-150 pulses at 20 Hz. Two stimulation protocols were used. In the first the total number of pulses was kept constant: 150 pulses were applied either in one sequence or as subtrains (5 pulses × 30, 15 pulses × 10, 25 pulses × 6, or 50 pulses × 3), separated by 12 s. In the second protocol the number of pulses varied and 20, 40, 60, 80 or 100 pulses were applied alternately in ascending and descending order.
Statistics
The data were statistically analysed by one-way analysis of variance (ANOVA) followed by the Fischer test or Student's t test for paired or unpaired observations, as appropriate. The results are expressed as means ±s.e.m.; P < 0.05 was considered significant.
Drugs and radioactive tracer
α, β-Methylene ATP, cocaine, corticosterone, yohimbine and tetrodotoxin were all from Sigma, and prazosin was from Pfizer. All substances were prepared as concentrated stock solution in distilled water (except for prazosin, which was dissolved in 50% ethanol and 50% distilled water) and diluted in Tyrode solution as required. [3H]NA was obtained from Amersham International, UK.
RESULTS
Frequency and train length dependency of the EJCs
In the absence of drugs the extracellularly recorded EJCs fluctuated in amplitude, and could be either negative- or positive-going (Fig. 1A). Negative- and positive-going EJCs are readily abolished by 10 μmol l−1 of the P2X-purinoceptor desensitizing agent α, β-methylene ATP and 300 μmol l−1 of the P2X antagonist suramin, and are caused by the release of ATP from sites inside and outside the recording electrode, respectively (Stjärne & Stjärne, 1989). Addition of 0.1-1 μmol l−1 tetrodotoxin inside the recording electrode, as was routinely done in this study, changed the shape of the nerve terminal spike from triphasic to monophasic, and abolished the negative-going EJCs (Fig. 1B).
Figure 1. Frequency-dependent facilitation and depression of EJCs.
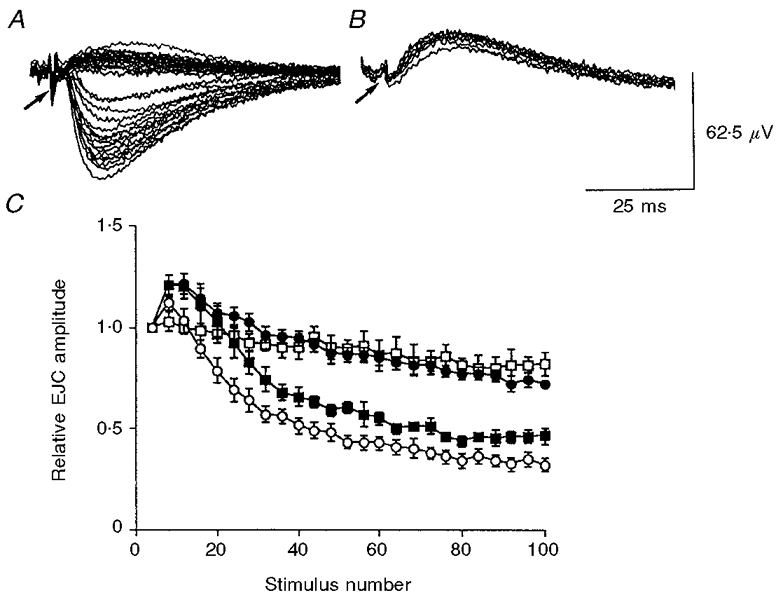
A and B, selected tracings of EJCs and nerve terminal spike (NTS, arrow) during nerve stimulation at 0.1 Hz in the absence of drugs (A) and 15 min after addition 0.1 μmol l−1 tetrodotoxin (B) inside the recording electrode. Tetrodotoxin, when applied only inside the recording electrode, caused the NTS to become monophasic and abolished negative-going EJCs. C, facilitation and depression of EJCs during nerve stimulation with 100 pulses at 0.1 Hz (n = 4, □), 2 Hz (n = 6, •), 10 Hz (n = 5, ▪) and 20 Hz (n = 10, ○). The EJCs are shown averaged in groups of four, and normalized to the mean of the first four EJCs at each frequency. Values shown are means ±s.e.m.
During nerve stimulation with 100 pulses at 0.5-20 Hz the EJCs initially showed moderate facilitation, but became markedly depressed as stimulation continued. Facilitation enhanced the amplitude of the EJCs maximally by 22.5 ± 5.3% at 2-10 Hz (P ≤ 0.01). The magnitude of depression increased with frequency and was maximal at 20 Hz (67.4 ± 5.8%; P ≤ 0.01). These are shown in Fig. 1C for frequencies of 0.1, 2, 10 and 20 Hz (n ≥ 4). The amplitude of the averaged EJCs (100 pulses) during nerve stimulation at 2-20 Hz was inversely related to frequency; at 20 Hz it was 60.1 ± 3.4% of that at 2 Hz (n = 5; P ≤ 0.01; shown in Fig. 4B).
Figure 4. Frequency and train length dependency of NA oxidation currents.
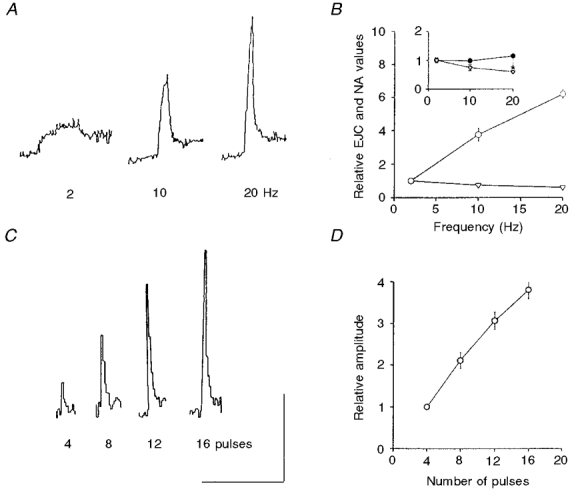
A, original recordings showing NA oxidation currents evoked by nerve stimulation with 100 pulses at 2, 10 and 20 Hz. B, pooled data from 4 experiments showing the amplitudes of the NA oxidation currents (○) and EJCs (▿) caused by nerve stimulation with 100 pulses at 2, 10 and 20 Hz. The inset shows the area of the NA oxidation currents from same data (•); the amplitude of EJCs (▿) is also shown to aid comparison. C, original recordings of NA oxidation currents in response to 4, 8, 12 and 16 pulses at 20 Hz. D, pooled data (n = 8) showing the train length dependency of NA oxidation currents during nerve stimulation with 4-16 pulses at 20 Hz. Horizontal bar: 80 s in A and 52 s in C; vertical bar: 0.025 nA in A and 0.05 nA in C. Values shown are means ±s.e.m.
During high-frequency stimulation (100-700 pulses, 20 Hz), there was often a summation of the first few EJCs that gave rise to a slow positive-going deflection on which individual EJCs were superimposed (Fig. 2A and Cc). As shown in Fig. 2C, α, β-methylene ATP (10 μmol l−1) abolished both the EJCs and the slow wave within 15 min after bath application. After the end of the high-frequency stimulation the EJCs rapidly recovered from depression. The amplitude of the first EJC 10 s after the end was 65 ± 8.5% of that before the high-frequency stimulation (still significantly lower, P ≤ 0.01). Subsequent EJCs, however, recovered fully and were not significantly different from control EJCs recorded before the high-frequency stimulation (n = 8; Fig. 2A and B, Fig. 3B).
Figure 2. EJCs during high-frequency stimulation (700 pulses, 20 Hz).
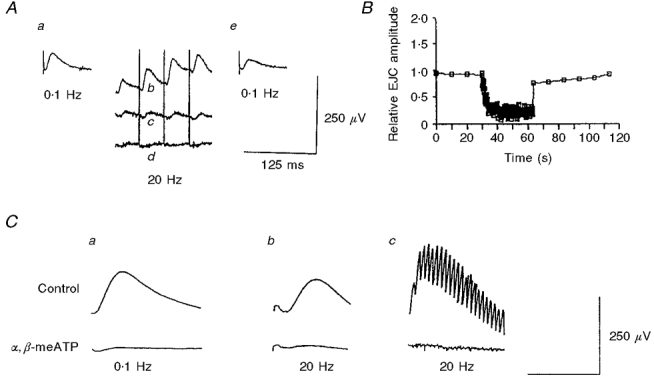
A, original tracings showing a control EJC (a, evoked at 0.1 Hz) before application of nerve stimulation with 700 pulses at 20 Hz. Also shown are EJCs during the initial (b), middle (c) and late (d) phases of the high-frequency stimulation (their relative position does not indicate baseline shift), and the first EJC 10 s after the end of the high-frequency stimulation (e). B, depression and recovery of EJCs during and after the high-frequency stimulation. EJCs evoked at 0.1 Hz before and after the high-frequency stimulation served as control and as test of recovery from depression, respectively. C, averaged EJCs at 0.1 and 20 Hz in controls (upper panel) and after addition of 10 μmol l−1α,β-methylene ATP to the bath (lower panel). The summation of the first few EJCs during the high-frequency stimulation gave rise to a slow positive deflection (c) on which individual EJCs were superimposed. The slow deflection was also abolished by α, β-methylene ATP. Time bars: a, 20 ms; b, 30 ms; and c, 600 ms.
Figure 3. Ca2+ and temperature dependency of EJCs.
A, facilitation and depression, and B, recovery from depression of EJCs during and after nerve stimulation with 700 pulses at 20 Hz. In A the first 100 pulses of the high-frequency stimulation are shown grouped in averages of four, and normalized to the mean of the first four EJCs. In B the first 10 pulses at 0.1 Hz after the end of the high-frequency stimulation are shown. □, 0.65 mmol l−1 Ca2+; ▪, 1.3 mmol l−1 Ca2+; ▵, 2.6 mmol l−1 Ca2+; •, 1.3 mmol l−1 Ca2+ and 23 °C. n = 6 for the Ca2+ experiments and n = 4 for the low-temperature experiment. Values shown are means ±s.e.m.
Effects of varying external Ca2+ and temperature on the EJCs
The effects of changes in external Ca2+ concentration on the facilitation, depression and recovery from depression of EJCs during nerve stimulation with 100-700 pulses at 20 Hz are shown in Fig. 3A and B. Reducing external Ca2+ by half, to 0.65 mmol l−1, greatly reduced the amplitude of the first EJC, but caused enhanced facilitation of subsequent EJCs (maximally by 73.3 ± 11.2%). Increasing external Ca2+ to 2.6 mmol l−1 enhanced the amplitude of the first EJCs by 374.5 ± 27.3% but greatly accentuated the depression of subsequent EJCs; the amplitude of the 100th EJC was 22.8 ± 2.3% of that of the first EJC (Fig. 3A, n = 5). Lowering the temperature to 23°C abolished the initial facilitation, and greatly accelerated the depression of EJCs (Fig. 3A, n = 4).
There was no significant difference in the magnitude or time course of recovery of EJCs from depression at 0.65, 1.3 or 2.6 mmol l−1 Ca2+ (n = 5) when tested 10 s after the end of the high-frequency stimulation, while a substantial enhancement of recovery was observed at low temperature (Fig. 3B, n = 4).
Frequency and train length dependency of the NA oxidation currents
During nerve stimulation with 100 pulses at 2-20 Hz the amplitude of the NA oxidation current, which reflects the peak concentration of NA attained near the carbon fibre sensor, increased with frequency; at 20 Hz the amplitude was 619.0 ± 26.0% of that at 2 Hz (n = 4, Fig. 4A and B). In contrast, the area of the NA oxidation current, which is a better estimate of the total amount of NA released (minus that removed by clearance) was essentially independent of frequency; at 20 Hz it was only 14% larger than that at 2 Hz - a difference which was, however, not statistically significant (P≥ 0.05; Fig. 4B).
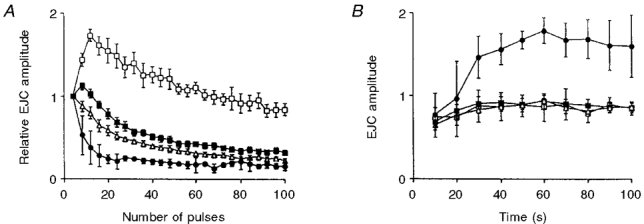
The effects of stimulation at a constant frequency (20 Hz) but with variable train length (4-100) are shown in Fig. 4C and D, and Fig. 5. The amplitude of the NA oxidation current grew almost linearly with train length between pulses 4-16 (Fig. 4C and D), indicating that the per pulse release was roughly constant during short trains of stimulation. When longer trains (20, 40, 60, 80 and 100 pulses) were applied, there was a train length-dependent depression in the growth in amplitude of the NA oxidation currents (Fig. 5A, C and D). Thus in controls the amplitude of the NA oxidation current caused by stimulation with 100 pulses was roughly 2.5-fold larger than that caused by 20 pulses (Fig. 5C), i.e. a 5-fold increase in the number of pulses gave a roughly 2.5-fold increase in amplitude.
Figure 5. Effects of cocaine and variable external Ca2+ on NA oxidation currents.
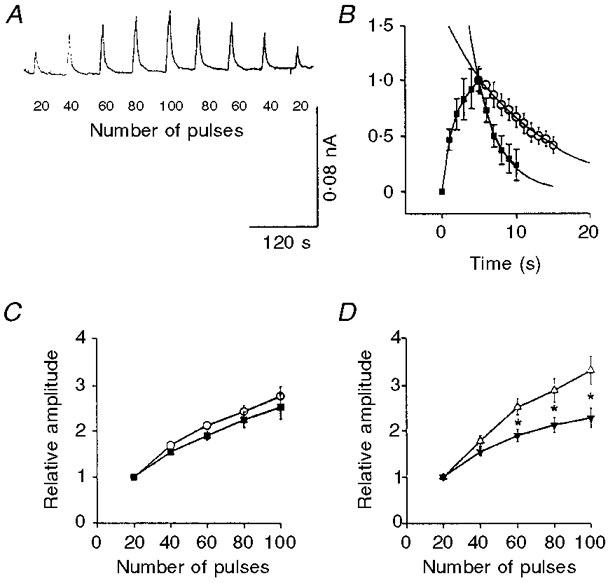
A, original recordings of NA oxidation currents in response to nerve stimulation with 20-100 pulses at 20 Hz. B, pooled data (normalized to peak amplitude) of NA oxidation current in response to nerve stimulation with 100 pulses at 20 Hz, showing the rise and decay of the signal in controls (▪, n = 12), and the decay of the signal in the presence of 3 μmol l−1 cocaine (○, n = 9). Curves were fitted with non-linear regression fit using SigmaPlot computer software. C, train length dependency of NA oxidation current in response to nerve stimulation with 20-100 pulses at 20 Hz in controls (○, n = 23) and in the presence of 3 μmol l−1 cocaine (▪, n = 9), and D at 0.65 (▵, n = 5) and 2.6 mmol l−1 external Ca2+ (▾, n = 10). In both C and D all values were normalized to the amplitude of the first 20 pulses. In all cases, values shown are means ±s.e.m.
The train length-dependent depression of the NA oxidation current can be due to attenuation of the signal by clearance of NA, or due to a decreased per pulse output of NA. To test these alternatives we investigated the effects of the NA re-uptake blocker cocaine (3 μmol l−1) and variation of external calcium concentration (n = 9 and 5, respectively). Cocaine caused a 3.5-fold increase in the time constant of decay of the NA oxidation current caused by nerve stimulation with 100 pulses at 20 Hz (Fig. 5B), and increased its amplitude 2.8-fold (see Table 1). However, cocaine only slightly increased the rate of growth of the NA signal between pulses 20-100 (Fig. 5C); the response to 100 pulses was only 2.8-fold larger than the response to 20 pulses, indicating that clearance by neuronal re-uptake was not the major cause of the decline in the growth of the NA signal.
Table 1.
Effect of various agents on the ATP and NA signals in response to nerve stimulation with 100 pulses at 20 Hz
| Cocaine(% of control) | Rauwolscine(% of control) | Yohimbine(% of control) | |
|---|---|---|---|
| EJC | 93.4 ± 4.5 | 109.7 ± 12.3 | 113.4 ± 5.7* |
| (n = 11) | (n = 4) | (n = 6) | |
| NA oxidation currents | 282.4 ± 16.2‡ | 222.0 ± 23.9* | 178.4 ± 19.2* |
| (n = 7) | (n = 3) | (n = 3) | |
| [3H]NA | — | — | 177.0 ± 15.9* |
| (n = 4) |
The concentration of drugs was 1 μmol l−1, except for cocaine, which was 3 μmol l−1. The rauwolscine and yohimbine experiments were performed in the presence of cocaine and the effects stated, or lack thereof, are on top of the cocaine effect. Values are expressed as means ±s.e.m.n is the number of experiments in each group. All values are expressed as the percentage of the corresponding control values.
P < 0.05
P < 0.001 using one-way analysis of variance (ANOVA) followed by the Fischer test.
The train length dependency of the NA oxidation current varied with changes in external Ca2+ concentration. The rate of growth of the signal increased when external Ca2+ concentration was reduced to 0.65 mmol l−1 (Fig. 5D); the amplitude of the NA oxidation current caused by 100 pulses was 3.3-fold larger than that caused by 20 pulses, indicating that the decline in the growth of the signal may in part be due to depressed per pulse output of NA.
Train length dependency of the overflow of [3H]NA
To investigate conclusively whether there is a train length-dependent decrease in the release of NA, we studied the overflow of [3H]NA in the presence of 3 μmol l−1 cocaine and 30 μmol l−1 corticosterone (n = 5). Under these conditions, the overflow method measures the total amount of released exogenous NA and is not sensitive to attenuation by clearance. Overflow of [3H]NA evoked by nerve stimulation at 20 Hz with a variable number of pulses (5-150) was investigated, and the summary of these are shown in Fig. 6A and B. To facilitate comparison, we also show the EJC and NA oxidation current values under comparable experimental conditions. As can be seen from Fig. 6A and B, both the [3H]NA and the EJCs were similarly affected by the high-frequency stimulation. Initially both signals grew roughly linearly with train length. However, as stimulation continued there was an increasing depression in the amplitude of both signals (after 100 pulses to 32.0 ± 2.5 and 44.2 ± 3.2%, respectively). The depression of the EJCs became statistically significant from pulses 21-40 (P ≤ 0.01), while that of the [3H]NA was significant from pulses 41-60 (P ≤ 0.05).
Figure 6. Comparison of EJC, NA oxidation current and [3H]NA overflow.
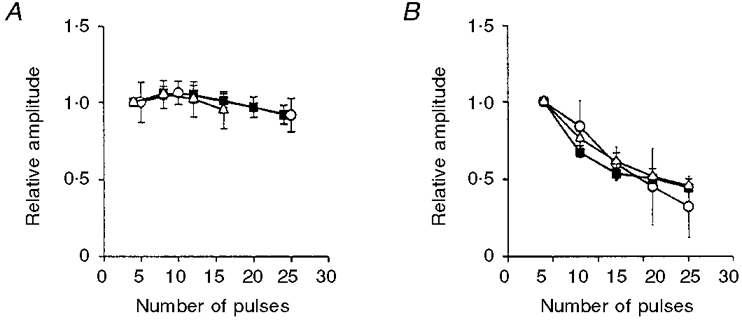
A, train length dependency of EJCs (4, 8, 12, 16, 20 and 24 pulses, ▪), NA oxidation currents (4, 8, 12 and 16 pulses, ▵), and overflow of [3H]NA (5, 15 and 25 pulses, ○) in response to nerve stimulation with 4-25 pulses at 20 Hz. Shown are means ±s.e.m.; all values are normalized to the average of the first 4 (EJCs and NA oxidation currents), or 5 pulses (overflow of [3H]NA). B, train length dependency of EJCs (▪), and [3H]NA overflow in control (○) and in the presence of yohimbine (▵) in response to nerve stimulation with 20, 40, 60, 80 and 100 pulses at 20 Hz. Values shown are means ±s.e.m.; all values are normalized to the average of the first 20 pulses in each group.
Effects of α2-adrenoceptor antagonists on ATP and NA release
The depression of the EJC and [3H]NA during the high frequency stimulation could be due to α2-adrenoceptor-mediated autoinhibition of transmitter release. To test this possibility we examined, in the presence of 3 μmol l−1 cocaine, the effects of the α2-adrenoceptor antagonists rauwolscine and yohimbine (both at 1 μmol l−1) on the EJCs, NA oxidation currents and [3H]NA during nerve stimulation with 100 pulses at 20 Hz. The results obtained are shown in Table 1. It can be seen that cocaine did not significantly affect the EJCs, but strongly amplified the NA oxidation current. The α2-adrenoceptor antagonists, studied in the presence of 3 μmol l−1 cocaine, had different effects on the ATP and NA signals. Rauwolscine had no effect on the EJCs but enhanced the NA oxidation current. Yohimbine enhanced the [3H]NA and the NA oxidation current, but had very little effect on the EJCs. Yohimbine, however, had no effect on the train length-dependent depression of [3H]NA overflow when its effect was studied at a variable train length (20-100 pulses, Fig. 6B).
DISCUSSION
The purpose of the present paper is to compare the release of the sympathetic co-transmitters ATP and NA during a high-frequency stimulation, and specifically to find out whether they are released in parallel or not. We base our conclusions concerning the per pulse release of ATP on measurement of the P2X-purinoceptor-mediated EJCs. The assessment of the release of NA is based on amperometric measurements of NA oxidation currents and measurement of overflow of tracer-labelled NA. An important question that needs to be addressed is to what extent these techniques, and the measured signals, allow confident conclusions about the release of ATP and NA.
Do the EJCs faithfully reflect ATP release?
The problem when using EJCs to study ATP release during a high-frequency stimulation is that rapid release of ATP may desensitize the P2X-purinoceptors mediating the EJCs, or that depolarization of postsynaptic membrane may lead to a decrease in the driving force for these currents and consequently lead to underestimation of release. A decline in the size of EJCs during a high-frequency train may thus imply either reduced per pulse output of ATP, reduced sensitivity of the postsynaptic membrane to released ATP, or as was recently reported, an increased degradation of ATP by co-released nucleotidases (Todorov et. al. 1997). In a previous study (Msghina & Stjärne, 1993) we found that during a high-frequency stimulation, the EJCs in rat tail artery depressed markedly, while those in mouse vas deferens were initially strongly facilitated and gradually returned to pre-facilitated levels as stimulation continued; in rat tail artery the current response to exogenous ATP applied by pressure ejection before, during, and after a high-frequency stimulation was essentially unchanged. From these results it was tentatively concluded that in rat tail artery the decline in the size of EJCs was mainly due to decreased per pulse output of ATP. The present results confirm and extend those observations. However, from the EJC data alone, one cannot rule out a substantial contribution of post-synaptic factors to the depression of EJCs. For example, it seems likely that the accentuation of the depression of EJCs at low temperature is partly due to desensitization of postsynaptic P2x-purinoceptors, as a result of the prolonged lifetime of released ATP in the synaptic gap. Unfortunately the crucial test, analysis of the amplitude distribution of spontaneous EJCs, is not feasible during 20 Hz trains due to the long duration of EJCs (≥ 50 ms). We will thus use the NA signals, which are measured independent of the postsynaptic membrane, to help us differentiate between pre- and postsynaptic mechanisms as causes of depression of the measured signals (see below).
Do the NA oxidation currents faithfully reflect NA release?
As mentioned above, the NA oxidation current is measured without the involvement of the postsynaptic membrane, and thus reflects only presynaptic processes. However, the technique measures the NA that diffuses to the carbon fibre probe from the sites of release. The signal is therefore a function of neural release and the clearance of released transmitter along the diffusion pathway. The ‘distorting’ effect of clearance grows with increasing train length and increasing interpulse interval. It is thus problematic to use the NA oxidation current to compare NA release during long trains at a given frequency, or that evoked by stimulation at different frequencies. A concrete example of this is shown in Fig. 4A and B. The fact that the peak amplitude of NA oxidation current at 20 Hz was 6-fold higher than that at 2 Hz was certainly not due to a 6-fold higher per pulse output of NA at 20 Hz. This huge discrepancy is largely due to the greater attenuation by clearance of the NA signal during the ten times longer interpulse period at 2 Hz compared with that at 20 Hz. By extension, the discrepancy in the frequency dependency of EJCs and peak NA oxidation current amplitude at 2-20 Hz need not reflect a discrepancy in the amount of ATP and NA released at these frequencies. The validity of this conclusion is further strengthened when the area of the NA oxidation current, which is a better estimate of the total amount of NA released, is compared with the EJCs. Such a comparison greatly reduced the discrepancy in the frequency dependency of EJCs and NA oxidation current.
Does the overflow of [3H]NA faithfully reflect NA release?
The EJCs distort the measurement of ATP release when postsynaptic receptors are desensitized or when postsynaptic membrane is greatly depolarized; the NA oxidation currents distort measurement of NA release when the transmitter that disappears by clearance before reaching the carbon fibre probe is unaccounted for. Measurement of the overflow of [3H]NA, on the other hand, when performed in the presence of NA uptake blockers, circumvents all these problems and gives a better measure of the amount of released transmitter than either the EJCs or NA oxidation currents. It should, however, be remembered that overflow of [3H]NA measures the release of tracer-labelled exogenous NA, which may or may not reflect the release of endogenous NA. Furthermore, measurement of tracer-labelled NA overflow has a much lower spatial and temporal resolution than both the EJCs or the NA oxidation currents.
With these caveats in mind, and by taking advantage of the strengths of the different methods, we will proceed to interpret the results obtained in the present study and discuss whether they suggest parallel or dissociated release of ATP and NA.
Are ATP and NA released in parallel?
The possibility that neurons may release co-existing transmitters in different combinations has been verified experimentally. Nerve stimulation at different frequencies affects differentially the release of ‘classical’ and peptide transmitters from sympathetic nerves and other neurons (Lundberg & Hökfelt, 1986). Such differential release has also been claimed for the co-transmitters ATP and NA. In guinea-pig vas deferens, for example, presynaptic agonists were reported to modulate differentially the release of ATP and NA (Ellis & Burnstock, 1989). Furthermore, the finding that the relative roles of the purinergic and adrenergic components of the contractile response vary in a frequency-dependent manner (Kennedy et al. 1986) has been thought to imply differential release of ATP and NA. These and other lines of evidence have led some investigators to conclude that ATP and NA may be stored apart in sympathetic nerves and released differentially by nerve impulses (see von Kügelgen & Starke, 1991).
The present results seem to support in some cases dissociated (Fig. 4B and Table 1), and in other cases (Fig. 6A and B) parallel release of ATP and NA. As explained above, clearance attenuates the peak amplitude of NA oxidation current more strongly at 2 Hz than at 20 Hz, leading to underestimation of the per pulse output of NA at 2 Hz. It is interesting, therefore, to note that the plot of the area of the NA oxidation current deviated less strongly from the EJCs. The results in Fig. 4A and B are thus not strong arguments for dissociated release of ATP and NA. Nor does the fact that cocaine slightly depressed the EJCs, but strongly enhanced the NA signals (Table 1), imply dissociated release; it is much more likely that the effect on NA signals was mainly due to block of neuronal re-uptake of released NA (Msghina et al. 1992). More difficult to interpret in terms of parallel release is the fact that the α2-adrenoceptor antagonists greatly enhanced the NA signals, but not the EJCs.
Favouring parallel release are the data shown in Fig. 6A and B. The EJCs and the overflow of [3H]NA were similarly affected by the high-frequency stimulation; initially both signals increased slightly in size, and then declined to about the same levels. The train length-dependent depression of the NA oxidation current also implies a gradual depression of endogenous NA output with increasing train length, and is compatible with parallel release of ATP and endogenous NA. Furthermore, variations in external Ca2+ had similar effects on the EJCs and NA oxidation currents, i.e. in both cases reducing external Ca2+ retarded and increasing external Ca2+ accelerated the depression of transmitter output.
In conclusion, the results obtained give a mixed picture and are partially compatible with parallel and partially compatible with dissociated release of the sympathetic co-transmitters ATP and NA. More work is required to unambiguously settle the issue.
Acknowledgments
This work was supported by grants from the Swedish Medical Research Council (project K97-14P-11824-02B and K97-14X- 03027-28B), and Karolinska Institutet's Fonder.
References
- Alberts P, Bartfai T, Stjärne L. Site(s) and ionic basis of α-autoinhibition and facilitation of [3H]noradrenaline secretion in guinea-pig vas deferens. The Journal of Physiology. 1981;312:297–334. doi: 10.1113/jphysiol.1981.sp013630. [DOI] [PMC free article] [PubMed] [Google Scholar]
- Atwood HL, Wojtowicz M. Short-term and long-term plasticity and physiological differentiation of crustacean motor synapses. International Review of Neurobiology. 1986;28:275–363. doi: 10.1016/s0074-7742(08)60111-7. [DOI] [PubMed] [Google Scholar]
- Betz WJ. Depression of transmitter release at the neuromuscular junction of the frog. The Journal of Physiology. 1970;206:629–644. doi: 10.1113/jphysiol.1970.sp009034. [DOI] [PMC free article] [PubMed] [Google Scholar]
- Brock JA, Bridgewater M, Cunnane TC. β-Adrenoceptor mediated facilitation of noradrenaline and adenosine 5′-triphosphate release from sympathetic nerves supplying rat tail artery. British Journal of Pharmacology. 1997;120:769–776. doi: 10.1038/sj.bjp.0700959. [DOI] [PMC free article] [PubMed] [Google Scholar]
- Brock JA, Cunnane TC. Electrical activity at the sympathetic neuroeffector junction the guinea-pig vas deferens. The Journal of Physiology. 1988;399:607–632. doi: 10.1113/jphysiol.1988.sp017099. [DOI] [PMC free article] [PubMed] [Google Scholar]
- Ellis JL, Burnstock G. Angiotensin neuromodulation of noradrenergic and purinergic co-transmission in the guinea-pig vas deferens. British Journal of Pharmacology. 1989;97:1157–1164. doi: 10.1111/j.1476-5381.1989.tb12574.x. [DOI] [PMC free article] [PubMed] [Google Scholar]
- Gonçalves J, Bültmann R, Driessen B. Opposite modulation of cotransmitter release in guinea-pig vas deferens: increase of noradrenaline and decrease of ATP release by activation of prejunctional β-adrenoceptors. Naunyn-Schmiedeberg's Archives of Pharmacology. 1996;353:184–192. doi: 10.1007/BF00168756. [DOI] [PubMed] [Google Scholar]
- Gonon F, Bao JX, Msghina M, Suaud-Chagny MF, Stjärne L. Fast and local electrochemical monitoring of noradrenaline release from sympathetic terminals in isolated rat tail artery. Journal of Neurochemistry. 1993;60:1251–1257. doi: 10.1111/j.1471-4159.1993.tb03284.x. [DOI] [PubMed] [Google Scholar]
- Kennedy C, Saville VL, Burnstock G. The contribution of noradrenaline and ATP to the responses of the rabbit central ear artery to sympathetic nerve stimulation depends on the parameters of stimulation. European Journal of Pharmacology. 1986;122:291–300. doi: 10.1016/0014-2999(86)90409-7. 10.1016/0014-2999(86)90409-7. [DOI] [PubMed] [Google Scholar]
- Lundberg JM, Hökfelt T. Multiple co-existence of peptides and classical transmitters in peripheral autonomic and sensory neurons - functional and pharmacological implications. Progress in Brain Research. 1986;68:241–262. doi: 10.1016/s0079-6123(08)60242-3. [DOI] [PubMed] [Google Scholar]
- Martin AR. Junctional transmission. In: Brookhart JM, Mountcastle VB, Kandel ER, editors. Handbook of Physiology, section 1, The Nervous System, Presynaptic Mechanisms. part 2. Vol. 1. Bethesda, MD, USA: American Physiological Society; 1977. pp. 329–355. [Google Scholar]
- Msghina M, Govind CK, Atwood HL. Synaptic structure and transmitter release in Crustacean phasic and tonic motor neurons. Journal of Neuroscience. 1998;18:1374–1382. doi: 10.1523/JNEUROSCI.18-04-01374.1998. [DOI] [PMC free article] [PubMed] [Google Scholar]
- Msghina M, Mermet C, Gonon F, Stjärne L. Electrophysiological and electrochemical analysis of the secretion of ATP and noradrenaline from the sympathetic nerves in rat tail artery: effects of α2-adrenoceptor agonists and antagonists and noradrenaline reuptake blockers. Naunyn-Schmiedeberg's Archives of Pharmacology. 1992;346:173–186. doi: 10.1007/BF00165299. [DOI] [PubMed] [Google Scholar]
- Msghina M, Stjärne L. Sympathetic transmitter release in rat tail artery and mouse vas deferens: facilitation and depression during high frequency stimulation. Neuroscience Letters. 1993;155:37–41. doi: 10.1016/0304-3940(93)90668-b. 10.1016/0304-3940(93)90668-B. [DOI] [PubMed] [Google Scholar]
- Otsuka M, Endo M, Nonomura Y. Presynaptic nature of neuromuscular depression. Japanese The Journal of Physiology. 1962;12:573–584. doi: 10.2170/jjphysiol.12.573. [DOI] [PubMed] [Google Scholar]
- Stjärne L. Basic mechanisms and local modulation of nerve impulse-induced secretion of neurotransmitters from individual sympathetic nerve varicosities. Reviews of Physiology, Biochemistry and Pharmacology. 1989;112:1–137. doi: 10.1007/BFb0027496. [DOI] [PubMed] [Google Scholar]
- Stjärne L, Brundin J. Affinity of noradrenaline and dopamine for neural receptors mediating negative feedback control of noradrenaline secretion in human vasoconstrictor nerves. Acta Physiologica Scandinavica. 1975;95:89–94. doi: 10.1111/j.1748-1716.1975.tb10029.x. [DOI] [PubMed] [Google Scholar]
- Stjärne L, Stjärne E. Basic features of an extracellular recording method to study secretion of sympathetic co-transmitter, presumably ATP. Acta Physiologica Scandinavica. 1989;135:217–226. doi: 10.1111/j.1748-1716.1989.tb08571.x. [DOI] [PubMed] [Google Scholar]
- Thies RE. Neuromuscular depression and the apparent depletion of transmitter in mammalian muscle. Journal of Neurophysiology. 1965;28:427–442. doi: 10.1152/jn.1965.28.3.427. [DOI] [PubMed] [Google Scholar]
- Todorov LD, Todorova SM, Westfall TD, Sneddon P, Kennedy C, Bjur RA, Westfall DP. Neuronal release of soluble nucleotidases and their role in neurotransmitter inactivation. Nature. 1997;387:76–79. doi: 10.1038/387076a0. 10.1038/387076a0. [DOI] [PubMed] [Google Scholar]
- van Kügelgen I, Starke K. Noradrenaline-ATP co-transmission in the sympathetic nervous system. Trends in Pharmacological Sciences. 1991;12:319–324. doi: 10.1016/0165-6147(91)90587-i. 10.1016/0165-6147(91)90587-I. [DOI] [PubMed] [Google Scholar]
- Zucker RS. Short term synaptic plasticity. Annual Review of Neuroscience. 1989;12:13–31. doi: 10.1146/annurev.ne.12.030189.000305. 10.1146/annurev.ne.12.030189.000305. [DOI] [PubMed] [Google Scholar]