

Abstract
A video-imaging technique of morphometry was used to measure the diameter as an index of cell volume in intact mouse distal colon crypts submitted to hypotonic shock.
Transition from isotonic (310 mosmol l−1) to hypotonic (240 mosmol l−1) saline caused a pronounced increase in crypt diameter immediately followed by regulatory volume decrease (RVD).
Exposure of crypts to Cl−-free hyposmotic medium increased the rapidity of both cell swelling and RVD. Exposure of crypts to Na+-free hyposmotic medium reduced the total duration of swelling. Return to initial diameter was followed by further shrinkage of the crypt cells.
The chloride channel inhibitor NPPB (50 μM) delayed the swelling phase and prevented the subsequent normal decrease in diameter.
The K+ channel blockers barium (10 mM), charybdotoxin (10 nM) and TEA (5 mM) inhibited RVD by 51, 44 and 32%, respectively.
Intracellular [Ca2+] rose from a baseline of 174 ± 17 nM (n = 8) to 448 ± 45 nM (n = 8) during the initial swelling phase
The Ca2+ channel blockers verapamil (50 μM) and nifedipine (10 μM), the chelator of intracellular Ca2+ BAPTA AM (30 μM), or the inhibitor of Ca2+ release TMB-8 (10 μM), dramatically reduced volume recovery, leading to 51% (n = 9), 25% (n = 7), 37% (n = 6), 32% (n = 8) inhibition of RVD, respectively. TFP (50 μM), an antagonist of the Ca2+-calmodulin complex, significantly slowed RVD. The Ca2+ ionophore A23187 (2 μM) provoked a dramatic reduction of the duration and amplitude of cell swelling followed by extensive shrinkage. The release of Ca2+ from intracellular stores using bradykinin (1 μM) or blockade of reabsorption with thapsigargin (1 μM) decreased the duration of RVD.
Prostaglandin E2 (PGE2, 5 μM) slightly delayed RVD, whereas leukotriene D4 (LTD4, 100 nM) and arachidonic acid (10 μM) reduced the duration of RVD. Blockade of phospholipase A2 by quinacrine (10 μM) inhibited RVD by 53%. Common inhibition of PGE2 and LTD4 synthesis by ETYA (50 μM) or separate blockade of PGE2 synthesis by 1 μM indomethacin reduced the duration of RVD. Blockade of LTD4 synthesis by nordihydroguaiaretic acid (NDGA) did not produce any significant effect on cell swelling or subsequent RVD.
Staurosporine (1 μM), an inhibitor of protein kinases, inhibited RVD by 58%. Taken together the experiments demonstrate that the RVD process is under the control of conductive pathways, extra- and intracellular Ca2+ ions, protein kinases, prostaglandins and leukotrienes.
The crypts of distal colon are submitted to frequent cell volume modifications resulting from fluctuating entry or exit of ion solutes and osmotically obliged water, and from variations in the osmotic pressure in the luminal compartment of the colon. The osmotically induced variations in crypt cell volume are rapidly compensated by uptake or efflux of osmotically active molecules. Thus, exposure of colon crypts to hypotonic media causes cell swelling followed by regulatory volume decrease (RVD) (Diener & Scharrer, 1995). Current knowledge of the ionic movements underlying the RVD (see reviews by Macknight, 1988; Pierce & Politis, 1990; Hoffmann & Kolb, 1991; Sarkadi & Parker, 1991; Hoffmann & Dunham, 1995) indicates that recovery of normal cell volume following swelling is dependent on the efflux of K+ and Cl− in most epithelia. This loss of KCl may occur via electroneutral K+- Cl− co-transport pathways, or via K+-H+ and Cl−-HCO3− exchangers. It may also occur via K+ and Cl− conductive pathways (Christensen & Hoffmann, 1992; Nilius et al. 1995). Conductive Cl− and K+ efflux is a feature of regulatory volume decrease in most animal cells and the activation of a swelling-induced K+ conductance occurs simultaneously with that of an independent, conductive Cl− pathway.
Although it is now firmly established that the RVD process induced by cell swelling is based on the efflux of ions and organic osmolytes, the exact nature of the mechanisms and pathways involved remains unclear and is the subject of intensive investigation. A wide range of factors are likely to play a regulatory role in the RVD response. Models for cellular signalling in RVD were proposed by Hoffmann (1993) and MacLeod (1994), assigning a function to increased cytosolic free calcium, metabolism of arachidonic acid, synthesis of prostaglandin E2 (PGE2) and leukotriene D4 (LTD4), activation of protein kinases and the Ca2+- calmodulin complex.
The recent literature has provided much evidence to support these models, in particular concerning intestinal cells in Necturus small intestine (Lau et al. 1984), enterocytes from guinea-pig jejunum (MacLeod & Hamilton, 1991), rat colonic crypts (Diener et al. 1992), small intestinal guinea-pig crypts (O'Brien et al. 1991) or cultured human epithelial cells (Intestine 407) (Hazama & Okada, 1988), but most of these studies remain fragmentary, generally focusing on membrane conductances only.
Concerning the studies on the intestinal tract, relatively little is known about the net transport of ions and the volume regulation processes in the mouse colon compared with what is known for the large intestine of the rabbit, rat and guinea-pig.
The present study used a technique of morphometry, similar to that used by Diener et al. (1992) for measuring the diameter of crypts submitted to hypotonic shock and was aimed at demonstrating the involvement of conductive pathways during RVD in intact mouse distal colon. The experimental protocol was also designed to test intracellular processes underlying the process of volume regulation. For this purpose, we have used different bathing solutions and pharmacological agents acting at the intracellular level on mobilization of intracellular calcium stores, or directly interfering with the relevant metabolic pathways.
The results suggest the involvement of Cl− and K+ conductive pathways in the RVD process in mouse intact distal colonic crypts following hypotonic shock, and demonstrate that the regulatory volume recovery process is clearly under the control of extra- and intracellular Ca2+ ions, protein kinases, prostaglandins and leukotrienes.
METHODS
Isolation of crypts
Isolated crypts were prepared by a modification of the cell isolation procedure described by Siemer & Gögelein (1993). Female mice weighing 20-30 g were anaesthetized with intramuscular ketamine (10-20 mg ml−1) and the distal colon was taken above the pelvic brim, dissected and rinsed in ice-cold NaCl solution containing (mM): NaCl, 140; KCl, 5; MgCl2, 1; CaCl2, 2; Hepes-Tris buffer, 10; glucose, 10; dithiothreitol (DTT), 1; pH 7.4. The intact colon was inverted, placed in a calcium-free solution (mM: NaCl, 96; KCl, 1.5; Hepes-Tris, 10; Na-EDTA, 27; sorbitol, 55; sucrose, 44; DTT, 1; pH 7.4) and incubated for 20 min, then transferred into a high-calcium NaCl solution (mM: NaCl, 140; KCl, 5; MgCl2, 1; CaCl2, 2; Hepes/Tris, 10; glucose, 10; pH 7.4). The crypts were released into solution by gentle shaking, washed twice by centrifugation at 600 g for 2 min, and stored on ice until use. At the end of the experiment the mice were killed by an overdose of the anaesthetic.
Experimental protocol
Before experiments, the crypts were fixed to the glass bottom of an experimental chamber (volume 0.4 ml) coated with the aid of poly-L-lysine (0.01% w/v). The bathing solution was continuously changed throughout the experiments using a peristaltic pump at the flow rate of 1 ml min−1. The chamber was mounted on the stage of an inverted microscope. The composition of bathing solutions is given in Table 1. The calcium concentration was adjusted to pCa 3. All solutions were equilibrated in air atmosphere and filtered through 0.2 μm Millipore cellulose disks. Crypts were superfused for 3 min with isotonic Ringer solution (310 mosmol l−1), then exposed to hypotonic Ringer solution (240 mosmol l−1) for 25 min. Some crypts were used as isotonic controls and maintained for the same duration in Ringer, sorbitol Ringer or Na+-free Ringer solutions in the presence or absence of inhibitors. When the effects of the inhibitors were tested they were added to both isotonic and hypotonic solutions before the beginning of the experiment. A 20 min pre-incubation was necessary for procaine and BAPTA AM. The osmolarities of the solutions were measured using a Roebling osmometer.
Table 1.
Composition of the solutions
| Isotonic solutions(310 mosmol l−1) | Hypotonic solutions(240 mosmol l−1) | ||||||
|---|---|---|---|---|---|---|---|
| Isotonic Ringer | Isotonic sorbitol Ringer | Isotonic Na+-free Ringer | Isotonic Cl−-free Ringer | Hypotonic Ringer | Hypotonic Na+-free Ringer | Hypotonic Cl−-free Ringer | |
| NaCl | 140 | 70 | — | — | 70 | — | — |
| KCl | 4.5 | 4.5 | 4.5 | — | 4.5 | 4.5 | — |
| MgCl2 | 1.2 | 1.2 | 1.2 | — | 1.2 | 1.2 | — |
| CaCl2 | 1.2 | 1.2 | 1.2 | — | 1.2 | 1.2 | — |
| Hepes-Tris | 10 | 10 | 10 | 10 | 10 | 10 | 10 |
| D-Glucose | 10 | 10 | 10 | 10 | 10 | 10 | 10 |
| Sorbitol | — | 140 | — | — | — | — | — |
| Potassium gluconate | — | — | — | 4.5 | — | — | 4.5 |
| Sodium gluconate | — | — | — | 140 | — | — | 70 |
| NMDG | — | — | 140 | — | — | 70 | — |
| MgSO4 | — | — | — | 1.2 | — | — | 1.2 |
| CaSO4 | — | — | — | 1.2 | — | — | 1.2 |
| pH | 7.40 | 7.40 | 7.40 | 7.40 | 7.40 | 7.40 | 7.40 |
Acquisition of crypt images was made using a digital camera and a Datatranslation DT3155 Frame Grabber. Images were stored on a PC computer prior to analysis. Capture of crypt images was effected every single minute for the first 13 min, then each 2 min during the following 12 min. Three diameter measurements were taken at a right angle to the longitudinal crypt axis at the apex, middle and base levels, using the image analysis software Global Lab Image (version 2.0, Datatranslation) (Fig. 1). The change in crypt diameter was expressed as the difference from the mean initial isotonic diameter (Δ crypt diameter, μm) and this allowed calculation of the maximal increase in diameter (Δdmax, μm), the time necessary for maximal swelling (tswell,max, min), the time necessary for 50% recovery of initial diameter (t½RVD, min) or for reaching initial diameter after RVD (tRVD, min).
Figure 1.
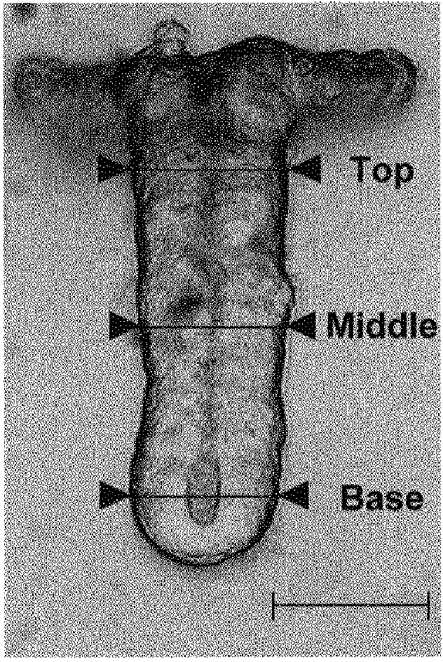
Crypt image showing diameter measurements taken at the apex, middle and base regions. Scale bar, 40 μm.
Spectrofluorescence
Colonic crypts were loaded with 5 μM fura-2 AM for 30 min at 22°C. The crypts were washed in isotonic solution and transferred to glass coverslips treated with poly-L-lysine. All experiments were performed at room temperature (20-22°C) to minimize dye leakage and colonic crypt disintegration. The coverslips were mounted on an inverted epifluorescence microscope (Diaphot 200, Nikon). The light from a xenon lamp (Nikon) was filtered through alternating 340 and 380 nm interference filters (10 nm bandwidth, Nikon). The resultant fluorescence was passed through a 400 nm dichroic mirror, filtered at 510 nm, and then collected using an intensified CCD camera system (Darkstar, Photonic Science). Images were digitized and analysed using the Starwise Fluo System (Imstar, Paris, France). The Ca2+ concentration was calculated according to eqn (1):
| (1) |
where K′ is the product of the dissociation constant of the Ca2+-fura-2 complex and a constant related to the optical characteristics of the particular system, R is the experimental fluorescence ratio F340/F380 from which the background fluorescence has been subtracted, and Rmin and Rmax are the values of R in the presence of zero and saturating calcium, respectively. Rmax and Rmin values were obtained using a solution containing 150 mM KCl, 10 mM EGTA, and 25 μM ionomycin with (for Rmax) or without (for Rmin) 10 mM CaCl2. A micropipette perfusion system was used to apply test solutions to isolated colonic crypts plated on glass coverslips.
Chemicals
A23187, arachidonic acid, barium acetate, bradykinin, bumetanide, 5,8,11,14-eicosatetraynoic acid (ETYA), indomethacin, nordihydroguaiaretic acid (NDGA), ketamine, procaine, quinine, quinacrine, staurosporine, tetraethylammonium (TEA), trifluoperazine (TFP), thapsigargin, 3,4,5-trimethoxybenzoic acid 8-(diethylamino) octyl ester (TMB-8), and verapamil were purchased from Sigma. 5-Nitro-2-(3-phenylpropylamino)-benzoate (NPPB) was obtained from Research Biochemicals International. Charybdotoxin was obtained from Latoxan. The acetomethoxy derivative of BAPTA AM, leukotriene D4 (LTD4), nifedipine and prostaglandin E2 (PGE2) were purchased from Biomol. The chemicals were dissolved either in dimethylsulfoxide (DMSO), ethanol or Ringer solution with a maximal concentration of 0.025% (v/v) for solvents.
Data analysis
Data, expressed as means ±s.e.m., were analysed using ANOVA. Variances were compared using Fisher's F test for difference of variances.
RESULTS
Crypt volume changes under osmotic shock
A rapid switching from isotonic (310 mosmol l−1) to hypotonic (240 mosmol l−1) saline caused a pronounced increase in crypt diameter of distal colon (Fig. 2A). This process was immediately followed by regulatory volume decrease (RVD) during the 25 min exposure to 240 mosmol l−1, leading to restoration of cell volume. In isotonic Ringer solution the mean diameters of the isolated colonic crypts at the apex, middle and base levels were 52.2 ± 2.6 μm (n = 6), 38.5 ± 1.5 μm (n = 6) and 44.9 ± 1.4 μm (n = 6), respectively. Exposure to hypotonic medium increased these values to 56.7 ± 2.4, 44.0 ± 1.7 and 50.9 ± 1.8 μm. The results obtained under hypotonic conditions in the apex, middle and base regions of the crypts showed significant differences for the value of maximal change in diameter but the time courses of the observed variations at these three levels were not significantly different (Table 2). On average, the mean maximal increase in crypt diameter (Δdmax) was 5.1 ± 0.3 μm (n = 18), and this value was reached within 4.9 ± 0.3 min (n = 18) (Fig. 2B). Under the effect of RVD, the diameter was restored to control values after 17.8 ± 0.6 min (n = 18). As a consequence, in the following results, the variation in final diameter (Δdfinal) and percentage of inhibition due to experimental treatments were calculated as the algebraic or relative difference between these parameters and the initial diameter at time 18 min. Perfusion with a solution in which 70 mM NaCl was replaced by 140 mM sorbitol to maintain isotonicity had no effect on the crypt diameter (Δdfinal = -0.6 ± 0.3 μm, n = 8). In addition, when the crypts were maintained in isotonic Ringer solution for 25 min they did not display any significant variation in diameter (Δdfinal = -1.0 ± 0.2 μm, n = 7). Since there was a significant difference between the degrees of swelling at the three levels in the crypt axis, the experimental data obtained from the mid-region of the crypts were compared to the middle control results. The crypt lumen appeared collapsed along the apex-to-base axis except at the extreme base where a small luminal space could be distinguished. At the level of diameter measurements in the mid-crypt region, no change in luminal space volume could be observed in hypotonic conditions.
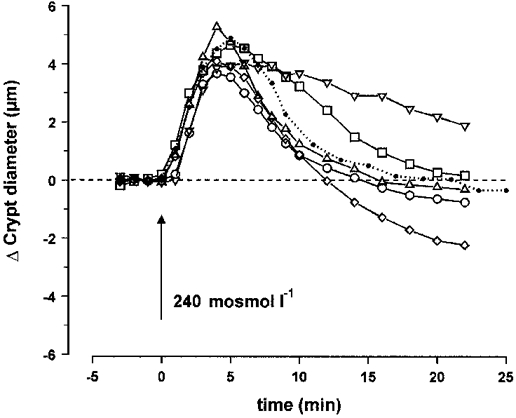
Figure 2.
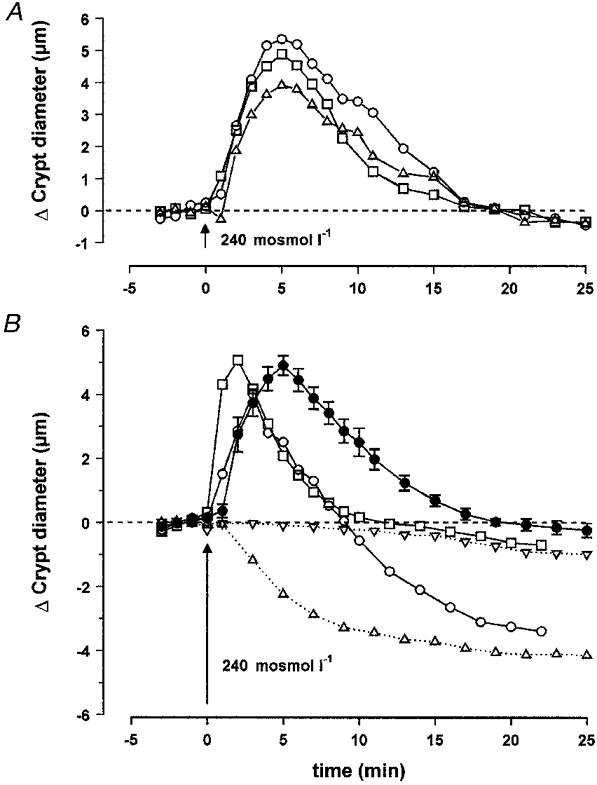
A, effect of hypotonic medium on the diameter of isolated crypts during a 25 min exposure to 240 mosmol l−1, leading to restoration of cell volume. The mean diameters were measured at the apex (▵, n = 6), middle (□, n = 6) and base (○, n = 6) levels. B, effect of replacement of Cl− by gluconate or Na+ by NMDG, in isotonic or hypotonic media, on the diameter of isolated crypts measured at the middle level: •, hypotonic medium (n = 18); ▿, Cl−-free isotonic medium (n = 8); □, Cl−-free hypotonic medium (n = 8); ▵, Na+-free isotonic medium (n = 7); ○, Na+-free hypotonic medium (n = 9). The results are compared with the mean hypotonic curve. The dashed lines in A and B represent initial control diameter. For statistics, see Table 2.
Table 2.
Summary of changes in crypt diameter
| n | Δdmax(μm) | tswell,max(min) | t1/2 RVD(min) | tRVD(min) | Δdfinal(μm) | |
|---|---|---|---|---|---|---|
| Changes under osmotic shock | ||||||
| Apex | 6 | 4.1 ± 0.5 | 4.3 ± 0.6 | 10.7 ± 1.0 | 18.0 ± 0.8 | 0.2 ± 0.5 |
| Middle | 6 | 5.5 ± 0.5 | 5.5 ± 0.6 | 9.6 ± 1.4 | 16.9 ± 1.0 | 0.1 ± 0.2 |
| Base | 6 | 5.5 ± 0.7 | 4.8 ± 0.5 | 10.6 ± 0.8 | 18.3 ± 1.3 | −0.1 ± 0.6 |
| Mean | 18 | 5.1 ± 0.3 | 4.9 ± 0.3 | 10.3 ± 0.6 | 17.1 ± 0.6 | |
| Changes under osmotic shock in Cl−-free or Na+-free media | ||||||
| Hypotonic Cl−-free Ringer | 8 | — | — | 4.7 ± 0.4* | 8.2 ± 0.8*** | −0.5 ± 0.2 |
| Hypotonic Na+-free Ringer | 9 | — | — | 5.5 ± 0.6** | 9.0 ± 0.9** | −3.1 ± 0.8* |
| Changes under osmotic shock in the presence of K+ or Cl− channel blockers | ||||||
| NPPB(50 μM) | 7 | — | — | — | — | 5.4 ± 0.6*** |
| Barium(10 mM) | 8 | — | — | — | — | 2.6 ± 0.4*** |
| Charybdotoxin(10 nM) | 8 | — | — | — | — | 2.4 ± 0.5*** |
| TEA(5 mM) | 8 | — | — | 13.4 ± 1.1* | — | 1.9 ± 0.4** |
| Quinine(1 mM) | 8 | — | — | 9.4 ± 1.0 | 18.6 ± 2.4 | 0.9 ± 0.4* |
| Changes in the presence of antagonists of Ca2+ pathways | ||||||
| Gadolinium(10 μM) | 8 | — | — | 11.4 ± 0.5 | 15.8 ± 0.6 | 0.6 ± 0.2* |
| Verapamil(50 μM) | 9 | — | — | — | — | 2.3 ± 0.5*** |
| Nifedipine(10 μM) | 7 | — | — | 11.7 ± 1.0 | — | 1.3 ± 0.1** |
| TMB-8(10 μM) | 8 | — | — | — | — | 1.9 ± 0.7** |
| BAPTA AM(30 μM) | 6 | — | — | 13.9 ± 2.3 | — | 1.7 ± 0.6* |
| Procaine(1 mM) | 7 | — | — | 13.1 ± 1.4 | — | 0.6 ± 0.4 |
| TFP(50 μM) | 6 | — | — | 15.3 ± 2.0** | — | 1.7 ± 0.8* |
| Changes in the presence of agonists of Ca2+ pathways | ||||||
| A23187 (2 μM) | 8 | — | — | 5.0 ± 0.8** | 7.1 ± 1.3*** | −4.3 ± 0.6*** |
| Bradykinin (1 μM) | 9 | — | — | 8.8 ± 0.7 | 11.9 ± 1.3** | −1.8 ± 0.6* |
| Thapsigargin (1 μM) | 7 | — | — | 7.8 ± 0.5 | 15.3 ± 0.8* | −0.5 ± 0.2 |
| Changes in the presence of agonists or antagonists of eicosanoid pathways | ||||||
| LTD4(100 nM) | 8 | — | — | 8.4 ± 0.7 | 12.6 ± 1.2* | −1.8 ± 0.6* |
| PGE2(5 μM) | 7 | — | — | 13.5 ± 1.8* | — | 0.5 ± 0.6 |
| Arachidonic acid(10 μM) | 7 | — | — | 7.4 ± 0.5** | 13.1 ± 0.9* | −0.5 ± 0.3 |
| Quinacrine (10 μM) | 7 | — | — | — | — | 2.4 ± 0.4** |
| Indomethacin (1 μM) | 8 | — | — | 9.3 ± 0.5 | 14.1 ± 0.6* | 0.0 ± 0.3 |
| NDGA(10 μM) | 6 | — | — | 12.2 ± 0.5 | 16.3 ± 0.8 | 0.0 ± 0.3 |
| ETYA(50 μM) | 6 | — | — | 7.3 ± 0.3*** | 14.4 ± 1.1** | −0.2 ± 0.1 |
| Changes under osmotic shock in the presence of a protein kinase blocker | ||||||
| Staurosporine (1 μM) | 8 | — | — | 13.2 ± 1.3* | — | 2.5 ± 0.5*** |
Δdmax, maximal increase in diameter; Δdfinal, final variation in diameter; tswell,max, time necessary for maximal swelling; t1/2 RVD, time necessary for 50 % recovery of initial diameter; tRVD, time necessary for reaching initial diameter after RVD. Results are expressed as means ± S.E.M., and changes in crypt diameter are calculated as the difference with the mean initial isotonic diameter.
P < 0.05
P < 0.01
P < 0.001.
Volume changes under osmotic shock in Cl−-free or Na+-free media
To assess the effect of the external concentration of Cl− and Na+ on the process of swelling and subsequent volume regulation, crypts were bathed in isotonic or hypotonic media in which Cl− was replaced by gluconate or Na+ was replaced by the impermeant cation, N-methyl-D-glucamine (NMDG). Exposure of crypts to Cl−-free hyposmotic medium increased the rapidity of both cell swelling and RVD. Although the maximum change in diameter (5.3 ± 0.5 μm, n = 8) was of the same order as in controls (5.5 ± 0.5 μm, n = 6), maximum swelling was obtained within only 1.8 ± 0.3 min (n = 8) and the initial diameter was restored after 8.2 ± 0.8 min (n = 8). The variation in final diameter (-0.5 ± 0.2 μm, n = 8) was not significantly different from the control (Fig. 2B and Table 2). In addition, exposure to isotonic Cl−-free medium induced a slight but significant decrease in crypt diameter (Fig. 2B).
A different pattern was observed when Na+ was replaced in the hypotonic solution by NMDG (Fig. 2B and Table 2). In this case the rapidity of the initial phase of swelling was similar to controls, but the total duration of swelling was reduced to 3.3 ± 0.5 min (n = 9). As a consequence the maximum increase in diameter was only 4.3 ± 0.5 μm (n = 9). Return to the initial diameter was achieved after 9.0 ± 0.9 min (n = 9). However, RVD did not stop at this stage and the crypt cells continued to shrink, leading to a final diameter difference of -3.1 ± 0.8 μm (n = 9) after 18 min. Moreover, replacement of isotonic Ringer by isotonic Na+-free solution induced marked and rapid shrinkage of the crypt cells to give a variation in final diameter of -4.3 ± 0.7 μm (n = 7) after 18 min.
Crypt volume changes under osmotic shock in the presence of Cl− and K+ channel inhibitors
The effect of inhibitors known to block Cl− and K+ conductances are presented in Fig. 3 and Table 2.
Figure 3.
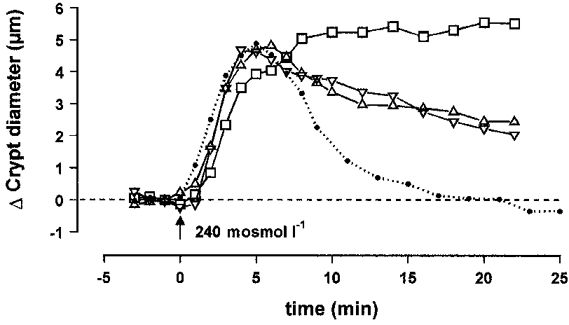
Effect of hypotonic medium on the diameter of isolated crypts, measured at the middle level, in the presence of the Cl− channel inhibitor NPPB (50 μM; □; n = 7) or in the presence of the K+ channel inhibitors barium (10 mM; ▵; n = 8) and charybdotoxin (10 nM; ▿; n = 8). The dotted line corresponds to the middle control hypotonic curve. The dashed line represents initial control diameter. For statistics, see Table 2.
The chloride channel inhibitor NPPB delayed the swelling phase as shown by the rightward shift of the variation curve. The crypt diameter reached a maximum value after 22.3 ± 0.5 min (n = 7). The final variation in crypt diameter was 5.4 ± 0.6 μm (n = 7) which is not significantly different from maximal swelling obtained in the mid-region after 5.5 ± 0.6 min.
Barium, a general inhibitor of K+ channels, and charybdotoxin and TEA, regarded as specific inhibitors of different Ca2+-dependent channels, were added to the hypotonic solutions at concentrations of 10 mM, 10 nM and 5 mM, respectively. Cell swelling was never reduced, when compared with controls, in the presence of these drugs, but RVD was partially prevented and only 49, 56 and 68% of the initial increase in the crypt diameter were compensated after 18 min of RVD in the presence of barium, charybdotoxin and TEA, respectively.
The inhibitory effect of quinine, which cannot be considered as a specific blocker of potassium channels, was much weaker (20% inhibition).
Intracellular [Ca2+]
Measurements of intracellular calcium by spectrofluorescence indicated that [Ca2+]i rose from a baseline of 174 ± 17 nM (n = 8) to 448 ± 45 nM (n = 8) during the initial swelling phase (Fig. 4). The peak value was reached after 45 ± 5 s (n = 8) followed by a slower reduction which returned to a plateau level averaging 244 ± 24 nM (n = 8). This elevated plateau was maintained for the duration of the exposure to the hypotonic solution.
Figure 4.
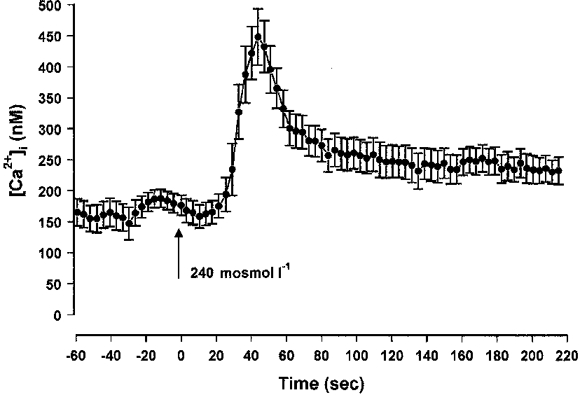
Effect of hypotonic medium on the intracellular calcium concentration, calculated from measurements of Ca2+-fura-2 fluorescence at the middle level of isolated crypts.
Role of calcium antagonists in crypt volume changes under osmotic shock
As Ca2+ seems to be involved in RVD of most cells, but the nature of the role played by this ion remains unclear, we used a large spectrum of inhibitors of Ca2+ signalling and transport.
Verapamil (50 mM), a Ca2+ channel blocker, and nifedipine (10 mM), a dihydropyridine (DHP)-type specific inhibitor of voltage-dependent L-type Ca2+ channels, did not affect the extent and kinetics of swelling. As shown in Fig. 5A, after this first phase of increase, cryts underwent a normal RVD process during the first 5 min after maximal swelling. Subsequently, the rate of volume recovery was dramatically reduced during a second phase. Indeed, the final diameter (Δdfinal = 2.3 ± 0.5 μm, n = 9) was significantly higher in the presence of verapamil than in controls. Nifedipine also produced a significant increase but to a lesser extent (Δdfinal = 1.3 ± 0.1 μm, n = 7).
Figure 5.

A, effect of hypotonic medium on the diameter of isolated crypts, measured at the middle level, in the presence of the Ca2+ channel blockers verapamil (50 μM; *; n = 9) and nifedipine (10 μM; ○; n = 7), the Ca2+-calmodulin complex inhibitor TFP (50 μM; ▵; n = 6), or the Ca2+ antagonists BAPTA AM (30 μM; □; n = 7) and TMB-8 (10 μM; ▿; n = 8). B, effect of hypotonic medium in the presence of the Ca2+ agonists thapsigargin (1 μM; ▿; n = 7), bradykinin (1 μM; ▵; n = 9) and A23187 (2 μM; *; n = 8). The dotted line corresponds to the control hypotonic curve. The dashed lines in A and B represent initial control diameter. For statistics, see Table 2.
Gadolinium is known to block stretch-activated non-selective cationic channels (Filipovic & Sackin, 1992). At a concentration of 10 μM, this drug did not reduce the enlargement of crypt diameter and only slightly affected the subsequent return to initial diameter (Table 2).
Treatment of the colonic crypts by the chelator of intracellular Ca2+ BAPTA AM at a dose of 30 μM induced the same pattern of RVD as nifedipine and verapamil, leading to a final 37% (n = 6) inhibition after 18 min of volume recovery. This was also observed when using TMB-8 (10 μM), a potent inhibitor of Ca2+ release from intracellular Ca2+ stores. In this case 32% inhibition (n = 8) of RVD was measured. Procaine, another antagonist of intracellular Ca2+ release, did not induce any significant variation of the final diameter, and produced a slight but insignificant slowing down of the RVD process as indicated in Table 2.
Intracellular Ca2+ may also exert its effect through the Ca2+-calmodulin complex. We used TFP at a concentration of 50 μM as an antagonist of this complex. No significant effect was visible on the time course of cell swelling but the time to reach 50% of RVD was significantly increased (15.3 ± 2.0 min, n = 6) when compared with controls (9.6 ± 1.4 min, n = 6). As a consequence the variation in crypt diameter after 18 min of hypotonic exposure was still elevated at 1.7 ± 0.8 μm (n = 6).
Role of calcium agonists in crypt volume changes under osmotic shock
Three different means were used to increase the intracellular Ca2+ level. The Ca2+ ionophore A23187, employed at a concentration of 2 μM allowed massive entry of Ca2+ into the crypt cells and provoked a dramatic reduction in cell swelling duration and amplitude (Fig. 5B and Table 2). This influx of extracellular Ca2+ was rapidly followed by a huge shrinkage, with a variation in final diameter of -4.3 ± 0.6 μm (n = 8).
Other means of increasing intracellular Ca2+ involved inducing Ca+ release from intracellular stores with the aid of bradykinin (1 μM), and preventing reabsorption into intracellular stores by the inhibition of Ca2+-ATPase with thapsigargin (1 μM). As shown on Fig. 5B, these drugs did not significantly affect the swelling phase but their presence enhanced considerably the RVD process. Return to initial diameter was achieved within 11.9 ± 1.3 min (n = 9) and 15.3 ± 0.8 min (n = 7) with bradykinin and thapsigargin, respectively. Addition of A23187, bradykinin or thapsigargin in isotonic solution induced shrinkage of the crypt cells, with a variation in final diameter of -2.8 ± 0.8 μm (n = 4), -1.0 ± 0.5 μm (n = 4) -0.6 ± 0.9 μm (n = 4), respectively.
Implication of eicosanoid metabolism
In order to investigate the role of prostaglandin E2 and leukotrienes in the process of volume regulation we either applied PGE2, LTD4 and arachidonic acid directly to the crypts before and during the hypotonic challenge or induced partial inhibition of the synthesis of their common precursor arachidonic acid. We also induced inhibition of PGE2 and LTD4 synthesis from arachidonic acid. Inhibition of arachidonic acid synthesis was achieved by blockade of phospholipase A2 by quinacrine, which prevented transformation of phosphatidyl choline (PC) and phosphatidyl ethanolamine (PE) into arachidonic acid. However, this inhibition could not be total since we had no means of blocking the second pathway of arachidonic synthesis by transformatiom of diacylglycerol (DAG) by DAG lipase. Finally, inhibition of the synthesis of PGE2 and LTD4 from arachidonic acid was performed simultaneously using ETYA or separately using indomethacin (an inhibitor of cyclo-oxygenase) to inhibit PGE2 synthesis and NDGA (an inhibitor of 5-lipoxygenase) to inhibit LTD4 synthesis.
The results contained in Fig. 6 and Table 2 show that 5 μM PGE2 delayed the RVD process in a significant manner, even though this effect remained weak. On the other hand, 100 nM LTD4 enhanced the RVD process after regular cell swelling, but also provoked a slight shrinkage in isotonic solution with a variation in final diameter of -0.6 ± 0.6 μm (n = 4). Return to initial volume was accomplished after 12.6 ± 1.2 min (n = 8) and was followed by a marked cell shrinkage corresponding to a diameter decrease by -1.8 ± 0.6 μm (n = 8) after 18 min. In the presence of 10 μM arachidonic acid, RVD was also accelerated in a similar manner (13.1 ± 0.9 min, n = 7), but return to initial diameter was not followed by dramatic shrinkage. Upon blockade of phospholipase A2 by 10 μM quinacrine, the RVD process was strongly affected and the diameter recovery process displayed 53% inhibition after 18 min. The common inhibition of PGE2 and LTD4 synthesis by 50 μM ETYA reduced the total time of RVD to 14.4 ± 1.1 min (n = 6). Separate blockade of PGE2 synthesis by 1 μM indomethacin reduced the total time of RVD to 14.1 ± 0.6 min (n = 8), while blockade of LTD4 synthesis by NDGA did not produce any significant effect on cell swelling and subsequent RVD.
Figure 6.
Effect of hypotonic medium on the diameter of isolated crypts, measured at the middle level, in the presence of the eicosanoids PGE2 (5 μM; □; n = 7) or LTD4 (100 nM; ⋄; n = 8), or their precursor arachidonic acid (10 μM; ○; n = 7), or in the presence of quinacrine (10 μM; ▿; n = 7), an inhibitor of phospholipase A2, or ETYA (50 μM; ▵; n = 6), a common inhibitor of cyclo-oxygenase and 5-lipoxygenase. The dotted line corresponds to the control hypotonic curve. The dashed line represents initial control diameter. For statistics, see Table 2.
Role of protein kinase in crypt volume regulation
At a concentration of 1 μM, staurosporine is considered to act as a general inhibitor of protein kinases. The inhibitory effect on the RVD process was significant, corresponding to 58% inhibition of diameter recovery after 18 min of hypotonic shock.
DISCUSSION
The present study was aimed at identification of channels and underlying mechanisms involved in volume regulation following hypotonic shock in isolated crypts of mouse distal colon. When compared with other methods using isolated enterocytes, the technique of dissociation of intact crypts has the advantage of maintaining base-to-apex topology of the crypt and a clear differentiation between apical and basolateral cell poles. It preserves the cells’ functional integrity and maintains the intracellular cross-talk between apical and basolateral membranes. The dissociation protocol used in the present experiments removed the connective tissue, and clean basolateral membranes free of basal lamina were always obtained, giving sharp membrane images for acurate diameter measurements. A clear observation of the different crypt cells was possible for at least 4 h after dissociation before cell rounding occurred. Experiments were carried out within the first 3 h following crypt isolation.
Swelling of the crypt cells was produced by a reduction in medium osmolarity and was followed by a rapid RVD process allowing return to initial cell diameter within 18 min. The present data support the hypothesis that recovery of normal cell volume is dependent on the efflux of K+ and Cl−, as in most epithelia. This loss of KCl occurs via K+ and Cl− conductive pathways as shown by the experiments testing specific inhibition of Cl− and K+ channels. The experimental protocol was also designed to determine the intracellular signalling processes underlying the activation of these channels. We show that, under hypotonic stress, crypt cells elicit a transient rise of intracellular calcium with a maximum occurring 45 s after the change in osmolarity. The use of specific drugs acting at the intracellular level on mobilization of intracellular calcium stores have shown that RVD is dependent on Ca2+ mobilization from intracellular stores and Ca2+ from extracellular fluid. The selective inhibition of metabolic pathways involving the precursors of prostaglandins and leukotrienes demonstrate the regulatory role of eicosanoids. In view of the strong inhibition of RVD by staurosporine, it is clear that protein kinases also play an important role in the regulation of cell volume, but further studies will be necessary to identify the type of kinases involved and their mode of action on RVD.
Influence of external Na+ and Cl− ions
We have investigated whether removal of Cl− and Na+ produced volume loss. The isotonic removal of chloride had very little effect on cell volume. The failure of Cl− removal to produce a volume change may indicate a low resting permeability to chloride. In contrast, removal of sodium produced an immediate cell shrinkage. Considering the low Na+ permeability of epithelial basolateral cell membranes, the decrease in cell volume may implicate activation of other Na+-dependent signals controlling cell volume. For instance, Na+ removal could induce activation of a Na+-Ca2+ exchanger operating in the Ca2+ influx mode, as suggested by Pena-Rasgado et al. (1994) in muscle cells. If this is the case, the resulting rise in intracellular Ca2+ might activate KCl loss when intracellular calcium was artificially raised. The decreased duration of RVD in Cl−-free hypotonic medium is probably driven by the favourable gradient for Cl− efflux from the cell. Replacement of Na+ by NMDG accelerated RVD following hypotonic shock. This effect, and the additional shrinkage observed in Na+-free isotonic conditions after RVD, may be due to an indirect effect of sodium removal on intracellular calcium and KCl loss, as discussed above.
Involvement of Cl− and K+ conductive pathways
The RVD was delayed or inhibited by Cl− and K+ channel blockers. The inhibition was total in the presence of NPPB and approximately 50% in the presence of barium and charybdotoxin and much less with TEA. This suggests the predominant role of Cl− channels in the RVD mechanism, which probably creates the driving force for subsequent K+ exit. Many different types of Cl− and K+ channels have been identified in different types of epithelia by whole-cell or single channel recordings. Diener et al. (1992) showed that cell swelling activates a basolateral 20-30 pS Cl− channel and basolateral 45-60 pS K+ channel and that the opening of these channels corresponds to a decrease in transepithelial short-circuit current and increased tissue conductance. More recently Diener & Scharrer (1995), using whole-cell recording, demonstrated that cell swelling is associated with reversible membrane depolarization concomitant with increased Cl− current, as also shown by Hoffmann & Kolb (1991) in Ehrlich cells. They concluded that the response of rat colonic crypt cells after swelling is dominated by an increase in Cl− conductance and to a smaller extent by an increase in K+ conductance. In this case, the swelling-induced Cl− conductance exceeds the swelling-induced K+ conductance and explains the membrane depolarization. The basolateral location of a conductive Cl− efflux is not a common feature of regulatory volume decrease in most animal cells, however, another example of basolateral location of volume-sensitive anion channel has been shown by Simmons (1991) in MDCK (Madin-Darby canine kidney) cells.
Activation mechanisms
As in most studies reported in the literature (McCarthy & O'Neil, 1992), Ca2+ seems to be involved in the RVD process. A rapid and transient rise in [Ca2+]i has been measured in many cell types including intestinal epithelial cells (Hazama & Okada, 1990; Nitschke et al. 1993). We observed that the [Ca2+]i response to swelling comprised an initial transient peak followed by a sustained elevation. The time course and amplitude of the calcium response is in agreement with other studies in epithelial cells and suggests that calcium mobilization results from release of intracellular stores and from calcium entry. Figure 5A clearly demonstrates that recovery of cell volume after swelling is impaired to approximately the same extent when the Ca2+ channels are blocked by verapamil and nifedipine, or when intracellular Ca2+ is chelated by BAPTA AM. It must be mentioned, however, that nifedipine and verapamil are also known to block the volume-sensitive anion channels which contribute to RVD in most cells (Monaghan et al. 1997). Inhibition of Ca2+ release from intracellular stores by TMB-8 produced a similar slowing in RVD as observed when following inhibition of calcium entry across the plasma membrane. These data indicate that (i) Ca2+ entry is a requirement for RVD, (ii) a rise in intracellular Ca2+ is essential for RVD and (iii) swelling involves mobilization of calcium from intracellular stores. It is noteworthy that the slowing of RVD by the calcium transport antagonists occurred approximately 5 min after the beginning of RVD. This indicates that calcium mobilization is necessary for the later phase of RVD. The evidence for a major role of Ca2+ in the RVD process is reinforced by our observation of accelerated RVD when Ca2+ was released from intracellular stores using bradykinin or when Ca2+ re-uptake into stores was blocked with thapsigargin. These data are in complete agreement with the general concept of an activation of Ca2+-sensitive ion conductances resulting from a swelling-induced rise in intracellular Ca2+ concentration. Furthermore, the slowed RVD process obtained in the presence of TFP indicates that the Ca2+-calmodulin complex could play a role in the activation of the ionic transport pathways either by a direct effect on the channels or by activating arachidonic acid release and leukotriene synthesis (Lambert, 1989). It is of interest that the effect of TFP was to slow the initial phase of RVD, whereas after 5 min the rate of cell volume recovery during the second phase was similar to control. This suggests that the Ca2+-calmodulin complex acts preferentially on the initial phase of volume recovery.
Eicosanoids may also play a role in regulation of the channels involved in the loss of KCl. Lambert et al. (1987) have shown in Ehrlich ascites tumour cells that the synthesis of leukotrienes is stimulated, while prostaglandin synthesis is reduced, during RVD. The present demonstration of faster RVD in the presence of LTD4 or arachidonic acid, as well as the slowing of RVD with PGE2, confirms that such a synergistic process would act in the right direction for volume recovery of mouse colonic crypts following exposure to hypotonic solutions. LTD4 may activate K+ and Cl− conductance pathways (Lambert, 1989), possibly via stimulation of an LTD4 receptor (Diener & Scharrer, 1993), with or without requiring any increase in intracellular calcium (Jorgensen et al. 1997). The role of prostaglandins is thought to be principally directed towards the control of Na+ permeability (Lambert et al. 1987). Because of the inhibitory effect of NDGA on 5-lipoxygenase, we would predict a delayed or partially inhibited RVD, but this expected effect was not observed. Our data therefore show that the role played by leukotrienes in RVD is significant when their synthesis is accelerated but that their production is not a prerequisite for full RVD. The same conclusion can be drawn from the effect observed in the presence of ETYA (an inhibitor of both cyclo-oxygenase and 5-lipoxygenase), the acceleration of RVD probably being the result of the inhibition of PGE2 synthesis. The effect on RVD when cyclo-oxygenase activity was inhibited by indomethacin reinforces this conclusion. Lambert & Hoffmann (1993) have shown that NDGA is also able to inhibit an efflux of taurine from Ehrlich cells. It is conceivable that part of the above-reported effects of eicosanoids on RVD can be accounted for by the swelling-induced movements of organic ions such as amino acid.
In conclusion, this work demonstrates the involvement of Cl− and Ca2+-dependent K+ conductive pathways in the RVD process in mouse intact distal colonic crypts following hypotonic shock, and indicates that the regulatory process is under the control of extra- and intracellular Ca2+ ions, protein kinases, prostaglandins and leukotrienes. These data provide information about the net transport of ions and the volume regulation process for an experimental material which remains relatively little investigated.
Acknowledgments
We thank Professor C. Deniel and Dr L. Quiniou for technical assistance in image capture. Thanks are also given to La Fondation Langlois for funding computer data analysis. This work was also financially supported by the Lion's Club de Carnac and the Lion's Club d'Auray.
References
- Christensen O, Hoffmann EK. Cell swelling activates K+ and Cl− channels as well as non selective, stretch-activated cation channels in Ehrlich ascites tumor cells. Journal of Membrane Biology. 1992;129:13–36. doi: 10.1007/BF00232052. [DOI] [PubMed] [Google Scholar]
- Diener M, Nobles M, Rummel W. Activation of basolateral Cl− channels in the rat colonic epithelium during regulatory volume decrease. Pflügers Archiv. 1992;421:530–538. doi: 10.1007/BF00375048. [DOI] [PubMed] [Google Scholar]
- Diener M, Scharrer E. The leukotriene D4 receptor blocker, SK&F 104353, inhibits volume regulation in isolated crypts from the rat distal colon. European Journal of Pharmacology. 1993;238:217–222. doi: 10.1016/0014-2999(93)90850-h. [DOI] [PubMed] [Google Scholar]
- Diener M, Scharrer E. Swelling-activated conductances for chloride, potassium and amino acids in the rat colon: a whole-cell study. Experimental Physiology. 1995;80:411–428. doi: 10.1113/expphysiol.1995.sp003856. [DOI] [PubMed] [Google Scholar]
- Filipovic D, Sackin H. Stretch- and volume-activated channels in isolated proximal tubule cells. American Journal of Physiology. 1992;262:F857–870. doi: 10.1152/ajprenal.1992.262.5.F857. [DOI] [PubMed] [Google Scholar]
- Hazama A, Okada Y. Ca2+ sensitivity of volume-regulatory K+ and Cl− channels in cultured human epithelial cells. The Journal of Physiology. 1988;402:687–702. doi: 10.1113/jphysiol.1988.sp017229. [DOI] [PMC free article] [PubMed] [Google Scholar]
- Hazama A, Okada Y. Biphasic rises in cytosolic free Ca2+ in association with activation of K+ and Cl− conductance during the regulatory volume decrease in cultured human epithelial cells. Pflügers Archiv. 1990;416:710–714. doi: 10.1007/BF00370619. [DOI] [PubMed] [Google Scholar]
- Hoffmann EK. Control of volume regulatory ion transport processes in a mammalian cell: Signalling by secondary messengers. In: Ussing HH, Fischbarg J, Sten-Knudsen O, Larsen EH, Willumsen NJ, editors. Isotonic Transport in Leaky Epithelia. Vol. 34. Copenhagen: Munksgaard; 1993. pp. 273–294. [Google Scholar]
- Hoffmann EK, Dunham PB. Membrane mechanisms and intracellular signalling in cell volume regulation. International Review of Cytology. 1995;161:173–262. doi: 10.1016/s0074-7696(08)62498-5. [DOI] [PubMed] [Google Scholar]
- Hoffmann EK, Kolb HA. Mechanisms of activation of regulatory volume responses after cell swelling. In: Gilles R, Hoffmann EK, Bollis L, editors. Advances in Comparative and Environmental Physiology. Vol. 9. Berlin: Springer-Verlag; 1991. pp. 140–185. [Google Scholar]
- Jorgensen NK, Christensen S, Harbak H, Brown AM, Lambert IH, Hoffmann EK, Simonsen LO. On the role of calcium in the regulatory volume decrease (RVD) response in Ehrlich mouse ascites tumor cells. Journal of Membrane Biology. 1997;157:281–299. doi: 10.1007/s002329900236. [DOI] [PubMed] [Google Scholar]
- Lambert IH. Leukotrienes-D4 induced cell shrinkage in Ehrlich ascites tumor cells. Journal of Membrane Biology. 1989;108:165–176. doi: 10.1007/BF01871027. [DOI] [PubMed] [Google Scholar]
- Lambert IH, Hoffmann EK. Regulation of taurine transport in Ehrlich ascites tumor cells. Journal of Membrane Biology. 1993;131:67–79. doi: 10.1007/BF02258535. [DOI] [PubMed] [Google Scholar]
- Lambert IH, Hoffmann EK, Christensen P. Role of prostaglandins and leukotrienes in volume regulation by Ehrlich ascites tumor cells. Journal of Membrane Biology. 1987;98:247–256. doi: 10.1007/BF01871187. [DOI] [PubMed] [Google Scholar]
- Lau KR, Hudson RL, Shultz SG. Cell swelling increases a barium-inhibitable potassium conductance in the basolateral membrane of Necturus small intestine. Proceedings of National Academy of Sciences of the USA. 1984;81:3591–3594. doi: 10.1073/pnas.81.11.3591. [DOI] [PMC free article] [PubMed] [Google Scholar]
- McCarthy NA, O'Neil RG. Calcium signalling in cell volume regulation. Physiological Reviews. 1992;72:1037–1061. doi: 10.1152/physrev.1992.72.4.1037. [DOI] [PubMed] [Google Scholar]
- Macknight AD. Principles of cell volume regulation. Renal Physiology and Biochemistry. 1988;11:114–141. doi: 10.1159/000173158. [DOI] [PubMed] [Google Scholar]
- MacLeod RJ. How an epithelial cell swell is a determinant of the signalling pathway that activate RVD. In: Strange K, editor. Cellular and Molecular Physiology of Cell Volume Regulation. Boca Raton, FL, USA: CRC Press, Inc.; 1994. pp. 191–200. [Google Scholar]
- MacLeod RJ, Hamilton JR. Separate K+ and Cl− transport pathways are activated for regulatory volume decrease in jejunal villus cells. American Journal of Physiology. 1991;260:G405–415. doi: 10.1152/ajpgi.1991.260.3.G405. [DOI] [PubMed] [Google Scholar]
- Monaghan AS, Mintenig GM, Sepulveda FV. Outwardly rectifying Cl− channel in guinea pig small intestinal villus enterocytes: effects of inhibitors. American Journal of Physiology. 1997;273:G1141–1152. doi: 10.1152/ajpgi.1997.273.5.G1141. [DOI] [PubMed] [Google Scholar]
- Nilius B, Sehrer J, De Smet P, van Driessche W, Droogmans G. Volume regulation in a toad epithelial cell line: role of coactivation of K+ and Cl−. The Journal of Physiology. 1995;495:367–378. doi: 10.1113/jphysiol.1995.sp020886. [DOI] [PMC free article] [PubMed] [Google Scholar]
- Nitschke R, Leipziger J, Greger R. Intracellular Ca2+ transients in HT29 cells induced by hypotonic cell swelling. Pflügers Archiv. 1993;423:274–279. doi: 10.1007/BF00374406. [DOI] [PubMed] [Google Scholar]
- O'Brien JA, Walters RJ, Sepulveda FV. Regulatory volume decrease in small intestinal crypts is inhibited by K+ and Cl− channel blockers. Biochimica et Biophysica Acta. 1991;1070:501–504. doi: 10.1016/0005-2736(91)90093-n. [DOI] [PubMed] [Google Scholar]
- Pena-Rasgado C, Summers JC, McGruder KD, DeSantiago J, Rasgado-Flores H. Effect of isotonic removal of extracellular Na+ on cell volume and membrane potential in muscle cells. American Journal of Physiology. 1994;267:C759–767. doi: 10.1152/ajpcell.1994.267.3.C759. [DOI] [PubMed] [Google Scholar]
- Pierce SK, Politis A D. Ca2+-activated cell volume recovery mechanisms. Annual Review of Physiology. 1990;52:27–42. doi: 10.1146/annurev.ph.52.030190.000331. [DOI] [PubMed] [Google Scholar]
- Sarkadi B, Parker JC. Activation of ion transport pathways by changes in cell volume. Biochimica et Biophysica Acta. 1991;1071:407–427. doi: 10.1016/0304-4157(91)90005-h. [DOI] [PubMed] [Google Scholar]
- Siemer C, Gögelein H. Effects of forskolin on crypt cells of rat distal colon. Activation of nonselective cation channels in the crypt base and of a chloride conductance pathway in other parts of the crypts. Pflügers Archiv. 1993;424:321–328. doi: 10.1007/BF00384359. [DOI] [PubMed] [Google Scholar]
- Simmons NL. The effect of hypo-osmolarity upon transepithelial ion transport in cultured renal epithelial layers (MDCK) Pflügers Archiv. 1991;419:572–578. doi: 10.1007/BF00370297. [DOI] [PubMed] [Google Scholar]