

Abstract
The effects of impulse activity on conduction in cutaneous C fibres have been examined in 46 microneurographic recordings from 11 normal subjects and 11 diabetic patients with normal nerve conduction. A tungsten microelectrode was inserted into a cutaneous nerve, usually the superficial peroneal close to the ankle, and intraneural microstimulation was used to identify an area of skin innervated. Three minute trains of 0.25 ms stimuli at 1, 2 and 4 Hz were then delivered to the surface of the skin, separated by intervals of 6 min with stimulation at 0.25 Hz. Slowing and block of conduction were measured from the nerve responses for up to seven C units per stimulation sequence.
Three types of C unit were distinguished by their responses to repetitive stimulation: type 1 units slowed progressively during the 3 min trains; slowing of type 2 units reached a plateau within 1 min; while type 3 units hardly slowed at all. Data from normal and diabetic subjects did not differ and were pooled. After 3 min at 2 Hz, the percentage increases in latency were for type 1, 28.3 ± 9.7 (n = 63 units, mean ±s.d.); for type 2, 5.2 ± 1.6 (n = 14); and for type 3, 0.8 ± 0.5 (n = 5), with no overlap. After 3 min at 4 Hz, 58% of type 1 units (but no type 2 or 3 units) blocked intermittently. Recovery of latency after stimulation was faster for type 2 than for type 1 units, but conduction velocities of the three types were similar.
Type 1 units were identified as nociceptors and 7 type 2 units were identified as ‘cold’ fibres, activated by non-noxious cold, with no overlap in modality. None of the units tested was activated by weak mechanical stimuli or reflex sympathetic activation.
Spike waveforms were averaged for 18 type 1, 10 type 2 and 6 type 3 units. All units had predominantly triphasic action potentials with a major negative peak, but those of type 3 units were on average both smaller and briefer than those of type 1 and type 2 units.
It is concluded that repetitive electrical stimulation reliably differentiates nociceptive from cold-specific C fibres innervating human hairy skin, as has previously been shown for the rat. Cold fibres can propagate impulses continuously at much higher rates than nociceptive fibres. The nature of the type 3 units is unclear.
Repetitive firing in axons can lead to their subexcitability and reduced conduction velocity, due to prolonged hyperpolarization (Gasser, 1935; Bergmans, 1970; Bostock & Grafe, 1985). Such activity-dependent changes in membrane potential and conduction velocity are much more pronounced in unmyelinated fibres than in myelinated ones (Ritchie & Straub, 1957; Grafe et al. 1997), and have been used in microneurographic recordings from humans as a ‘marking’ technique for C fibres activated by natural stimuli (Hallin & Torebjörk, 1974; Torebjörk, 1974; Ochoa & Torebjörk, 1989; Schmelz et al. 1995). Most of these studies have implicitly assumed that all C fibres slow to a similar degree when challenged with repetitive stimulation. However, recent evidence from animal studies shows that C fibres segregate into discrete groups when stimulated repetitively, and that these differences may be used to determine the functional class of a fibre. Thalhammer et al. (1994) in a study of A and C fibres in the rat sciatic nerve, demonstrated that C nociceptors show a greater degree of activity-dependent slowing than cold C fibres. Gee et al. (1996) have confirmed these results, and shown that this differential behaviour in response to repetitive stimulation may be used to separate afferent and non-afferent populations of inexcitable C fibres.
At present, the only accepted method for classifying a human afferent C fibre is to study its receptor properties. Conduction velocity distinguishes between myelinated and unmyelinated, and between some different classes of myelinated axons, but has been of less value in subdividing unmyelinated axons (Lynn, 1994). During electrophysiological studies both in vitro and in vivo, it would be useful to be able to distinguish between different classes of C fibres without the need to study the properties of their receptors. This is particularly true for unresponsive units, which represent a significant percentage in monkeys and in humans (Meyer et al. 1991; Davis et al. 1993; Schmidt et al. 1995), since those units may be either unresponsive C afferents or efferent sympathetic axons.
In the present study, we have measured the effects of trains of impulses on the conduction velocity of human C fibres during microneurography. We have found that these fibres can be segregated into at least three different classes on the basis of their response to repetitive stimulation, and that it is possible unambiguously to differentiate nociceptive from cold-specific C fibres innervating human skin, as has previously been shown for the rat (Thalhammer et al. 1994; Gee et al. 1996).
METHODS
Eleven adult, healthy volunteers and eleven mildly diabetic patients participated in a total of 46 microneurographic recordings. A subgroup of diabetics who had been enrolled in an on-going study of diabetic neuropathy were included because they had no or minimal symptoms and signs of neuropathy, normal nerve conduction studies, and because the results obtained were not different from the normal control group. There were 12 males and 10 females, with ages ranging from 29 to 76 years (median 41 years). The study had the approval of the local ethics committee and conformed to the Declaration of Helsinki. All subjects gave informed, written consent.
Microneurographic recording
Microneurography was used to record action potentials of human C fibres from cutaneous nerve fascicles of the superficial peroneal nerve at the ankle (44 recordings) or from the superficial radial nerve at the wrist (2 recordings). The subjects sat relaxed with either an arm or a leg firmly supported on a padded platform. Intraneural recordings were obtained using a disposable lacquer-insulated tungsten microelectrode, 200 μm in shaft diameter, that was inserted percutaneously into a sensory nerve. A subcutaneous reference electrode was inserted 1–2 cm outside the nerve trunk. The general technique of microneurography has been described in detail by its pioneers (Vallbo & Hagbarth, 1968). The neural signals were first amplified by a custom made differential preamplifier with a built-in two-pole high-pass filter with a cut-off frequency of 160 Hz, then filtered with an adjustable analogue filter (bandpass 0.3–3 kHz), further amplified, audiomonitored, and displayed on a Tektronix 5113a oscilloscope. Unfiltered signals from the preamplifier were also fed to a Pentium PC and digitized with a Data Translation DT2812 A/D board at a sampling rate of 10 kHz. Digitized signals, comprising the first 300 ms of each response, were stored on the hard drive of the PC as raw data for off-line analysis. Digital filtering (bandpass 0.3–2 kHz), removal of 60 Hz line frequency contamination and clamping of the baseline were performed both on-line and during off-line analysis for a better visualization of the action potentials (Fig. 1). Temperature of the skin was measured with a thermocouple placed on the skin adjacent to the receptive fields of the units under study. Skin temperature was maintained above 30°C with a jet of warm air.
Figure 1. Schematic diagram of method of tracking latency changes in single human C fibres.

Constant current stimuli triggered by the computer are applied to the skin in the receptive field of C fibres recorded by microneurography from superficial peroneal nerve at the ankle (bottom). Computer display during experiment, 1 min after second 3 min period of repetitive stimulation (top). Latency to positive peak of filtered and inverted response waveform occurring within window (short horizontal line in upper trace) is recorded and displayed (lower trace). The window is recentred on peak after each stimulus, so that a single unit may be tracked in the presence of other large units. Raw responses are recorded so that latencies may be remeasured off-line (for large units), or multiple units displayed on a raster plot (Fig. 2).
Protocol of electrical stimulation of the cutaneous receptive fields
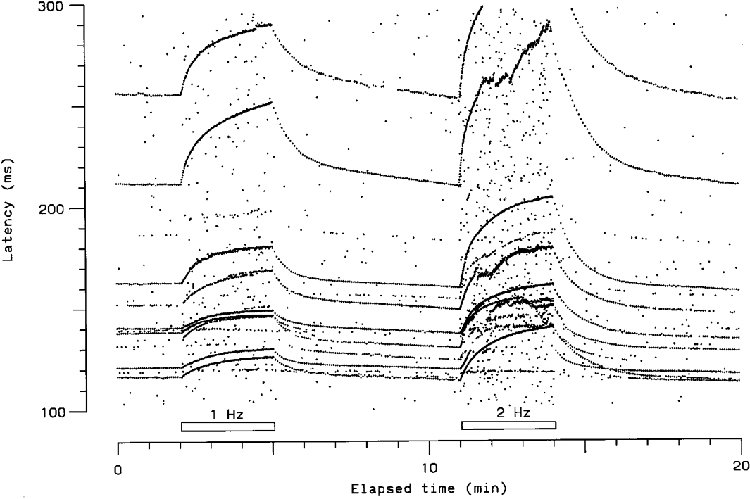
A search of receptive fields (RF) of C fibres was conducted in areas of skin where intraneural electric microstimulation evoked projected painful sensations at near threshold levels (Torebjörk & Ochoa, 1990). This area of the skin was stimulated electrically, either with a pair of 5 mm diameter gold cup electrodes or with needle electrodes, using rectangular pulses of 0.25–0.3 ms duration (Grass S48, stimulus isolation unit SIU 5). Only fibres with latencies compatible with conduction velocities in the C fibre range (< 2 ms−1) were studied. If a time locked response with such a latency appeared, then the area of skin was stimulated at three different frequencies according to the following protocol: 1, 2 and 4 Hz for 3 min periods, separated by 6 min intervals with stimulation at 0.25 Hz (e.g. Fig. 5). A complete recording took 30 min. Stimulus intensity was normally set to at least 50 % above threshold for the fibre under study. However, in some cases the intensity could not be set so high (either because the subject could not tolerate it, or because the maximum output of the stimulator was reached), whereas on other occasions, when abrupt latency shifts occurred, the intensity was raised higher to allow the unit to be followed reliably throughout the stimulation sequence. The relationship of stimulus intensity to threshold therefore varied between units (although it was kept constant throughout each recording sequence), and was not known for additional units that appeared in the raster plots (see below).
Figure 5. Examples of three types of response to standard repetitive stimulation protocol.

Latencies tracked during 3 min periods of stimulation at 1, 2 and 4 Hz, separated by 6 min periods at 0.25 Hz. From top to bottom: type 1 units progressively increase in latency and often block, type 2 units soon reach a plateau, while type 3 units change little in latency (< 2 % at 2 Hz).
Recording of responses
Responses were recorded and analysed with QTRAC software (written by H. Bostock, copyright Institute of Neurology, London), specially modified to track peak latencies and display them as a latency ‘profile’ or as a raster plot. During the experiment, an individual action potential was tracked by setting a latency and amplitude ‘window’ to be crossed by the unit of interest. The latency of the peak signal within the window was recorded, and the window recentred on this latency after each response, so that it automatically tracked the changes in latency with repetitive stimulation (Fig. 1). It was often not possible to track a unit perfectly throughout an experiment, due to unexpected jumps in latency (see Results), or interference from other units. In such cases the latency profiles were corrected off-line by remeasuring the stored responses with different window settings, or the latency changes were measured from raster plots. After the experiment, raster plots were generated by the computer, which represented each peak in the filtered voltage signal that exceeded a specified level by a dot on a plot with latency as the ordinate and elapsed time as the abscissa. Each dot on the raster plot might represent either an action potential or noise (Fig. 2).
Figure 2. Latency changes displayed as a raster plot.

A, responses (filtered and inverted) from 100–200 ms after stimuli were applied at indicated elapsed times, before, during and after stimulation at 4 Hz for 3 min. * indicates one unit, which slowed much more than a second unit, so the order was briefly reversed at 14 min. B, raster display of all peaks above an arbitrary level, in all recorded responses in the same experiment. The different behaviour of the two units is readily resolved from each other and distinguished from background noise. (At 4 Hz, only alternate responses could be recorded.)
Measurements of conduction slowing and recovery
Absolute latencies and percentages of conduction slowing relative to the basal latency were determined at both 1 and 3 min after the onset of each of the 1, 2 and 4 Hz stimulus trains. Occasionally, the unit being tracked was lost and the sequence had to be discontinued. When this occurred, the analysis of percentage of slowing was performed on the available complete trains. Conduction velocity of each unit was calculated from the baseline latency (while stimulating at 0.25 Hz) and the conduction distance. The recovery time course after cessation of the 1, 2 and 4 Hz periods was also studied. Following Thalhammer et al. (1994) we used two numerical indications of the recovery rate: (1) the time necessary to reverse 50 % of the activity-induced latency change, and (2) the percentage of recovery at 30 s after the end of the stimulus train.
Functional characterization of the units
When one unit in a recording was of much larger amplitude than any other, the receptor type could be characterized by auditory and oscilloscope monitoring of the responses, while testing with strong and weak mechanical and thermal stimuli. To confirm the identification of such units, and in other cases where more than one large unit was recorded, receptor properties were determined from raster plots, using a ‘marking technique’ (Hallin & Torebjörk, 1974; Torebjörk, 1974; Schmelz et al. 1995): mechanical and thermal stimuli were applied to the receptive field while the unit was also stimulated electrically at a regular 0.25 Hz. Natural stimuli capable of activating the unit induced an abrupt change in conduction latency that was displayed in a raster plot or latency profile (see Fig. 9). Mechanical stimuli were delivered with calibrated von Frey monofilaments of known bending forces. Thermal stimuli (both heat and cold) were delivered using a Peltier thermode with a contact area of 1 cm2. In addition, an ice cube was used to deliver noxious cold, and a high thermal capacity metal probe at room temperature (ca. 25°C) was used to deliver a non-noxious cold stimulus. To activate sympathetic fibres, the subject was asked to take a deep breath, or a loud sound was made without warning. Chemical stimuli were not used. Units were classified as nociceptors if they responded vigorously to noxious mechanical (Von Frey hair ∼24 bar), heat (47°C) or cold stimuli (ice cube); and as cold-specific fibres if they exhibited spontaneous discharge at resting temperature which could be inhibited by gentle warming of the skin, and responded strongly to non-noxious cold stimuli (above 25°C).
Figure 9. Functional characterization of units by ‘marking’ with natural stimuli.

A, a type 1 unit is stimulated at aby a metal rod (ca 25 °C), at b by ice, at c by Von Frey hair (24 bar) and at d by heating to 48 °C for 5 s. B, a type 2 unit is excited at a and b by a metal rod (ca 25 °C), confirming that it is a ‘cold’ fibre. Note that rates of recovery after natural stimulation resemble those after repetitive electrical stimulation.
Analysis of spike shapes
Comparison of the shape and amplitude of the action potentials of different C units was performed off-line from the digitized responses. A two-stage procedure was usually employed. In the first stage, a latency profile was measured for the selected unit from digitally filtered and smoothed data (see above), to register the times of occurrence of the action potential peak, minimally affected by high frequency noise. In the second stage, the unfiltered signal, from 1.5 ms before the peak to 3.5 ms after it, was averaged for all traces between selected elapsed times (e.g. the 120 traces between 1 and 3 min after the start of the 1 Hz tetanus). Only when two or more such averages showed a consistent size and shape, uncontaminated by other units, was the average selected for measurement. In the case of most type 3 units (see below), which were too buried in noise for the construction of a latency profile, and which changed very little in latency, the responses were averaged over fixed 5 ms latency ranges. (For the one type 3 unit with a measurable latency profile, averages were recorded both at fixed latency and at latencies relative to the peak. The two averages were indistinguishable.) Typical spike shapes are illustrated in Fig. 13.
Figure 13. Spike waveforms for different types of C fibre.

A, representative waveforms of the three types of C fibre, scaled to same peak-to-peak height. (Top row: type 1; middle row: type 2; bottom row: type 3.) B, waveforms as in A, plotted to same scale. C, means ±s.d. of measured amplitudes of 18 type 1 (top row), 10 type 2 (middle row) and 6 type 3 (bottom row) units, plotted at mean measured separations. Scale bars at bottom right apply to all traces in B and C.
Measurements were made of the times of the start (initial positive deflection), 1st positive peak, 1st baseline crossing, negative peak, 2nd baseline crossing, 2nd positive peak, and the end (or 3rd baseline crossing). The amplitudes of the three peaks were also measured. Since some of these measurements could not be made objectively, the action potentials were plotted scaled to the same peak-to-peak size, coded, and measured ‘blind’ by two observers. The measurements given are the average of the two sets of measurements, which were highly correlated for all variables. (It should be noted that the ‘unfiltered’ average spike shapes presented and measured in this study were all distorted by the high-pass filtering of the microneurography preamplifier, while high frequencies were limited by the 10 kHz sampling frequency.) For Fig. 14 and Table 2, spike heights were measured from baseline to the negative peak, while spike widths were measured from start to end (or 3rd baseline crossing).
Figure 14. Individual spike waveform measurements.
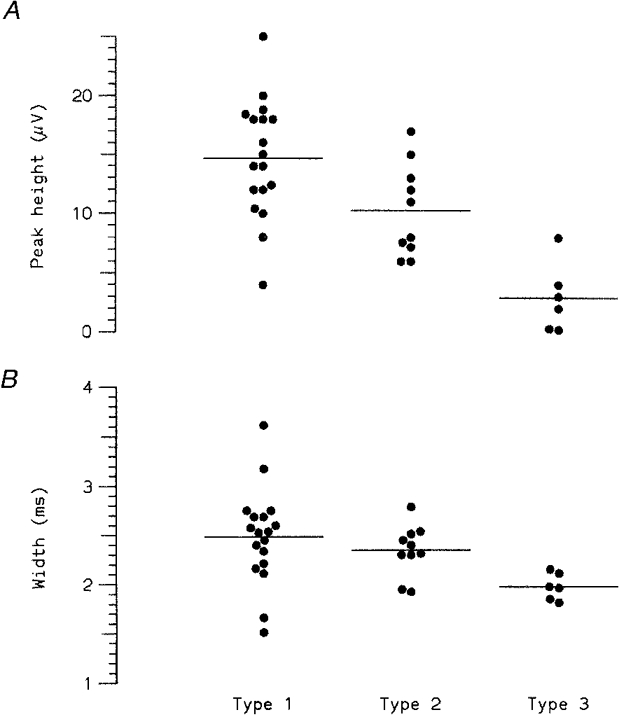
A, amplitude of major (negative) peak of spike waveform for 18 type 1, 10 type 2 and 6 type 3 units. B, widths of same action potentials. Horizontal lines indicate mean values, corresponding to measurements plotted in Fig. 13C. Both amplitude and width of action potentials appeared to vary systematically between C fibre types (see also Table 2).
Table 2.
Comparison of additional properties of the different types of unit
| Type 1 | Type 2 | Type 3 | Type 1 vs.type 2 | Type 1 vs. type 3 | Type 2 vs. type 3 | |
|---|---|---|---|---|---|---|
| Conduction velocity (m s−1) | 0.76 ± 0.30(64) | 0.72 ± 0.35(16) | 0.82 ± 0.59(5) | n. s. | n. s. | n. s. |
| Recovery at 30 s(%) | 47.6 ± 12.2(21) | 69.7 ± 20.3(10) | — | *** | — | — |
| Time to 50% recovery(s) | 37.0 ± 17.0(20) | 20.2 ± 13.2(10) | — | * | — | — |
| Spike amplitude(μV) | 14.7 ± 5.0(18) | 10.3 ± 3.9(10) | 2.9 ± 2.8(6) | * | *** | *** |
| Spike width(ms) | 2.49 ± 0.48(18) | 2.35 ± 0.26(10) | 1.98 ± 0.14(6) | n. s. | * | ** |
The figures quoted are means ± S.D. (number of units measured (n)). ANOVA indicated that conduction velocity was not significantly related to unit type, but spike amplitude and width were related. Comparisons on the right give the results of Student's t tests. The probabilities of the designated means differing by chance by as much as was found are indicated by: n. s. not significant (P > 0.05)
P < 0.05
P < 0.01
P < 0.001.
RESULTS
General characteristics of the population of C units
A total of 281 units with latencies in the range of unmyelinated C fibres were identified as individual lines of dots in the 46 raster plots obtained. Figure 3 illustrates an example of a raster display of at least nine units conducting in the C fibre range. We studied the latency changes induced by the protocol of repetitive stimulation in 88 of these units. We were able to measure latency changes in 70 of the units during the 1 Hz period, in 82 during the 2 Hz period and in 51 during the 4 Hz period. The lower number of available units during the 4 Hz than during the 1 and 2 Hz periods indicates the tendency of the units to be lost or to block as the experiment proceeded. Conduction velocities ranged from 0.31 to 2 ms−1 (0.76 ± 0.32, mean ±s.d., n = 85 units; see also Table 2). There was no significant difference in the mean conduction velocity of the units between controls (0.72 ± 0.30, n = 61) and diabetics (0.84 ± 0.36, n = 24; P > 0.1, Student's t test). The mean number of identifiable units per raster plot was 6.9 ± 4.7, which was also not significantly different between controls and diabetics (P > 0.1).
Figure 3. Raster display of multiple units.
Recordings from another experiment displayed as a raster plot of latencies as in Fig. 2. At least nine different units were recorded at this site.
Latency shifts and ‘conduction block’
Two phenomena were frequently observed during the tracking of latency changes in response to repetitive stimulation (Fig. 4). Occasionally, the potential being tracked showed an abrupt latency variation (‘jump’) that sometimes amounted to several milliseconds. Units tended to switch between two fixed latencies that were constant during both repetitive stimulation and recovery. Jumps are most probably due to excitation failure of the units at one site, so that excitation occurs somewhere else along the axon of the same unit. Abrupt increases in latency are probably due to excitation at a more distant point of the same axon or at another, longer branch of the same unit, while decreases in latency represent the reverse situation. If excitation fails to activate any branch of the unit, then the conduction appears to block, and the increase in latency in response to repetitive stimulation is interrupted for a period of time, after which the unit may be excited again with a shorter latency than immediately before the block occurred. Sometimes the average latency continued to increase slowly, despite intermittent failure (e.g. Fig. 4A). This might be due to conduction failure at a point of low safety factor such as a branch point, so that different sections of the fibre experienced different effective stimulation rates.
Figure 4. ‘Jumping’ and ‘blocking’.

A, tracked latency changes in a single, large amplitude C unit, showing two common features: latency jumps and blocking or failure of conduction. Latency jumps typically occur at similar latencies during repetitive stimulation and recovery, and are interpreted as due to failure of excitation at one site, so that fibre is excited at a more distal site or on another, longer branch. If no branch is excited, conduction fails, and increase in latency is interrupted. B, detail of latency changes in another fibre, which started to fail at 2 Hz, showing alternation between periods when excitation predominantly failed and latency declined, and periods when fibre was excited and latency continued to increase.
Classification of units according to type of conduction slowing
Visual inspection of the raster plots suggested that there existed three ‘profiles’ of latency change (Fig. 5). The first profile, type 1, had a progressive increase in latency during the stimulus trains of 1, 2 and 4 Hz. In addition, conduction block was frequently seen, particularly at the higher stimulation periods of 2 and 4 Hz. The increase of latency was lower at 1 than at 4 Hz. The second profile, type 2, had an initial increment of conduction latency that rapidly reached a plateau. The latency at which the plateau was reached was longest at 4 Hz and lowest at 1 Hz. Conduction block was never seen, even at the 4 Hz stimulation sequence. The third profile, type 3, had no or minimal increment in latency during the sequences of repetitive stimulation, and conduction block was never observed. The minimal degree of latency shift precluded reliable measurement of the latency changes of these units during the 1 Hz repetitive stimulation period. Of the 88 units studied in detail, 67 (76.1 %) were type 1, 16 (18.2 %) were type 2, and 5 (5.7 %) were type 3. (These figures most probably overestimate the proportions of the scarcer type 2 and 3 units, since it was easier to measure a type 2 or 3 than a type 1 unit in a raster containing several other type 1 units.)
The difference in degree of slowing between the three types of units confirmed the segregation of the units into three discrete groups. Figure 6 and Figure 7 illustrate that on stimulation at 4 Hz, type 1 units showed the greatest degree of slowing at both 1 and 3 min, followed by type 2 and type 3 units. The distinction between type 2 and type 3 units was less clear cut than that between type 1 and types 2 and 3, since it was based only on the degree of slowing (e.g. greater or less than 2 % after stimulation at 2 Hz for 3 min), rather than on the time course. The mean percentages of slowing, at both 1 and 3 min, during the 1, 2 and 4 Hz stimulation period are summarized in Table 1. Only type 1 units blocked, as shown by the open circles in the figures. The cumulative percentage distributions of degree of slowing (Fig. 8) show that there was no overlap between the degree of slowing among the different types of unit after the 2 and 4 Hz stimulation periods. A convenient method for differentiating the three types of unit was therefore to measure the percentage of slowing at the end of a 3 min period of repetitive stimulation at 2 Hz.
Figure 6. Effect of duration of repetitive stimulation on slowing in individual C fibres.

Slowing (i.e. increase in latency, expressed as percentage of control) measured at 1 and 3 min after start of repetitive stimulation, showing increasing separation of three types of unit with increasing frequency: type 1 (•), type 2 (▴) and type 3 (▪). 1 at 1 min indicates that the unit fails before 3 min. Symbols connected by lines denote same unit.
Figure 7. Effect of frequency of repetitive stimulation on slowing in individual C fibres.

Degree of slowing after repetitive stimulation at 3 min illustrated for 31 type 1, 10 type 2 and 5 type 3 units for which a complete stimulation sequence was recorded. Symbols as in Fig. 6. ^ indicates unit starts to fail at next higher frequency.
Table 1.
Slowing and block of different types of unit
| Type 1(%) | Type 2(%) | Type 3(%) | ||
|---|---|---|---|---|
| 1 Hz | 1 min | 6.7 ± 3.1(59) | 2.2 ± 0.9(11) | — |
| 3 min | 10.7 ± 4.7(59) | 2.6 ± 0.8(11) | — | |
| 2 Hz | 1 min | 16.7 ± 5.3(63) | 4.8 ± 1.4(14) | 0.8 ± 0.5(5) |
| 3 min | 28.3 ± 9.7(63) | 5.2 ± 1.6(14) | 0.8 ± 0.5(5) | |
| 19 % blocking | ||||
| 4 Hz | 1 min | 31.3 ± 12.0(32) | 9.2 ± 2.4(14) | 1.7 ± 0.6(5) |
| 3 min | 49.8 ± 15.6(32) | 9.5 ± 2.3(14) | 1.7 ± 0.6(5) | |
| 58 % blocking |
Percentage slowing (mean ± S.D. (number of units, n)) after 1 and 3 min, at different stimulation rates and, where intermittent block or failure to excite occurred, the percentage of units blocking by 3 min. NB, measurements of percentage slowing for fibres blocking intermittently are included in this table but not in Figs 6–8.
Figure 8. Effects of repetitive stimulation on three subpopulations of C fibre.

Cumulative percentage distributions of degree of slowing after 3 min of stimulation at different frequencies. Same data as in Fig. 6, with slowing plotted on a logarithmic scale to show the greater than 100-fold range. Type 1 curves (2 and 4 Hz) cross the right-hand axis below 100 % because the remaining units fail to conduct every impulse for 3 min. The only overlap between the three subpopulations occurs between types 1 and 2 at 1 Hz.
Correlation between conduction slowing and receptor modality
We were able to characterize 39 units, using auditory monitoring and/or the marking technique (see Methods and Fig. 9). Only two functional types of receptor were clearly identified: nociceptors were identified by their response only to noxious mechanical, hot or cold stimuli, while cold-specific fibres responded vigorously to non-noxious cold stimuli, and in most cases displayed on-going spontaneous activity at room temperature that could be abolished by gently warming the skin with the fingertips. (We did not attempt to distinguish between nociceptors activated by mechanical stimuli only, mechanical and heat sensitive, and mechanical, heat and cold sensitive nociceptors, as application of the thermode was not always possible without disturbing the stimulating electrodes, and Gee et al. (1996) found no difference in percentage slowing between these nociceptor subtypes.) The signal-to-noise ratio of most of the type 3 units was too small to identify a clear response to any type of stimulus. One type 3 unit responded to a stiff von Frey hair, but its threshold was not determined and it could not be classified. Figure 10 illustrates the clear correlation found between functional modality and type of C fibre as revealed by response to repetitive stimulation. Of 62 type 1 units, a total of 32 could be positively identified as C nociceptors, and seven of the 14 type 2 units were identified as cold C thermoreceptors. There were no type 1 cold fibres or type 2 nociceptors. We did not find any units activated by weak mechanical stimuli or sympathetic activation.
Figure 10. Relationship between response to repetitive stimulation and function of C fibres.
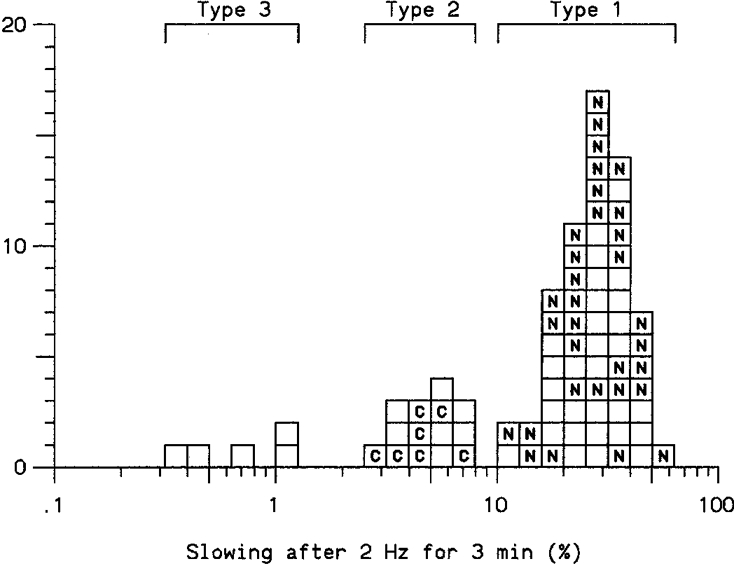
Each square represents a single unit and its degree of slowing after stimulation at 2 Hz for 3 min. N, identified as nociceptor; C, fibre activated by non-noxious cold. Blank squares indicate fibres of unknown function.
Correlation between conduction velocity and type of slowing, and dependence on conduction distance
There was no statistically significant relationship between the resting conduction velocity and the degree of slowing after stimulation at 2 Hz for 3 min, and there were no differences in mean conduction velocities between the three types of unit defined above (Table 2). Therefore, it was not possible to identify separate functional classes of C fibre by measurement of conduction velocity while stimulating at 0.25 Hz. Some of the variability in these conduction velocity estimates could be attributed to the slowing of conduction in the distal parts of the fibre. Regression of conduction velocity on distance accounted for 30 % of the variation in conduction velocity (n = 73), with the estimating equation indicating a rise in mean conduction velocity from 0.62 m s−1 at 50 mm to 0.82 m s−1 for a conduction distance of 100 mm. This distal slowing was similar for the type 1 and type 2 units, so that the type of unit could not be related to conduction velocity even if a correction was made for distal slowing. Although the baseline conduction velocities were dependent on conduction distance, the activity-dependent slowing of conduction, when expressed as a percentage, was independent of distance (e.g. regression of percentage slowing after 3 min at 2 Hz on distance for 57 type 1 units accounted for only 3 % of the variance, P= 0.18).
Measurement of recovery
The three types of C fibre differed not only in the degree of slowing following repetitive stimulation, but also in the rate of recovery after cessation of the tetanus. Figure 11 shows that type 1 units took a longer time for the activity-induced latency change to recover to 50 % of its maximum value, and that the percentage of recovery at 30 s after the end of the stimulus train was less for type 1 than for type 2 units (see also Table 2). Type 3 units could not be measured reliably, due to the minimal slowing achieved even at the higher 4 Hz period. The rate of recovery was dependent on the type of fibre, being clearly slower for type 1 units, but was independent of the resting conduction velocity of the unit, and of the degree of slowing achieved by the individual fibre (Fig. 12). This suggests that the rate of recovery was controlled by a different mechanism from the degree of slowing (see Discussion).
Figure 11. Relationship between rate of recovery from repetitive stimulation and type of C fibre.

A, time for recovery to 50 % of resting latency after stimulation at 2 Hz for 3 min. B, percentage recovery 30 s after same train. Horizontal bars indicate mean values. Differences between type 1 and type 2 fibres were significant in each case (see Table 2).
Figure 12. Rate of recovery depends on type of C fibre but is unrelated to extent of slowing.

Data for type 1 (0) and type 2 (8) fibres from Fig. 11A plotted on logarithmic scale against the degree of slowing of the fibre after 3 min at 2 Hz. Ellipses are 95 % confidence limits for individuals from the two subpopulations (if distributed as bi(log)normal deviates). The subpopulations differ with respect to both variables, but there is no correlation between recovery and slowing within either subpopulation.
Correlation between action potential waveform and type of slowing
All the action potentials were predominantly triphasic, with a major central negative peak, as previously noted for human C fibres (Nordin, 1990) (note that Figs 1 and 2 showed the inverted signal, to produce an upgoing peak for the program to track). Typical spike waveforms for the different types of unit are illustrated in Fig. 13A scaled to the same peak-to-peak amplitude and in Fig. 13B plotted to the same absolute scale. The means of the measured amplitudes for all units of the same type are compared in Fig. 13C. Comparison of the peak heights and widths (Fig. 14, Table 2) confirmed our strong impression that the different types of C fibre had spikes of different amplitude and duration. However the size comparison cannot be taken at face value because there was a sampling bias: we measured all the type 2 and 3 units for which we could obtain reliable average waveforms, but only a fraction of the available type 1 units, biased towards the more easily measured (and therefore larger) units. The apparent difference in amplitude between type 1 and type 2 units may therefore be due to sampling bias, but it is difficult to explain the much more striking difference between type 2 and type 3 units in the same way. It seems reasonable to hypothesize that the smaller size and duration of the potentials recorded from the type 3 units are associated with smaller net ion movements (see Discussion).
DISCUSSION
The main finding of this study has been that different functional classes of human cutaneous C fibres respond very differently to repetitive stimulation. Here we discuss the relationship of these findings to animal studies, possible mechanisms responsible for this differential behaviour, and the relationship of axonal sensitivity to trains of impulses to the normal functioning of the sensory unit.
Our observations on type 1 (progressively slowing) and type 2 (slowing to plateau) units, and our correlation of these types with nociceptors and cold-specific fibres, respectively, are in excellent agreement with the observations of Thalhammer et al. (1994) in the rat. Although they used shorter trains, they also observed that the greater latency changes in C nociceptors are associated with a greater tendency to conduction block. A more recent study of C units in rat saphenous nerve by Gee et al. (1996) found that a much shorter stimulus protocol (20 Hz for 20 s) was also effective at discriminating fibres of different modality. They further found that two additional classes of fibre could be distinguished in this way: sympathetic efferents and low-threshold mechanoreceptors showed a degree of slowing intermediate between cold fibres and nociceptors. We did not identify any of the C units in this study as sympathetic efferents, which may seem surprising since the skin of the dorsum of the foot has sudomotor, piloerector and vasoconstrictor innervation. However, the microneurography needle was positioned in the nerve specifically to record C afferent activity, using intraneural microstimulation and sensory feedback, and it has been found that single sympathetic units are never recorded at the same site as single afferent C fibres, even with slight adjustment of the needle position (Hallin et al. 1991).
Gee et al. (1996) reported that interestingly, although the mechanoreceptors slowed much more than the cold units after 6 s at 20 Hz, the mechanoreceptor slowing reached a plateau earlier, suggesting that after much longer trains the mechanoreceptors might be slowed less than the cold fibres. This raises the possibility that our type 3 units could correspond to low-threshold mechanoreceptors. Nordin (1990) has described low-threshold C mechanoreceptor units in human supraorbital nerve, which discharged at up to 100 Hz. None of his data allows a very direct comparison with our type 3 units, but he illustrates a unit recovering in latency from a brief natural stimulus within a few seconds (time to 50 % recovery). Such rapid recovery is not seen for type 1 units, but is compatible with type 2 or type 3 units. Other possibilities for the type 3 units include unresponsive nociceptors (Schmidt et al. 1995), sympathetic efferents or warm receptors, and no firm conclusion on their function is possible at this stage.
The remarkably different responses to repetitive stimulation of fibres of similar conduction velocity illustrated in Fig. 8, encompassing a more than 25-fold range in slowing after 2 Hz for 3 min between type 1 and type 3 fibres (median values), indicate important differences in membrane or other properties. Trains of impulses induce hyperpolarization of C fibres by activation of the electrogenic sodium pump (Na+-K+-ATPase; Rang & Ritchie, 1968). A similar phenomenon occurs in A fibres (Bostock & Grafe, 1985), except that the much greater surface-to-volume ratio of C fibres causes intracellular sodium to rise appreciably at very much lower impulse rates. In A fibres the post-tetanic hyperpolarization is limited by caesium-sensitive inward rectification (Baker et al. 1987), due to an ion conductance (Ih), activated by hyperpolarization (Pape, 1996). Recent studies of human peripheral nerves in vitro have shown that this mechanism is important in afferent C fibres at frequencies as low as 1 Hz (Grafe et al. 1997). These observations suggest that C fibres resistant to repetitive stimulation may express more Ih.
Although differences in Ih would result in different degrees of electrogenic hyperpolarization and could therefore account for the different latency changes on repetitive stimulation, they could not account for the different rates of recovery to the resting state (see Fig. 11). The reason that type 2 fibres quickly reach a plateau at 4 Hz must rather be because at this rate they are able to pump out sodium ions as fast as they enter, suggesting that it is either a greater rate of pumping, or less sodium entry per impulse, that enables them to recover from an impulse train more quickly than the type 1 fibres. Type 1 fibres could admit more sodium ions per impulse because they have longer action potentials, due to their expression of TTX-resistant sodium channels and/or calcium channels (Quasthoff et al. 1995). Our data on spike waveform suggest that the ability of type 3 units to conduct long trains of impulses without slowing may be related to the small size and duration of their action currents. However, although there may also be a small difference in spike duration between type 1 and type 2 fibres (Figs 13 and 14), it is unlikely to be great enough to account for the differences in slowing. Alternatively, a greater expression of Na+-K+-ATPase in type 2 fibres, combined with a greater expression of Ih to limit the effects on membrane potential of the greater pump current could explain the differences. A separation between the factors limiting slowing and those responsible for recovery is consistent with our data in Fig. 12. This shows that there was no correlation, within either the type 1 or type 2 fibre populations, between the percentage slowing after 2 Hz for 3 min and the subsequent rate of recovery. Slowing and recovery are only correlated in the population as a whole because they both depend on fibre type.
Redistribution of ions other than sodium may also be important. Gee et al. (1996) proposed that the activity-dependent hyperpolarization might be a consequence of intracellular calcium accumulation activating a K+ conductance. This would fit in with other evidence that certain C fibres, most probably nociceptors, express calcium channels (Quasthoff et al. 1995). However, although K+ conductances are well known to modulate axonal excitability (Bostock et al. 1998), there is, as yet, no evidence that they can cause sufficient hyperpolarization to block conduction. In the case of repetitively stimulated rabbit vagus C fibres in vitro, increasing extracellular K+ actually increases the hyperpolarization, due to activation of the sodium pump (Rang & Ritchie, 1968).
Whatever the mechanisms involved, the variations in activity-dependent slowing have important functional implications. The progressive increase in latency of the type 1 fibres was clearly associated with a progressive decrease in excitability, which resulted in conduction block for these nociceptor fibres only, as also noted by Thalhammer et al. (1994). The rise in electrical threshold indicates that the fibre would also have a higher threshold for excitation by a natural stimulus, and the absence of any plateau in the latencies suggests that the maximum continuous rate of nociceptor discharge is severely limited by the properties of the axons. Moreover, since type 2 and type 3 units with similar velocities behave quite differently, this limitation on the nociceptor impulse transmission cannot be attributed simply to the small diameter of the axons, but must be regarded as a special property of these axons, possibly with adaptive significance.
Acknowledgments
This work was supported by NIH (RO1 NS33679) and the Good Samaritan Research Foundation.
References
- Baker M, Bostock H, Grafe P, Martius P. Function and distribution of three types of rectifying channel in rat spinal root myelinated axons. The Journal of Physiology. 1987;383:45–67. doi: 10.1113/jphysiol.1987.sp016395. [DOI] [PMC free article] [PubMed] [Google Scholar]
- Bergmans J. The Physiology of Single Human Nerve Fibres. Vander, Belgium: University of Louvain; 1970. [Google Scholar]
- Bostock H, Cikurel K, Burke D. Threshold tracking techniques in the study of human peripheral nerve. Muscle and Nerve. 1998;21:137–158. doi: 10.1002/(sici)1097-4598(199802)21:2<137::aid-mus1>3.0.co;2-c. [DOI] [PubMed] [Google Scholar]
- Bostock H, Grafe P. Activity-dependent excitability changes in normal and demyelinated rat spinal root axons. The Journal of Physiology. 1985;365:229–257. doi: 10.1113/jphysiol.1985.sp015769. [DOI] [PMC free article] [PubMed] [Google Scholar]
- Davis KD, Meyer RA, Campbell JN. Chemosensitivity and sensitization of nociceptive afferents that innervate the hairy skin of monkey. Journal of Neurophysiology. 1993;69:1071–1081. doi: 10.1152/jn.1993.69.4.1071. [DOI] [PubMed] [Google Scholar]
- Gasser HS. Changes in nerve potentials produced by rapidly repeated stimuli and their relation to the responsiveness of nerve to stimulation. American Journal of Physiology. 1935;111:35–50. [Google Scholar]
- Gee MD, Lynn B, Cotsell B. Activity-dependent slowing of conduction velocity provides a method for identifying different functional classes of C-fibre in the rat saphenous nerve. Neuroscience. 1996;73:667–675. doi: 10.1016/0306-4522(96)00070-x. 10.1016/0306-4522(96)00070-X. [DOI] [PubMed] [Google Scholar]
- Grafe P, Quasthoff S, Grosskreutz J, Alzheimer C. Function of the hyperpolarization-activated inward rectification in nonmyelinated peripheral rat and human axons. Journal of Neurophysiology. 1997;77:421–426. doi: 10.1152/jn.1997.77.1.421. [DOI] [PubMed] [Google Scholar]
- Hallin RG, Ekedahl R, Frank O. Segregation by modality of myelinated and unmyelinated fibres in human sensory nerve fascicles. Muscle and Nerve. 1991;14:157–165. doi: 10.1002/mus.880140211. [DOI] [PubMed] [Google Scholar]
- Hallin RG, Torebjörk HE. Methods to differentiate electrically induced afferent and sympathetic C units responses in human cutaneous nerves. Acta Physiologica Scandinavica. 1974;92:318–331. doi: 10.1111/j.1748-1716.1974.tb05750.x. [DOI] [PubMed] [Google Scholar]
- Lynn B. The fibre composition of cutaneous nerves and the classification and response properties of cutaneous afferents, with particular reference to nociception. Pain Review. 1994;1:172–183. [Google Scholar]
- Meyer RA, Davis KD, Cohen RH, Treede R-D, Campbell JN. Mechanically insensitive afferents (MIAs) in cutaneous nerves of monkey. Brain Research. 1991;561:252–261. doi: 10.1016/0006-8993(91)91601-v. 10.1016/0006-8993(91)91601-V. [DOI] [PubMed] [Google Scholar]
- Nordin M. Low-threshold mechanoreceptive and nociceptive units with unmyelinated (C) fibres in the human supraorbital nerve. The Journal of Physiology. 1990;426:229–240. doi: 10.1113/jphysiol.1990.sp018135. [DOI] [PMC free article] [PubMed] [Google Scholar]
- Ochoa J, Torebjörk HE. Sensations evoked by selective intraneural microstimulation of identified C nociceptor fibres in human skin nerves. The Journal of Physiology. 1989;415:583–599. doi: 10.1113/jphysiol.1989.sp017737. [DOI] [PMC free article] [PubMed] [Google Scholar]
- Pape HC. Queer current and pacemaker: the hyperpolarization-activated cation current in neurons. Annual Review of Physiology. 1996;58:299–327. doi: 10.1146/annurev.ph.58.030196.001503. 10.1146/annurev.ph.58.030196.001503. [DOI] [PubMed] [Google Scholar]
- Quasthoff S, Grosskreutz J, Schneider U, Grafe P. Calcium potentials and tetrodotoxin-resistant sodium potentials in unmyelinated C fibres of biopsied human sural nerve. Neuroscience. 1995;69:955–965. doi: 10.1016/0306-4522(95)00307-5. 10.1016/0306-4522(95)00307-5. [DOI] [PubMed] [Google Scholar]
- Rang HP, Ritchie JM. On the electrogenic sodium pump in mammalian non-myelinated nerve fibres and its activation by various external cations. The Journal of Physiology. 1968;196:183–221. doi: 10.1113/jphysiol.1968.sp008502. [DOI] [PMC free article] [PubMed] [Google Scholar]
- Ritchie JM, Straub RW. The hyperpolarization which follows activity in mammalian non-medullated fibres. The Journal of Physiology. 1957;136:80–97. doi: 10.1113/jphysiol.1957.sp005744. [DOI] [PMC free article] [PubMed] [Google Scholar]
- Schmelz M, Forster C, Schmidt R, Ringkamp M, Handwerker HO, Torebjörk HE. Delayed responses to electrical stimuli reflect C-fibre responsiveness in human microneurography. Experimental Brain Research. 1995;104:331–336. doi: 10.1007/BF00242018. [DOI] [PubMed] [Google Scholar]
- Schmidt R, Schmelz M, Forster C, Ringkamp M, Torebjörk HE, Handwerker H. Novel classes of responsive and unresponsive C nociceptors in human skin. Journal of Neuroscience. 1995;15:333–341. doi: 10.1523/JNEUROSCI.15-01-00333.1995. [DOI] [PMC free article] [PubMed] [Google Scholar]
- Thalhammer JG, Raymond SA, Popitz-Bergez FA, Strichartz GR. Modality-dependent modulation of conduction by impulse activity in functionally characterized single cutaneous afferents in the rat. Somatosensory Motor Research. 1994;11:242–257. doi: 10.3109/08990229409051392. [DOI] [PubMed] [Google Scholar]
- Torebjörk HE. Afferent C units responding to mechanical, thermal and chemical stimuli in human non-glabrous skin. Acta Physiologica Scandinavica. 1974;92:374–390. doi: 10.1111/j.1748-1716.1974.tb05755.x. [DOI] [PubMed] [Google Scholar]
- Torebjörk HE, Ochoa JL. New method to identify nociceptor units innervating glabrous skin of the human hand. Experimental Brain Research. 1990;81:509–514. doi: 10.1007/BF02423499. [DOI] [PubMed] [Google Scholar]
- Vallbo Å, Hagbarth K-E. Activity from skin mechanoreceptors recorded percutaneously in awake human subjects. Experimental Neurology. 1968;21:270–289. doi: 10.1016/0014-4886(68)90041-1. 10.1016/0014-4886(68)90041-1. [DOI] [PubMed] [Google Scholar]