

Abstract
Single muscle fibres were dissociated enzymatically from the extensor digitorum communis muscle of rats. The fibres were mounted into a double Vaseline gap experimental chamber and the events in excitation-contraction coupling were studied under voltage clamp conditions in the presence and absence of the local anaesthetic tetracaine.
Changes in intracellular calcium concentration ([Ca2+]i) were monitored using the calcium sensitive dyes antipyrylazo III and fura-2 and the rate of calcium release (Rrel) from the sarcoplasmic reticulum (SR) was calculated. Tetracaine decreased the maximal attained [Ca2+]i and suppressed, in a dose-dependent manner, both the early peak and the steady level of Rrel in the voltage range examined.
The concentration dependence of the effects on the two kinetic components of Rrel were almost identical with a half-effective concentration (K50) of 70 and 71 μm and a Hill coefficient (nH) of 2.7 and 2.3 for the peak and the steady level, respectively. Furthermore, the drug did not alter the peak to steady level ratio up to a concentration (50 μm) that caused a 35 ± 5% reduction in calcium release. Higher concentrations did suppress the ratio but the degree of suppression was voltage independent.
Tetracaine (50 μm) neither influenced the total available intramembrane charge nor altered its membrane potential dependence. It shifted the transfer function, the normalized SR permeability versus normalized charge to the right, indicating that similar charge transfer caused a smaller increase in SR permeability.
To explore the site of action of tetracaine further the ryanodine receptor (RyR) calcium release channel of the SR was purified and reconstituted into planar lipid bilayers. The reconstituted channel had a conductance of 511 ± 14 pS (n = 8) in symmetric 250 mm KCl that was not affected by tetracaine. Tetracaine decreased the open probability of the channel in a concentration-dependent manner with K50 = 68 μm and nH = 1.5.
These experiments show that tetracaine suppresses SR calcium release in enzymatic isolated mammalian skeletal muscle fibres. This effect is due, presumably, to the decreased open probability of the RyR in the presence of the drug. Since both the inactivating peak and the steady level of Rrel were equally affected by tetracaine, our observations suggest that there is a tight coupling between these kinetic components of SR calcium release in mammalian skeletal muscle.
Tetracaine has been a commonly used tool for studying the events of excitation-contraction coupling (E-CC). It not only alters intramembrane charge movement (Huang, 1981; Hui, 1983) but suppresses the calcium transients (Vergara & Caputo, 1983; Csernoch et al. 1988) by interfering with the release of calcium from the sarcoplasmic reticulum (SR; Pizarro et al. 1992). In both intact and cut fibres tetracaine preferentially eliminates the delayed, qγ hump, component of intramembrane charge (e.g. Huang, 1988), although cut fibres seem to be more sensitive (Csernoch et al. 1988) towards the drug.
Most of our knowledge regarding the time course of SR calcium release (for review on calcium release see e.g. Melzer et al. 1995) in the presence of tetracaine was obtained from measurements on frog skeletal muscle fibres. In amphibians the early, inactivating peak of calcium release was suppressed by low (≤ 20 μM) concentrations of the drug while the maintained steady level was unaffected (Pizarro et al. 1992). Increasing the concentration (≥ 50 μM) of tetracaine eliminated the early peak but also affected the steady component (Sárközi et al. 1996a). Thus the concentration dependence of the effects on the different kinetic components of SR calcium release was found to be different. Not only was the affinity for suppressing the steady level lower, it also required the binding of more tetracaine molecules (Sárközi et al. 1996a). Since amphibians express both the α and β isoforms of RyR (RyRα and RyRβ) it was suggested that the differential action on the peak and steady level of SR calcium release represents the differential block of the two isoforms (Pizarro et al. 1992, Sárközi et al. 1996a).
It has been demonstrated that tetracaine blocks the skeletal type ryanodine receptor (RyR1) isolated from rabbit skeletal muscle with a half-effective concentration (K50) of 180 μM and a Hill coefficient (nH) of 2.2 (Xu et al. 1993) providing direct evidence for the proposed effect. However, comparing the different isoforms of fish skeletal muscle RyRs (RyRα and RyRβ) revealed a clear difference in their tetracaine sensitivity with a K50 of 66 μM for RyRα and little effect on RyRβ (O'Brien et al. 1995). This questioned the simple idea (Ríos & Pizarro, 1988) that the inactivating peak of SR calcium release was entirely due to the activation of the RyRβ in amphibian muscle. Expressing mainly the RyR1 isoform the action of tetracaine on mammalian skeletal muscle fibres is thus of special interest for understanding the events in E-CC and how local anaesthetics interfere with the signal transduction process.
These results compare for the first time, data obtained on cut muscle fibres and on isolated RyR from the same species and present evidence that tetracaine suppresses SR calcium release in mammalian skeletal muscle. The suppression of steady and inactivating components had essentially identical dose dependence. Single channel measurements on RyR suggest that the underlying reason for the suppression of Rrel was the decrease in open probability in the presence of the drug.
METHODS
Enzymatic dissociation and solutions
Single skeletal muscle fibres were isolated enzymatically from the extensor digitorum communis (EDC) muscles of the rat and mounted into a double Vaseline gap chamber with a slightly modified procedure to that described earlier (Szentesi et al. 1997). In brief, the 3- to 5-month-old Wistar rats of either sex were anaesthetized with ether and killed by cervical dislocation. The muscles were removed and placed into a modified Krebs solution (mM): 135 NaCl, 5 KCl, 2.5 CaCl2, 1 MgSO4, 10 Hepes, 10 glucose, 10 NaHCO3. They were then dissected into three or four smaller pieces and moved into the modified Krebs solution supplemented with 4 % fetal calf serum (FCS). The muscle pieces were placed into an incubator (IG 150, Jouan, Saint Herblain, France) at 37°C and treated with collagenase (Sigma, Type I, 1 mg ml−1) for 1.5 h and gently shaken. After the dissociation the muscles were washed with FCS supplemented modified Krebs solution and stored at 4°C until further use. Fibres were allowed to rest after enzymatic treatment for at least 20 min and only those that showed no signs of membrane damage were used. The selected fibre was gently sucked into a glass capillary and transferred into the recording chamber (Kovács et al. 1983) filled with relaxing solution (composition (mM): 150 potassium glutamate, 2 MgCl2, 10 Hepes, 1 EGTA).
To permeabilize the fibre segment in the open-end pools the relaxing solution was exchanged after the Vaseline isolation for 30 s to a relaxing solution containing 0.01 % saponin. After completing the permeabilization the solutions were exchanged to internal solution (mM): 120 caesium glutamate, 5.5 MgCl2, 5 Na2ATP, 10 sodium phosphocreatine, 10 glucose, 10 Hepes in the open-end pools and to external solution (mM): 140 tetraethylammonium-CH3SO3, 2 CaCl2, 2 MgCl2, 10 Hepes; 10−7 g ml−1 tetrodotoxin in the middle pool. All solutions were adjusted to pH 7.2 and 300 mosmol l−1. The internal solution also contained 1 mM antipyrylazo III (APIII) and 100 μM fura-2 for the detection of the intracellular calcium concentration and either 0.1 or 5 mM EGTA as detailed below.
The sarcomere length (SL) was set to 2.2–2.5 μm (slack fibre) except for the fibre in Fig. 1 which was stretched beyond filament overlap (SL ≥ 3.6 μm). In slack fibres 5 mM EGTA was added to the internal solution to prevent contraction (Shirokova et al. 1996). Data from the stretched fibre are presented to demonstrate the effects of including 5 mM EGTA in the internal solution. In all fibres, calcium was added to the internal solution to set the free [Ca2+]i to 100 nM. The length of the fibre segment in the middle pool was set to 500 μm.
Figure 1. Comparison of changes.
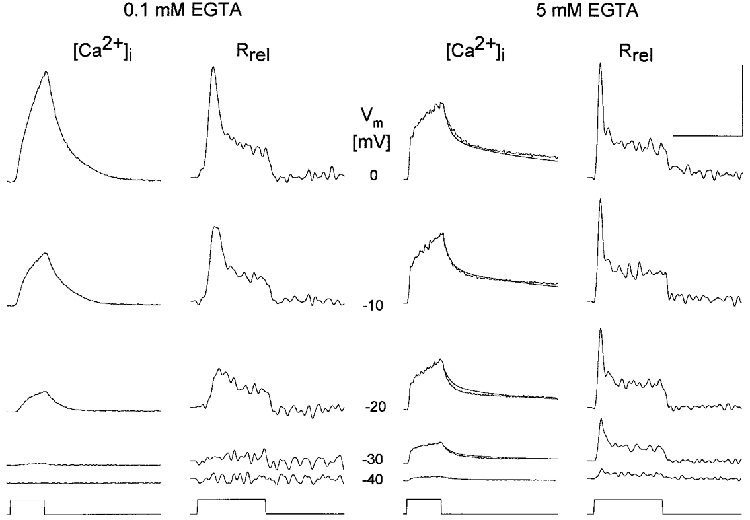
Comparison of changes in intracellular calcium concentration ([Ca2+]i) and SR calcium release flux (Rrel) from stretched (0.1 mM EGTA) and slack fibres (5 mM EGTA). [Ca2+]i was calculated from changes in APIII absorbance in the presence of 0.1 mM EGTA and from fura-2 fluorescence in the presence of 5 mM EGTA. Rrel was obtained by first fitting the decay of the calcium transient with a removal model that included the buffer. The predicted decay after repolarization is superimposed for the slack fibre (noiseless traces). Membrane potentials during the 100 ms test pulses are shown in each row. APIII concentration ([APIII]), 865–893 and 603–684 μM; fura-2 concentration ([fura-2]), 0 and 67–78 μM; koff,Mg-P, 5.4 and 4.7 s−1; PVmax, 3.19 and 1.86 mM s−1 for the stretched and slack fibre, respectively; kon,Ca-E, 0.93 m−1 s−1 and koff,Ca-E 10.2 s−1. Vertical calibration bar corresponds in case of [Ca2+]i to 4 μM for the stretched and 1 μM for the slack fibre, but to 12 μM ms−1 for Rrel in both fibres. Horizontal calibration is 200 ms for [Ca2+]i and 100 ms for Rrel. Sarcomere length (SL), 3.9 and 2.5 μm in stretched and slack fibres, respectively.
The experimental set-up and data acquisition have been described in detail in our earlier reports (e.g. Sárközi et al. 1996b). In brief, the fibre was transilluminated using a tungsten halogen light source (λ > 600 nm) and was also epi-illuminated at 380 nm or at the isosbestic wavelength of fura-2 using a 75 W Xenon arch lamp (Oriel 60000; Stratford, CT, USA). The actual arrangement of interference filters and dichroic mirrors (Klein et al. 1988) enabled the simultaneous recording of light intensities at 510, 720 and 850 nm for the detection of APIII absorbance and fura-2 fluorescence. Fibres were voltage clamped, the holding potential was set to −100 mV. All measurements were carried out at 16–18°C.
Calculation [Ca2+]i and Rrel
In the stretched fibre changes in the myoplasmic free calcium concentration were calculated from APIII absorbance (Fig. 1, left column) as described by Kovács et al. (1983) using the correction for intrinsic fibre absorbance at 850 nm following the procedure in Melzer et al. (1986). Fura-2 fluorescence was used to calculate the resting [Ca2+]i. In slack fibres (Fig. 1, third column from left) the changes in [Ca2+]i were calculated from the fluorescence ratio (R) signals using the kinetic correction (Klein et al. 1988):
| (1) |
where Rmax and Rmin are the values of R at saturating and zero calcium, respectively, while kon,f and koff,f are the forward and backward rate constants of calcium binding to fura-2, respectively.
The rate of calcium release from the SR (Rrel, second and fourth columns in Fig. 1) was calculated from the calcium transient using the procedure described in Szentesi et al. (1997). In fibres with low EGTA two parameters of the removal model were fitted simultaneously, koff,M-P (Mg2+ off-rate from parvalbumin) and PVmax (maximal transport rate of SR calcium pump) while [parv] (concentration of parvalbumin) was fixed at the value of 690 μM, as calculated by García & Schneider (1993). In slack fibres, with 5 mM EGTA in the internal solution, the rate constant of EGTA (E), koff,Ca-E and kon,Ca-E, were also fitted. Introducing these parameters into the fit enabled the characterization of the removal of calcium in the presence of the calcium buffer as shown in Fig. 1 by the superimposed predicted decays (third column, noiseless traces). Although the presence of EGTA suppressed (note the difference in scales for the two columns) the attained maximal [Ca2+]i, most prominent at 0 mV in Fig. 1, it did not significantly influence the magnitude of the calculated rate of SR calcium release.
To estimate the time course and number of open release channels in the SR membrane the calculated Rrel records were corrected for the depletion of calcium in the SR and expressed as the percentage of SR content (Csernoch et al. 1993). The voltage (Vm) dependence of either component of calcium release (Rrel,i(Vm), where i = peak or steady level) was assessed by fitting the two-state Boltzmann function:
| (2) |
where Rrel,i[max] is the maximal release rate, V′ is the voltage at half-maximal release rate and k is the slope factor, to the calculated data.
Isolation of RyR
The ryanodine receptor calcium release channel was isolated from rat skeletal muscle by slightly modifying the procedure described earlier for rabbit (Lai & Meissner, 1992). Skeletal muscles were removed from the front and hind legs of those rats that were used to obtain the isolated fibres for the Vaseline gap experiments. The muscles were cut into small pieces, quickly frozen by immersing them into liquid nitrogen and then stored at −70°C until further use.
First heavy SR (HSR) vesicles were isolated. To this end muscles were homogenized in 100 mM NaCl, 20 mM EGTA, 20 mM Na-Hepes (pH = 7.5) and the unsolubilized particles were removed in a clinical centrifuge. Crude microsomes were collected from the resulted supernatant by centrifugation at 40 000 g (30 min). To dissolve the actomyosin content the pellet was resuspended in 600 mM KCl, 10 mM K-Pipes, 250 mM sucrose, 1 mM EGTA, 0.9 mM CaCl2 (pH, 7.0). After incubation of 1 h at 4°C, the microsome fraction was collected at 109 000 g, for 30 min, and the pellet was resuspended in 100 mM NaCl, 10 mM K-Pipes and 500 mM sucrose (pH, 7.0). This microsome was loaded onto a 20–45 % linear sucrose gradient, spun for 16 h at 90 000 g (4°C) in a swing-out (SW-27) Beckman rotor. The protein ring corresponding to the HSR fraction was extracted from the 36–38 % region and collected at 124 000 g for 660 min. After resuspending the membranes in 0.4 M sucrose, 10 mM K-Pipes (pH, 7.0) they were used instantly for RyR purification. Protease inhibitors (200 μM Pefabloc (4-(2-aminoethyl)-benzolsulphonylfluoride), 100 nM aprotinin, 1 μM leupeptin, 1 μM pepstatin A and 1 mM benzamidine) were also included to prevent the proteolysis during the isolation. Protein concentration of HSR vesicles was determined according to Lowry, using bovine serum albumin as standard.
HSR vesicles (3 mg ml−1) were solubilized for 2 h at 4°C with 1 % CHAPS (3[(3-chloramidopropyl)dimethyl-amino]-1-propanesulphonate) in a solution containing 1 M NaCl, 100 μM EGTA, 150 μM CaCl2, 5 mM AMP, 0.45 % phosphatidylcholine, 20 mM Na-Pipes (pH, 7.2), protease inhibitors as stated above and, additionally, 1 μM calpain inhibitor I (N-acetyl-leu-leu-norleucinal) and 1 μM calpain inhibitor II (N-acetyl-leu-leu-methionial). The extent of ryanodine receptor solubilization and the subsequent migration distance of the solubilized receptor in the sucrose gradients was monitored by labelling one part of the solubilized sample with [3H]ryanodine. Unsolubilized proteins were removed by centrifugation at 59 000 g, and subsequently the supernatant was layered on top of a 10–28 % sucrose gradient also containing 1 % CHAPS, 0.7 M NaCl, 10 mM AMP, 0.5 % phosphatidylcholine, 70 μM EGTA, 100 μM CaCl2, 1 mM DTT (dithiotrietol), 13 mM Na-Pipes (pH, 7.2) with all the protease inhibitors which were used before. Unlabelled and [3H]ryanodine-labelled solubilized SR membranes were centrifuged through identical sucrose gradients for 16 h at 90 000 g (4°C) in a swing-out (SW-27) Beckman rotor. Fractions of the unlabelled gradient corresponding - by sucrose density - to the peak of the [3H]ryanodine bound receptors were collected, rapidly frozen in liquid nitrogen and stored at −70°C. Fractions were also analysed using gel electrophoresis (see below). The RyR content was found to be between 65–85 % based on the Comassie Blue stained gel densitogramms (Fig. 2).
Figure 2. SDS-polyacrylamide gel electrophoresis of the rat HSR and RyR.
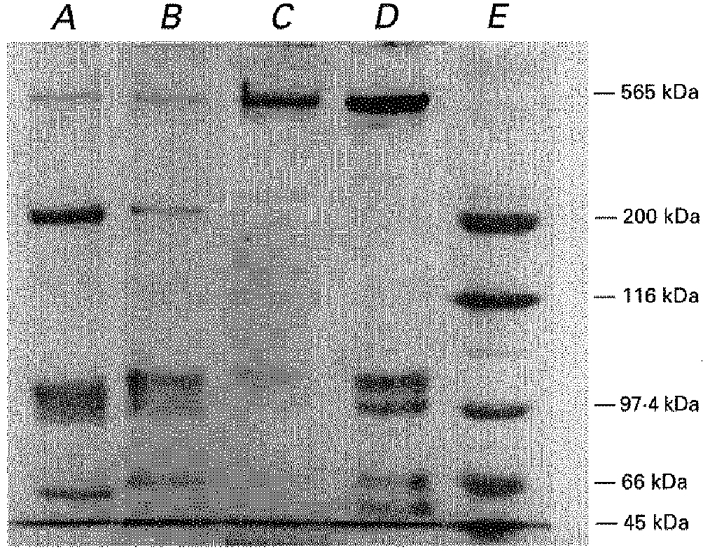
Rat heavy SR vesicles and solubilized calcium release channels were prepared as described in Methods, while rabbit SR vesicles and calcium release channels were prepared as described previously (Lai & Meissner, 1992). Laemli type, 10 % acrylamide gels were used and approximately 8 μg protein was applied into each lane. Molecular weights are indicated at the right. A, rabbit heavy SR vesicles; B, rat heavy SR vesicles; C, solubilized rabbit RyR calcium release channel; D, solubilized rat RyR; E, molecular weight standards. Note that no difference was found between the mobility of rabbit and rat RyR (565 kDa).
Gel electrophoresis
Aliquots of the HSR vesicles and fractions of the solubilized receptor collected from the sucrose density gradient were visualized (Fig. 2) on SDS PAGE (sodium-dodecyl-sulphate polyacrylamide gel electrophoresis) of Laemli type using 10 % linear gel as described earlier (Seidler et al. 1989). In each well about 5 μg of protein were applied in a volume of 5–15 μl; according to the protein concentration of the given sample. Running voltage was set to 100 V for 90 mins. Protein and molecular weight determination, calibration of the Comassie Blue stained gels as well as hard copy pictures (Fig. 2) were obtained using the Gel Doc 1000 system (Bio-Rad Laboratories, Hercules, CA, USA).
Planar lipid bilayer measurements
CHAPS solubilized ryanodine receptor molecules were incorporated into planar lipid bilayers (Tripathy & Meissner, 1996). Bilayers were formed across a 200 or 250 μm aperture of a nolrene cap using a lipid mixture composed of phosphatidylethanolamine, phosphatidylserine and L-α-phosphatidylcholine in the weight ratio 5 : 4 : 1. Lipids were dissolved in n-decane up to a final lipid concentration of 20 mg ml−1. Reconstitution was initiated in symmetric buffer solution (250 mM KCl, 100 μM EGTA, 150 μM CaCl2, 20 mM Pipes, pH, 7.2), using K+ as charge carrier. Small aliquots of the solubilized receptor were added to one side of the bilayer chamber defined as the cytoplasmic (cis) side, meanwhile the other chamber was regarded as the luminal (trans) side. Successful incorporation was detected as a stepwise increase in current. Electrical signals were filtered at 1 kHz through an 8-pole low-pass Bessel filter and digitized at 3 kHz using Axopatch 200 and pCLAMP 6.03 (Axon Instruments, Foster City, CA, USA). Channels with conductance higher than 400 pS were accepted as RyR. Open probability values (Po) were calculated from representative data segments of 10–90 s duration. Total recording time in each experiment was more than 5 min, for the experimental condition tested. This time duration appeared to be enough to reach the equilibrium of channel parameters. Measurements were carried out at 22–25°C, the concentration of ionized (‘free’) Ca2+ was calculated using the computer program and binding constants published by Fabiato (1988). Tetracaine was applied in the cis chamber, in concentrations ranging from 25 μM to 1 mM by successive additions of given amounts of 30 mM tetracaine stock solution.
The dose-dependent effects of tetracaine (Supp([tetr])) were assessed by fitting the Hill equation to the normalized data:
| (3) |
where K50 is the concentration where 50 % suppression is achieved, nH is the Hill coefficient and [tetr] is the concentration of the drug.
Intramembrane charge movement
Intramembranous charge transfer was measured as described in detail previously (Szentesi et al. 1997). The linear capacitive current, determined from hyperpolarizing pulses of −20 mV in amplitude from the holding potential of −100 mV, was scaled and subtracted from the current measured during depolarizing steps. The non-linear capacitative current was then integrated to give the amount of charge moved during the pulse (Q). To assess the membrane potential dependence of charge transfer (Q(Vm)) it was fitted with the Boltzmann function:
| (4) |
where Qmax is the maximal available charge while V′ and k have their usual meanings.
Fura-2 was purchased from Molecular Probes (Eugene, OR, USA), APIII from ICN Biomedicals (Aurora, OH, USA). Protease inhibitors were from Boehringer (Mannheim, Germany), Merck (Darmstadt, Germany) and Sigma (St Louis, MO, USA). Lipids were obtained from Avanti Polar Lipids (Alabaster, AL, USA), [3H]ryanodine was from Dupont (Boston, MA, USA), SDS and polyacrylamide gel components and molecular weight standards were from Bio-Rad Laboratories (Hercules, CA, USA). All other chemicals were from Sigma.
In statistical analyses all values were expressed as means ±s.e.m., statistical significance was calculated with Student's t test assuming significance for P≤ 0.05.
RESULTS
Tetracaine suppresses the calcium transients
Enzymatically dissociated fibres were readily available to conduct long experiments in the double Vaseline gap chamber if not stretched and loaded with 5 mM EGTA to prevent contractions. This was essential to enable the characterization of tetracaine action since these experiments involved the administration and wash of a given concentration of the drug. In the experiment presented in Fig. 3 the fibre survived the measurements in control, in the presence of 50 and 100 μM tetracaine and the wash. Data in the figure show the transients obtained in response to depolarizing the membrane to 0 mV for 100 ms and are the representatives of a full voltage dependence measured under each experimental condition.
Figure 3. Effects of tetracaine on [Ca2+]i and on SR calcium release.
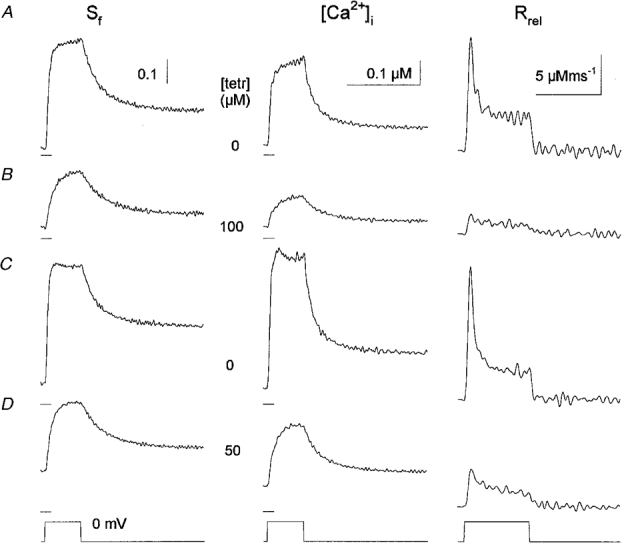
The traces were recorded in the order shown starting in row A with the measurement under reference conditions. Tetracaine (100 μM, B) greatly suppressed the change in [Ca2+]i, also evident from the smaller change in the saturation of fura-2 (Sf). The suppression was more dramatic in the calculated SR calcium release flux (Rrel). The effects of the drug were reversible as shown in C. The subsequent application of 50 μM tetracaine (D) again reduced Sf, [Ca2+]i, and Rrel, however the suppression was not as pronounced as with 100 μM. Note that the resting [Ca2+]i was increased during the last treatment compared with control. Fibre was depolarized to 0 mV for 100 ms. [fura-2], 66–90 μM; koff,Mg-P, 2.2 s−1, PVmax, 2.1 mM s−1, kon,Ca-E, 1.3 m−1 s−1 and koff,Ca-E, 4.5 s−1. Horizontal calibration is 200 ms for Sf and [Ca2+]i and 100 ms otherwise. Horizontal ticks below the traces denote 0.25 for Sf and 0 μM for [Ca2+]i. SL, 2.2 μm.
Figure 3, first column, demonstrates that the addition of 100 μM tetracaine greatly suppressed the change in fura-2 saturation (Sf=[Ca-fura-2]/[fura-2]total; calcium bound dye over total dye concentration) associated with the depolarization of the membrane. Not only did the maximal attained saturation decrease but the rate of rise was also suppressed. Upon removal of the drug these effects were reversed and, to some extent, the maximal saturation of fura-2 was greater after wash than in control. The subsequent addition of 50 μM tetracaine produced similar effects, although the magnitude of the suppression, for both the maximal saturation and the rate of rise, was smaller than for 100 μM.
Similar conclusions can be drawn from the calculated changes in [Ca2+]i. Tetracaine suppressed both the maximal change in [Ca2+]i during the depolarizing pulses and the rate of rise of the calcium transient in a dose-dependent manner. The maximal [Ca2+]i for a 100 ms long depolarization to 0 mV was found to be 1.24 ± 0.16 μM (n = 20) in control, and 0.80 ± 0.16 μM (n = 11) and 0.26 ± 0.08 μM (n = 9) in the presence of 50 and 100 μM tetracaine, respectively. During the course of these experiments we also tested the effects of 25 and 200 μM tetracaine. While the former caused no significant changes compared with control (see Figs 5, 6 and 7) 200 μM of the drug almost completely eliminated the calcium transient. This complete elimination matches earlier reports from this laboratory on different species (Csernoch et al. 1988). Note that the resting saturation of fura-2 slowly increased during the course of the experiment. This increase corresponded to an elevation of 64 nM in the resting [Ca2+]i by the time the records in D were taken and thus the experiment was discontinued.
Figure 5. Voltage dependence of tetracaine action on the two kinetic components of SR permeability.
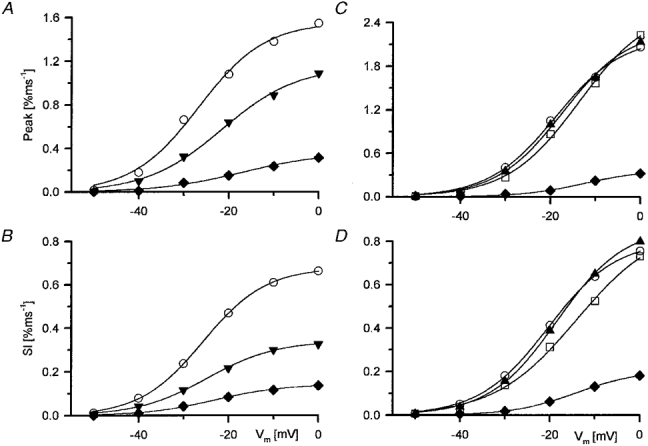
A and C, peak SR permeability in the presence of different concentrations of tetracaine. B and D, steady level (Sl) of SR permeability calculated as the mean of the values during the last 40 ms of the 100 ms long depolarization. A and B correspond to the fibre shown in Fig. 4, whereas C and D represent data from another experiment. Note that although the peak SR permeability varied from fibre to fibre, both the steady permeability and the relative suppression by tetracaine was similar. Open symbols represent measurements in reference solution (^, control; □, wash) while filled symbols correspond to different concentrations of tetracaine (▴, 25 μM; ▾, 50 μM; ♦, 100 μM). The voltage dependence was fitted with eqn (2), the continuous curves were generated with the obtained parameters. A, Peakmax, 1.56, 1.15 and 0.36 % ms−1; V‘, −26.7, −21.5 and −16.9 mV; k, 7.4, 8.4 and 9.2 mV, respectively. B, Slmax, 0.68, 0.34 and 0.14 % ms−1; V‘, −25.6, −24.6 and −22.8 mV; k, 7.0, 7.7 and 7.6 mV in control and in the presence of 50 and 100 μM tetracaine, respectively as A. C, Peakmax, 2.21, 2.32, 2.62 and 0.38 % ms−1; V′, −18.9, −17.4, −13.7 and −12.2 mV; k, 7.4, 7.4, 7.9 and 7.0 mV in control, in the presence of 50 μM tetracaine, after wash and in 100 μM tetracaine, respectively. D, Slmax, 0.81, 0.87, 0.88 and 0.21 % ms−1; V′, −20.4, −18.4, −14.0 and −14.0 mV; k, 7.6, 7.5, 9.1 and 7.1 mV, respectively as C.
Figure 6. Dose-dependent suppression of the peak and the steady level of Rrel*/C0 by tetracaine.
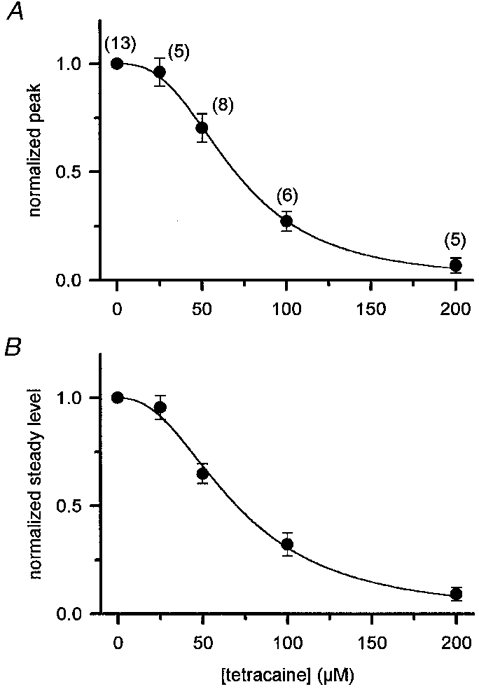
A, the maximal SR permeability at the peak, obtained by fitting the Boltzmann function, was averaged and plotted versus tetracaine concentration. Each value was normalized to the corresponding data in control before averaging. B, the concentration-dependent suppression of the steady level calculated as the peak. The numbers in parentheses show the number of fibres, error bars indicate s.e.m. The continuous curves were generated by fitting eqn (3) to the data points with K50 at 70 and 71 μM and nH 2.7 and 2.3 for the peak and the steady level, respectively.
Figure 7. Effects of tetracaine on the peak-to-steady level ratio of SR permeability.
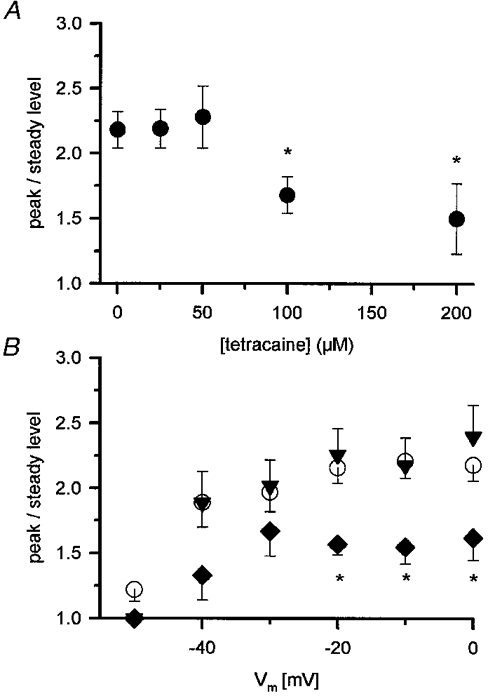
A, the peak-to-steady level ratio plotted versus the tetracaine concentration. The fitted maxima, using eqn (2), from each fibre were taken as the peak and steady values to calculate the ratio. * Significant difference compared with control. B, voltage dependence of the peak-to-steady level ratio in reference solution (^) and in the presence of the drug (▾, 50 μM, ♦, 100 μM). * Significant difference compared with control. Note, that there was no significant difference between the values at different membrane potentials at any given concentration of tetracaine except at −50 mV which was significantly smaller than the rest both in control and in the presence of the drug. Error bars represent s.e.m., same fibres as in Fig. 6.
The underlying reason for the suppression of the calcium transients by tetracaine was the decreased SR calcium release (Rrel) as shown in the third column of Fig. 3. Both kinetic components, the early peak and the maintained component, of the calcium release flux was suppressed by the drug. Although the early peak was still present after the addition of 100 μM tetracaine. Figure 3 clearly demonstrates that the effects on SR calcium release were readily reversible upon removal of the drug. The suppression was dose dependent since both the early peak and the maintained steady level were less affected by 50 than by 100 μM tetracaine. The removal of the drug restored Rrel to the control value, or, in certain fibres as in Fig. 3, the SR calcium release was greater after wash than in control.
SR calcium release is suppressed at every voltage
We were first interested to see whether the tetracaine-induced changes were due to a suppression of SR permeability or changes in the driving force for calcium to leave the SR. To calculate SR permeability the calcium release records were corrected for depletion of calcium in the SR during the depolarizing pulse and then normalized to the calcium content of the SR prior to the pulse (C0) as described by Csernoch et al. (1993). Figure 4 thus presents the depletion corrected and normalized calcium release records (Rrel*/C0) in the full membrane potential range before and after the addition of the drug. Tetracaine (50 μM) suppressed both the early peak and the maintained steady level of Rrel*/C0 on every record displayed.
Figure 4. The effects of 50 μM tetracaine on the SR permeability at different membrane potentials.
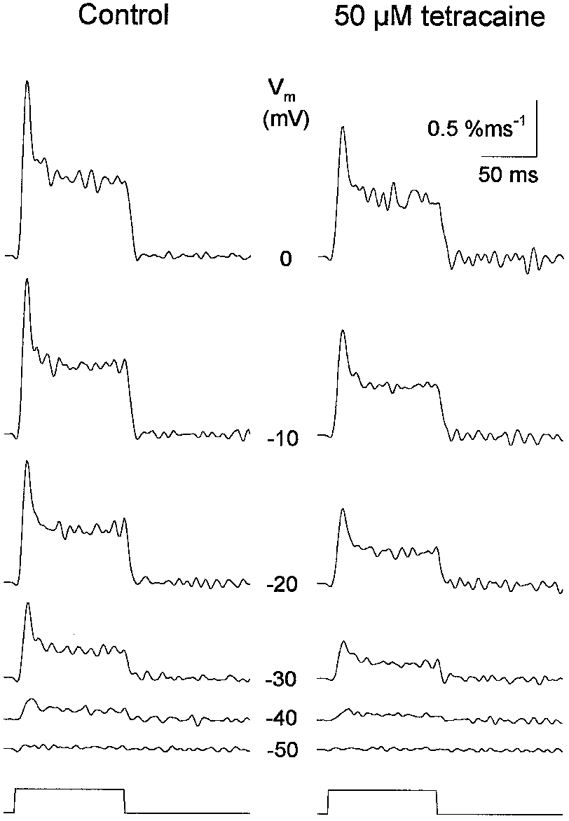
The SR permeability displayed an early peak and a maintained steady level both before and after the addition of the drug at every potential tested. Tetracaine suppressed both kinetic components at every voltage. Traces were obtained in response to 100 ms long depolarizations to the potentials indicated in each row. [fura-2], 90–124 μM; koff,Mg-P, 2.5 s; PVmax, 5.1 mM s−1; kon,Ca-E, 3.5 m−1 s−1 and koff,Ca-E, 2.7 s−1. SR calcium content (C0), 1.9 mM; SL, 2.5 μm.
It should be noted that to calculate the permeability the SR content was estimated in control and then used throughout the experiment. This assumption might have slightly underestimated the SR content and thus the actual suppression in the presence, and after the removal of the drug, as argued in detail in Discussion. In case of the fibre presented in Fig. 4, however, the SR calcium content determined in control (1.9 mM) provided a good measure throughout the experiment as judged from the effectiveness of the depletion correction procedure. This value, and the SR content on average, 2.2 ± 0.2 mM (n = 13), appeared to be larger than the value published from this laboratory for non-buffered and stretched mammalian fibres. Although the reason is not clear, the difference in estimating the total amount of calcium in the myoplasm and/or the loading of SR could explain the difference (see Discussion).
Figure 4 also demonstrates that SR permeability showed an early peak at every membrane potential examined both in control and after the addition of 50 μM tetracaine. The tetracaine-induced suppression seemed to be equally present at every voltage and, furthermore, the two kinetic components appeared to be affected equally by the drug. These observations were tested thoroughly as follows.
Figure 5 displays the peak and the steady level of SR permeability versus the membrane potential during the test pulse. The membrane potential dependence of the two kinetic components was fitted with eqn (2). This revealed an approximately equal voltage dependence in control for the peak and the steady level in both fibres included in Fig. 5 in line with earlier reports from this (Szentesi et al. 1997) and other laboratories (Shirokova et al. 1996). As evident from Fig. 5C and D the addition of 25 μM tetracaine neither decreased the SR permeability nor changed its voltage dependence. Similarly, the voltage dependence after removal of the drug was, apart from a small shift to positive membrane potentials, preserved.
Both 50 and 100 μM tetracaine induced a marked suppression of SR permeability that was present at all voltages. Although 50 μM of the drug affected the steady level more than it did the peak in the fibre presented in Fig. 5 (compare panels A and B), this differential effect was not statistically significant on average (see Fig. 6 and related text). Tetracaine (100 μM) suppressed the SR permeability in both fibres by approximately 80 %. Note that, although the maximal attained peak was different for the two fibres (compare the y-axis scales of A andC in Fig. 5), the relative effect of the drug was comparable.
The dose-dependent effects of the drug on the voltage dependence of SR calcium release are summarized in Table 1. There was no significant change in the steepness of the membrane potential dependence at any concentration tested. The mid-point voltage on the other hand was shifted by 3–6 mV to more positive potentials by 50 and 100 μM tetracaine, calculated as the difference between the mid-point voltages determined in the presence and absence of the drug (V′tetr - V′control). The shift induced by 25 μM tetracaine did not prove to be statistically significant. Observations from fibres exposed to 200 μM tetracaine were not included in Table 1 since the drastic suppression of SR calcium release rendered the fitting of a Boltzmann function incidental under those conditions. The data, nevertheless, clearly indicate that the underlying reason for the decrease in SR permeability was not a drastic change in the voltage dependence.
Table 1.
Concentration-dependent effects of tetracaine on the voltage dependence of SR permeability
| Peak | Steady level | ||||
|---|---|---|---|---|---|
| [Tetr] | n | ΔV′† | Normalized k‡ | ΔV′† | Normalized k‡ |
| 25 | 5 | 1.6 ± 1.9 | 1.0 ± 0.07 | 1.4 ± 1.4 | 1.1 ± 0.1 |
| 50 | 8 | 5.2 ± 0.7* | 1.1 ± 0.04 | 3.6 ± 1.2* | 1.0 ± 0.1 |
| 100 | 6 | 6.8 ± 1.7* | 1.4 ± 0.2 | 3.0 ± 0.9* | 0.9 ± 0.03 |
Parameters were calculated by fitting eqn (2) to the data.
Significantly different (P < 0.05) from control.
Calculated as V′tetr - V′control.
Calculated as ktetr/kcontrol.
Suppression of peak and steady SR permeability by tetracaine have similar dose dependence
To obtain the suppression of peak SR permeability at a given tetracaine concentration on a given fibre the maximal permeabilities were used. These were calculated by fitting eqn (2), as described above, to the voltage dependence in the absence and presence of the drug. The fitted maximum in tetracaine was then divided by the fitted maximum in control to give the relative suppression at that particular concentration on the given fibre. The relative suppressions were averaged over the fibres and plotted versus the tetracaine concentration in Fig. 6A. The obtained dose dependence was then fitted with the Hill equation (eqn (3)) yielding a K50 of 69.6 μM and a Hill coefficient of 2.7. It should be noted that with 200 μM tetracaine in the external solution the fitting of eqn (2) to the data was problematic. Thus the values obtained at 0 mV were used instead of the fitted maxima.
The dose-dependent effect of the drug on the steady SR permeability was determined as described above for the peak. The mean suppression of the steady level of Rrel*/C0versus the tetracaine concentration is shown on Fig. 6B. Parameters of the dose dependence, K50 (70.5 μM) and nH (2.3), were essentially the same as those obtained for the peak, although the Hill coefficient was found to be somewhat smaller. It should be noted, however, that the extent of suppression on the peak and on the steady level did not differ significantly at any tetracaine concentration examined.
These observations - the similar dose dependence of the two components and the large (greater than 2) Hill coefficient in case of the peak - argue in favour of the hypothesis that in mammalian muscle the two kinetic components of SR permeability correspond to the same calcium release channel entity.
The peak to steady level ratio of SR permeability is not affected by low but is suppressed by high concentrations of tetracaine
A major difference in SR permeability between mammals and amphibians was the constant, voltage independent, peak-to-steady ratio in mammals. Since tetracaine proved to have differential effects on these kinetic components in amphibians it was thus of interest to explore how tetracaine affects this ratio in mammals.
Figure 7A displays the concentration-dependent effects of the drug on the peak-to-steady level ratio of SR permeability. To calculate the ratio the theoretical maxima of the peak and of the steady level were first determined as described in connection with the previous figure. The ratio for a given fibre was calculated without any normalization in the absence and in the presence of the drug. Tetracaine had no effects on the peak-to-steady ratio up to a concentration of 50 μM, that caused a 30 % reduction in SR permeability (see Fig. 6). The ratio was calculated to be 2.2 ± 0.1 and 2.3 ± 0.2 in control and in the presence of 50 μM tetracaine, respectively. Higher concentrations of the drug induced a gradual decline in the peak-to-steady ratio reaching 1.5 ± 0.3 when 200 μM tetracaine was present in the external solution. As indicated in Fig. 7A the suppression of the peak-to-steady ratio proved to be significant for both 100 and 200 μM tetracaine. Thus tetracaine decreases the peak-to-steady ratio albeit at higher concentrations than that at which it suppresses the release of calcium from the SR.
To demonstrate the voltage-dependent effects of tetracaine on the peak-to-steady ratio Fig. 7B depicts three concentrations - 0, 50 and 100 μM - of the drug and displays the mean peak-to-steady ratio at every membrane potential examined. There was a slight decrease in the ratio in control with decreasing depolarizations as reported earlier (Shirokova et al. 1996) and expected from model calculations (Ríos & Stern, 1997). This decrease was not statistically significant except for the ratio at −50 mV, the threshold for detectable calcium release. Tetracaine (50 μM) did not influence the peak-to-steady ratio at any voltage as expected from Fig. 7A. In contrast, 100 μM of the drug suppressed the ratio at all membrane potentials examined. The degree of suppression, i.e. the ratio in the presence of tetracaine normalized to the ratio in control, however, did not show any clear voltage dependence apart from a slight increase at −50 mV.
The effects of tetracaine on SR calcium release are not mediated by altering intramembrane charge movement
To ensure that the effects of tetracaine on SR permeability described in the previous sections were not a direct consequence of reduced intramembranous charge or a shift in its voltage dependence, measurements were carried out in the presence and absence of tetracaine to simultaneously detect these steps in E-CC.
Figure 8A displays the voltage dependence of the amount of charge moved during the test depolarization both before and after the addition of 50 μM tetracaine as a mean from three fibres. The values from each fibre were first independently fitted by eqn (4) both in the presence and absence of the drug. The data from a given fibre were then normalized by the maximal available charge (Qmax in eqn. (4)) obtained in control for that fibre and finally the mean normalized values at a given membrane potential were used to yield the data points in the Fig. 8A. The mean values were again fitted with eqn (4) to obtain an overall voltage dependence, shown as superimposed curves in Fig. 8A, in control and in the presence of the drug.
Figure 8. Effects of 50 μM tetracaine on intramembrane charge and on the transfer function.
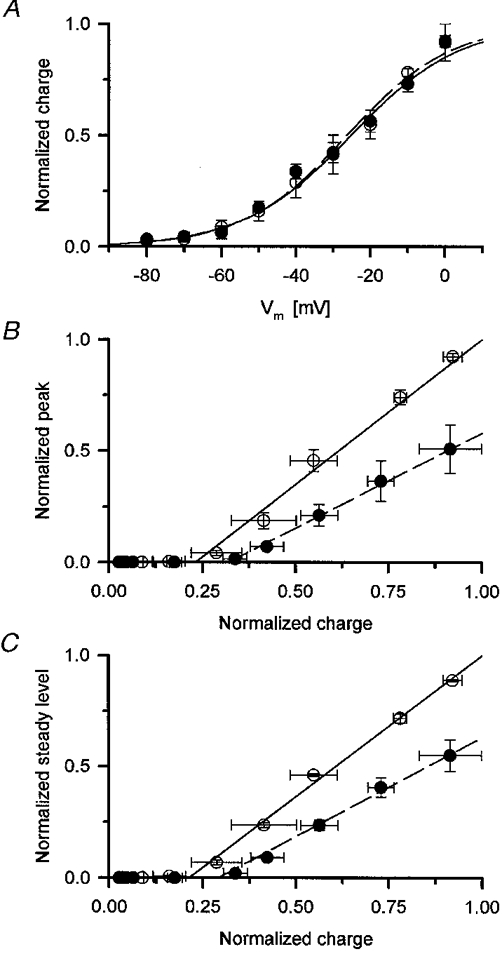
A, voltage dependence of normalized intramembrane charge movement in the presence (•) and absence (^) of tetracaine. The voltage dependence was fitted with eqn (4), the curves were generated with the obtained parameters V′, −25.2 and −26.3 mV and k, 14.6, and 14.0 mV in control (continuous line) and in the presence of 50 μM tetracaine (dashed line), respectively. B and C, transfer functions in the absence and presence of the drug for the peak (B) and for the steady level (C) of SR permeability. To calculate the transfer function the normalized SR permeability was plotted versus the normalized charge. To indicate the close-to-linear relationship between charge movement and SR permeability above the threshold for detectable permeability increase the last five points in each data set were fitted with a straight line (shown superimposed). The parameters obtained in control were slope (m) 1.30 and 1.27 and x-axis intercept (xi) 0.23 and 0.21 for the peak and for the steady level, respectively. In the presence of the drug the values were m, 0.85 and 0.89 while xi, 0.32 and 0.29. All normalizations used the maximum obtained in control on the given fibre.
As evident from Fig. 8, 50 μM tetracaine neither altered the maximal available charge nor its voltage dependence. The mean Qmax was found to be 28.2 ± 3.0 and 29.1 ± 1.3 in control and in the presence of the drug, respectively, the slight difference was not significant statistically (P > 0.7). Both the mid-point voltages and the steepness factors of the mean voltage dependence were almost identical before and after the treatment being respectively, −25.2 and 14.6 mV before and −26.3 and 14.0 mV, respectively, after the addition of tetracaine.
To gain further insight into the coupling between intramembrane charge movement and SR calcium release the ‘transfer function’ of the triadic information transfer was plotted. To this end the calculated SR permeabilities were treated as the charge movement data described above. First the permeabilities measured at various voltages were normalized to the maximal permeability determined under control conditions on the given fibre then the mean normalized values were taken for each and every membrane potential. Figure 8B andC plot the mean, normalized peak and steady permeabilities, respectively, as a function of the mean and normalized charge.
The data show that tetracaine shifted the ‘transfer function’ to the right, that is, the same amount of charge transfer resulted in a smaller permeability increase in the presence of the drug. This observation indicates that tetracaine somehow prevented the charge movement exerting its activating effect on the RyR. It is also apparent from Fig. 8 that below a certain amount of charge (approximately 25 % of total available charge) there was no detectable increase in SR permeability. Furthermore, above this ‘threshold’ both the peak and steady components of SR permeability increased linearly with the charge moved. This is illustrated in Fig. 8 with the straight lines fitted to the last five points for each set of data. Tetracaine, in the concentration tested, did not alter this linear relationship only decreased the slope from 1.30 to 0.85 in the case of peak and from 1.27 to 0.89 in case of steady level. It should be noted that there was no statistically significant difference between the slopes of the two components when compared in the presence and absence of the drug.
Careful examination of the straight lines in Fig. 8B and C reveals that tetracaine also shifted the x-axis intercept (the theoretical threshold for the appearance of detectable SR permeability increase) to the right, that is to greater amounts of charge moved. This shift, however, did not prove to be significant statistically.
Tetracaine decreases the open probability of the RyR calcium release channel
Data presented so far strongly argue in favour of the hypothesis that tetracaine, in the concentration range examined, directly interferes with the calcium release channel of the SR and consequently reduces SR permeability.
To demonstrate this action of the drug and to compare the concentration dependent effects of tetracaine on the RyR under maintained structure and isolated conditions the calcium release channel was incorporated into planar lipid bilayers (Fig. 9). Initial calcium concentration was chosen for easy observation of channel incorporation, namely, the cis- and trans-free calcium concentrations were set to 50 μM. Under these conditions the mean conductance of the channel was found to be 511 ± 14 pS with a mean open probability (Po) of 0.474 ± 0.148 (n = 8). After successful incorporation channels were further activated by consecutive additions of Na2-ATP into the cis chamber up to a total ATP concentration of 2 mM. The calculated free ATP and free calcium concentrations were 889 and 8.9 μM, respectively. Although the free calcium concentration decreased, channels were significantly activated by ATP to a Po of 0.835 ± 0.054 as expected from similar data obtained earlier on rabbit RyR (Herrmann-Frank & Lehmann-Horn, 1996). Thus, close to full activation of the channel was necessary to demonstrate clearly the inhibitory effects of tetracaine.
Figure 9. Effect of tetracaine on the SR calcium release channel current.
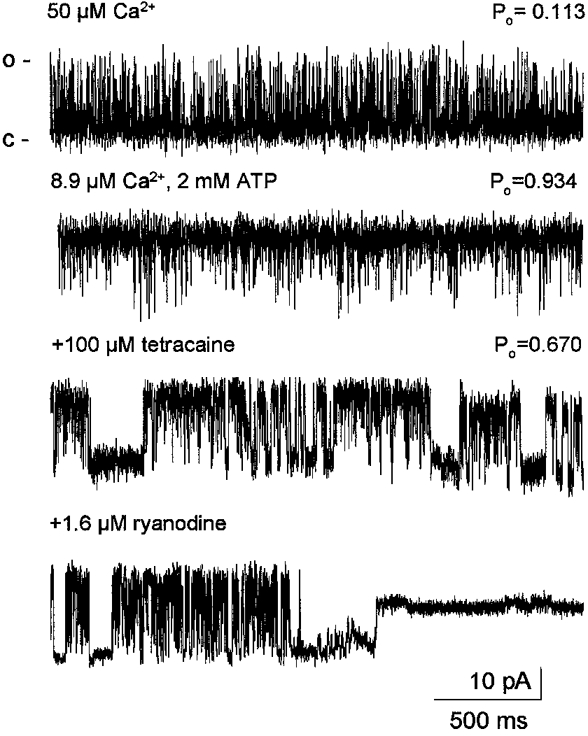
Representative records taken from an experiment using K+ as charge carrier. Upward deflections of the current records represent the open state of the channel (o) while downward deflections corresponds to the closed state (c). Concentrations of free Ca2+, total ATP and tetracaine cis as well as the open probabilities (Po) are indicated above each trace. Tetracaine suppressed the Po in a concentration-dependent manner by inducing long closed states in channel gating. At the end of the experiment 1.6 μM ryanodine was added to the cis chamber to demonstrate the characteristic modification in channel behaviour. Holding potential, 44.5 mV.
Binding of tetracaine to RyR had no effect on the specific conductivity of the channel and the channels retained their ohmic behaviour as shown in Fig. 10. The mean conductance in the presence of 100 μM tetracaine was found to be 487 ± 26 pS (n = 7), slightly smaller but not significantly different (P > 0.1) from that in control.
Figure 10. Voltage dependence of the SR calcium release channel current after incorporation into lipid bilayer.
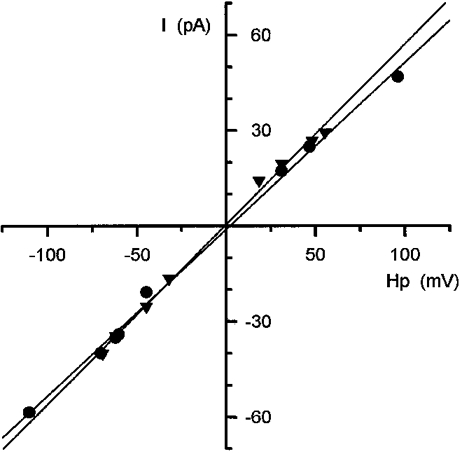
Current values were measured at maximal opening of the channel and were plotted as a function of the holding potential. The charge carrier was K+ and the composition of the medium is described in Methods. Data obtained in the absence (•, 50 μM Ca2+cis) and in the presence of tetracaine (▾, 8.9 μM free calcium concentration, 2 mM total ATP, 200 μM tetracaine, all cis) were fitted with a straight line (shown superimposed). The slopes revealed a conductance value of 524 and 566 pS in the absence and presence of the drug, respectively.
Tetracaine exerted an inhibitory effect on the opening of the calcium release channel (Fig. 9). The magnitude of this inhibition was concentration dependent, increasingly larger concentrations brought about increasingly greater suppression of channel activity. The decrease of open probability was characteristically due to the appearances of long term closed intervals between relatively more active periods of the RyR (see Fig. 9, bottom records). These cluster-type bursts were observed neither in rat nor in rabbit RyR recordings under control conditions (Herrmann-Frank et al. 1996). The bursts appeared after tetracaine treatment and became remarkably pronounced with increasing tetracaine concentration. The open probability during the active periods was similar to that measured before the addition of the drug.
The extent of inhibition depended on the sign of the holding potential. In about 65 % of the experiments the inhibitory effect of the tetracaine was more pronounced at positive voltages, while in 35 % of the experiments a more pronounced inhibition was observed at negative holding potentials. Similar voltage dependence of tetracaine action has been described previously on rabbit RyR incorporated into planar lipid bilayers by Xu et al. (1993). The effect of tetracaine on cut fibres can thus be explained by the decrease in the open probability of the SR calcium release channels, which - under the given conditions - results in a decrease of the calcium efflux as compared with that in the control.
In a few experiments the effect of 1.6 μM ryanodine was tested on the isolated channel. Ryanodine was applied in the cis chamber after the tetracaine effect had developed. As reported earlier for non-modified channels the binding of ryanodine locked the RyR calcium release channel in a characteristic subconductance state (Fig. 9, bottom trace). This indicates that the ryanodine and tetracaine binding sites are different, and the presence of tetracaine neither alters the accessibility nor the conformation of the ryanodine binding site. It should be noted that after the channel has been locked into the subconductance state no closings were observed (channel behaviour was monitored for 2–3 min after the development of ryanodine effect) even in the presence of 500 μM tetracaine. This indicates that the ryanodine-modified channel was less sensitive to the tetracaine block. As an additional control, we also examined the effects of Ruthenium Red applied in the cis chamber. The presence of 400 μM Ruthenium Red completely blocked the channel reducing the Po below 0.001 (data not shown).
Suppression of SR calcium release and channel open probability by tetracaine have similar concentration dependence
To characterize the concentration dependence of tetracaine inhibition, the open probabilities were calculated from data segments acquired at those holding potentials where the inhibition was more pronounced. Values obtained for Po were then normalized to that calculated in the absence of the drug and were plotted against the tetracaine concentration in the incubation medium (Fig. 11). Fitting eqn (3) to the data points revealed a half-inhibitory concentration of 68 μM and a Hill coefficient of 1.5. These values are remarkably close to those obtained for SR permeability in cut fibres suggesting that the effects seen under voltage clamp conditions can be fully explained by the reduction in Po.
Figure 11. Concentration dependence of the effect of tetracaine on the open probability of the SR calcium release channel.
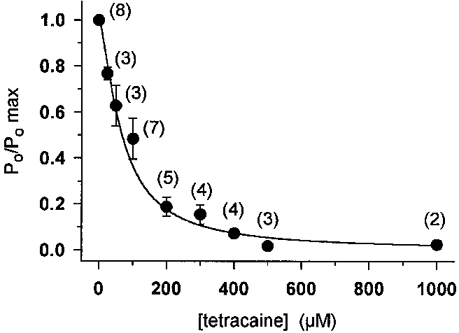
Tetracaine was added to the cis side of the bilayer at concentrations ranging from 25 μM to 1 mM. Open probabilities were calculated from the current records measured in the presence of 2 mM total ATP and were normalized to the value obtained in the absence of the drug. The concentration dependence of the open probabilities was fitted by eqn (3), resulting in a K50 of 68 μM and Hill coefficient of 1.5. Vertical bars indicate s.e.m., the number of experiments are given in parentheses at each point. The superimposed continuous line represents the theoretical concentration dependence with the above parameters.
DISCUSSION
These experiments explored the effects of the local anaesthetic tetracaine on the calcium release from the SR of rat skeletal muscle fibres. Our results demonstrate, for the first time, that tetracaine suppresses SR calcium release in mammalian striated muscle in the same concentration range as found in amphibians. The effect of the drug was, however, characteristically different from that reported for frogs, namely, the suppression of the inactivating and steady components of Rrel followed the same concentration dependence. Furthermore, low concentrations of the drug did not influence the previously described voltage independent ratio of peak-to-steady level. To establish the site of action of the drug we isolated and incorporated the RyR calcium release channel of the rat into planar lipid bilayers. Tetracaine reduced the open probability of the release channel in a concentration range comparable with that obtained for the macroscopic release process. These experiments thus, for the first time, successfully combined the measurements on cut skeletal muscle fibres and on single RyR calcium release channels obtained from the same species, in several cases from the same animal. The data are consistent with the hypothesis that in mammalian muscle the two kinetic components of SR permeability correspond to the same calcium release channel entity.
Slack fibres versus stretched fibres
Measurements reported here were carried out on slack fibres loaded internally with EGTA to prevent contractions. Although enzymatic dissociation yielded fibres that were functional after increasing the sarcomere length above 3.6 μm (e.g. Fig. 1) these fibres usually did not last for more than 30–40 min after setting the holding potential to −100 mV. Slack fibres on the other hand were readily available for long experiments with stable electrical properties - holding current and time course of capacitive current - up to 100–120 min. Stable fibre conditions were essential for testing the effect of tetracaine, a drug that reduces SR calcium release.
EGTA-loaded fibres have been used previously in other laboratories (Shirokova et al. 1996). Parameters of the removal as well as the magnitude and waveform of SR calcium release reported here for control conditions do not differ significantly from those of Shirokova et al. (1996). Furthermore, most of the characteristics of SR calcium release in EGTA-loaded slack fibres and in non-buffer stretched fibres were the same: they shared similar voltage dependence and overall kinetics (Fig. 1).
On the other hand, the estimated SR calcium content was greater, 2.2 mM on average, in these experiments than in those reported earlier from this laboratory for stretched mammalian fibres with low EGTA concentration in the internal solution. The value reported here was, however, close to that obtained by Shirokova et al. (1996) under EGTA-buffered conditions in mechanically isolated rat fibres. It should be noted that our previous measurements on injecting calcium buffers into frog skeletal muscle fibres in double Vaseline gap (Csernoch et al. 1993) also indicated a difference between estimated SR content in the absence and presence of the calcium buffers. Similarly, Jong et al. (1993) reported significantly higher SR content in fura-2-loaded fibres. These observations suggest that the SR calcium content under non-buffered conditions might be underestimated and the value obtained in this report could represent a more realistic approximation.
SR permeability in the presence of tetracaine
When calculating SR permeability the currently accepted model uses the normalization of SR calcium release flux to initial SR calcium content (e.g. Csernoch et al. 1993). Throughout these experiments all Rrel records were normalized to the content determined under control conditions (see Fig. 4). Although this assumption might not be valid, this procedure was selected since it did not introduce a new free parameter to be estimated after the addition of the drug. It is, nevertheless, of interest to explore how the SR content might have changed during the course of these experiments and consider its effects on the conclusions drawn. The following possibilities should be considered: (1) there was a steady loss of SR calcium through an increased leak due to fibre run down, (2) tetracaine decreased the SR content by suppressing the uptake into the SR and, finally, (3) tetracaine increased the content by suppressing the steady leak. While the first two processes would decrease, the third would increase the content of the SR during the period in question.
Although local anaesthetics have been reported to decrease the uptake of calcium into the SR (Bianchi & Bolton, 1967) the concentration at which tetracaine influences the SR calcium pump is higher then those used in these experiments. In a detailed study published on the effects of local anaesthetics on calcium uptake Suko et al. (1976) found no effect of tetracaine below 1 mM. On the other hand, the observations that the effects of tetracaine were reversible and that the SR permeability, calculated after wash with the SR content in control, was not significantly reduced clearly suggest that a large loss of SR calcium could not have taken place.
Earlier reports revealed larger caffeine-induced calcium transients (Overend et al. 1997) and increased frequency of calcium sparks (Györke et al. 1997) in cardiac myocytes following the administration of tetracaine. Qualitatively similar observations were made in this study, too, upon the removal of the drug (see Fig. 3). Both reports (Overend et al. 1997 and Györke et al. 1997) have suggested that the reason underlying the increase in calcium release was the increased SR content. This increase, as argued by Overend et al. (1997) was due to the block of SR calcium channels by tetracaine and the consequent decrease in the resting leak of the SR. Since tetracaine blocked SR calcium release in our experiments the possibility of increased SR calcium content in the presence of the drug cannot be ruled out. Were this the case the calculated SR permeability should have been at most overestimated in these experiments. The indication that this might have happened in some fibres was the observation that the calculated SR calcium release was greater after wash than in control (Fig. 3). However, the accuracy of the depletion correction in some fibres (see, e.g. Fig. 4) suggests that the SR content from control was a reliable measure of the SR content later in the experiment.
RyR isolated from rat skeletal muscle
Some earlier reports used HSR vesicles for the incorporation of the RyR into bilayers, instead of purified ryanodine receptors because of preparation problems. Two major steps of the RyR preparation had to be modified in the case of rat due to the difference in actomyosin content and the difference of SR to muscle wet weight ratio. Our adaptation of the preparation procedure resulted in a similar quality from the rat as from the rabbit (see Fig. 2), however, the contaminating proteins were different, based on their mobility, in the two species.
The addition of tetracaine in the cis chamber led to a characteristic modification of channel gating: periods of high and low Po followed one another (Fig. 9). Similar behaviour of RyR has been described previously for both neuronal and skeletal type RyR under control conditions (e.g. Amirsén et al. 1996) and was attributed to modal gating. The effect of the local anaesthetic could thus be the induction of modal gating, or the attenuation of the gating mode with lower Po. Alternatively, since the Po during the active periods in the presence of tetracaine resembled the Po before the addition of the drug, tetracaine might have a higher affinity for the closed than for the open channel hence stabilizing the closed conformation of RyR.
The concentration dependence of the inhibition of open probability by tetracaine reported here for rat skeletal muscle RyR is in close agreement with data published for other RyR isoforms and species. As an example, Györke et al. (1997) published a K50 of 260 μM and a Hill coefficient of 1.89 for the cardiac isoform of RyR in rat, whereas Xu et al. (1993) obtained K50 of 180 μM and a Hill coefficient of 2.2 for rabbit skeletal muscle. The difference between the obtained parameters could be due to differences in experimental conditions, the species used or it could be a true difference in tetracaine sensitivity of the RyR isoforms as reported by O'Brien et al. (1995) for the α and β isoforms from fish.
Site of tetracaine action
To reduce SR calcium release in voltage clamped skeletal muscle fibres tetracaine could either influence intramembrane charge movement or could directly interfere with the calcium release channel. Although tetracaine has been used previously to modify intramembrane charge movement in mammalian muscle (Dulhunty & Gage, 1983; Lamb, 1986; Hollingworth et al. 1990) the concentration used in those studies was usually higher (2 mM) than applied in these experiments. Furthermore, as reported by Hollingworth et al. (1990), 2 mM tetracaine neither influenced the total available charge nor its voltage dependence in rat extensor digitorum longus muscle if measured with a middle-of-the-fibre voltage clamp.
In line with this observation we found that 50 μM tetracaine did not alter charge movement (Fig. 8A) but shifted the transfer function. The relatively small shift in voltage dependence of SR calcium release in these experiments (Table 1) also indicates that any influence on charge movement should be minor.
On the other hand Lamb (1986) reported a consistent reduction of intramembrane charge by 0.05–0.2 mM tetracaine in rabbit sternomastoid muscle. Measured under voltage clamp conditions in Vaseline gap this reduction was found to be 15 %. Although the different species, muscles and techniques used might explain the discrepancy, only a detailed analysis of the effects of different tetracaine concentrations on intramembrane charge movement under the conditions used in these experiments could reveal if a part of the suppression in SR permeability at any given tetracaine concentration was due to the reduction in intramembrane charge.
From the measurements on isolated RyR calcium release channels it is, nevertheless, evident that tetracaine in the concentration range used directly interferes with the calcium release process. The similar concentration dependence for intact and isolated channels and the shift in the transfer function strongly argue that the effect seen on cut muscle fibres was the direct consequence of the reduction in open probability. The relatively high lipid solubility of tetracaine at the internal pH and the greater than one Hill coefficient suggest that tetracaine might act through the lipid phase as discussed by Xu et al. (1993).
On the other hand the characteristic modification of channel gating (Fig. 9) indicates that tetracaine might bind preferentially to the closed state of the channel as discussed above. Similar state-dependent block by tetracaine was recently reported for cyclic nucleotide-gated channels by Fodor et al. (1997). In their model the tetracaine binding site was accessible only in the closed state of the channel and, furthermore, the activation of the cyclic nucleotide-gated channel by Ni2+ reduced the effectiveness of the block. This state-dependent block of the RyR could also be envisaged from our experiments where the ryanodine modified - permanently open - channel was less affected by the drug.
Acknowledgments
The authors wish to thank Ms R. ´Óri for skilful technical assistance. This work was supported by research grants from Hungary (OTKA T16957 and T22313, ETT 095/1996, FKFP 1289/1997) and the European Community (CT96-0032).
References
- Amirsén R, Sierralta J, Vélez P, Naranjo D, Suárez-Isla BA. Modal gating in neuronal and skeletal muscle ryanodine-sensitive Ca2+ release channels. American Journal of Physiology. 1996;271:C144–153. doi: 10.1152/ajpcell.1996.271.1.C144. [DOI] [PubMed] [Google Scholar]
- Bianchi CP, Bolton TC. Action of local anaesthetics on coupling systems in muscle. Journal of Pharmacology and Experimental Therapeutics. 1967;157:388–405. [PubMed] [Google Scholar]
- Csernoch L, Huang CL-H, Sz´úcs G, Kovács L. Differential effects of tetracaine on charge movements and Ca signals in frog skeletal muscle. Journal of General Physiology. 1988;96:601–612. doi: 10.1085/jgp.92.5.601. [DOI] [PMC free article] [PubMed] [Google Scholar]
- Csernoch L, Jacquemond V, Schneider MF. Microinjection of strong calcium buffers suppresses the peak of calcium release in frog skeletal muscle fibres. Journal of General Physiology. 1993;101:297–333. doi: 10.1085/jgp.101.2.297. [DOI] [PMC free article] [PubMed] [Google Scholar]
- Dulhunty AF, Gage PW. Asymmetrical charge movement in slow- and fast-twitch mammalian muscle fibres in normal and paraplegic rats. The Journal of Physiology. 1983;341:213–231. doi: 10.1113/jphysiol.1983.sp014802. [DOI] [PMC free article] [PubMed] [Google Scholar]
- Fabiato A. Computer programs for calculating total from specified free or free from specified total ionic concentrations in aqueous solutions containing multiple metals and ligands. Methods in Enzymology. 1988;157:378–417. doi: 10.1016/0076-6879(88)57093-3. [DOI] [PubMed] [Google Scholar]
- Fodor AA, Black KE, Zagotta WN. Tetracaine reports a conformational change in the pore of cyclic nucleotide-gated channels. Journal of General Physiology. 1997;110:591–600. doi: 10.1085/jgp.110.5.591. 10.1085/jgp.110.5.591. [DOI] [PMC free article] [PubMed] [Google Scholar]
- García J, Schneider MF. Calcium transients and calcium release in rat fast-twitch skeletal muscle fibres. The Journal of Physiology. 1993;463:709–728. doi: 10.1113/jphysiol.1993.sp019618. [DOI] [PMC free article] [PubMed] [Google Scholar]
- Györke S, Lukyanenko V, Györke I. Dual effects of tetracaine on spontaneous calcium release in rat ventricular myocytes. The Journal of Physiology. 1997;500:297–309. doi: 10.1113/jphysiol.1997.sp022021. [DOI] [PMC free article] [PubMed] [Google Scholar]
- Herrmann-Frank A, Lehmann-Horn F. Regulation of the purified Ca2+ release channel/ryanodine receptor complex of skeletal muscle sarcoplasmic reticulum by luminal calcium. Pflügers Archiv. 1996;432:155–157. doi: 10.1007/s004240050117. [DOI] [PubMed] [Google Scholar]
- Herrmann-Frank A, Richter M, Sárközi S, Lehmann-Horn F. 4-chloro-m-cresol, a potent and specific activator of skeletal muscle ryanodine receptor. Biochimica et Biophysica Acta. 1996;1289:31–40. doi: 10.1016/0304-4165(95)00131-x. [DOI] [PubMed] [Google Scholar]
- Hollingworth S, Marshall MW, Robson E. The effects of tetracaine on charge movement in fast twitch rat skeletal muscle fibres. The Journal of Physiology. 1990;421:633–644. doi: 10.1113/jphysiol.1990.sp017966. [DOI] [PMC free article] [PubMed] [Google Scholar]
- Huang CL-H. Dielectric components of charge movements in skeletal muscle. The Journal of Physiology. 1981;313:187–205. doi: 10.1113/jphysiol.1981.sp013658. [DOI] [PMC free article] [PubMed] [Google Scholar]
- Huang CL-H. Intramembrane charge movements in skeletal muscle. Physiological Reviews. 1988;68:1197–1247. doi: 10.1152/physrev.1988.68.4.1197. [DOI] [PubMed] [Google Scholar]
- Hui CS. Pharmacological studies of charge movement in frog skeletal muscle. The Journal of Physiology. 1983;337:509–529. doi: 10.1113/jphysiol.1983.sp014639. [DOI] [PMC free article] [PubMed] [Google Scholar]
- Jong D-S, Pape PC, Chandler WK, Baylor SM. Reduction of calcium inactivation of sarcoplasmic reticulum calcium release by Fura-2 in voltage-clamped cut twitch fibers from frog muscle. Journal of General Physiology. 1993;102:333–370. doi: 10.1085/jgp.102.2.333. [DOI] [PMC free article] [PubMed] [Google Scholar]
- Klein MG, Simon BJ, Sz´úcs G, Schneider MF. Simultaneous recording of calcium transients in skeletal muscle using high and low affinity calcium indicators. Biophysical Journal. 1988;55:971–988. doi: 10.1016/S0006-3495(88)83178-3. [DOI] [PMC free article] [PubMed] [Google Scholar]
- Kovács L, Ríos E, Schneider MF. Measurement and modification of free calcium transients in frog skeletal muscle fibres by a metallochromic indicator dye. The Journal of Physiology. 1983;343:161–196. doi: 10.1113/jphysiol.1983.sp014887. [DOI] [PMC free article] [PubMed] [Google Scholar]
- Lai FA, Meissner G. Purification and reconstitution of the ryanodine sensitive Ca2+ release channel complex from muscle sarcoplasmic reticulum. In: Longstaff A, Revest P, editors. Methods in Molecular Biology. Vol. 13. Totowa, NJ, USA: Humana Press; 1992. pp. 287–305. [Google Scholar]
- Lamb GD. Components of charge movement in rabbit skeletal muscle: the effect of tetracaine and nifedipine. The Journal of Physiology. 1986;376:85–100. doi: 10.1113/jphysiol.1986.sp016143. [DOI] [PMC free article] [PubMed] [Google Scholar]
- Melzer W, Herrmann-Frank A, Lüttgau HC. The role of Ca2+ ions in excitation-contraction coupling of skeletal muscle fibres. Biochimica et Biophysica Acta. 1995;1241:59–116. doi: 10.1016/0304-4157(94)00014-5. [DOI] [PubMed] [Google Scholar]
- Melzer W, Ríos E, Schneider MF. The removal of myoplasmic free calcium following calcium release in frog skeletal muscle. The Journal of Physiology. 1986;372:261–292. doi: 10.1113/jphysiol.1986.sp016008. [DOI] [PMC free article] [PubMed] [Google Scholar]
- O'Brien J, Valdivia H, Block BA. Physiological differences between the α and β ryanodine receptors of fish skeletal muscle. Biophysical Journal. 1995;68:471–482. doi: 10.1016/S0006-3495(95)80208-0. [DOI] [PMC free article] [PubMed] [Google Scholar]
- Overend CL, Eisner DA, O'Neill SC. The effect of tetracaine on spontaneous Ca2+ release and sarcoplasmic reticulum calcium content in rat ventricular myocytes. The Journal of Physiology. 1997;502:471–479. doi: 10.1111/j.1469-7793.1997.471bj.x. [DOI] [PMC free article] [PubMed] [Google Scholar]
- Pizarro G, Csernoch L, Uribe I, Ríos E. Differential effects of tetracaine on two kinetic components of calcium release in frog skeletal muscle fibres. The Journal of Physiology. 1992;457:525–38. doi: 10.1113/jphysiol.1992.sp019392. [DOI] [PMC free article] [PubMed] [Google Scholar]
- Ríos E, Pizarro G. Voltage sensors and calcium channels of excitation-contraction coupling. News In Physiological Sciences. 1988;3:223–227. [Google Scholar]
- Ríos E, Stern MD. Calcium in close quarters: microdomain feedback in excitation-contraction coupling and other cell biological phenomena. Annual Reviews in Biophysics and Biomolecular Structure. 1997;26:47–82. doi: 10.1146/annurev.biophys.26.1.47. [DOI] [PubMed] [Google Scholar]
- Sárközi S, Szentesi P, Cseri J, Kovács L, Csernoch L. Concentration-dependent effects of tetracaine on excitation-contraction coupling in frog skeletal muscle fibres. Journal of Muscle Research and Cell Motility. 1996a;17:647–656. doi: 10.1007/BF00154059. [DOI] [PubMed] [Google Scholar]
- Sárközi S, Szentesi P, Jona I, Csernoch L. Effects of cardiac glycosides on excitation-contraction coupling in frog skeletal muscle fibres. The Journal of Physiology. 1996b;495:611–626. doi: 10.1113/jphysiol.1996.sp021620. [DOI] [PMC free article] [PubMed] [Google Scholar]
- Seidler NW, Jona I, Vegh M, Martonosi A. Cyclopiazonic acid is a specific inhibitor of the Ca2+ATPase of sarcoplasmic reticulum. Journal of Biological Chemistry. 1989;264:17816–17823. [PubMed] [Google Scholar]
- Shirokova N, García J, Pizarro G, Ríos E. Ca2+ release from the sarcoplasmic reticulum compared in amphibian and mammalian skeletal muscle. Journal of General Physiology. 1996;107:1–18. doi: 10.1085/jgp.107.1.1. [DOI] [PMC free article] [PubMed] [Google Scholar]
- Suko J, Winkler F, Scharinger B, Hellmann G. Aspects of the mechanism of action of local anaesthetics on the sarcoplasmic reticulum of skeletal muscle. Biochimica et Biophysica Acta. 1976;443:571–586. doi: 10.1016/0005-2736(76)90474-0. [DOI] [PubMed] [Google Scholar]
- Szentesi P, Jacquemond V, Kovács L, Csernoch L. Intramembrane charge movement and sarcoplasmic calcium release in enzymatically isolated mammalian skeletal muscle fibres. The Journal of Physiology. 1997;505:371–384. doi: 10.1111/j.1469-7793.1997.371bb.x. [DOI] [PMC free article] [PubMed] [Google Scholar]
- Tripathy A, Meissner G. Sarcoplasmic reticulum lumenal Ca2+ has access to cytosolic activation and inactivation sites of skeletal muscle Ca2+ release channel. Biophysical Journal. 1996;70:2600–2615. doi: 10.1016/S0006-3495(96)79831-4. [DOI] [PMC free article] [PubMed] [Google Scholar]
- Vergara J, Caputo C. Effects of tetracaine on charge movements and calcium signals in frog skeletal muscle fibres. Proceedings of the National Academy of Sciences of the USA. 1983;80:1477–1481. doi: 10.1073/pnas.80.5.1477. [DOI] [PMC free article] [PubMed] [Google Scholar]
- Xu L, Jones R, Meissner G. Effect of local anaesthetics on single channel behavior of skeletal muscle calcium release channel. Journal of General Physiology. 1993;101:207–233. doi: 10.1085/jgp.101.2.207. [DOI] [PMC free article] [PubMed] [Google Scholar]