Abstract
The transient and steady-state currents induced by voltage jumps in Xenopus oocytes expressing the lepidopteran amino acid co-transporter KAAT1 have been investigated by two-electrode voltage clamp.
KAAT1-expressing oocytes exhibited membrane currents larger than controls even in the absence of amino acid substrate (uncoupled current). The selectivity order of this uncoupled current was Li+ > Na+≈ Rb+≈ K+ > Cs+; in contrast, the permeability order in non-injected oocytes was Rb+ > K+ > Cs+ > Na+ > Li+.
KAAT1-expressing oocytes gave rise to ‘pre-steady-state currents’ in the absence of amino acid. The characteristics of the charge movement differed according to the bathing ion: the curves in K+ were strongly shifted (> 100 mV) towards more negative potentials compared with those in Na+, while in tetramethylammonium (TMA+) no charge movement was detected.
The charge-voltage (Q–V) relationship in Na+ could be fitted by a Boltzmann equation having V½ of −69 ± 1 mV and slope factor of 26 ± 1 mV; lowering the Na+ concentrations shifted the Q–V relationship to more negative potentials; the curves could be described by a generalized Hill equation with a coefficient of 1.6, suggesting two binding sites. The maximal movable charge (Qmax) in Na+, 3 days after injection, was in the range 2.5–10 nC.
Addition of the transported substrate leucine increased the steady-state carrier current, the increase being larger in high K+ compared with high Na+ solution; in these conditions the charge movement disappeared.
Applying Eyring rate theory, the energy profile of the transporter in the absence of organic substrate included a very high external energy barrier (25.8 RT units) followed by a rather deep well (1.8 RT units).
Cloning of ion-coupled transporters and their heterologous expression has allowed insights on the molecular mechanism of translocation (Hediger et al. 1987; Lester et al. 1994).
Among the best-studied systems so far are those involved in the reuptake of amino acid neurotransmitters, such as the GAT1 transporter (Mager et al. 1993) or the 5-hydroxytryptamine (5-HT) transporter (Mager et al. 1994).
Electrophysiological investigations on these molecules have revealed interesting aspects of the ion and substrate translocating steps. The permeation properties of the neurotransmitter transporters have been studied in detail and an ‘alternating-access’ mechanism of transport has been envisaged (Lester et al. 1994). In this view the transporter resembles a channel with gates at both ends, which open and close, exposing the internal lumen to either the extra- or intracellular sides. More recently, however, a different scheme based on the multi-ion, single-file model developed for channels (Hille, 1992) has been proposed (Su et al. 1996). In this kind of model the transporter acts as a ‘sticky’ channel in which substrates bind to specific sites during the permeation process. The advantages of this model are that it accounts for the uncoupled currents and for the variable stoichiometry observed in some transporters (Cammack et al. 1994; Mager et al. 1994; Risso et al. 1996).
Another interesting feature exhibited by neurotransmitter transporters expressed at high density in Xenopus oocytes is the existence of so-called ‘pre-steady-state currents’ induced by step changes in the membrane voltage (Loo et al. 1993; Mager et al. 1993, 1996). These pre-steady-state currents are similar to the better-known ‘gating currents’ of voltage-dependent channels; these are believed to arise from a conformational change of a ‘voltage sensor’, part of the channel protein, leading to the opening of the permeation pathway. However, intramembrane charge movement may, in principle, arise also from processes not necessarily involving a conformational change: in and out movement of ions between the external solution and a ‘vestibule’ located inside the membrane electrical field would in fact produce the same experimental results. This idea may be incorporated in the ‘alternating-access’ models of ion-coupled neurotransmitter transporters (Lester et al. 1994); however, the multi-substrate, single-file model for ion-coupled transport (Su et al. 1996) is also able to account for the observed pre-steady-state currents.
The recently cloned amino acid transporter KAAT1 (Castagna et al. 1998), which mediates K+-coupled neutral amino acid uptake in the midgut of lepidopteran larvae, shows an interesting homology with the superfamily of the Na+- and Cl−-dependent GABA transporter (Cammack et al. 1994). This structural similarity is reinforced by functional observations, such as a Cl− dependence (Castagna et al. 1998).
Although the transport activity of KAAT1 has been considered to be physiologically driven by K+, to match the peculiar ionic condition of the larval midgut (Giordana et al. 1982), it has been shown that it may also function with Na+ and with other alkali cations (Hennigan et al. 1993). In this paper we have investigated the permeation properties of heterologously expressed KAAT1, showing that the properties of this carrier closely resemble those of the structurally analogous neurotransmitter transporters. In particular KAAT1 exhibits relevant ‘uncoupled currents’ when bathed by Na+ and K+, the ions that can drive the amino acid uptake in the lepidopteran midgut (Sacchi & Wolfersberger, 1996). In parallel, transmembrane charge movement can be observed in the presence of the same two ions.
Detailed analysis of these processes gives new insights on the transport mechanism. The pore-like behaviour of KAAT1 has interesting implications for the physiology of electrolyte balance of the animal.
METHODS
Oocyte preparation and microinjection
Capped cRNA specific for KAAT1 was synthesized in vitro using a Not I cleaved pSPORT-KAAT1 cDNA construct with T7 RNA polymerase (Stratagene) (Dascal & Lotan, 1992).
Xenopus laevis frogs were anaesthetized in a 0.15 % (w/v) solution of MS222 (tricaine methanesulfonate) in tap water, portions of ovary were removed through a small incision on the abdomen, the incision was sutured and the animal was returned to water. Each frog was not reused more than two times; the interval between operations was longer than 4 months. The experiments were performed according to the national ethical regulations. After the final operation animals were killed by decapitation and pithing. The oocytes were treated with 1 mg ml−1 collagenase (Sigma Type IA) in ND96 Ca2+-free solution (mM: NaCl, 96; KCl, 2; MgCl2, 1; Hepes, 5; pH 7.6) for at least 1 h at 18°C. Healthy looking V and VI stage oocytes were collected and injected with 12.5 ng of cRNA in 50 nl of RNase-free water using a manual microinjection system (Drummond, Broomall, PA, USA).
The oocytes were incubated at 18°C for 3–4 days in NDE solution (mM: NaCl, 96; KCl, 2; CaCl2, 1.8; MgCl2, 1; Hepes, 5; pH 7.6, supplemented with 50 μg ml−1 gentamicin and 2.5 mM sodium pyruvate), before electrophysiological studies.
Electrophysiology
The classical two-microelectrode methodology (Oocyte Clamp, Warner Instr. Corp., Hamden, CT, USA) was used to voltage clamp single oocytes. Experimental protocols, and data acquisition and analysis were done using the pCLAMP 6.02 software (Axon Instruments, Foster City, CA, USA).
Solutions
The external control solution had the following composition (mM): tetramethylammonium chloride (TMACl), 98; MgCl2, 1; CaCl2, 1.8; Hepes free acid, 5. In the other solutions TMACl was replaced, respectively, by NaCl, KCl, RbCl, CsCl and LiCl. The pH was adjusted to 7.6 by adding the corresponding hydroxide for each alkali ion and TMAOH for the TMA+ solution. Leucine was added at a concentration of 1 mM to the appropriate solutions.
Solutions were superfused by gravity onto the oocyte by a pipette tip placed very close (1–2 mm) to the cell.
RESULTS
Transmembrane currents in absence of substrate
In control oocytes kept at −80 mV holding potential (Vh), the clamp current depends on the kind of bathing cation; as shown in Fig. 1A, the largest current was carried by Rb+ followed by K+, Cs+, Na+, Li+ and finally TMA+; conversely, oocytes expressing the cloned KAAT1 transporter exhibited larger holding currents that were particularly conspicuous in Li+, even in the absence of amino acid substrates (Fig. 1B).
Figure 1. Ionic selectivity of KAAT1-expressing oocytes.
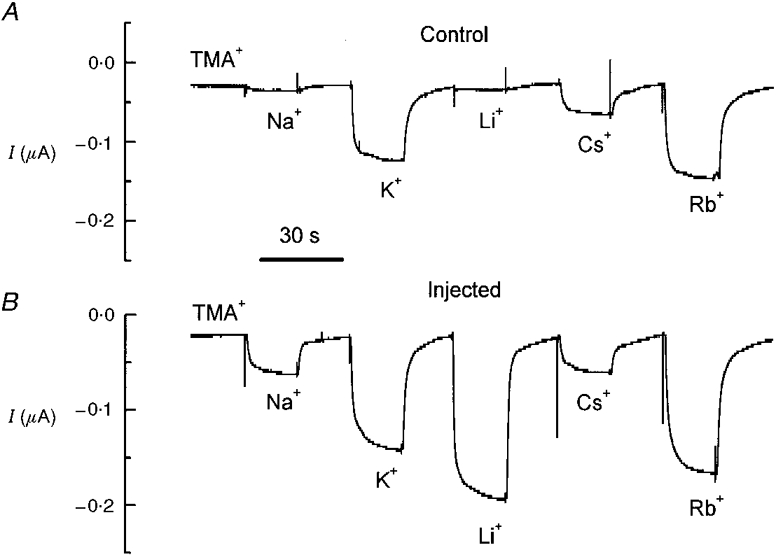
A, membrane currents recorded at −80 mV holding potential in a control oocyte superfused with the indicated solutions; B, same as in A for an oocyte injected with KAAT1 cRNA. Periods of 20 s in TMA+ solution separated perfusion with the various alkali ion solutions.
The mean values of the holding current increments (relative to TMA+) at −80 mV are reported in Table 1. The change of the selectivity order between control and injected oocytes, and particularly the much larger current in Li+ compared with Na+, are important results. As will be better clarified in the Discussion, these results suggest that the additional transmembrane ion movement seen in injected oocytes occurs via the transporter.
Table 1.
Holding current increments (relative to TMA+) at −80 mV in different solutions
| Solution | Control oocytes(nA) | Injected oocytes(nA) | Injected - control(nA) |
|---|---|---|---|
| Rb+ | 86 ± 10 | 124 ± 3 | 38 ± 10 |
| K+ | 64 ± 7 | 100 ± 4 | 36 ± 8 |
| Cs+ | 32 ± 4 | 35 ± 2 | 3 ± 4 |
| Na+ | 6 ± 1 | 50 ± 5 | 44 ± 5 |
| Li+ | 4 ± 1 | 192 ± 20 | 188 ± 20 |
Data are means ± S.E.M. from 10 control and 10 injected oocytes from the same batch. The holding current in TMA+ solution was 33 ± 3 and 20 ± 1 nA in control and injected oocytes, respectively. In the rightmost column data are differences between mean injected and mean control values ± s.e.m. of the difference.
In fact, while the selectivity order of control oocytes (Rb+ > K+ > Cs+ > Na+ > Li+ > TMA+) corresponds to Eisenman's sequence III (Eisenman, 1962; Hille, 1992, chap. 10), and indicates interactions of the ions with rather weak binding sites (typical of ionic channels), the order of selectivity found in injected oocytes, in which Li+ is the preferred ion, indicates interaction of the ions with a strong binding site (Eisenman's sequence XI) and it is unlikely to occur in ionic channels (Hille, 1992, chap. 13). Therefore the possibility that the results of Fig. 1B might arise from the expression of new endogenous channels induced by the injection of heterologous mRNA (Tzounopoulos et al. 1995) does not seem likely (see Discussion).
When the membrane voltage was stepped to other values, some interesting features appeared: Fig. 2 shows the current traces in response to voltage-clamp steps to various levels from a holding potential of −80 mV in the presence of the indicated cations. It is evident that control and injected oocytes behave differently: while in control oocytes (left column) the presence of endogenous, Rb+/K+-selective channels induced larger currents in K+, in the injected oocytes, and even in the absence of amino acid (middle column), both Na+ and K+ carried significantly larger currents; furthermore, there was a smaller but consistent increase in current also in the presence of TMA+.
Figure 2. Voltage-dependent currents in control and KAAT1-expressing oocytes.
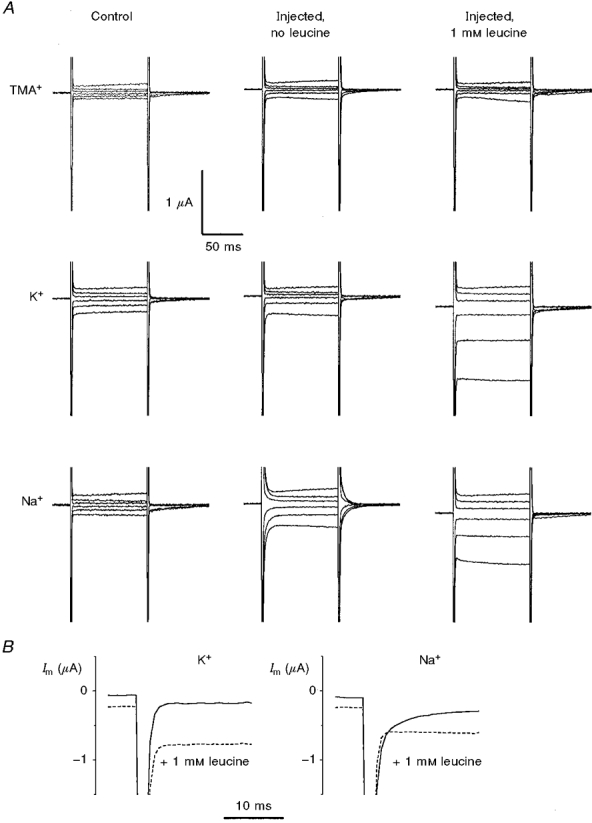
A, recordings of membrane currents (Im) elicited by voltage steps from Vh=−80 mV to −180, −140, −100, −60, −20 and +20 mV, in a control (left column) and in a KAAT1-expressing oocyte (middle and right columns) bathed in the indicated solutions. B, comparison of the relaxations (step voltage to −140 mV) with and without leucine for K+ and Na+ at a higher time resolution.
Average steady-state I-V relationships for the various conditions are plotted in Fig. 3A and B. In the batches of oocytes used for this figure the amplitude of the current in Na+ and K+ was similar. However, this was not always so (see for instance the results shown in Fig. 1 and Table 1, from another batch, where a larger K+ current was observed); this is due to differences in the number of endogenous K+ channels present in different batches of oocytes (range 40–120 nA at −80 mV).
Figure 3. Steady-state I-V relationships and time constants.
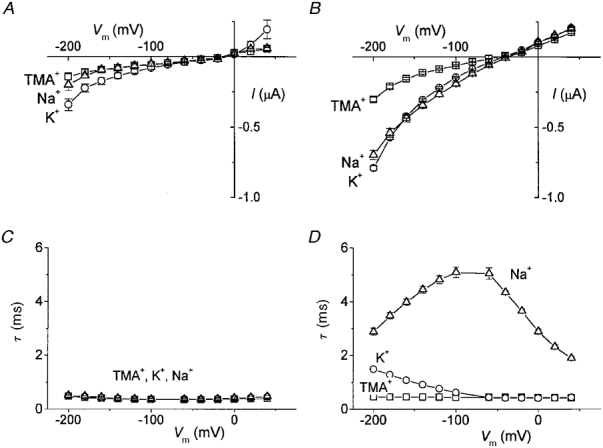
Control (A) and KAAT1-expressing oocytes (B) in TMA+ (□), K+ (^) and Na+ (▵) external solutions (means ±s.e.m., n = 13). Time constants of decay of the currents relative to the ‘on’ voltage jumps as a function of voltage in control (C) and injected (D) oocytes (same symbols as in A and B).
The most conspicuous difference between control and injected oocytes concerned, however, the relaxation time constant of the current upon voltage steps, the so-called ‘pre-steady-state’ currents (Fig. 2). While in control oocytes the decays were adequately fitted with single exponentials with small time constants (τ < 0.5 ms) and did not depend on voltage and bathing ion (Fig. 3C), in the injected oocytes a second exponential was required, depending on voltage and on the bathing ion. This is shown in Fig. 3D where it can be seen that, in the presence of high Na+, τ went through a maximum at about −80 mV, while in the presence of high K+, τ began to increase at very negative potentials; the presence of TMA+ did not appear to produce detectable effects on this parameter.
The above observations strongly indicate that the carrier is able to translocate ions even in the absence of the amino acid substrate. This kind of current has already been reported for some other amino acid transporters, especially those that show structural homology with KAAT1, such as GAT1 and the 5-HT transporter (Mager et al. 1994, 1996), and is defined as ‘uncoupled’ or ‘leakage’ current. The same transporters also share with KAAT1 the peculiar slow relaxations in the presence of Na+. These have been attributed to the charged Na+ ions binding to a transporter site located in the membrane electrical field, giving rise to an intramembrane charge movement (Lester et al. 1994). Our results shown in Fig. 3B and D may be similarly interpreted. Although with different characteristics, both Na+ and K+ gave rise to this effect, while TMA+ did not appear to bind at all, in agreement with the physiological relevance of these ions for the transport of amino acids (Hanozet et al. 1992).
Transmembrane currents in the presence of substrate
Addition of 1 mM leucine to oocytes expressing KAAT1 bathed in K+ or Na+ solutions produced the expected increase in steady-state membrane current (Fig. 2A, right column). The steady-state current was increased most when the oocytes were bathed in high K+ solution; the current increased also in the presence of Na+, while in TMA+ there was no change. The complete I-V relationships from a group of injected oocytes in the Na+ and K+ solutions are plotted in Fig. 4A and B.
Figure 4. Effects of leucine on steady-state I-V relationships and time constants.
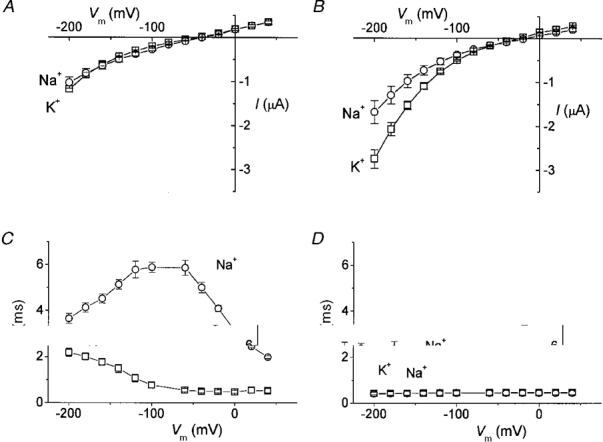
Data from a group of cRNA-injected oocytes in the absence (A) and presence (B) of leucine, bathed in K+ (□) and Na+ (^) solutions (means ±s.e.m., n = 5). Time constants of decay of the ‘on’ relaxation as a function of voltage in the absence (C) and presence (D) of leucine; same oocytes and same symbols as in A and B.
Besides the increased amplitude, it can be seen that the zero current potential showed a shift towards more positive values, being −45 ± 5 and −39 ± 2 mV for K+ and Na+ in injected oocytes vs.−25 ± 2 mV and −16 ± 1 mV for the same oocytes in the presence of 1 mM leucine (means ±s.e.m., data from the oocytes of Fig. 4).
Another interesting effect of the addition of leucine was the disappearance of the slow current decays both in the high Na+ and high K+ conditions; the relaxation time constants are plotted in Fig. 4C and D for a group of oocytes in the absence and presence of leucine.
In Fig. 5 we have plotted, as a function of potential, the difference between the current in the presence of 1 mM leucine with Na+ or K+ and the respective uncoupled current. This plot confirms the results of Castagna et al. (1998); this additional current was larger for K+ at negative potentials and the Na+ and K+ relationships crossed each other at about −70 mV.
Figure 5.
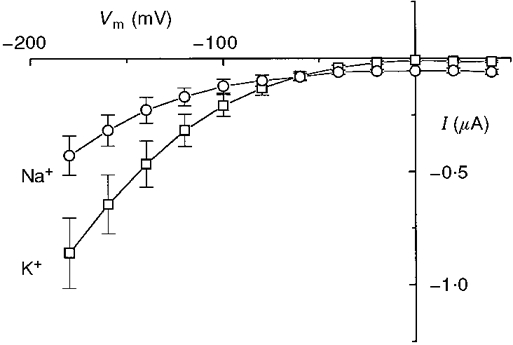
Additional currents induced by leucine in the presence of the indicated ion (means ±s.e.m., n = 5).
This result also correlates with the observation that K+ appears to be more efficient in the transport of leucine (Hanozet et al. 1992).
The effective membrane capacity of the KAAT1-expressing oocytes is voltage and ion dependent
The slow relaxations following voltage steps in the absence of substrate and their disappearance in the presence of substrate are results that agree pretty well with the observations from other transporters (Loo et al. 1993; Mager et al. 1993, 1994), where they have been attributed to Na+ binding and unbinding to a transporter or to a conformational change following binding (Hazama et al. 1997; Loo et al. 1998). We further investigated this aspect by measuring the effective membrane capacity (Ceff) of the oocytes. The large size of Xenopus oocytes represents a disadvantage for the evaluation of intramembrane charge movement when the membrane potential steps are large. We have circumvented this difficulty by adopting the approach used by Adrian & Almers (1976), which consists of measuring the slope effective capacity of the oocyte as a function of membrane potential. To do so, small potential steps (ΔV= 20 mV, duration 40 ms) were superimposed to variable potential levels (Fig. 6A); the ‘on’ and ‘off’ current transients were integrated (after correction for leakage current), giving the amount of moved charge ΔQ. The ratio ΔQ/ΔV approximates the slope capacity of the membrane at that potential level.
Figure 6. Protocol for the measurement of the effective membrane capacity.
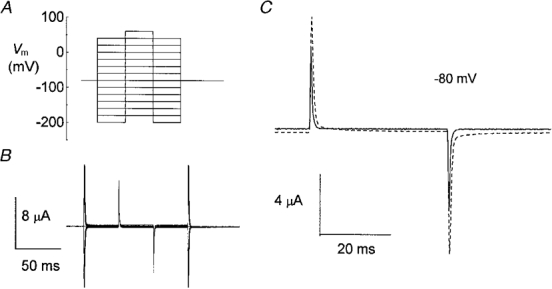
A, a small (20 mV) test step was superimposed to variable voltage levels in order to avoid saturation of the large capacitative peaks. B, sample currents elicited by the protocol. C, two traces showing the currents in response to the step from −80 mV from a control (continuous line) and from an injected (dashed line) oocyte, both in high Na+ solution.
The effective capacity measured in this way in control oocytes bathed in high Na+ solution was substantially independent of voltage, as shown in Fig. 7A. Conversely, application of this stimulus protocol and analysis to oocytes expressing KAAT1 gave results that differed, depending on the bathing ion. Figure 7 shows that, when the oocyte was bathed in TMA+ solution Ceff was independent of the membrane voltage and had a value similar to that of control oocytes; when bathed in sodium or potassium solution, the same oocyte exhibited a voltage-dependent increase in the value of Ceff: in high Na+ a complete bell-shaped relationship was apparent, with a maximum increase of about 30 % around −80 mV, while the presence of high K+ appeared to increase Ceff in a very negative voltage range, with a possible maximum beyond −200 mV. Clearly the voltage dependence of these relationships was very similar to that of the time constant of relaxation seen in Fig 3 and Fig 4.
Figure 7. Membrane effective capacity is ion and voltage dependent in oocytes expressing KAAT1.
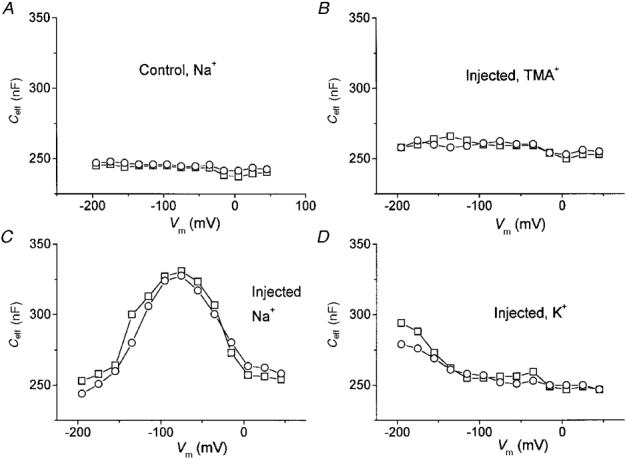
A, voltage dependence of Ceff in a control oocyte bathed in high Na+. B−D: Ceff from the same injected oocyte bathed in the indicated solutions. Ceff was calculated from the integrals of the ‘on’ (□) and ‘off’ (^) transients elicited by the protocol of Fig. 6.
The substantial identity of ‘on’ and ‘off’ values shown in Fig. 7 strongly supports the hypothesis that the excess transient current is generated by charges whose movement is confined between two positions inside the membrane electrical field. Also, the bell-shaped relationship between Ceff and voltage, seen in Na+, is a characteristic sign of intramembrane charge movement: in fact for this kind of process saturation of the movable charge is expected at large positive and negative potentials, where all the charges will be in one or the other of the two positions.
Charge movement in high Na+ and K+ solutions
Since oocytes expressing the KAAT1 transporter do not show detectable charge movement when bathed in TMA+, we have used the current traces in TMA+ as controls to isolate the charge movement in the presence of the other ions. The pulse protocol of Fig. 6A was applied first in the presence of TMA+ solution and subsequently in the presence of other solutions. The current traces obtained in TMA+ were then subtracted from those obtained in Na+ and in K+. The result of this subtraction for Na+ is presented in Fig. 8A; only the time interval relative to the test pulse is shown.
Figure 8. Charge movement in Na+.
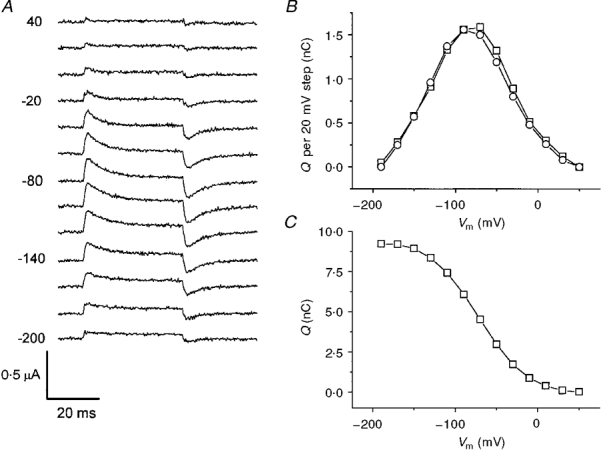
A, INa - ITMA during the 20 mV test pulses as in the protocol shown in Fig. 6A. B, integrals of the ‘on’ (□) and ‘off’ (^) transients from the traces in A, showing good correspondence with each other and a bell-shaped dependence on voltage. C, cumulative integral from B, representing the amount of charge moved at each potential.
The integrals of the ‘on’ and ‘off’ transients after correction for the steady-state current at each potential are plotted in Fig. 8B as a function of voltage; the bell-shaped relationship and the substantial identity of the ‘on’ and ‘off’ values confirmed the results shown above for Ceff. The values of the integrals represent the amount of charge moving between two positions inside the membrane electrical field for a voltage step of 20 mV. From these data the cumulative amount of charge as a function of potential may be obtained: this graph is illustrated in Fig. 8C and indicates a total amount of movable charge of about 9.2 nC for this oocyte.
The same kind of analysis for K+ is shown in Fig. 9. In this case only the beginning of the curve was observable, as the process appeared to be strongly shifted to more negative potentials; however, the identity of the ‘on’ and ‘off’ integrals was confirmed (Fig. 9B), although the time course of the relaxations was faster compared with that in Na+ solutions.
Figure 9. Charge movement in K+.
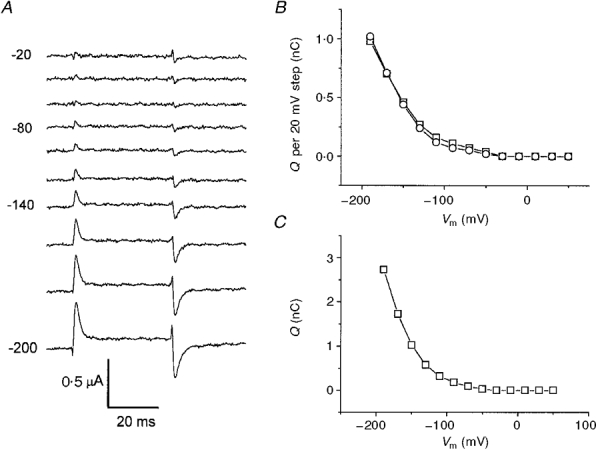
A, IK - ITMA during the 20 mV test pulses as in the protocol shown in Fig. 6A. B, integrals of the ‘on’ (□) and ‘off’ (^) transients from the traces in A, showing good correspondence with each other. C, cumulative integral from B.
Dependence of charge movement on Na+ concentration
Different models may be used to explain the results shown so far (see Discussion); however, as a working hypothesis, in the following we have attempted to interpret our observations in the light of a scheme in which the charge movement is generated by the back and forth motion of ions between the extracellular solution and transporter binding site(s) located inside the membrane electrical field. To obtain more information on the ion-binding characteristics of KAAT1, we have performed a series of experiments measuring the charge vs. voltage relationships in the presence of various concentrations of Na+. Figure 10 shows the effect of bathing the oocytes in solutions containing different proportions of Na+ and TMA+.
Figure 10. Effect of Na+ concentration on charge movement.
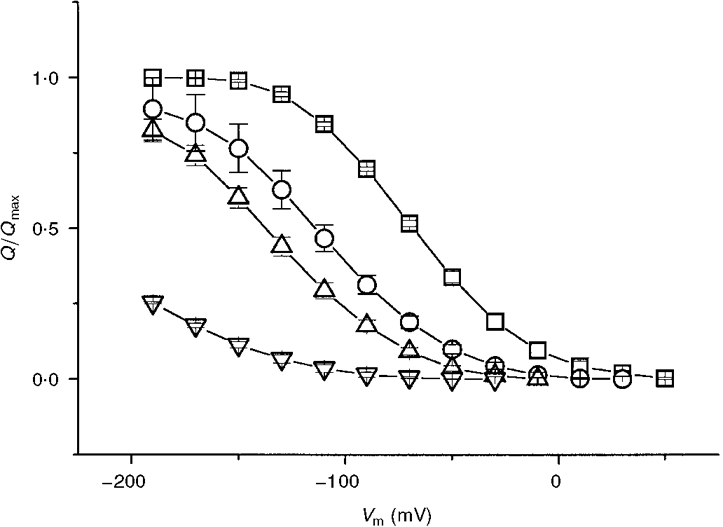
Normalized charge vs. voltage relationships for a group of oocytes bathed in 98 (□), 40 (^), 20 (▵) and 5 (▿) mM Na+ (TMA+ substitution). Data are means ±s.e.m. from 14 oocytes (two batches).
Lowering the Na+ concentration shifted the Qvs. V relationship towards more negative potentials; in addition the slope at half-charge decreased. The data of Fig. 10 may be used at constant potentials to obtain a Hill coefficient (nH) from the equation:
 |
(1) |
where KNa is the sodium dissociation constant. In the interval −110 to −190 mV (in which Q is different from zero in all four curves), the values of nH ranged between 1.29 and 1.78.
On the other hand, a Boltzmann relation:
 |
(2) |
where V½ is the mid-point voltage and s is the slope factor, may be fitted to the curves at 98 and 40 mM Na+, giving the parameter values of Table 2.
Table 2.
| [Na+](mM) | Normalized Qmax | V1/2(mV) | s(mV) |
|---|---|---|---|
| 98 | 1.03 ± 0.1 | −68.7 ± 0.7 | 26.3 ± 0.7 |
| 40 | 0.97 ± 0.2 | −110.3 ± 0.6 | 29.3 ± 0.6 |
| 20 | 0.98 ± 0.2 | −133.3 ± 1.1 | 30.6 ± 0.9 |
| 5 | — | < −200 | > 30 |
As pointed out by Mager et al. (1996), to explain a similar effect observed in the GAT1 transporter, the two treatments may be unified by explicitly writing the voltage dependence of the dissociation constant KNa in a modified Hill equation:
 |
(3) |
where q is the elementary charge, δ is the fraction of electrical field over which the charge movement occurs (i.e. the relative distance at which the ions bind) and KNa(V= 0) represents a zero voltage dissociation constant, k is the Boltzmann constant and T the absolute temperature.
The value of nH found from our results is very similar to that reported for the GAT1 transporter (Mager et al. 1996) and suggests that the transporter has at least two binding sites; assuming then binding of two ions and noting that, from eqns (2) and (3), s=kT/nHqδ, the electrical distance δ turns out to be between 0.56 and 0.61 in 98 mM Na+ and between 0.49 and 0.56 in 40 mM Na+; conversely, the values of KNa(V= 0) are 515 and 415 mM in 98 and 40 mM Na+, respectively. Again these values do not differ strongly from those reported for the GAT1 transporter (Mager et al. 1996).
It is difficult to perform the same kind of analysis on the potassium data since only the initial part of the sigmoidal Boltzmann curve can be established, even in high K+ solution. Using the same Hill coefficient and electrical distance found for Na+ but with V½ < −200 mV a value greater than 12 000 mM can be calculated for the potassium zero voltage dissociation constant, KK(V= 0).
Determination of the rate constants of charge movement
Under the working hypothesis outlined at the beginning of the previous section, we have analysed the time constants of decay of the charge movement in order to attempt an estimate of its absolute rate constants. An example from a single oocyte is shown in Fig. 11. In A the typical charge- voltage relationships in the presence of high Na+ and high K+ are shown, while in B the corresponding time constants are plotted. Compared with the time constants estimated for neurotransmitter transporters, those for KAAT1 appear somewhat faster; however, the rabbit Na+-glucose cotransporter SGLT1 shows more similar time constants (Hazama et al. 1997).
Figure 11. Calculation of forward and backward rate constants for binding of Na+ and K+ to the transporter.
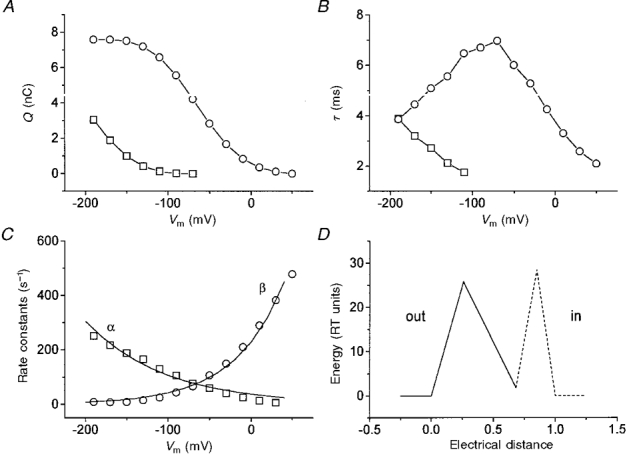
A, moved charge and B, time constants vs. voltage in 98 mM K+ (□) and 98 mM Na+(^); C, forward (□) and backward (^) rate constants in 98 mM Na+; D, energy profile of the external barrier and binding site calculated as explained in the text; the dashed part is hypothetical. Continuous lines in C are functions for α and β fitted by eye. All data are from a single oocyte.
There was a good agreement between the voltages at which the half-charge and the maximal time constant for Na+ occurred, while only the beginning of the curves could be detected for K+, both for the charge and for the time constant relationships. However, the potassium curves appear only shifted to more negative voltages, with no significant changes in absolute value. For this reason we have limited our analysis to Na+.
The charge-concentration relationships give a Hill coefficient of around 1.6, implying co-operativity of the binding sites. We have, however, for simplicity, assumed independence of binding in order to calculate the separate forward and backward rate constants from the simple equations:
and
These are shown in Fig. 11C. According to Eyring rate theory, the curves of Fig. 11C were fitted by eye with the functions:
and
where ν is the transmission coefficient (6.11 × 10¹² s−1), ΔGe and ΔGw are the size of the entry barrier and of the binding site well, respectively, δe and δw their positions in the membrane thickness, and R is the gas constant. Fitting to the curves gave values of 25.8 and 1.8 for ΔGe/RT and ΔGw/RT, respectively, and of 0.26 and 0.68 for their respective positions. This energy profile is shown in Fig. 11D.
Relationships between charge movement and steady-state currents
The maximal charge measured in the experiments of Figs 8 and 10 allows the estimation of the number of transporters expressed per oocyte from the relation N =Qmax/q 2δw. Clearly this number depends on the expression level of the oocytes, but we usually found values of between 1010 and 1011 transporters per oocytes on the third day after injection.
There was a good correlation between Qmax and the leucine-coupled current at −200 mV in each oocyte. This is illustrated in Fig. 12 for six oocytes in K+ and for 10 oocytes in Na+, with Qmax ranging from 2.26 to 9.65 nC. The slopes of the linear fits were 211 nA/nC in K+ and 111 nA/nC in Na+, which, considering that N = Qmax/q 2δw, would correspond to cycling rates of 143 and 75 s−1 (at −200 mV), respectively. A difference between Na+ and K+ can be noted in the uncoupled currents: while in Na+ the regression line went through the origin, this did not happen for K+. This is probably due to the fact that there is a significant flux of K+, but not of Na+, through the endogenous K+ channels of the oocytes (see Fig. 1).
Figure 12. Correlation between steady-state currents and Qmax.
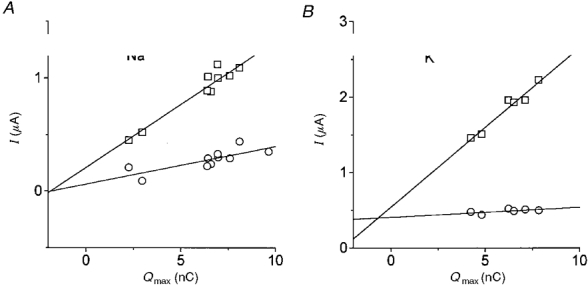
A, coupled (□) and uncoupled (^) currents at −200 mV for 10 different oocytes in 98 mM Na+. B, same for K+ (Qmax was estimated in Na+) in another group of 6 oocytes.
Figure 13A shows the Q-V relationships for an oocyte bathed in high Na+ and in 5 mM Na+ (TMA+ replacement); this graph is similar to that in Fig. 10. In Fig. 13B the leucine-induced current vs. voltage relationships in the same solutions are plotted. It can be seen that at each potential the reduction in bound charge was much stronger than the reduction in steady-state current.
Figure 13. Comparison of charge movement and coupled current in 98 and 5 mM Na+.
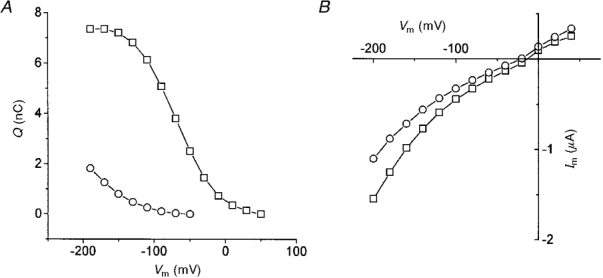
A, Q-V relationships in 98 (□) or 5 mM Na+ (TMA+ substitution, ^). B, corresponding steady-state currents in the presence of leucine.
This result implies that the two events are not causally related, suggesting that the presence of organic substrate significantly alters the binding kinetics of the ion to the transporter.
Disappearance of charge movement in the presence of the transported substrate
Subtraction of the TMA+ (without leucine) current traces from those in Na+, K+ and TMA+ solutions containing 1 mM leucine produced the records shown in Fig. 14, where it is apparent that the ‘on’ and ‘off’ transients of Figs 8 and 9 have disappeared. Correspondingly, larger steady-state currents may be observed (note the difference in scale between Na+ and K+ records). This observation is in line with similar results obtained in other transporters (Mager et al. 1993, 1994; Loo et al. 1993) and may be interpreted by thinking that the presence of amino acid greatly speeds up the steps related to the charge movement in the membrane field.
Figure 14. Absence of charge movement in the presence of leucine.
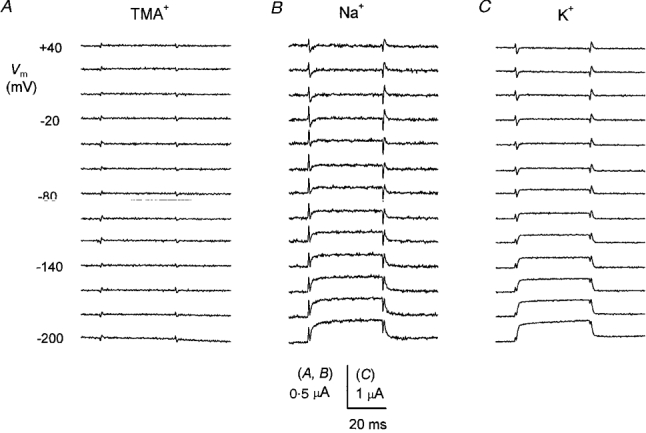
The traces shown in each column are the results of the subtraction of the currents in the presence of 1 mM leucine and the indicated ion, and the traces in TMA+ without leucine in the same oocyte. The ‘on’ and ‘off’ transients visible in Figs 8 and 9 disappear while the steady-state currents increase.
DISCUSSION
The heterologous expression of the KAAT1 transporter in Xenopus oocytes has enabled the discovery of a number of previously unknown aspects of its physiology. Before starting the discussion of the results presented in this paper, it is important to remember the physiological peculiarities of the lepidopteran larvae, characterized by a high K+ and a low Na+ content. In the midgut lumen K+ is about 200 mM and Na+ about 5 mM, and the high apical transmembrane potential (around 200 mV) of columnar cells, where KAAT1 is located, serves as a driving force for K+- (and Na+-) coupled amino acid uptake (Dow & Peacock, 1989; Hanozet et al. 1992).
While the overexpression of the transporter allows new electrophysiological experiments to be performed, it is clearly difficult to reproduce the in vivo physiological conditions using oocytes, which have smaller physiological potentials and osmolarity. Anyway we must remember that the condition that more closely resembles the lepidopteran midgut situation in our experiments is the one in high K+ at −200 mV.
In this paper we have investigated the details of binding and permeation of the two ions physiologically most important for the translocation of amino acids across the lepidopteran midgut. It is known that the transport properties of KAAT1 are also significantly dependent on the presence of Cl− (Castagna et al. 1998), and this is another characteristic that is in common with the other transporters of the GAT1 family (Lester et al. 1994). However, we have not investigated this point in the present paper, and the Cl− concentration was kept constant in all our experimental solutions.
Uncoupled currents
The first new observation is that a relatively large current is carried by the transfected oocytes in the presence of various external cations even in the absence of amino acid substrate. This is shown in Figs 1, 2 and 3. The amplitude of the holding current at −80 mV is in the order: IRb > IK > ICs > INa > ILi > ITMA for control oocytes, whereas the order is ILi > IRb > IK > INa > ICs > ITMA for oocytes injected with the transporter cRNA. The sequence observed in control oocytes corresponds with Eisenman's sequence III (Eisenman, 1962) and indicates rather weak interaction of the ions with the site, as would be expected for ionic channels in which free diffusion of ions can occur (Hille, 1992, chap. 10). On the contrary, the order of preference exhibited in KAAT1-expressing oocytes is compatible only with the selectivity sequence predicted for interaction of ions with a strong binding site (Eisenman's sequence XI: Eisenman, 1962; Hille, 1992, p. 289). Assuming that the transfected oocytes possess the same amount of basal endogenous channels as the non-injected ones of the same batch, the additional current is in the order ILi > INa≈IRb≈IK > ICs > ITMA (Table 1), which, taking into account that the values of INa, IRb and IK are not significantly different, corresponds to Eisenman's sequence XI (strong site). This kind of interaction is unlikely for ionic channels where in general the Li+ permeability is never higher than that of Na+ (Hille, 1992, chap. 13).
These considerations favour the idea that the current occurs at the transporter itself rather than through newly expressed ionic channels. In fact, although there is evidence that the expression of a variety of heterologous membrane proteins may induce the expression of new endogenous cationic channels (Tzounopoulos et al. 1995), these new channels have characteristics that strongly differ from the observations reported above: they are activated only at negative potentials (−130, −140 mV) and with a slower time course; they exhibit equal permeability to Na+, K+ and Cs+; their presence is significant starting from the fourth day after injection.
Ion binding to the KAAT1 transporter
Our experiments show that expression of the KAAT1 transporter is accompanied by the appearance of conspicuous currents having the properties of intramembrane charge movement (Figs 7, 8 and 9). Very interestingly, this charge movement is ion dependent, changing characteristics according to whether Na+ or K+ is the bathing ion and being absent in the presence of the larger ion TMA+.
Two different hypothetical schemes may be devised to interpret these results: in the first, the transient currents observed upon voltage jumps arise from in and out movement of ions from the bathing solution to site(s) located inside the membrane electrical field; in the second, the ions might first bind to a site located outside the electrical field and the subsequent conformational changes generate the charge movement. In the first scheme a conformational change of the transporter is not required for the charge movement; in the second scheme the charge movement may be generated either with the ions bound or unbound, depending on whether the transporter itself is neutral or charged. A model of this kind, in which the charge movement is generated by a combination of ion binding and conformational changes, has been proposed for the Na+- glucose cotransporter SGLT1 (Hazama et al. 1997; Loo et al. 1998).
We have seen that the amount of bound charge depends also on the external ionic concentration, in agreement with the expectations for a saturable binding process: analysis of binding gives a Hill coefficient of 1.6, which is very similar to the value reported by Mager et al. (1996) for the homologous transporter GAT1, and indicates the presence of at least two binding sites for each transporter, as suggested also by Castagna et al. (1998) on the basis of different considerations.
Rate constants
Within the framework exposed in the preceding section, we have performed calculations in order to obtain kinetic parameters of the transport function. Fitting of the charge vs. voltage curve in high Na+ using a Boltzmann equation allows the determination of the electrical distance at which the sites are located. This turns out to be about 0.6, a value again very similar to that found for the GAT1 transporter (Mager et al. 1996).
We have also analysed the time dependence of the charge movement. Although our analysis is not strictly rigorous, because for simplicity it assumes independent binding of the ions to the sites, it allows the evaluation of unidirectional rate constants that, interpreted using Eyring rate theory, may give an approximate picture of the energy profile along the transporter permeation pathway. In particular, to access the internal binding site, Na+ must overcome an entry barrier of 25.8 RT units (at 0 mV), located at a relative distance of 0.26; the binding site is an energy minimum at a level of 1.8 RT units and at a relative distance of 0.68.
Permeation and binding in the presence of the organic substrate
Our data show that the presence of the transported amino acid leucine considerably alters the characteristics of the uncoupled currents: (i) the total steady-state current becomes larger when K+ is the coupling ion; (ii) (consequently) the difference between total and uncoupled current is larger in K+ than in Na+; and (iii) the slow current relaxations are strongly reduced as is the intramembrane charge movement.
The higher stimulatory effect of leucine on the K+ rather than on the Na+ current is in agreement with the literature data showing a higher transport of amino acid in the presence of K+ compared with Na+ (Hanozet et al. 1992).
The disappearance of the slow relaxations and of the charge movement in these conditions (which is a characteristic feature of this family of transporters) may be interpreted by thinking that the binding of the organic substrate might allow a faster conformational change translocating all the bound species, that is not allowed in its absence.
While the good correlation between Qmax and the transport-associated current supports the idea that the charge movement occurs at the transporter, the lack of correlation between the amount of bound charge in the absence of amino acid and the steady-state current in its presence (Fig. 13) indicates that the two conditions are not causally related. This observation implies that the kinetics of binding and unbinding of the ions to the transporter are altered by the presence of the amino acid.
The higher flux rates will also produce the positive shift of the zero current potential, towards the equilibrium potentials of Na+ and K+ (Fig. 4).
Physiological significance
The peculiar physiological conditions of the lepidopteran midgut induce some considerations about the physiological role of an amino acid transporter that has a quite significant uncoupled current. Also the kinetic parameters of the transport appear to be physiologically relevant. The Na+ concentration is low in the diet and in the haemolymph of the phytophagous lepidopteran larvae, yet this ion is essential for the functioning of the nervous system. The presence in the absorptive epithelium of a transporter that can support influx of Na+ both coupled or uncoupled to the amino acid uptake seems therefore an advantage. The higher affinity of the transporter for Na+ may also be significant in this respect, since it makes possible the binding of Na+, even at low concentration.
In the absence of the amino acid the uncoupled Na+ and K+ currents do not appear different (Fig. 3B), yet, taking into account the higher endogenous K+ conductance of the oocyte, the uncoupled Na+ current mediated by KAAT1 should be higher than the uncoupled K+ current, which is reasonable in a tissue where K+ secretion occurs and Na+ has to be absorbed.
The results presented in this paper show that the amino acid transport system present in the midgut of lepidopteran larvae, despite the difference in cation selectivity, behaves in a manner very similar to some of the mammalian neurotransmitter transporters (Lester et al. 1994). These observations extend, therefore, to the functional properties of the structural homology of KAAT1 with the GAT1 family of transporters (Liu et al. 1993; Shafqat et al. 1995).
The peculiar physiological conditions in which this transporter operates do not appear, therefore, to require a completely different system from those that operate in vertebrates using the Na+ electrochemical gradient at more moderate potentials.
References
- Adrian RH, Almers W. The voltage dependence of membrane capacity. The Journal of Physiology. 1976;254:317–338. doi: 10.1113/jphysiol.1976.sp011234. [DOI] [PMC free article] [PubMed] [Google Scholar]
- Cammack JN, Rakhilin SV, Schwartz EA. A GABA transporter operates asymmetrically and with variable stoichiometry. Neuron. 1994;13:949–960. doi: 10.1016/0896-6273(94)90260-7. [DOI] [PubMed] [Google Scholar]
- Castagna M, Shayakul C, Trotti D, Sacchi VF, Harvey WR, Hediger MA. Cloning and characterization of a potassium-coupled amino acid transporter. Proceedings of the National Academy of Sciences of the USA. 1998;95:5395–5400. doi: 10.1073/pnas.95.9.5395. [DOI] [PMC free article] [PubMed] [Google Scholar]
- Dascal N, Lotan I. Expression of exogenous ion channels and neurotransmitter receptors in RNA-injected Xenopus oocytes. In: Longstaff A, Revest P, editors. Methods in Molecular Biology, Protocols in Molecular Neurobiology. Vol. 13. NJ, USA: The Humana Press; 1992. pp. 205–225. [Google Scholar]
- Dow JAT, Peacock JM. Microelectrode evidence for the electrical isolation of goblet cell cavities in Manduca sexta middle midgut. Journal of Experimental Biology. 1989;143:101–114. [Google Scholar]
- Eisenman G. Cation selective glass electrodes and their mode of operation. Biophysical Journal. 1962;2:259–323. doi: 10.1016/s0006-3495(62)86959-8. [DOI] [PMC free article] [PubMed] [Google Scholar]
- Giordana B, Sacchi VF, Hanozet GM. Intestinal amino acid absorption in lepidopteran larvae. Biochimica et Biophysica Acta. 1982;692:81–88. [Google Scholar]
- Hanozet GM, Sacchi VF, Nedergaard S, Bonfanti P, Magagnin S, Giordana B. The K+-driven amino acid cotransporter of the larval midgut of lepidoptera: is Na+ an alternate substrate? Journal of Experimental Biology. 1992;162:281–294. [Google Scholar]
- Hazama A, Loo DDF, Wright EM. Presteady-state currents of the rabbit Na+/glucose cotransporter (SGLT1) Journal of Membrane Biology. 1997;155:175–186. doi: 10.1007/s002329900169. 10.1007/s002329900169. [DOI] [PubMed] [Google Scholar]
- Hediger MA, Coady MJ, Ikeda TS, Wright EM. Expression cloning and cDNA sequencing of the Na+/glucose co-transporter. Nature. 1987;330:379–381. doi: 10.1038/330379a0. 10.1038/330379a0. [DOI] [PubMed] [Google Scholar]
- Hennigan BB, Wolfersberger MG, Parthasarathy R, Harvey WR. Cation-dependent leucine, alanine, and phenylalanine uptake at pH 10 in brush-border membrane vesicles from larval Manduca sexta midgut. Biochimica et Biophysica Acta. 1993;1148:209–215. doi: 10.1016/0005-2736(93)90131-i. [DOI] [PubMed] [Google Scholar]
- Hille B. Ionic Channels of Excitable Membranes. 2. Sunderland, MA, USA: Sinauer Associates; 1992. [Google Scholar]
- Lester HA, Mager S, Quick MW, Corey JL. Permeation properties of neurotransmitter transporters. Annual Review of Pharmacology and Toxicology. 1994;34:219–249. doi: 10.1146/annurev.pa.34.040194.001251. 10.1146/annurev.pa.34.040194.001251. [DOI] [PubMed] [Google Scholar]
- Liu QR, López-Corcuera B, Mandiyan S, Nelson H, Nelson N. Cloning and expression of a spinal cord- and brain-specific glycine transporter with novel structural features. Journal of Biological Chemistry. 1993;268:22802–22808. [PubMed] [Google Scholar]
- Loo DDF, Hazama A, Supplisson S, Turk E, Wright EM. Relaxation kinetics of the Na+/glucose cotransporter. Proceedings of the National Academy of Sciences of the USA. 1993;90:5767–5771. doi: 10.1073/pnas.90.12.5767. [DOI] [PMC free article] [PubMed] [Google Scholar]
- Loo DDF, Hirayama BA, Gallardo EM, Lam JT, Turk E, Wright EM. Conformational changes couple Na+ and glucose transport. Proceedings of the National Academy of Sciences of the USA. 1998;95:7789–7794. doi: 10.1073/pnas.95.13.7789. 10.1073/pnas.95.13.7789. [DOI] [PMC free article] [PubMed] [Google Scholar]
- Mager S, Kleinberger-Doron N, Keshet GI, Davidson N, Kanner BI, Lester HA. Ion binding and permeation at the GABA transporter GAT1. Journal of Neuroscience. 1996;16:5405–5414. doi: 10.1523/JNEUROSCI.16-17-05405.1996. [DOI] [PMC free article] [PubMed] [Google Scholar]
- Mager S, Min C, Henry DJ, Chavkin C, Hoffman BJ, Davidson N, Lester HA. Conducting states of a mammalian serotonin transporter. Neuron. 1994;12:845–859. doi: 10.1016/0896-6273(94)90337-9. 10.1016/0896-6273(94)90337-9. [DOI] [PubMed] [Google Scholar]
- Mager S, Naeve J, Quick M, Labarca C, Davidson N, Lester HA. Steady states, charge movements, and rates for a cloned GABA transporter expressed in Xenopus oocytes. Neuron. 1993;10:177–188. doi: 10.1016/0896-6273(93)90309-f. 10.1016/0896-6273(93)90309-F. [DOI] [PubMed] [Google Scholar]
- Risso S, Defelice LJ, Blakely RD. Sodium-dependent GABA-induced currents in GAT1-transfected HeLa cells. The Journal of Physiology. 1996;490:691–702. doi: 10.1113/jphysiol.1996.sp021178. [DOI] [PMC free article] [PubMed] [Google Scholar]
- Sacchi VF, Wolfersberger M. Amino acid absorption. In: Lehane MJ, Billingsley PF, editors. Biology of the Insect Midgut. London: Chapman & Hall; 1996. pp. 265–292. [Google Scholar]
- Shafqat S, Velaz-Faircloth M, Henzi VA, Whitney KD, Yang-Feng TL, Seldin MF, Fremeau RTJ. Human brain-specific L-proline transporter: molecular cloning, functional expression, and chromosomal localization of the gene in human and mouse genomes. Molecular Pharmacology. 1995;48:219–229. [PubMed] [Google Scholar]
- Su A, Mager S, Mayo SL, Lester HA. A multi-substrate single-file model for ion-coupled transporters. Biophysical Journal. 1996;70:762–777. doi: 10.1016/S0006-3495(96)79616-9. [DOI] [PMC free article] [PubMed] [Google Scholar]
- Tzounopoulos T, Maylie J, Adelman JP. Induction of endogenous channels by high levels of heterologous membrane proteins in Xenopus oocytes. Biophysical Journal. 1995;69:904–908. doi: 10.1016/S0006-3495(95)79964-7. [DOI] [PMC free article] [PubMed] [Google Scholar]


