Abstract
Protective/suppressive major histocompatibility complex (MHC) class II alleles have been identified in humans and mice where they exert a disease-protective and immunosuppressive effect. Various modes of action have been proposed, among them differential expression of MHC class II genes in different types of antigen-presenting cells impacting on the T helper type 1 (Th1)–Th2 balance. To test this possibility, the expression of H-2 molecules from the four haplotypes H-2b, H-2d, H-2k, and H-2q was determined on bone marrow-derived macrophages (BMDMs) and splenic B cells. The I-Ab and I-Ek molecules, both well characterized as protective/suppressive, are expressed at a high level on almost all CD11b+ BMDMs for 5–8 days, after which expression slowly declines. In contrast, I-Ad, I-Ak, and I-Aq expression is lower, peaks over a shorter period, and declines more rapidly. No differential expression could be detected on B cells. In addition, the differential MHC class II expression found on macrophages skews the cytokine response of T cells as shown by an in vitro restimulation assay with BMDMs as antigen-presenting cells. The results indicate that macrophages of the protective/suppressive haplotypes express MHC class II molecules at a high level and exert Th1 bias, whereas low-level expression favors a Th2 response. We suggest that the extent of expression of the class II gene gates the back signal from T cells and in this way controls the activity of macrophages. This effect mediated by polymorphic nonexon segments of MHC class II genes may play a role in determining disease susceptibility in humans and mice.
After the recognition of HLA DR2 as a haplotype negatively associated with type I diabetis and, therefore, protective against the disease (1), a number of protective major histocompatibility complex (MHC) class II genes have been identified in humans (2) and mice. In the mouse, I-E alleles have often been found to suppress antibody responses and are known to exert an ameliorating effect in collagen-induced arthritis (CIA), a disease that has an obligatory initial T helper type 2 (Th2) phase (3–5). Recently, the I-Ab allele has been found to be suppressive in CIA (5) and several antibody responses (6) while a suppressive effect of the H-2b haplotype on IgG responses has been noted (7, 8) and may be part of the same phenomenon. In contrast, the I-Ad and I-Ak alleles are neutral, i.e., have not been found to exert a suppressive effect on antibody responses, whereas I-Aq is a positive response gene in CIA and has not otherwise been tested for suppressive activity. All of these effects are dominant, in that the presence of a single copy of the gene is sufficient to obtain the suppressive/protective effect (4, 9). They represent no more than a bias, because each of these genes can also serve as a positive response gene for other antigens.
Differential expression of protective MHC class II molecules in the various antigen-presenting cells (APCs) is one hypothesis that has been proposed to explain the protective effect (2, 5, 10, 11), although other possibilities remain open (3, 12). The findings leading to the present study are as follows. An A → G substitution in the X box of the I-Ab gene promoter (compared with I-Ad, I-Ak, and I-Aq) is responsible for heightened signaling in a macrophage cell line that is reversible by site-specific mutagenesis (13). Early interleukin (IL) 4 transcription is strongly down-regulated in the presence of a single I-Ab gene (9), and anti-IL-4 mAb given early in the response mimics the protective/suppressive effect of the gene (4). Thus, these findings suggest that the presence of an I-Ab gene results in the release of a cytokine counter to IL-4, presumably IL-12. Meanwhile others have shown that ligation of class II molecules on macrophages elicits prompt release of IL-12, mainly via facilitated ligation of CD40 (14); the same effect can be obtained with monocytes (15) and dendritic cells (16, 17), although there the IL-12 release may occur too late to account for the early suppression of IL-4 production. It therefore seemed likely that the level of expression of an MHC class II molecule might gate this back signal from a T cell to its APC so that heightened or more extensive expression would increase the IL-12 signal and thus exert a protective/suppressive effect via Th1 bias (18). To test this hypothesis, the expression of class II molecules from the four haplotypes H-2b, H-2d, H-2k, and H-2q was measured on fresh splenic macrophages, on activated macrophages represented by bone marrow-derived macrophages (BMDMs), on fresh splenic B cells, and on lipopolysaccharide (LPS)-activated splenic B cells. The latter cell type, known to show relatively high expression (19) and not expected to release an IL-4 counter cytokine (20), served as a control. In addition, the cytokine responses of T cells restricted by protective, neutral, or disease-associated haplotypes were investigated. The data presented herein suggest that the differential MHC class II expression observed on BMDMs causes immune deviation among the responding T cells.
MATERIALS AND METHODS
Mice.
The strains used for measuring the time course of MHC II expression on BMDMs were B10.A(5R) (I-Ab), B10.D2/n (I-Ad), BALB/c (I-Ad), BDF1 of C57BL/6 × BALB/c (I-Abxd), B10.BR (I-Ak, I-Ek) CBA/J (I-Ak, I-Ek), DBA/1 (I-Aq), and DBA/1 × B10.Q (I-Aq). The strains used to analyze the anti-MHC II-antibody binding capacity of splenic B cells and macrophages were congenic B10.A(5R) (I-Ab), B10.D2/n (I-Ad), B10.A (I-Ak, I-Ek), and B10.Q (I-Aq). Mice were used at an age of 10–14 weeks.
For the measurement of T cell cytokine responses, the following mouse strains were used, BALB/c × BALB/b (I-Abxd), B10.A(5R) × B10.D2/n (I-Abxd), B10.A(5R) × B10.Q (I-Abxq), and B10.D2/n × B10.Q (I-Adxq).
Collection and Cultivation of Macrophages and B Cells.
Bone marrow cells from femurs were cultured (2 × 10⁵ cells per ml, 37°C, 5% CO2/95% air), in complete RPMI 1640 medium containing 10% fetal calf serum, 2 mM l-glutamine, penicillin (100 units/ml), streptomycin (100 μg/ml), 5 × 10⁻⁵ M 2-mercaptoethanol, and 30% (vol/vol) L-929 cell-conditioned medium, to provide macrophage growth factor (21). To eliminate contaminating fibroblasts, nonadherent bone marrow cells were transferred after 24 h to nontissue culture Petri dishes and grown in L929 cell-conditioned complete RPMI medium for up to 25 days. Adherent BMDMs were lifted by incubation in PBS containing 0.2% glucose (20 min, 37°C, 5% CO2/95% air) (22). Single cell suspensions of spleens were depleted of erythrocytes by hypotonic lysis and were then used as a source for freshly isolated macrophages and B cells. Activated B cells were obtained culturing the single cell suspensions for 2 days in complete RPMI 1640 medium (37°C, 5% CO2/95% air) containing LPS (4.5 μg/ml).
mAbs and Flow Cytometry (FACS).
Culture supernatants from the hybridomas 3TP, HB15, HB6, and TIB 92 producing mAb recognizing I-Ab, I-Ak and I-Ek, respectively, were purified on protein G-Sepharose (Pharmacia) and biotinylated by using sulfo-NHS-biotin (Pierce, where NHS is N-hydroxysuccinimide). Biotinylated mAb to I-Ad (clone 39–10−8) and I-Aq (clone KH116) and fluorescein isothiocyanate (FITC)-labeled rat anti-mouse CD11b (Mac-1) mAbs were purchased (PharMingen). FITC-labeled RA3 2C2 mAb recognizing murine B220 was a gift from J. Marvel (Ecole Normale Supérieur, Lyon, France). For intracellular cytokine staining, phycoerythrin-conjugated anti-mouse IL-4 (clone 11B11) and FITC-conjugated anti-mouse interferon γ (IFN-γ; clones XMG1.2 and AN18.17.24) antibodies were used (PharMingen) (23). FACS acquisition/analysis was performed by FACScan with cellquest software (Becton Dickinson).
Analysis of the Anti-MHC Class II Antibody Binding Capacity of APCs.
To measure the antibody binding capacity of the various APCs, biotinylated mouse IgG antibodies recognizing the different class II molecules were used in conjunction with Quantum Simply Cellular beads (Sigma) (24). These beads are a mixture of four uniform microbead populations that differ in their incremental capacities to bind mouse IgG. The mean fluorescence values of the stained bead populations were used to calibrate the mean antibody-binding capacities (ABCs). The ABC of one cell directly reflects the mean number of surface MHC class II molecules.
Analysis of the Cytokine Response of T Cells Restricted by Different MHC Class II Molecules.
Mice were immunized s.c. at the tail base with 250 μg of keyhole limpet hemocyanin (KLH) or chicken Ig (cIg) in Freund’s complete adjuvant (25). On day 7, the draining lymph nodes were isolated and endogenous APCs were depleted by magnetic cell sorting (MACS) using biotinylated anti-MHC class II antibodies and streptavidin-conjugated microbeads (Miltenyi Biotec, Sunnyvale, CA). The T cells were then restimulated in vitro, using KLH or cIg (250 μg/ml) plus 7-day-old BMDMs of either of the parental haplotypes as APCs. Intracellular cytokines were detected between 15 and 19 h later, with brefeldin A being added (10 μg/ml) to the cultures for the last 3 h (23). In detail, the cytokine production of the T cells was determined by triple stainings with three different colors and antibodies recognizing CD69, intracellular IFN-γ, and IL-4. The anti-cytokine-specific staining was blocked by incubating the cells with unlabeled anti-IL-4 antibodies (clone 11B11) at 25 μg/ml and anti-IFN-γ antibodies (clone AN18.17.24) at 25 μg/ml for 15 min before staining with the corresponding fluorochrome-conjugated antibodies. For isotype controls, we used phycoerythrin- and FITC-labeled rat IgG1 antibodies at 5 μg/ml.
RESULTS
Macrophages Retain I-Ab and I-Ek Molecules Longer.
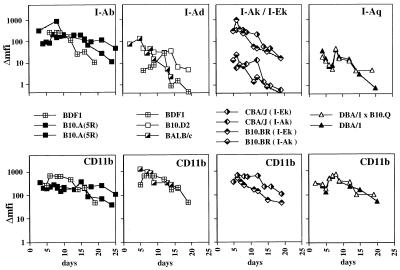
The expression of I-A molecules of the b, d, k, and q haplotypes and of I-E molecules of the k haplotype was analyzed on BMDMs cultured for up to 25 days. Fig. 1 shows the time courses of CD11b and H-2 expression as judged by mean fluorescence intensity (mfi). For all the BMDM cultures analyzed, CD11b expression showed similar kinetics in that it reached maximum expression around day 7 and then slowly declined (Fig. 1 Lower). However, when comparing MHC class II expression, there were major differences (Fig. 1 Upper). Expression of the protective/suppressive I-Ab and I-Ek molecules on macrophages showed the slowest decline. Even after 19, 20, 24, or 25 days, respectively, there was still considerable I-Ab and also I-Ek expression as judged by mfi (Fig. 1 Upper). In contrast, for I-Ad, I-Ak, and I-Aq, the mfi declines to near zero by day 20 (Fig. 1 Upperl). In total, 10 bone marrow cultures were analyzed, 3 for the haplotype H-2d, 2 cultures for each of the haplotypes H-2b, H-2k, and H-2q, and 1 culture for the F1 haplotype H-2bxd. For a closer comparison, BDF1 mice were included, which express I-Ab and I-Ad on the same cells.
Figure 1.
Time courses of MHC class II expression on BMDMs of different haplotypes. Double stainings were performed with mAbs recognizing the various MHC class II molecules and CD11b. The time course of CD11b expression (Lower) and the corresponding MHC class II expression on CD11b+ cells (Upper) are shown. The Δmfi was calculated by subtracting the mfi of unstained cells from the mfi of stained cells. For each BMDM cultures, the bone marrow of 8–10 mice was pooled. The symbols representing BMDMs from the various mouse strains are indicated.
Differential MHC Class II Expression on BMDMs but Not on B Cells.
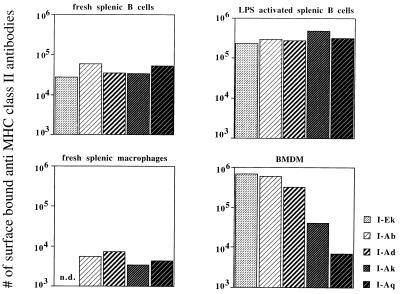
To quantify the differences in mfi observed for BMDMs stained with anti-MHC class II antibodies, the ABC was measured on day 7 at the height of MHC class II expression (see Fig. 1). For comparison, fresh splenic macrophages and fresh, as well as LPS-activated, splenic B cells were also analyzed. Among LPS-activated and fresh splenic B cells, the various haplotypes showed no more than a 2-fold difference in the estimated numbers of surface MHC II molecules (Fig. 2). Upon activation by LPS, the number of surface MHC class II molecules increases 10-fold on splenic B cells. In detail, numbers of molecules on the surface of fresh splenic B cells were in the range of 28,000 (I-Ek) to 61,000 (I-Ab). Among LPS-activated B cells, the numbers ranged between 280,000 (I-Ad) and 480,000 (I-Ak). Freshly isolated splenic macrophages also showed limited variation, from 3,300 (I-Ak) to 7,300 (I-Ad) molecules. In contrast, activated BMDMs showed larger differences, from 6,900 (I-Aq) to 607,000 (I-Ab) and 677,000 (I-Ek), i.e., differences of 100-fold (see Fig. 2). Addition of LPS or phorbol 12-myristate 13-acetate at peak expression did not further increase MHC class II expression on these BMDMs (data not shown).
Figure 2.
Differential MHC class II expression on BMDMs but not on B cells. The anti-MHC class II ABC of fresh splenic B cells, splenic B cells that had been LPS-activated for 2 days, fresh splenic macrophages, and 7-day-old BMDMs grown on plastic dishes was analyzed. The ABC was then used to calculate the number of surface-bound anti-MHC class II antibodies. For each of the experimental groups, spleen cells and bone marrow cells from three to five mice were pooled. The symbols representing the different haplotypes are given.
The Level of MHC Class II Expression on BMDMs Influences the Cytokine Response of Interacting T Cells.
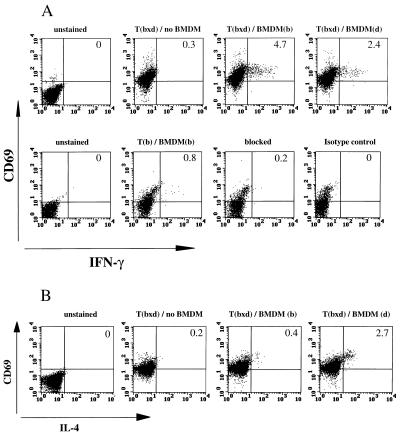
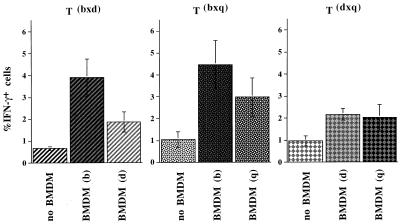
To investigate whether the differential MHC class II expression found on BMDMs had functional consequences, the cytokine responses of T cells restricted by the different haplotypes were investigated. F1 mice expressing the MHC II haplotypes bxd and bxq on the B10 background were used to analyze the impact of the highly expressed I-Ab molecule in comparison to I-Ad and I-Aq. The dxq haplotype was included to provide two different weakly expressed MHC class II molecules on the same cell. Draining lymph node cells were isolated 7 days after immunization with KLH. After the depletion of endogenous APCs, the T cells were restimulated in vitro in the presence of antigen and BMDMs of either parental MHC II haplotypes, and intracellular IFN-γ was subsequently measured by FACS. The results of one representative staining and the specificity of the anti-IFN-γ staining as shown by blocking with unlabeled antibodies and staining with an isotype control are shown in Fig. 3A. Fig. 4 summarizes the results of three experiments: when restimulated in the presence of antigen and BMDMs expressing I-Ab, 3.9% of the bxd T cells and 4.5% of the bxq T cells became IFN-γ+. In contrast, when restimulated in the presence of BMDMs expressing I-Ador I-Aq, the bxd and bxq T cells yielded only 1.9 and 3.0% IFN-γ+ cells, respectively. Without addition of antigen and APCs, the same T cells yielded only up to 1.1% IFN-γ+ cells (see Figs. 3A and 4). With dxq cells, where both of the I-A molecules are expressed at low levels, BMDM of d or q haplotype induced no more than 2.2 and 2.0%, respectively, of the dxq T cells to produce IFN-γ. Immunization and restimulation with cIg resulted in similar percentages of IFN-γ+ T cells (data not shown).
Figure 3.
FACS analysis of F1 T cells stained for intracellular cytokines. (A Upper) Staining for CD69 and IFN-γ of Tbxd cells of the B10 background with the anti-IFN-γ antibody (clone XMG1.2). The specificity of the staining is demonstrated (Lower). Second from left shows a staining with the anti-IFN-γ antibody (clone AN18.17.24), next is blocking with unlabeled AN18.17.24, and subsequent staining with FITC-labeled AN18.17.24. (Right) Corresponding isotype control. The B10 mice from which the T cells were derived had been immunized with KLH. (B) Staining for CD69 and IL-4 of Tbxd cells of the BALB background. The BALB mice from which the T cells were derived had been immunized with cIg. For FACS analysis, the T cells were restimulated in vitro with antigen and BMDMs of either parental haplotype. For control, neither antigen nor BMDMs were added. The percentages of double-positive cells are given in the upper right quadrants.
Figure 4.
IFN-γ response of B10 mice immunized with KLH. Lymph node cells of the indicated MHC class II haplotypes were isolated on day 7 after immunization, depleted of endogenous APCs, and restimulated with KLH (250 μg/ml) and BMDMs of either of the parental haplotypes. Between 15 and 19 h later, the cytokine production of the T cells was determined by triple staining using antibodies recognizing CD69, cytoplasmic IFN-γ, and IL-4. Data shown are percentages of IFN-γ+ cells (mean ± SEM; three to five mice per group) and are representative of three experiments. The P value for the differences in the amounts of cytokine producing cells is 0.0417 and was calculated by pooling the data from Figs. 4 and 5.
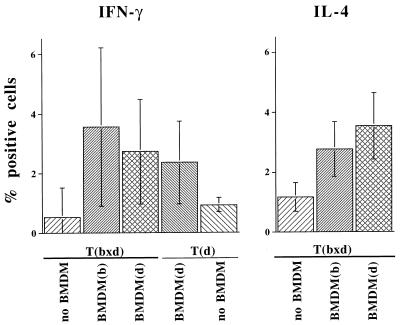
No significant percentages of IL-4-producing cells were detected in mice of the B10 background, as expected (26). Accordingly, this was analyzed in cells from BALB/c × BALB/b mice immunized with KLH or cIg. Again, draining lymph node cells were isolated, depleted of endogenous APCs, and restimulated with antigen in the presence of BMDMs expressing either I-Ad or I-Ab. The results of an individual FACS staining of IL-4+ T cells from mice immunized with cIg are shown in Fig. 3B. In Fig. 5 the results of three experiments of mice immunized with KLH are summarized with the percentage of lymphocytes positive for intracellular IFN-γ and IL-4 shown. Among the T cells that did not receive any stimulation by antigen and APCs, only 0.5 and 0.9% were IFN-γ+, respectively. As with B10-background mice, T cells of the bxd haplotype gave rise to a higher percentage of IFN-γ+ cells when restimulated in the presence of BMDMs expressing I-Ab compared with BMDMs expressing I-Ad. In contrast, the percentage of IL-4+ cells was higher among I-Ad- than among I-Ab-restricted T cells (see Fig. 5).
Figure 5.
Cytokine response of BALB mice immunized with KLH. Cytokine responses of lymph node cells were determined as described in Fig. 3. Data are percentages of IFN-γ+ and IL-4+ cells (mean ± SEM; three to five mice per group) and are representative of three experiments (for P values, see legend of Fig. 4).
DISCUSSION
The major findings herein are that on BMDMs the MHC class II molecules of various haplotypes are expressed differentially and that this is associated with the cytokine response expected of T cells in a restimulation assay. In the time course of MHC class II expression on cultured BMDMs, the protective/antibody-suppressive I-Ab and I-Ek molecules are expressed at a high level that slowly declines over a period of up to 25 days. In contrast, I-Ad, I-Ak, and I-Aq molecules are expressed at a much lower level and the expression peaks for only about 1 day and then rapidly declines (see Fig. 1). The higher frequency and longer lasting expression found for these genes in macrophages is in agreement with the results obtained with promoter-reporter constructs in a macrophage cell line as mentioned above (13). When comparing the MHC class II expression at peak level, there are about 100-fold more I-Ab and I-Ek molecules on the surface of BMDMs than there are I-Aq molecules (see Fig. 2). In contrast, LPS-stimulated B cells from the various mouse strains are strongly positive for I-Ab, I-Ad I-Ak, I-Ek, and H-2q but show little differential expression. The number of surface MHC class II molecules on stimulated B cells lies in the same range as on BMDMs, although their smaller surface means that the density of these molecules is at least one order of magnitude higher than on activated BMDMs. Dendritic cells were not included in this study because a dendritic cell line transfected with reporter constructs yielded little evidence of differential expression (13).
The impact of differential H-2 expression on macrophages on the Th1–Th2 balance was investigated in an in vitro assay where the highly expressed I-Ab molecule exerts a Th1 biassing effect. This bias is predicted by the hypothesis that a facilitated interaction between T cells and macrophages would increase IL-12 production (18). Thus a pathway can be traced from a defined single-base promoter polymorphism, via extended expression of the class II gene, through a gating function of this expression, to the release of a counter-IL-4 cytokine, and so to a protective/suppressive function.
The data obtained from BALB mice (Fig. 5) are less clear than those obtained from B.10 mice (Fig. 4) and disclose the variation to be expected. However, the results support the overall prediction that highly expressed alleles show a bias toward IFN-γ and away from IL-4.
Whether the observed bias in cytokine production is introduced during the short immunization period or alternatively reflects a form of life-long immune deviation (27) is unclear. In favor of the latter possibility is the effect on bystander T cells: I-Aq-restricted T cells yield a higher percentage of IFN-γ+ cells when primed in the presence of I-Ab-restricted T cells than when primed in the presence of I-Ad-restricted T cells (see Fig. 4). Extrapolating, this form of cross-talk might help explain the interaction of different susceptible, permissive, and protective HLA class II alleles observed in early-onset pauciarticular juvenile chronic arthritis (28).
The Th1 bias mediated by the I-Ab allele was observed not only for both of the BALB and B10 mice but also for the two unrelated antigens. This argues against determinant selection (and its T cell receptor repertoire-biassing effect) as an explanation of the observations. It suggests that differential expression may play a role in the control of disease susceptibility by MHC class II genes. Differential expression is also in line with the distribution of polymorphism across MHC class II genes, which is high not only in the peptide-binding domains but also in the promoter region (promoter polymorphism is less evident in MHC class I genes) (2, 29). Significantly, this polymorphism in the mouse is highest in the region of the X and Y boxes, where transcription factors bind; it has been suggested that heterozygosity in this region may confer increased fitness through immunological flexibility (29). The extent to which this mechanism might operate in humans is uncertain; for instance, greater variation has been observed in class II expression on human B cells (30).
It might seem surprising that IL-4 should exert a disease-promoting effect in CIA, which has mainly been characterized as a Th1 disease (31, 32, †) like its human counterpart rheumatoid arthritis (33), and equally surprising that other animal models of autoimmune disease including type I diabetis, also characterized as a Th1 disease (34), should show the same pattern of protection mediated by I-E. Evidently IL-4 has this effect only at the time of disease initiation in these animal models, as is known for CIA (4). The effect operates only at the time when IL-12 itself has a protective effect (31). Besides CIA, another autoimmunity also inducible with adjuvant plus organ-specific antigen, experimental allergic uveitis, can be inhibited by IL-12 administered only during the early induction phase (35). This paradoxical effect may reflect the poorly understood anti-proliferative and disease-inhibitory effects reported for INF-γ (35, 36) and perhaps also the function of IL-4 as a growth factor for Th0 and Th1 cells (37).
These data suggest that a highly expressed MHC class II molecule might exert its effect by facilitating CD40–CD40L ligation and thus enhancing IL-12 induction (18). For this to occur, it is likely that the trimolecular complex of MHC molecule, antigenic peptide, and T cell receptor must form. Recent work suggests that the MHC molecule may also bind to the T cell receptor in an effective but apparently nonspecific manner (38), possibly involving self peptides; this may deliver a survival signal to the T cell (39–41). This apparently nonspecific signaling might account for the otherwise puzzling observation that the H-2Ab molecule, although able to suppress the anti-allo-4-hydroxyphenylpyruvate dioxygenase (HPPD) response, does not bind the relevant allopeptide to a detectable extent (9).
Acknowledgments
Special thanks go to Av Mitchison for his support and encouragement throughout the progress of this work. This work was supported by the Senate for Science, Research and Cultural Affairs of the City of Berlin.
ABBREVIATIONS
- MHC
major histocompatibility complex
- Th
T helper
- BMDM
bone marrow-derived macrophage
- APC
antigen-presenting cell
- CIA
collagen-induced arthritis
- IL
interleukin
- LPS
lipopolysaccharide
- FITC
fluorescein isothiocyanate
- FACS
flow cytometry
- ABC
antibody-binding capacity
- KLH
keyhole limpet hemocyanin
- cIg
chicken Ig
- mfi
mean fluorescence intensity
Footnotes
Bessis, N., Boissier, M.-C., Caput, D., Fradelizi, D. & Fournier, C. Ninth International Congress of Immunology, July 23–29, 1995, p. 898, abstr. 5327.
References
- 1.Thomson G, Robinson W P, Kuhner M K, Joe S, MacDonald M J. Am J Hum Genet. 1988;6:799–816. [PMC free article] [PubMed] [Google Scholar]
- 2.Guardiola J, Maffei A, Lauster R, Mitchison N A, Accolla R S, Sartoris S. Tissue Antigens. 1996;48:615–625. doi: 10.1111/j.1399-0039.1996.tb02684.x. [DOI] [PubMed] [Google Scholar]
- 3.Gonzalez-Gay M A, Zanelli E, Krco C J, Nabozny G H, Hanson J. Immunogenetics. 1995;42:35–40. doi: 10.1007/BF00164985. [DOI] [PubMed] [Google Scholar]
- 4.Hesse M, Bayrak S, Mitchison A. Eur J Immunol. 1996;26:3234–3237. doi: 10.1002/eji.1830261259. [DOI] [PubMed] [Google Scholar]
- 5.Mitchison N A, Brunner M C. Immunogenetics. 1995;41:239–245. doi: 10.1007/BF00172065. [DOI] [PubMed] [Google Scholar]
- 6.Mitchison N A, Simon K. Immunogenetics. 1990;32:104–109. doi: 10.1007/BF00210447. [DOI] [PubMed] [Google Scholar]
- 7.Silver D M, McKenzie I F, Winn H J. J Exp Med. 1972;136:1063–1071. doi: 10.1084/jem.136.5.1063. [DOI] [PMC free article] [PubMed] [Google Scholar]
- 8.Rihova B, Riha I, Rossmann P, Vetvicka V. Folia Microbiol. 1985;30:295–301. doi: 10.1007/BF02923523. [DOI] [PubMed] [Google Scholar]
- 9.Brunner M, Larsen S, Sette A, Mitchison A. Eur J Immunol. 1995;25:3285–3289. doi: 10.1002/eji.1830251213. [DOI] [PubMed] [Google Scholar]
- 10.Reich E P, Sherwin R S, Kanagawa O, Janeway C A., Jr Nature (London) 1989;341:326–328. doi: 10.1038/341326a0. [DOI] [PubMed] [Google Scholar]
- 11.Beaty J S, West K A, Nepom G T. Mol Cell Biol. 1995;15:4771–4782. doi: 10.1128/mcb.15.9.4771. [DOI] [PMC free article] [PubMed] [Google Scholar]
- 12.Schmidt D, Verdaguer J, Averill N, Santamaria P. J Exp Med. 1997;186:1059–1075. doi: 10.1084/jem.186.7.1059. [DOI] [PMC free article] [PubMed] [Google Scholar]
- 13.Janitz M, Mitchison A, Reiners-Schramm L, Lauster R. Tissue Antigens. 1997;49:99–106. doi: 10.1111/j.1399-0039.1997.tb02721.x. [DOI] [PubMed] [Google Scholar]
- 14.Kato T, Hakamada R, Yamane H, Nariuchi H. J Immunol. 1996;156:3932–3938. [PubMed] [Google Scholar]
- 15.Shu U, Kiniwa M, Wu C Y, Maliszewski C, Vezzio N, Hakimi J. Eur J Immunol. 1995;25:1125–1128. doi: 10.1002/eji.1830250442. [DOI] [PubMed] [Google Scholar]
- 16.Koch F, Stanzl U, Jennewein P, Janke K, Heufler C, Kämpgen E, Romani N, Schuler G. J Exp Med. 1996;184:741–746. doi: 10.1084/jem.184.2.741. [DOI] [PMC free article] [PubMed] [Google Scholar]
- 17.Cella M, Scheidegger D, Palmer-Lehmann K, Lane P, Lanzavecchia A, Alber G. J Exp Med. 1996;184:747–752. doi: 10.1084/jem.184.2.747. [DOI] [PMC free article] [PubMed] [Google Scholar]
- 18.Müller B, Mitchison A. Philos Trans R Soc Lond Biol Sci. 1997;352:1327–1330. doi: 10.1098/rstb.1997.0117. [DOI] [PMC free article] [PubMed] [Google Scholar]
- 19.Bottomly K, Jones B, Kaye J, Jones F D. J Exp Med. 1983;158:265–279. doi: 10.1084/jem.158.2.265. [DOI] [PMC free article] [PubMed] [Google Scholar]
- 20.Guery J C, Ria F, Galbiati F, Adorini L. Eur J Immunol. 1997;27:1632–1639. doi: 10.1002/eji.1830270707. [DOI] [PubMed] [Google Scholar]
- 21.Stanley E R, Chen D M, Lin H S. Nature (London) 1978;274:168–170. doi: 10.1038/274168a0. [DOI] [PubMed] [Google Scholar]
- 22.Vollmar A M, Schulz R. J Clin Invest. 1995;95:2442–2450. doi: 10.1172/JCI117944. [DOI] [PMC free article] [PubMed] [Google Scholar]
- 23.Assenmacher M, Schmitz J, Radbruch A. Eur J Immunol. 1994;24:1097–1101. doi: 10.1002/eji.1830240513. [DOI] [PubMed] [Google Scholar]
- 24.Islam D, Lindberg A A, Christensson B. Cytometry. 1995;22:128–134. doi: 10.1002/cyto.990220208. [DOI] [PubMed] [Google Scholar]
- 25.Miesel R, Dietrich A, Ulbrich N, Kroeger H, Mitchison N A. Autoimmunity. 1994;19:153–159. doi: 10.3109/08916939408995690. [DOI] [PubMed] [Google Scholar]
- 26.Gorham J D, Güler M L, Steen R G, Mackey A J, Daly M J, Frederick K, Dietrich W F, Murphy K M. Proc Natl Acad Sci USA. 1996;93:12467–12472. doi: 10.1073/pnas.93.22.12467. [DOI] [PMC free article] [PubMed] [Google Scholar]
- 27.Rocken M, Racke M, Shevach E M. Immunol Today. 1996;17:225–231. doi: 10.1016/0167-5699(96)80556-1. [DOI] [PubMed] [Google Scholar]
- 28.Paul C, Schoenwald U, Truckenbrodt H, Bettinotti M P, Brunnler G, Keller E, Nevinny Stickel C, Yao Z, Albert E D. Immunogenetics. 1993;37:442–428. doi: 10.1007/BF00222468. [DOI] [PubMed] [Google Scholar]
- 29.Cowell L G, Kepler T B, Janitz M, Lauster R, Mitchison N A. Genome Res. 1998;8:124–134. doi: 10.1101/gr.8.2.124. [DOI] [PubMed] [Google Scholar]
- 30.Vincent R, Louis P, Gongora C, Papa I, Clot J, Eliaou J F. J Immunol. 1996;156:603–610. [PubMed] [Google Scholar]
- 31.Germann T, Szeliga J, Hess H, Storkel S, Podlaski F J, Gately M K, Schmitt E, Rüde E. Proc Natl Acad Sci USA. 1995;92:4823–4827. doi: 10.1073/pnas.92.11.4823. [DOI] [PMC free article] [PubMed] [Google Scholar]
- 32.Mauri C, Williams R, Walmsley M, Feldman M. Eur J Immunol. 1996;26:1511–1518. doi: 10.1002/eji.1830260716. [DOI] [PubMed] [Google Scholar]
- 33.Müller, B., Gimsa, U., Mitchison, N. A., Radbruch, A., Sieper, J. & Yin, Z. Seminars in Immunopathology, in press. [DOI] [PubMed]
- 34.Liblau R S, Singer S M, McDevitt H O. Immunol Today. 1995;16:34–38. doi: 10.1016/0167-5699(95)80068-9. [DOI] [PubMed] [Google Scholar]
- 35.Caspi, R. R., Silver, P. B., Agarwal, R., Rizzo, L. V., Chan, C. C. & Tarrant, T. K. (1997) J. Allergy Clin. Immunol. 99, abstract 1503.
- 36.Krakowski M, Owens T. Eur J Immunol. 1996;26:1641–1646. doi: 10.1002/eji.1830260735. [DOI] [PubMed] [Google Scholar]
- 37.Mueller D L, Chiodetti L, Bacon P A, Schwartz R H. J Immunol. 1991;147:4118–4125. [PubMed] [Google Scholar]
- 38.Poudrier J, Owens T. Eur J Immunol. 1994;24:2993–2999. doi: 10.1002/eji.1830241211. [DOI] [PubMed] [Google Scholar]
- 39.Kirberg J, Berns A, von Boehmer H. J Exp Med. 1997;186:1269–1275. doi: 10.1084/jem.186.8.1269. [DOI] [PMC free article] [PubMed] [Google Scholar]
- 40.Takeda S, Rodewald H R, Arakawa H, Bluethmann H, Shimizu T. Immunity. 1996;5:217–228. doi: 10.1016/s1074-7613(00)80317-9. [DOI] [PubMed] [Google Scholar]
- 41.Rooke R, Waltzinger C, Benoist C, Mathis D. Immunity. 1997;7:123–134. doi: 10.1016/s1074-7613(00)80515-4. [DOI] [PubMed] [Google Scholar]


