

Abstract
Exocytotic events and changes of cell volume in mucous cells from guinea-pig antrum were examined by video-enhanced optical microscopy.
Acetylcholine (ACh) evoked exocytotic events following cell shrinkage, the frequency and extent of which depended on the ACh concentration. ACh actions were mimicked by ionomycin and thapsigargin, and inhibited by Ca2+-free solution and Ca2+ channel blockers (Ni2+, Cd2+ and nifedipine). Application of 100 μM W-7, a calmodulin inhibitor, also inhibited the ACh-induced exocytotic events. These results indicate that ACh actions are mediated by intracellular Ca2+ concentration ([Ca2+]i) in antral mucous cells.
The effects of ion channel blockers on exocytotic events and cell shrinkage evoked by ACh were examined. Inhibition of KCl release (quinine, Ba2+, NPPB or KCl solution) suppressed both the exocytotic events and cell shrinkage evoked by ACh.
Bumetanide (inhibition of NaCl entry) or Cl−-free solution (increasing Cl− release and inhibition of NaCl entry) evoked exocytotic events following cell shrinkage in unstimulated antral mucous cells and caused further cell shrinkage and increases in the frequency of exocytotic events in ACh-stimulated cells. However, Cl−-free solution did not evoke exocytotic events in unstimulated cells in the absence of extracellular Ca2+, although cell shrinkage occurred.
To examine the effects of cell volume on ACh-evoked exocytosis, the cell volume was altered by increasing the extracellular K+ concentration. The results showed that cell shrinkage increases the frequency of ACh-evoked exocytotic events and cell swelling decreases them.
Osmotic shrinkage or swelling caused the frequency of ACh-evoked exocytotic events to increase. This suggests that the effects of cell volume on ACh-evoked exocytosis under anisosmotic conditions may not be the same as those under isosmotic conditions.
In antral mucous cells, Ca2+-regulated exocytosis is modulated by cell shrinkage under isosmotic conditions.
The gastric mucosa is covered with a viscoelastic and lubricant mucous layer. The chief determinants of the physiological role of the mucous layer are mucins, which are high molecular weight glycoproteins. Gastric mucins are produced in and secreted from specialized differentiated mucous cells located in the epithelium lining the gastric pits, and play an important role in the protection of gastric mucosa from acid-peptic injury.
The production and release of mucins are regulated by neurotransmitters, hormones and biologically active peptides. Mucins are synthesized in the Golgi apparatus, and stored in intracellular granules which are transported to the luminal surface of the cell (Forstner & Forstner, 1994). These mucin granules finally discharge their contents through holes in the plasma membrane. This process is generally known as exocytosis. The first event in exocytosis is the fusion of a granule with the plasma membrane at the fusion pore, and is mediated by the exocytosis-related proteins, which are activated by intracellular Ca2+, protein kinase A (PKA) and protein kinase C (PKC) (Forstner & Forstner, 1994). Intracellular Ca2+, in particular, is widely accepted as playing a key role in exocytosis in epithelial cells, endocrine cells and nerve endings. In the gastric mucosa, elevation of intracellular Ca2+ concentration, [Ca2+]i, also increases mucin release (Seidler & Sewing, 1989), and cholinergic stimulation is well known to increase [Ca2+]i. The present experiments were designed to investigate the effects of acetylcholine (ACh) on the frequency of exocytotic events.
Video-enhanced optical microscopy (Allen, 1985) has enabled us to observe exocytosis non-invasively and continuously with high time resolution, and also morphological changes in living cells, such as changes in cell volume and structure (Segawa et al. 1991; Nakahari & Imai, 1998). Observation of exocytosis in living cells using video-enhanced optical microscopy has previously been reported in epithelial cells (Terakawa & Suzuki, 1991; Segawa et al. 1991). In this study, we attempted to measure the frequency of exocytotic events in antral mucous cells during stimulation with ACh. To our surprise, cell shrinkage also occurred in the antral mucous cells during ACh stimulation. Agonist-induced cell shrinkage has been reported in salivary acinar cells (Foskett & Melvin, 1989; Nakahari et al. 1990), fetal lung cells (Nakahari & Marunaka, 1996, 1997) and sweat glands (Takemura et al. 1991; Suzuki et al. 1991). Furthermore, cell volume changes have been suggested as regulating some cell functions (Tohda et al. 1994; Robertson & Foskett, 1994; Nakahari & Marunaka, 1995a, b; Marunaka et al. 1995; McCarthy & Cotter, 1997; Schlatter et al. 1997; Szaski et al. 1997; Shrode et al. 1997). The objective of this study was to determine whether the exocytotic events in antral mucous cells are also regulated by cell volume changes.
METHODS
Solutions and chemicals
The control solution contained (mM): NaCl, 121; KCl, 4.5; MgCl2, 1; CaCl2, 1.5; NaHCO3, 25; NaHepes, 5; HHepes, 5; and glucose, 5 (pH 7.4). The KCl solution contained (mM): KCl, 125.5; MgCl2, 1; CaCl2, 1.5; KHCO3, 25; KHepes, 5; HHepes, 5; and glucose, 5 (pH 7.4). To increase the concentration of K+ in the test solution, KCl solution was added to the control solution. The Cl−-free solution contained (mM): sodium gluconate, 121; potassium gluconate, 4.5; MgCl2, 1; CaCl2, 1.5; NaHCO3, 25; NaHepes, 5; HHepes, 5; and glucose, 5 (pH 7.4). To change the osmolarity of the test solution, the concentration of NaCl was either increased or decreased by 50 mM in the control solution. For Ca2+-free solution, the control solution was prepared without CaCl2 and EGTA (1 mM) was added. All the solutions were gassed with 95 % O2 and 5 % CO2 at 37°C. Acetylcholine chloride (ACh) was obtained from Daiichi Pharmaceutical Drugs (Osaka, Japan), ionomycin from Calbiochem-Novabiochem (La Jolla, CA, USA), thapsigargin, NiCl2, CdCl2, nifedipine, BaCl2 and quinine from Wako Pure Chemical Industries Ltd (Osaka, Japan), N-(6-aminohexyl)S-chloro-1-naphthalene sulfonamide hydrochloride (W-7) and bumetanide from Sigma Chemical Co., and 5-nitro-2-(3-phenylpropylamino)-benzoate (NPPB) and benzamil from Research Biochemicals International. Ionomycin, thapsigargin, W-7 and NPPB were dissolved in DMSO. The concentrations of ionomycin and thapsigargin in the stock solution were 10 mM, that of W-7 was 100 mM, and those of NPPB and benzamil were 200 mM. Bumetanide was dissolved in ethanol to give a 20 mM stock solution. The reagents were prepared to their final concentrations just before experiments were carried out.
Cell preparations
Hartley strain male guinea-pigs weighing approximately 250 g were purchased from Shimizu (Kyoto, Japan), and fed a standard diet and water. Guinea-pigs were anaesthetized by inhalation of ether and then killed by cervical dislocation. The experiments were approved by the Animal Research Committee of Osaka Medical College, and animal care was according to the guidelines of this committee.
The whole stomach was excised, opened along the greater curvature, and rinsed free of gastric contents 5 times with saline (4°C). The antrum, distinguished from the fundus by its paler mucosal colour, was excised, and the mucosal layer stripped from the muscle layer using glass slides in saline at room temperature (22-25°C). The stripped antral mucosa and submucosa were minced using fine forceps. Collagenase, obtained from Wako Pure Chemical Industries (Osaka, Japan), was dissolved to a concentration of 0.5 mg ml−1 in the control solution containing 2 % bovine serum albumin (BSA, Wako Pure Chemical Industries) (collagenase solution), and the minced mucosa was suspended in this solution. The suspension was incubated for 10 min in a shaking water bath at 37°C, and then filtered through a nylon mesh with a pore size of 150 μm2 to remove undigested tissue. After filtration, the suspension was centrifuged at 300 r.p.m. for 2 min and washed in control solution containing 2 % BSA; this procedure was repeated 3 times. The digested tissue was resuspended in control solution (4°C) containing 2 % BSA. The suspension was stored at 4°C and used for experiments within 3 h.
Observation of exocytosis and cell volume measurement
Isolated antral mucous cells were mounted on a coverslip, which had been precoated with neutralized Cell-Tak (Becton Dickinson Labware, Bedford, MA, USA) to enable firm attachment of the cells to it. The coverslip with cells was set in a perfusion chamber (Takemura et al. 1991) which was mounted on the stage of a differential interference contrast (DIC) microscope (BX50Wi, Olympus, Tokyo, Japan) connected to a video-enhanced contrast (VEC) system (ARGUS-10, Hamamatsu Photonics, Hamamatsu, Japan), and images were recorded continuously using a video recorder. The volume of the perfusion chamber was approximately 20 μl, and the rate of perfusion was 200 μl min−1. Experiments were performed at 37°C. The focus of the microscope was frequently adjusted to observe the cells in the same focal plane.
To estimate the cell volume, the area of a cell was measured by tracing its outline on the video images every 10-30 s. The average value from five images measured in the first 2 min was used as the control (A0). The relative volume of the mucous cell was estimated as V/V0 = (A/A0)1.5, where V is the volume, A is the area, and the subscript 0 indicates the control value. Thus, the values of relative cell volume (V/V0) were normalized to the control value. Volume estimation of mucous cells was based on the assumption that the volume changed to the same extent in all three dimensions. This method of cell volume measurement has been described in detail previously (Foskett & Melvin, 1989; Suzuki et al. 1991).
Exocytosis was detected by the rapid changes in light intensity from mucous granules in the DIC images (Terakawa & Suzuki, 1991; Segawa et al. 1991; Nakahari & Imai, 1998). This could be explained by the granule contents being rapidly released and replaced by the extracellular medium with a different refractive index. We excluded the possibility that granule movement caused the changes in intensity, because rapid granule movements were not detected in all directions. To quantify exocytotic events, the rapid changes in light intensity were counted in three to four cells every 30 s, and the exocytotic events were normalized to the cell number (exocytotic events cell−1 30 s−1). The frequency of exocytotic events and the values of V/V0 from four to six experiments were expressed as means ±s.e.m.
[Ca2+]i measurements
The isolated cells were loaded with fura-2 AM (2.5 μM; Dojindo, Kumamato, Japan) for 25 min at room temperature and washed with control solution. The cells were mounted on a coverslip precoated with neutralized Cell-Tak. The coverslip with cells was set in a perfusion chamber which was mounted on the stage of an inverted microscope (IX70, Olympus) connected to an image analysis system (ARGUS/HiSCA, Hamamatsu Photonics). The fura-2 fluorescence ratios (340 nm/380 nm) were calculated and stored in the image analysis system. In the present study, the cell-free calibration method was used for calculating the [Ca2+]i.
The statistical significance of the differences between the mean values was assessed using Student's paired or unpaired t test, as appropriate. Differences were considered significant at P < 0.05.
RESULTS
Video images
Figure 1 shows typical mucous cells from a guinea-pig antral gland. The columnar structures were still maintained in the isolated antral glands. Two types of cell could be distinguished in the isolated antral glands: antral gland cells, which have no granules and are located at the bottom of the glandular column, and antral mucous cells, which are located in the middle and at the top of the column (Fig. 1). Mucous cells, which are densely packed with mucin granules, are distributed along the glandular column. Figure 1A shows unstimulated mucous cells. The outlines of the cells and intracellular granules are clearly visible on the DIC video image. The luminal space in the glandular column is also visible (Fig. 1A and F). Figure 1B shows a DIC image of the cells 20 s after the start of ACh (1 μM) stimulation. At this time, swelling of the lumen, decrease of column width and shrinkage of cell volume were detected in the DIC image, but no exocytotic events were seen. Swelling of the lumen indicates activation of fluid secretion, as previously reported in salivary acini (Nakahari & Imai, 1998), and decrease of column width, in spite of the swelling of the lumen, indicates cell shrinkage. Figure 1C shows a DIC image of the cells 1 min after the start of ACh (1 μM) stimulation. Exocytotic events began from 20 s after the start of ACh stimulation and their frequency increased gradually until 1 min after the start of stimulation. The extent of swelling in the lumen increased, cells lost the granules located at their luminal surface and cell volume decreased, due to the release of granules, with the increase in frequency of exocytotic events. Figure 1D and E shows the video images at 28 and 29 s, respectively, after the start of ACh stimulation. The arrows show the granules located at the luminal surface of mucous cells (Fig. 1A). The light intensities of the granules changed suddenly and Ω-shaped pores were detected on the luminal surface of the cells (arrows in Fig. 1A). Figure 1F-H shows the outlines of Fig. 1A-C. The dotted lines in Fig. 1A and H show the outlines of antral mucous cells prior to ACh stimulation (Fig. 1A and F). Figure 1G clearly shows the shrinkage of the cells and the swelling of the lumen. Figure 1H shows that the extent of swelling in the lumen increased and the cell volume was reduced on the luminal side due to the release of the granules.
Figure 1. Video images of antral mucous cells recorded with a DIC-VEC system.
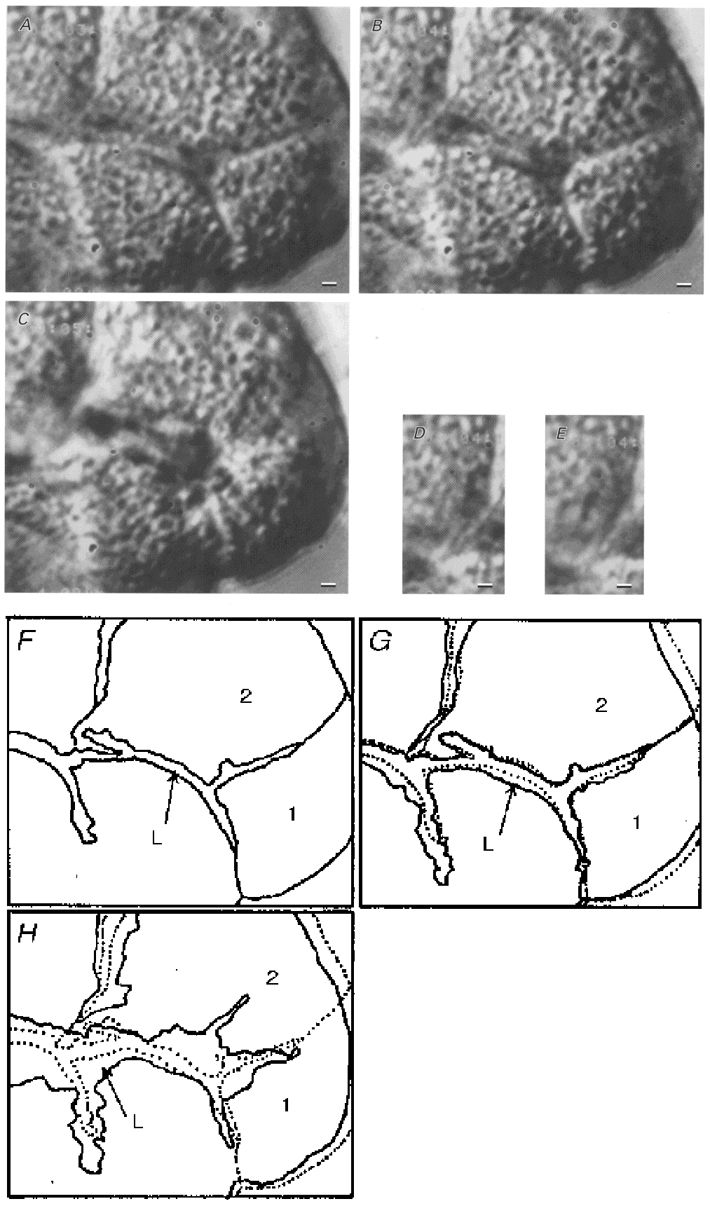
A, DIC image of unstimulated antral mucous cells densely packed with mucin granules. The lumen can be distinguished in the glandular column. B, DIC image of antral mucous cells 20 s after the start of 1 μM ACh stimulation. Cell shrinkage and swelling of the lumen are visible, but no exocytotic events were observed. C, DIC image of antral mucous cells 1 min after the start of 1 μM ACh stimulation. Exocytotic events were observed, with cells losing granules located near the luminal surface and volume at the luminal side. Swelling of the lumen increased. D and E, DIC images of mucin granules before and after exocytosis (28 and 29 s after the start of 1 μM ACh stimulation), respectively. The arrows in D show granules located near the luminal surface. After 1 s, the light intensities of the granules changed and Ω-shaped holes were observed in the luminal surface (arrows in E). F-H, outlines of the video images shown in A-C. ‘L’ is the lumen; ‘1′ and ‘2′ indicate mucous cells. The dotted lines in G and H give the outlines of the unstimulated mucous cells shown in A and F. G shows the initial cell shrinkage of antral mucous cells. H also shows the delayed cell shrinkage, especially at the luminal side, caused by granule release (exocytotic events). Scale bars represent 2 μm.
The experiments were also performed using three to four cell clumps. ACh stimulation (0.01 μM) caused a decrease in the area of the cells in the focal plane. When the focus of the microscope was adjusted from the top to the bottom of the cells before and during 0.01 μM ACh stimulation, the depths of the ACh-stimulated cells were decreased compared with unstimulated cells, but the shapes of the ACh-stimulated cells were similar to those of unstimulated cells. The area of cells stimulated with 1 or 10 μM ACh decreased to a greater extent compared with those stimulated with 0.01 μM ACh during the first 30 s of stimulation. Both granule release and the cell volume decrease occurred at the luminal surface of the cells, and the basolateral outlines of the cells were maintained well, during activation of exocytotic events evoked by ACh stimulation.
Effects of ACh
Figure 2 shows exocytotic events and cell volume changes during ACh stimulation in antral mucous cells. ACh at 0.01 μM had no effect on exocytotic events, but it caused the cell volume to decrease within 20 s, and this cell volume decrease was maintained during ACh stimulation. The relative cell volumes (V/V0) at 20 s and 5 min from the start of ACh stimulation were 0.89 ± 0.01 and 0.88 ± 0.01 (n = 5 cells), respectively (Fig. 2A). Stimulation with 0.1 μM ACh increased the frequency of exocytotic events (1.8-2.5 cell−1 30 s−1). The relative cell volume decreased rapidly to a new value within 40 s from the start of ACh stimulation, and continued to decrease thereafter. The V/V0 values at 1 and 5 min from the start of ACh stimulation were 0.88 ± 0.03 and 0.76 ± 0.06 (n = 4), respectively. Thus, the cell shrinkage evoked by 0.1 μM ACh stimulation consisted of two phases: initial cell shrinkage and delayed cell shrinkage (Fig. 2A). Stimulation with 1 μM ACh increased the frequency of exocytotic events, which reached a peak value at 1 min from the start of ACh stimulation and decreased gradually thereafter. The frequency of exocytotic events at 1 and 5 min was 9.4 ± 2.0 and 1.75 ± 0.5 cell−1 30 s−1, respectively. Stimulation with ACh (1 μM) caused an initial cell shrinkage followed by a delayed cell shrinkage. The V/V0 values at 40 s and 5 min were 0.84 ± 0.02 and 0.58 ± 0.02 (n = 6), respectively (Fig. 2A). Stimulation with 10 μM ACh increased the frequency of exocytotic events transiently, reaching a peak value of 50 ± 5.2 cell−1 30 s−1 at 1 min and thereafter decreasing to 1.9 ± 0.6 cell−1 30 s−1 at 3 min from the start of ACh stimulation. The cell shrinkage evoked by 10 μM ACh also consisted of two phases, an initial cell shrinkage followed by a delayed cell shrinkage. The V/V0 values at 40 s and 5 min were 0.76 ± 0.03 and 0.47 ± 0.02 (n = 5), respectively (Fig. 2A). ACh at 1 mM evoked cell shrinkage and increased the frequency of exocytotic events. However, it also induced vacuole formation in cells, finally resulting in the bursting of some cells (data not shown). The frequency of exocytotic events in antral mucous cells (cell−1 5 min−1) is plotted against ACh concentration in Fig. 2E. The frequency of exocytotic events reached a peak value at 10 μM ACh and subsequently decreased again at 1 mM ACh.
Figure 2. ACh-evoked exocytotic events and cell volume changes in antral mucous cells.
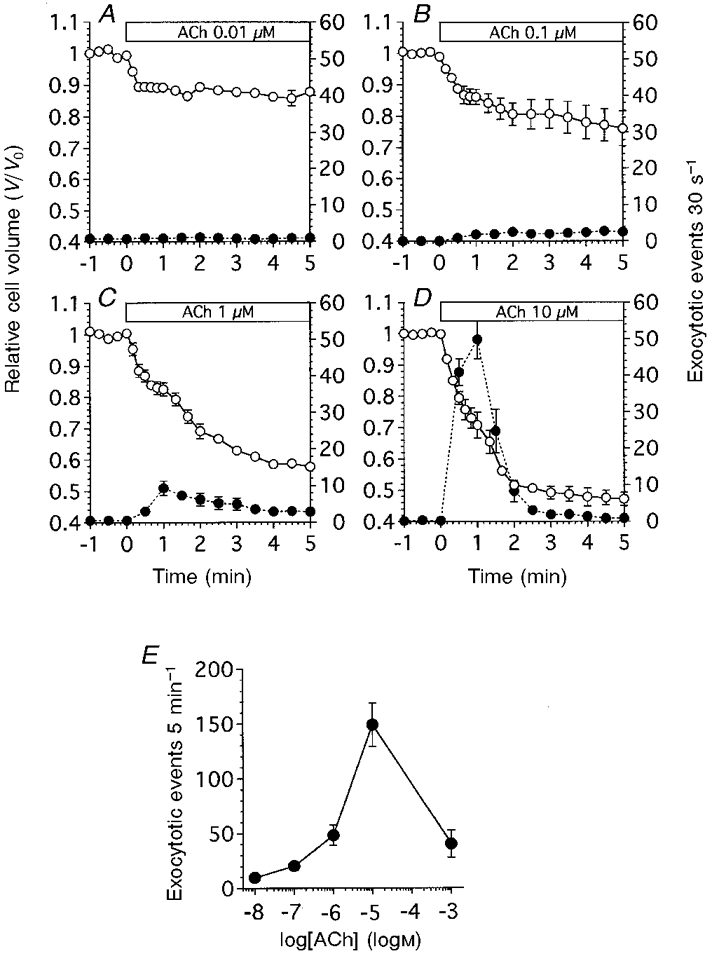
The values of relative cell volume (V/V0) were normalized to the control value. The number of exocytotic events 30 s−1 was counted on the video images and normalized to the cell number (30 s−1 cell−1). V/V0 is denoted by ○, and the frequency of exocytotic events is denoted by •. A, ACh at 0.01 μM (n = 5). ACh evoked an initial cell shrinkage, but not exocytotic events. B, ACh at 0.1 μM (n = 4). ACh evoked both cell shrinkage and exocytotic events. Cell shrinkage consisted of two phases: initial cell shrinkage and delayed cell shrinkage. The frequency of exocytotic events increased slightly. C, ACh at 1 μM (n = 6). The frequency of exocytotic events increased significantly. ACh evoked initial cell shrinkage followed by delayed cell shrinkage and increased the frequency of exocytotic events. D, ACh at 10 μM (n = 5). ACh evoked initial cell shrinkage followed by delayed cell shrinkage and transiently increased the frequency of exocytotic events. E, dose-response curve for ACh. The frequency of exocytotic events, normalized to the cell number during ACh stimulation (5 min), is plotted against ACh concentration. ACh at 1 mM reduced the frequency of exocytotic events.
Figure 3 shows the relationship between the frequency of exocytotic events and cell volume changes during the first minute of 1 μM ACh stimulation. When cells were stimulated with 1 μM ACh, cell shrinkage began within 5 s, and exocytotic events started 20 s after ACh stimulation. The frequency of exocytotic events continued to increase until 1 min after infusion of ACh solution. Thus, the exocytotic events were preceded by the initial cell shrinkage at 1 μM ACh stimulation. The increase in the frequency of exocytotic events coincided with the delayed cell shrinkage, as shown in Figs 1 and 2. The video images show that cells lose volume as a result of release of intracellular granules. Furthermore, the cell volume measurements showed that the increase in the frequency of exocytotic events resulted in a concomitant increase in the extent of delayed cell shrinkage (Fig. 2).
Figure 3. Exocytotic events and cell volume changes during the first minute of 1 μM ACh stimulation.
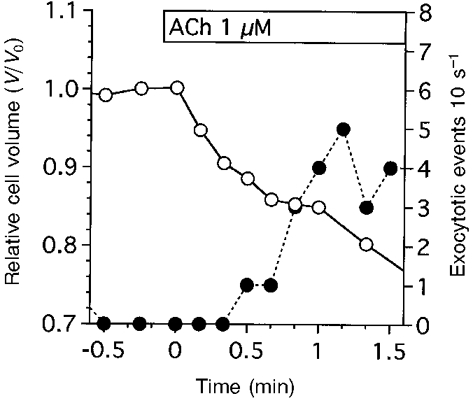
The frequency of exocytotic events (10 s−1) was counted and normalized to the cell number. This figure shows a typical case of cell shrinkage (○) and exocytotic events (•) evoked by 1 μM ACh. ACh stimulation evoked cell shrinkage immediately (within 5 s from the start of stimulation), while the exocytotic events began 20 s after ACh stimulation. The frequency of exocytotic events continued to increase until 1 min after ACh stimulation and thereafter was sustained. A further decrease in cell volume was also detected from 1 min after stimulation. As shown in Fig. 1C and H, the mucous cells lose their volume owing to granule release. Thus, the cell volume changes consisted of two phases: initial cell shrinkage and delayed cell shrinkage.
Thus, in antral mucous cells, the cell shrinkage evoked by ACh occurred in two phases: initial shrinkage followed by a delayed shrinkage. The delayed cell shrinkage was caused by granule release, which decreased the volume of the cell at its apical surface (Fig. 1A).
Effects of Ca2+
Figure 4 shows the effects of ionomycin on the frequency of exocytotic events and cell volume changes in antral mucous cells. Ionomycin at 0.01 μM had no effect on the frequency of exocytotic events, but it caused the cell volume to decrease gradually. The V/V0 value was 0.77 ± 0.01 (n = 4) at 5 min from the start of ionomycin infusion (Fig. 4A). Ionomycin at 0.1 μM caused the frequency of exocytotic events to increase (2.7-3.0 cell−1 30 s−1), and the cell volume to decrease gradually. The V/V0 value was 0.65 ± 0.02 (n = 5) at 5 min from the start of ionomycin infusion (Fig. 4A). Ionomycin at 1 μM caused initial cell shrinkage followed by delayed cell shrinkage. The V/V0 values at 1 and 4 min from the start of ionomycin infusion were 0.85 ± 0.01 and 0.57 ± 0.03 (n = 6), respectively. The frequency of exocytotic events increased little during the first minute of ionomycin infusion (less than 1 cell−1 30 s−1), but thereafter increased rapidly and reached a peak value followed by a gradual decrease. The frequencies of exocytotic events at 2.5 and 5 min after the start of ionomycin infusion were 23.7 ± 2.7 and 8.8 ± 2.0 cell−1 30 s−1, respectively (Fig. 4A). Ionomycin at 10 μM caused the frequency of exocytotic events to increase transiently. The frequency of exocytotic events at 1.5 and 5 min after the start of ionomycin infusion was 6.8 ± 1.5 and 1.0 ± 0.9 cell−1 30 s−1, respectively. Ionomycin at 10 μM caused initial cell swelling followed by delayed cell shrinkage. The V/V0 values at 20 s and 5 min were 1.01 ± 0.05 and 0.86 ± 0.02 (n = 4), respectively (Fig. 4A). Ionomycin at 10 μM caused intracellular vacuole formation, finally resulting in the bursting of some cells, as observed following 1 mM ACh stimulation. The frequency of exocytotic events in antral mucous cells is plotted against ionomycin concentration in Fig. 4E. The duration of each experiment was 5 min. The frequency of exocytotic events reached a peak value at 1 μM ionomycin, but at higher concentrations of ionomycin, such as 10 μM, the frequency of exocytotic events decreased. Thapsigargin at 2 μM, which increased [Ca2+]i by inhibiting microsomal Ca2+-ATPase, also evoked cell shrinkage followed by exocytotic events, similar to ionomycin at 0.1 μM. The V/V0 values at 1 and 5 min were 0.93 ± 0.03 and 0.81 ± 0.02 (n = 4), respectively. The frequency of exocytotic events induced by thapsigargin was 25.8 ± 3.7 cell−1 5 min−1 (data not shown).
Figure 4. Ionomycin-evoked exocytotic events and cell volume changes in antral mucous cells.
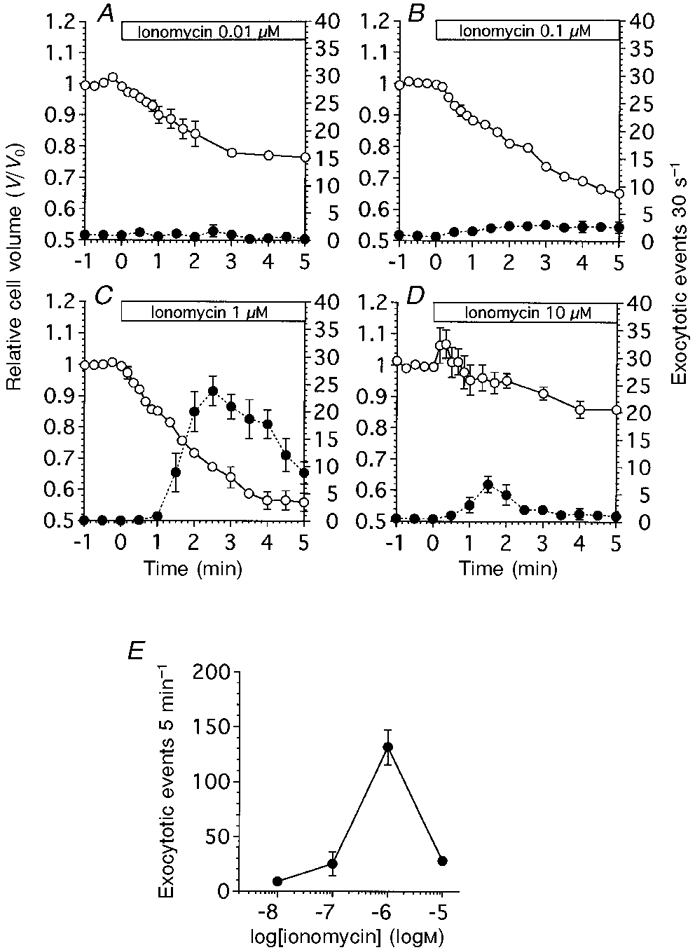
The values of relative cell volume (V/V0) were normalized to the control value. The number of exocytotic events 30 s−1 was counted from the video images and normalized to the cell number (30 s−1 cell−1). V/V0 is denoted by ○, and the frequency of exocytotic events is denoted by •. A, ionomycin at 0.01 μM (n = 4). The frequency of exocytotic events increased slightly and cell shrinkage was observed. B, ionomycin at 0.1 μM (n = 5). The frequency of exocytotic events increased slightly. C, ionomycin at 1 μM (n = 6). The frequency of exocytotic events increased significantly. The cell volume changes consisted of two phases: initial cell shrinkage followed by delayed cell shrinkage. D, ionomycin at 10 μM (n = 4). Both the frequency of exocytotic events and extent of cell shrinkage were suppressed compared with those evoked by 1 μM ionomycin. E, dose-response curve for ionomycin. The frequency of exocytotic events, normalized to the cell number, during ionomycin infusion (5 min−1 cell−1) is plotted against ionomycin concentration. Ionomycin at 10 μM reduced the frequency of exocytotic events.
Figure 5A shows the effects of depletion of extracellular Ca2+ on the cell volume changes and the frequency of exocytotic events following stimulation with 10 μM ACh. Depletion of extracellular Ca2+ caused the relative cell volume to decrease, reaching a plateau value within 1.5 min. The V/V0 value at 3 min was 0.94 ± 0.01 (n = 6). Subsequent stimulation with 10 μM ACh evoked only small and transient cell shrinkage. The V/V0 values at 10 s, 1 min and 5 min after the start of ACh stimulation were 0.89 ± 0.01, 0.94 ± 0.01 and 0.93 ± 0.01, respectively. Thus, depletion of extracellular Ca2+ inhibited the cell shrinkage induced by 10 μM ACh. The exocytotic events evoked by 10 μM ACh in a Ca2+-containing solution were also inhibited by the depletion of extracellular Ca2+.
Figure 5. Effects of Ca2+-free solution and a Ca2+ channel blocker on exocytotic events and cell shrinkage evoked by 10 μM ACh.
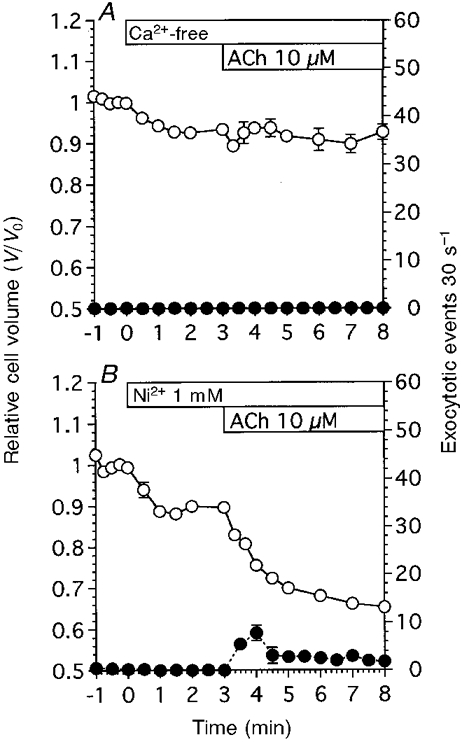
V/V0 is denoted by ○, and the frequency of exocytotic events is denoted by •. A, Ca2+-free solution evoked shrinkage in unstimulated antral mucous cells. Subsequent ACh stimulation evoked transient cell shrinkage, but did not activate exocytotic events (n = 6). B, Ni2+ also evoked cell shrinkage in unstimulated antral mucous cells. ACh stimulation subsequent to the addition of Ni2+ evoked both exocytotic events and cell shrinkage (n = 4). However, both the frequency of exocytotic events and the extent of cell shrinkage were reduced compared with those in control experiments.
Figure 5B shows the effect of Ni2+ (1 mM), a Ca2+ channel blocker, on the frequency of exocytotic events and cell volume changes. Addition of Ni2+ (1 mM) resulted in a decrease in cell volume, with a V/V0 value at 3 min of 0.90 ± 0.01 (n = 4), and thereafter stimulation with 10 μM ACh induced cell shrinkage. The V/V0 value at 5 min after the start of ACh stimulation was 0.65 ± 0.01. Addition of Ni2+ alone did not increase the frequency of exocytotic events. Subsequent ACh (10 μM) stimulation caused a transient followed by a sustained increase in the frequency of exocytotic events. The frequency of exocytotic events at 4 and 8 min was 7.8 ± 1.6 and 1.8 ± 0.1 cell−1 30 s−1, respectively. Thus, Ni2+ partially inhibited both the exocytotic events and cell shrinkage induced by ACh.
The effects of Ca2+ channel blockers and W-7 (a calmodulin inhibitor) on the frequency of exocytotic events are summarized in Fig. 6, in which the frequency of exocytotic events during 10 μM ACh stimulation (5 min) is plotted. Depletion of extracellular Ca2+ completely suppressed the activation of exocytotic events by ACh (10 μM), as shown in Fig. 5A. Ni2+ (1 mM) reduced the frequency of exocytotic events by 79 %, Cd2+ (1 mM) and nifedipine (100 μM) by 62 and 63 %, respectively, and W-7 (100 μM) by 69 %. These results suggest that the exocytotic events evoked by ACh are regulated via the [Ca2+]i in antral mucous cells.
Figure 6. Effects of Ca2+ channel blockers and W-7 (a calmodulin inhibitor).
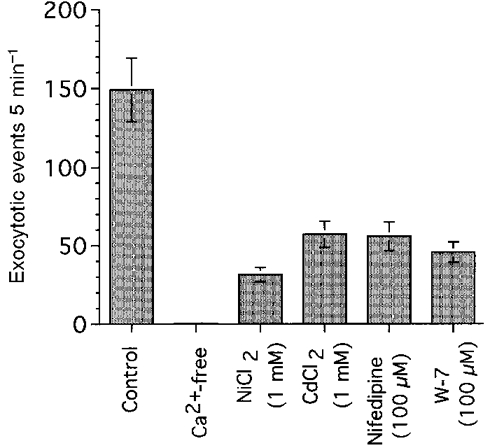
The frequency of exocytotic events during 10 μM ACh stimulation (5 min) is plotted.
Effects of ion channel blockers and bumetanide
The effects of ion channel blockers on cell volume changes and the frequency of exocytotic events were examined. Figure 7A shows the effects of a K+ channel blocker, quinine (1 mM), on the frequency of exocytotic events and cell volume changes following stimulation with 10 μM ACh. Addition of 1 mM quinine increased the cell volume of unstimulated cells. The cell volume ratio at 2 min after the addition of quinine was 1.06 ± 0.02 (n = 5). Stimulation with 10 μM ACh resulted in an initial cell swelling followed by a gradual cell shrinkage. The V/V0 values at 20 s and 5 min after the start of ACh stimulation were 1.08 ± 0.02 and 0.98 ± 0.03, respectively. ACh at 10 μM failed to evoke exocytotic events in quinine-treated cells (1.0 ± 0.4 cell−1 5 min−1). Thus, quinine inhibited both the cell shrinkage and exocytotic events induced by 10 μM ACh.
Figure 7. Effects of a K+ channel blocker (quinine) and a Cl− channel blocker (NPPB) on ACh-evoked exocytotic events and cell shrinkage.
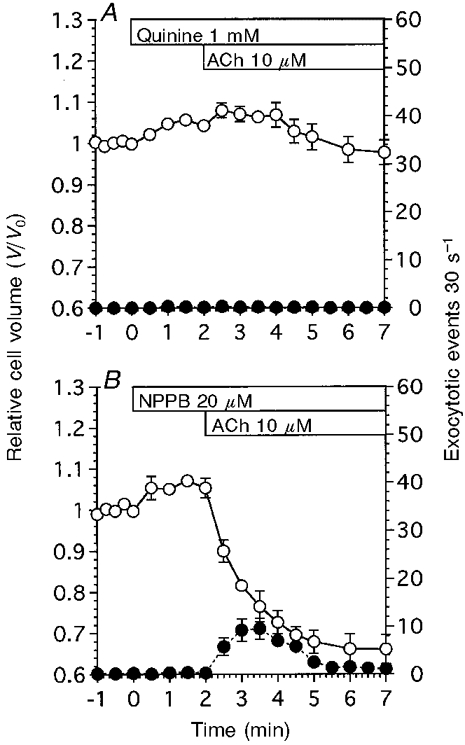
V/V0 is denoted by ○, and the frequency of exocytotic events is denoted by •. A, quinine at 1 mM evoked cell swelling in unstimulated antral mucous cells. ACh stimulation evoked further cell swelling and no exocytotic events (n = 5). B, NPPB at 20 μM evoked cell swelling in unstimulated antral mucous cells. ACh stimulation evoked cell shrinkage and exocytotic events. However, the extent of cell shrinkage and the number of exocytotic events were reduced compared with those in control experiments (n = 4).
Figure 7B shows the effects of a Cl− channel blocker, NPPB (20 μM), on the frequency of exocytotic events and cell volume changes evoked by 10 μM ACh. Addition of 20 μM NPPB caused the cell volume to increase. The V/V0 value at 2 min after the addition of NPPB was 1.05 ± 0.02 (n = 4). Stimulation with 10 μM ACh resulted in cell shrinkage. The V/V0 value at 4 min after the start of ACh stimulation was 0.66 ± 0.04. NPPB by itself did not increase the frequency of exocytotic events. Subsequent ACh stimulation increased the frequency of exocytotic events transiently, although the extent of cell shrinkage and increase in frequency of exocytotic events were lower than that in control experiments. The peak value of the transient increase was 9.5 ± 2.2 cell−1 30 s−1 (at 1.5 min after the start of ACh stimulation) and the frequency was sustained at a value of 2-3 cell−1 30 s−1 (at 3.5-5 min after the start of ACh stimulation).
Figure 8A shows the effects of bumetanide (a specific inhibitor of Na+-K+-2Cl− cotransport) on the frequency of exocytotic events and cell volume changes in unstimulated antral mucous cells. Addition of bumetanide (20 μM) caused the cell volume to decrease. The V/V0 value 3 min after the addition of 20 μM bumetanide was 0.75 ± 0.04 (n = 5). The addition of bumetanide (20 μM) caused the frequency of exocytotic events to increase gradually. The frequency of exocytotic events 3 min after the addition of bumetanide was 5.6 ± 1.4 cell−1 30 s−1, which was significantly different from that in unstimulated cells.
Figure 8. Effects of bumetanide on cell volume changes and the frequency of exocytotic events in antral mucous cells.
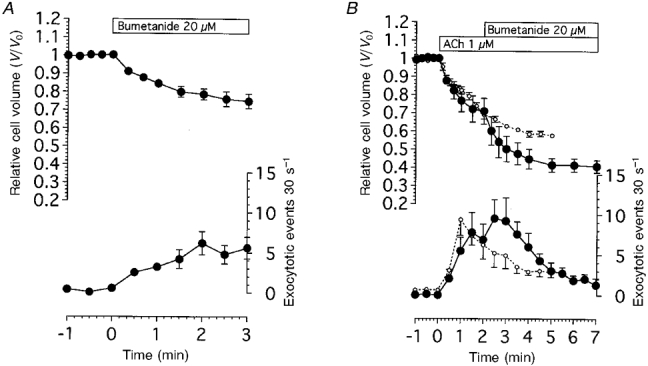
A, bumetanide at 20 μM evoked both cell shrinkage and exocytotic events in unstimulated antral mucous cells (n = 5). B, effects of bumetanide addition following 1 μM ACh stimulation. Bumetanide caused the extent of cell shrinkage and the frequency of exocytotic events to increase in ACh-stimulated mucous cells (•). ○, results of control experiments, as shown in Fig. 2C. Bumetanide enhanced ACh action (n = 4).
Figure 8B shows the effect of bumetanide on the frequency of exocytotic events and cell volume changes induced by 1 μM ACh stimulation. First, cells were stimulated with 1 μM ACh, and then 2 min after the start of the stimulation, bumetanide (20 μM) was added into the solution. Stimulation with 1 μM ACh caused the extent of cell shrinkage and frequency of exocytotic events to increase. The frequency of exocytotic events at 1.5 and 2 min after the start of 1 μM ACh stimulation was 7.8 ± 2.5 and 6.9 ± 1.9 cell−1 30 s−1. Addition of bumetanide caused a further decrease in cell volume and a further increase in the frequency of exocytotic events. The relative cell volume and the frequency of exocytotic events after the addition of bumetanide (20 μM) increased significantly compared with that obtained with 1 μM ACh alone as shown in Fig. 8B. The V/V0 value at 5 min was 0.42 ± 0.04 in cells treated with both ACh and bumetanide, while it was 0.58 ± 0.02 in those treated with ACh alone. The frequency of exocytotic events at 3 min was 9.3 ± 2.9 cell−1 30 s−1 in cells treated with both ACh and bumetanide, and 4.9 ± 1.6 cell−1 30 s−1 in those treated with ACh alone. The results suggest that cell shrinkage may result in an increase in the frequency of exocytotic events.
The experiments were also performed using Cl−-free solution. When cells were perfused with Cl−-free solution in the presence of extracellular Ca2+, the cell volume decreased (V/V0 = 0.72 ± 0.02 after 3 min) and the frequency of exocytotic events increased (3.5 ± 0.8 cell−1 30 s−1 after 3 min). In the absence of extracellular Ca2+, infusion of Cl−-free solution caused the cell volume to decrease (V/V0 = 0.70 ± 0.03 after 3 min) but the frequency of exocytotic events did not increase (0.1 ± 0.1 cell−1 30 s−1 after 3 min). Switching from the control to the Cl−-free solution during 1 μM ACh stimulation caused the cell volume and the frequency of exocytotic events to increase transiently. The experimental protocol was the same as that for Fig. 8A. The frequency of exocytotic events increased from 5.1 ± 0.7 to 8.8 ± 1.3 cell−1 30 s−1 following the switch to Cl−-free solution during 1 μM ACh stimulation. The results of the Cl−-free experiments were the same as those of the bumetanide experiments (data not shown).
The effects of ion channel blockers and bumetanide on the frequency of exocytotic events (first 30 s during ACh stimulation) are summarized in Fig. 9. Quinine at 1 mM completely suppressed the exocytotic events induced by 10 μM ACh. Ba2+ at 1 mM (a K+ channel blocker) and NPPB at 20 μM also reduced the frequency of exocytotic events by 85-86 %. The inhibition of K+ or Cl− channels caused cell swelling or suppressed ACh-induced cell shrinkage, as shown in Fig. 7. These results suggest that cell swelling decreases the frequency of exocytotic events induced by ACh. Benzamil (a Na+ channel blocker) also decreased the frequency of exocytotic events in the first 30 s of ACh stimulation by 30 %, but had no significant effect on exocytotic events during 10 μM ACh stimulation (5 min). Bumetanide (20 μM) also had no significant effect on the exocytotic events induced by 10 μM ACh. However, the addition of bumetanide caused a significant increase in the frequency of exocytotic events induced by 1 μM ACh as shown in Fig. 8B. Stimulation with 10 μM ACh caused depletion of intracellular granules within 3 min in both bumetanide-untreated and -treated cells. The number of exocytotic events following 10 μM ACh stimulation (5 min) may be limited by the number of mucin granules in the cells.
Figure 9. Effects of ion channel blockers and bumetanide.
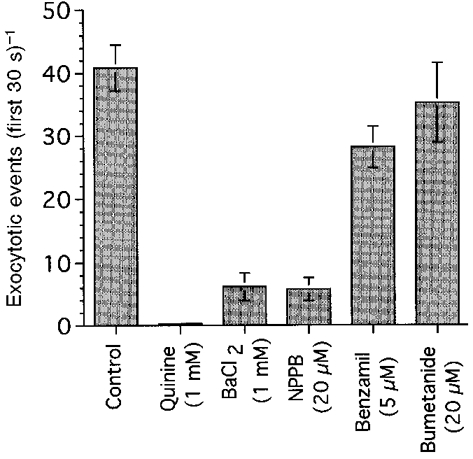
The frequency of exocytotic events during 10 μM ACh stimulation (5 min) is plotted.
Effects of extracellular K+ concentration on exocytosis
To examine the effect of cell volume on the exocytotic events induced by ACh, the cell volume was altered by increasing the extracellular K+ concentration ([K+]o) in the perfusion solution (Suzuki et al. 1991; Nakahari & Marunaka, 1997). The [K+]o of the test solutions used was 155.5, 77.8 and 46.5 mM. First, cells were perfused with control solution containing 4.5 mM K+, then the control solution was switched to a test solution.
Figure 10A shows the experiments for an [K+]o of 155.5 mM. On switching to the test solution, cell swelling was observed. The V/V0 value 2 min after switching to the test solution was 1.08 ± 0.01 (n = 4). Stimulation with ACh (10 μM) caused cell swelling followed by delayed cell shrinkage, and a transient increase in the frequency of exocytotic events. The V/V0 values at 20 s and 5 min were 1.13 ± 0.02 and 1.05 ± 0.04. The peak value of the transient increase in the frequency of exocytotic events was 4.9 ± 0.8 cell−1 30 s−1 at 30 s after the start of ACh stimulation. Figure 10B shows the experiment with an [K+]o of 77.8 mM. On switching to the test solution, cell swelling occurred. The V/V0 value 2 min after switching to the test solution was 1.09 ± 0.03 (n = 3). Stimulation with 10 μM ACh evoked cell shrinkage and a transient increase in the frequency of exocytotic events. The V/V0 value 3 min after the start of ACh stimulation was 0.84 ± 0.08. The frequency of exocytotic events was 5.1 ± 0.82 cell−1 30 s−1 at 30 s after the start of ACh stimulation. Figure 10C shows the experiment with an [K+]o of 46.5 mM. On switching to the test solution, cell swelling occurred. The V/V0 value 2 min after switching to the test solution was 1.03 ± 0.01 (n = 4). Stimulation with 10 μM ACh caused initial cell shrinkage followed by delayed cell shrinkage and a transient increase in the frequency of exocytotic events. The V/V0 values 40 s and 5 min after the start of ACh stimulation were 0.74 ± 0.03 and 0.53 ± 0.02, respectively. The frequency of exocytotic events at 30 s after the start of ACh stimulation was 10.86 ± 1.85 cell−1 30 s−1. The peak value of the transient increase in the frequency of exocytotic events was 20.2 ± 1.8 cell−1 30 s−1. Figure 10D shows the results of control experiments, as shown in Fig. 2D. Stimulation with ACh evoked initial cell shrinkage followed by delayed cell shrinkage and a large transient increase in the frequency of exocytotic events. The frequency of exocytotic events at 30 s after the start of ACh stimulation was 40.9 ± 3.7 cell−1 30 s−1. These results suggest that the initial cell shrinkage may increase the frequency of exocytotic events evoked by ACh. We plotted the frequency of exocytotic events in the first 30 s during ACh stimulation against the relative cell volume 20 s after the start of ACh stimulation (Fig. 10A). The relative cell volume was affected little by exocytotic events at 20 s after the start of ACh stimulation as shown in Fig. 3. The results show that cell shrinkage increases the frequency of exocytotic events, while cell swelling decreases them. Thus, a correlation exists between the frequency of exocytotic events and initial cell shrinkage in antral mucous cells.
Figure 10. Effects of cell volume on ACh-evoked exocytotic events.
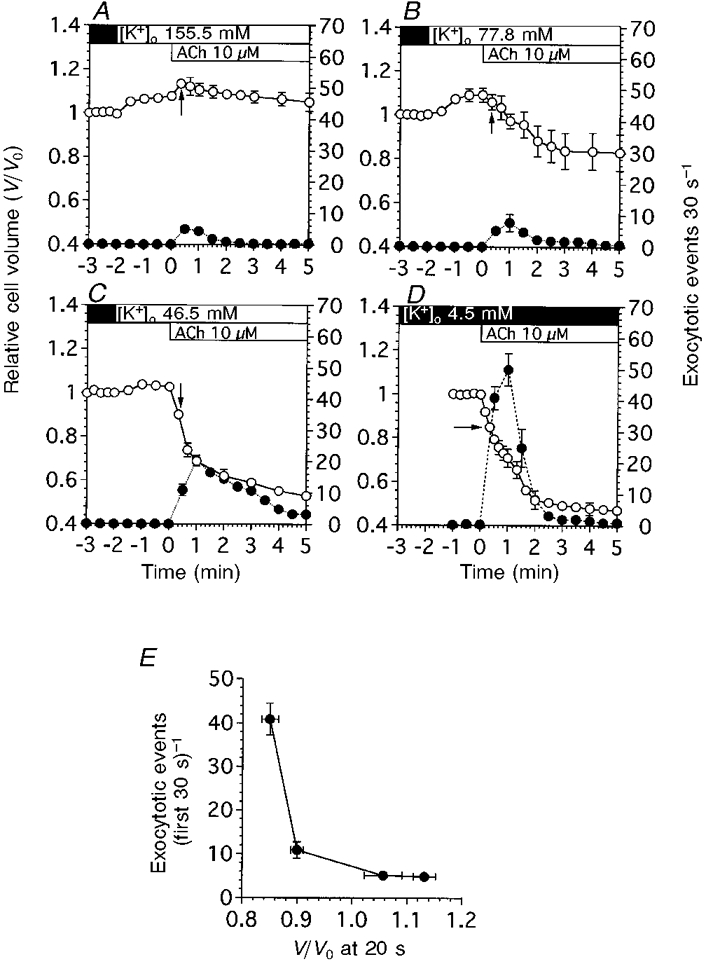
To control the initial cell shrinkage, [K+]o was increased by the addition of KCl solution to the control solution. V/V0 is denoted by ○, and the frequency of exocytotic events is denoted by •. A, [K+]o at 155.5 mM caused the cell volume to increase. ACh stimulation evoked further increases in cell volume. Exocytotic events were activated, but the frequency was lower compared with that in control experiments (Fig. 10D). B, [K+]o at 77.8 mM also caused the cell volume to increase. ACh stimulation evoked a slight decrease in cell volume. Exocytotic events were activated, but the frequency was reduced compared with that in control experiments. C, [K+]o at 46.5 mM also caused the cell volume to increase. ACh stimulation evoked a decrease in cell volume. The frequency of exocytotic events was increased compared with that in B, but was reduced compared with that in control experiments. D, [K+]o at 4.5 mM (n = 5). This panel shows the results of control experiments already shown in Fig. 2D. E, frequency of exocytotic events during the first 30 s of ACh stimulation (cell−1 30 s−1) plotted against the cell volume that resulted in initial cell shrinkage, marked by arrows in A-D. The cell volumes at 20 s were not significantly affected by exocytotic events. The results show that the frequency of exocytotic events during 10 μM ACh stimulation (first 30 s of ACh stimulation) depends on the cell volume that resulted in the initial cell shrinkage.
Figure 11 shows changes in [Ca2+]i during 10 μM ACh stimulation. Figure 11A shows the experiment with an [K+]o of 4.5 mM (control solution). Cells were stimulated by 10 μM ACh. [Ca2+]i increased rapidly (within 3 s), and was sustained (160-190 nM) during ACh stimulation. Figure 11B shows the experiments for KCl solution. Switching from the control to the KCl solution caused [Ca2+]i to decrease slightly. ACh (10 μM) stimulation caused [Ca2+]i to increase transiently and then reach a plateau value (130 nM) within 1 min, which was significantly higher than unstimulated cells.
Figure 11. Changes in [Ca2+]i in antral mucous cells.
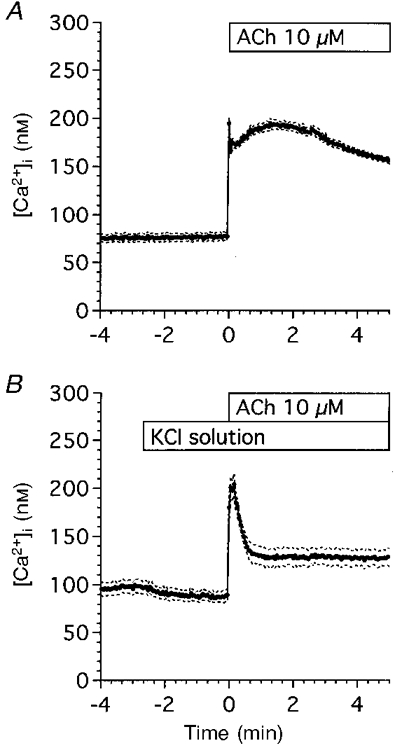
Cells were loaded with fura-2 AM for 25 min at room temperature. The ratios (340 nm/380 nm) of fura-2 fluorescence were calculated and stored in the Ca2+ imaging system. A, control experiments (n = 6). Cells were perfused with the control solution and stimulated with 10 μM ACh. ACh stimulation evoked an initial followed by a sustained increase in [Ca2+]i. B, KCl experiments (n = 5). Fura-2 AM-loaded cells were perfused with the KCl solution and stimulated with 10 μM ACh. ACh stimulation evoked an initial followed by a sustained increase in [Ca2+]i. [Ca2+]i in the sustained phase of control experiments was higher than that in KCl experiments, but [Ca2+]i during the first 30 s of ACh stimulation increased significantly in both experiments. Values are expressed as means ±s.e.m.
Thus, increasing [K+]o caused the sustained increase in [Ca2+]i to decrease, but [Ca2+]i increased significantly during the first 30 s of ACh stimulation in both experiments as shown in Fig. 11A and B.
Effects of osmotic cell volume change on exocytosis
To examine the effects of cell volume change on exocytosis, hyposmotic and hyperosmotic stress were applied. Hyposmotic stress was applied by reducing the NaCl concentration of the control solution by 50 mM. Cell swelling by hyposmotic stress resulted in compensatory cell shrinkage (regulatory volume decrease, RVD). Exocytotic events were not activated during application of hyposmotic stress (-50 mM NaCl) in the absence of ACh. When cells were stimulated with ACh (1 μM), rapid cell shrinkage occurred and the frequency of exocytotic events increased rapidly, reaching a peak value 1 min after the start of ACh stimulation, and thereafter decreasing gradually. In these hyposmotic experiments, the frequency of exocytotic events during the first 2 min after the start of ACh stimulation was higher than that evoked in isosmotic experiments, as shown in Fig. 12A.
Figure 12. Effects of osmotic stress on ACh-evoked exocytotic events.
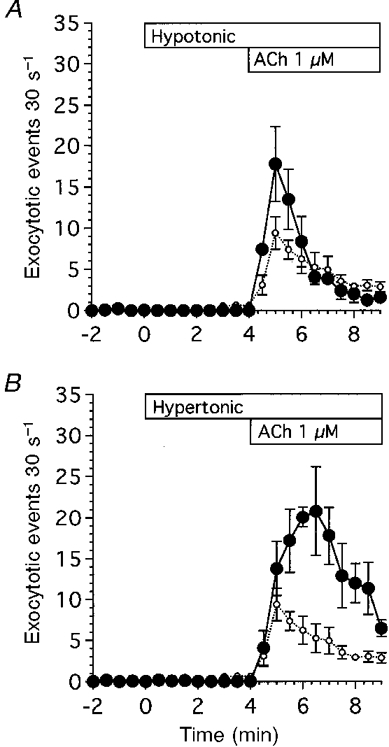
A, hyposmotic stress (-100 mosmol l−1). Hyposmotic stress (•) was applied by reducing the NaCl concentration of the control solution by 50 mM. Application of hyposmotic stress did not cause the frequency of exocytotic events to increase in the absence of ACh. ACh at 1 μM stimulated exocytotic events. The frequency of exocytotic events evoked by ACh during 5 min stimulation was higher in hyposmotic experiments than in isosmotic experiments (○), but the time course was similar in the two experiments. B, hyperosmotic stress (+100 mosmol l−1). Hyperosmotic stress (•) was applied by adding 50 mM NaCl to the control solution. Application of hyperosmotic stress did not cause the frequency of exocytotic events to increase in the absence of ACh. ACh at 1 μM stimulated exocytotic events. The frequency of exocytotic events evoked by ACh during 5 min stimulation was higher in hyperosmotic experiments than in isosmotic experiments (○), and the time course of the increases in the frequency of exocytotic events was different in hyperosmotic experiments from that in isosmotic or hyposmotic experiments. The time to reach the peak value was delayed from 1 to 2.5 min after the start of ACh stimulation.
Application of hyperosmotic stress (+50 mM NaCl) caused the cell volume to decrease rapidly. Application of hyperosmotic stress did not increase the frequency of exocytotic events in the absence of ACh. When cells were stimulated with ACh (1 μM), rapid cell shrinkage occurred and the frequency of exocytotic events increased gradually, reaching a peak value 2.5 min after the start of ACh stimulation, and thereafter decreasing gradually. In these hyperosmotic experiments, the frequency of ACh-evoked exocytotic events was much higher than that in isosmotic experiments as shown in Fig. 12A. Thus, osmotic shrinkage or swelling increased the frequency of exocytotic events evoked by ACh.
DISCUSSION
Exocytotic events and cell shrinkage were evoked by ACh, and the frequency of exocytotic events and extent of cell shrinkage in antral mucous cells from guinea-pigs were dependent on the ACh concentration. The action of ACh was mediated by an increase in [Ca2+]i in antral mucous cells, probably caused by influx of Ca2+ from the extracellular fluid, since ACh stimulation of cells in a Ca2+-free solution did not evoke the exocytotic events. However, ACh evoked transient cell shrinkage in a Ca2+-free solution. This indicates that internal Ca2+ stores do exist but Ca2+ release from the internal stores is not sufficient to evoke exocytotic events in antral mucous cells.
The onset of exocytotic events evoked by ionomycin was delayed compared with that evoked by ACh. ACh increased [Ca2+]i in antral mucous cells immediately (≤ 1 min), but ionomycin increased it more gradually (≥ 3 min) (data not shown). Exocytotic events have been reported to occur very quickly if the [Ca2+]i at the release site is elevated to a sufficiently high level in adrenal chromaffin cells (Heinemann et al. 1994). The delayed onset of exocytotic events evoked by ionomycin can be explained by the delayed increase in [Ca2+]i.
Low concentrations, such as 0.01 μM, of ACh or ionomycin evoked initial cell shrinkage but not exocytotic events, although both were evoked at higher concentrations (≥ 0.1 μM). Moreover, the exocytotic events were preceded by the initial cell shrinkage. Agonist-induced cell shrinkage is known to be caused by KCl release from cells through K+ and Cl− channels, therefore cell shrinkage can be considered to be an indicator of the activation of ion channels (Suzuki et al. 1991; Nakahari & Marunaka, 1996, 1997). These results indicate that a small increase in [Ca2+]i activates K+ and Cl− channels, while a large increase in [Ca2+]i activates both ion channels and exocytotic events. It was recently reported in pancreatic acinar cells that [Ca2+]i in the micromolar range evokes exocytotic events while [Ca2+]i in the submicromolar range activates ion channels (Ito et al. 1997). Our observations in antral mucous cells are consistent with those in pancreatic acinar cells.
The K+ channel blocker quinine evoked swelling of unstimulated cells, and ACh stimulation evoked further cell swelling of quinine-treated cells. Ba2+, another K+ channel blocker, also evoked swelling of unstimulated cells, and ACh stimulation evoked cell shrinkage in Ba2+-treated cells, although the extent of ACh-evoked cell shrinkage in Ba2+-treated cells was 40 % less than that in Ba2+-untreated cells. Moreover, application of KCl solution evoked cell swelling in unstimulated antral mucous cells, and subsequent ACh stimulation evoked a further increase in cell volume. The extent of the initial cell shrinkage induced by ACh was dependent on the [K+]o. These findings indicate that K+ release through Ca2+-activated K+ channels causes the initial cell shrinkage in antral mucous cells.
K+ release is accompanied by Cl− release. In fact, NPPB evoked cell swelling in unstimulated cells and partially suppressed the initial cell shrinkage induced by ACh. In the present experiments, we did not identify the Ca2+ dependence on Cl− channels in antral mucous cells. In Cl−-secreting epithelia, Ca2+-activated Cl− channels located in apical membranes play an important role in Cl− secretion (Binder & Sandle, 1994). Antral mucous cells are known to secrete Cl− and HCO3− (Suzuki et al. 1993). The present study showed that ACh stimulation evokes swelling of the lumen, which may be caused by fluid secretion following Cl− secretion (Nakahari & Imai, 1998). These findings suggest that ACh activates Cl− secretion through Cl− channels, which can be inhibited by NPPB.
Infusion of Ca2+-free solution caused cell shrinkage in unstimulated antral mucous cells. There are two possible reasons for this: (1) inhibition of Na+ entry, and (2) activation of K+ or Cl− release. Antral mucous cells have Ca2+-activated K+ channels and, accordingly, Ca2+-free solutions do not appear to activate KCl release from unstimulated antral mucous cells, although we cannot rule out the possibility of the existence of other K+ channels or Cl− channels which are activated by a reduction in [Ca2+]i. Inhibition of Na+ entry pathways that are Ca2+ sensitive appears to occur. In fetal lung cells, Ca2+-free solution evoked cell shrinkage by inhibiting non-selective cation channels (Nakahari & Marunaka, 1997). However, in our study benzamil, a Na+ channel blocker, failed to cause cell shrinkage in unstimulated antral mucous cells. Cell shrinkage in these cells appears to be evoked by inhibition of other Na+ entry pathways, such as the Na+-K+-2Cl− cotransporter or Na+-H+ exchangers.
In the present experiments, bumetanide evoked cell shrinkage in unstimulated and ACh-stimulated antral mucous cells. Bumetanide is reported to inhibit the regulatory volume increase (RVI) during hyposmotic stress and the pseudo-RVI induced by methacholine in eccrine clear cells (Toyomoto et al. 1997), and to enhance terbutaline-evoked cell shrinkage in fetal lung cells (Marunaka et al. 1995), by inhibiting NaCl entry. It has also been reported that increases in [Ca2+]i cause the Na+ influx via Na+-K+-2Cl− cotransporters to increase (Zhang et al. 1993). Unfortunately, at present we do not know whether or not the Na+-K+-2Cl− cotransporter in the antral mucous cells is Ca2+ sensitive. However, it is concluded that a Na+-K+-2Cl− cotransporter exists in antral mucous cells and plays an important role in maintaining cell volume in both unstimulated and stimulated antral mucous cells.
Ion channel blockers also affected exocytotic events. Inhibition of KCl release (K+ and Cl− channel blockers and KCl experiments), which evoked cell swelling, decreased the frequency of exocytotic events during the first 30 s of ACh stimulation; inhibition of NaCl influx (bumetanide and Cl−-free experiments), which evoked cell shrinkage, increased the frequency of exocytotic events. Moreover, increasing [K+]o, which decreases the extent of initial cell shrinkage, caused the frequency of exocytotic events in the first 30 s of stimulation to decrease. Since [Ca2+]i increased significantly during the first 30 s of ACh stimulation in both control and KCl experiments, decreases in the frequency of exocytotic events (first 30 s) in KCl experiments are not explained by changes in [Ca2+]i. Thus, cell shrinkage appears to cause the frequency of exocytotic events evoked by ACh to increase and, in contrast, cell swelling appears to decrease their frequency. Not all blockers are as specific as may be assumed, and they may affect other functions, such as cellular metabolism. However, the results of the channel blocker experiments were consistent with those of the ion-replacement experiments in the absence of blockers. The results of the blocker experiments do not appear to be caused by non-specific effects of the blockers. These observations suggest that ACh-evoked exocytosis is modulated by cell volume in antral mucous cells.
Cell volume has been reported to modulate cell functions such as ion transport (Robertson & Foskett, 1994; Marunaka et al. 1995; Schlatter et al. 1997; Shrode et al. 1997), protein phosphorylation (Szaszi et al. 1997) and apoptosis (McCarthy & Cotter, 1997). However, osmotic shrinkage or swelling increased the frequency of ACh-evoked exocytotic events. These observations suggest that exocytotic events may be regulated by signals controlled by cell volume changes. Cell shrinkage has been reported to decrease intracellular Cl− concentration ([Cl−]i) (Foskett, 1990; Foskett et al. 1994; Marunaka, 1997). [Cl−]i is also reported to control ion channels (Dinudom et al. 1993, 1995; Tohda et al. 1994; Nakahari & Marunaka, 1995a, b; Marunaka et al. 1995) and exocytosis (Rupnik & Zorec, 1995). The increased frequency of ACh-evoked exocytotic events under hyposmotic conditions may be explained by the dilution of intracellular fluid which causes decreases in [Cl−]i and, further, decreases in [Cl−]i during ACh-induced cell shrinkage, but the increased frequency under hyperosmotic conditions cannot be explained. Foskett et al. (1994) suggest that the intracellular signalling pathways used by cells to activate ion transport under anisosmotic conditions may not be the same as those employed under isosmotic conditions. Under hyperosmotic conditions cells may use different signal pathways for exocytosis.
The present study demonstrates that exocytotic events were activated by an increase in [Ca2+]i and cell shrinkage under isosmotic conditions. In the presence of extracellular Ca2+, addition of bumetanide or Cl−-free solution increased the frequency of exocytotic events in unstimulated antral mucous cells. However, in the absence of extracellular Ca2+, exocytotic events were not detected in unstimulated cells perfused with Cl−-free solution, although cell shrinkage occurred. These observations suggest that cell shrinkage probably modulates the actions of Ca2+.
The results are summarized in Fig. 13. ACh stimulation caused [Ca2+]i to increase. Ca2+ was supplied from the extracellular fluid. Increased [Ca2+]i directly stimulated exocytosis, and also activated Ca2+-sensitive K+ channels. Opening of K+ channels resulted in K+ release from cells, which was accompanied by Cl− release via apical Cl− channels. This release of KCl from cells evoked cell shrinkage, which in turn modulated Ca2+-regulated exocytosis.
Figure 13.
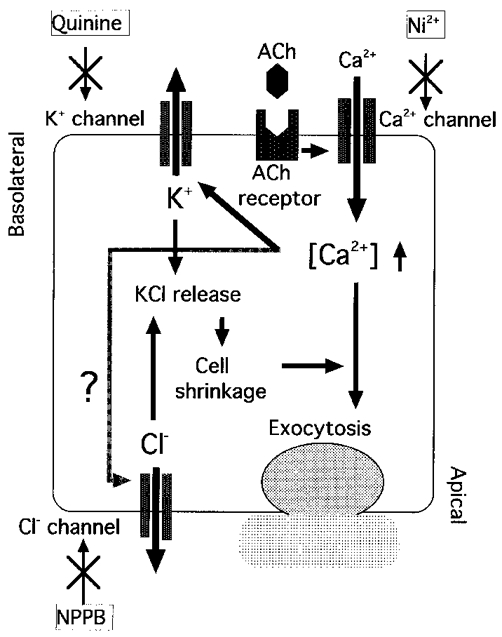
Regulation of exocytosis in antral mucous cells.
Acknowledgments
We thank Professor Y. Suzuki (Laboratory of Physiology, School of Food and Nutritional Sciences, University of Shizuoka) for his helpful advice and discussions. We also thank Dr H. Yoshida (Department of Physiology) for his techinical assistance in [Ca2+]i measurements.
References
- Allen RD. New observations on cell architecture and dynamics by video-enhanced contrast optical microscopy. Annual Review of Biophysics and Biophysical Chemistry. 1985;14:265–290. doi: 10.1146/annurev.bb.14.060185.001405. 10.1146/annurev.bb.14.060185.001405. [DOI] [PubMed] [Google Scholar]
- Binder HJ, Sandle GI. Electrolyte transport in the mammalian colon. In: Johnson LR, editor. Physiology of the Gastrointestinal Tract. 3. New York: Raven Press; 1994. pp. 2133–2171. [Google Scholar]
- Dinudom A, Komwatana P, Young JA, Cook DI. Control of the amiloride-sensitive Na+ current in mouse salivary ducts by intracellular anions is mediated by a G protein. The Journal of Physiology. 1995;487:549–555. doi: 10.1113/jphysiol.1995.sp020899. [DOI] [PMC free article] [PubMed] [Google Scholar]
- Dinudom A, Young JA, Cook DI. Na+ and Cl− conductances are controlled by cytosolic Cl− concentration in the interlobular duct cells of mouse mandibular glands. Journal of Membrane Biology. 1993;135:289–295. doi: 10.1007/BF00211100. [DOI] [PubMed] [Google Scholar]
- Forstner JF, Forstner GG. Gastrointestinal mucus. In: Johnson LR, editor. Physiology of the Gastrointestinal Tract. 3. New York: Raven Press; 1994. pp. 1255–1283. [Google Scholar]
- Foskett JK. [Ca2+]i modulation of Cl− contents controls cell volume in single salivary acinar cells during fluid secretion. American Journal of Physiology. 1990;259:C998–1004. doi: 10.1152/ajpcell.1990.259.6.C998. [DOI] [PubMed] [Google Scholar]
- Foskett JK, Melvin JE. Activation of salivary secretion: Coupling of cell volume and [Ca2+]i in single cells. Science. 1989;244:1582–1585. doi: 10.1126/science.2500708. [DOI] [PubMed] [Google Scholar]
- Foskett JK, Wong MMM, Sue-A-Quan G, Robertson MA. Isosmotic modulation of cell volume and intracellular ion activities during stimulation of single exocrine cells. Journal of Experimental Zoology. 1994;268:104–110. doi: 10.1002/jez.1402680206. [DOI] [PubMed] [Google Scholar]
- Heinemann C, Chow RH, Neher E, Zucker RS. Kinetics of the sensory response in bovine chromaffin cells following flash photolysis of caged Ca2+ Biophysical Journal. 1994;67:2549–2557. doi: 10.1016/S0006-3495(94)80744-1. [DOI] [PMC free article] [PubMed] [Google Scholar]
- Ito K, Miyashita Y, Kasai H. Micromolar and submicromolar Ca2+ spikes regulating distinct cellular functions in pancreatic acinar cells. EMBO Journal. 1997;16:242–251. doi: 10.1093/emboj/16.2.242. 10.1093/emboj/16.2.242. [DOI] [PMC free article] [PubMed] [Google Scholar]
- McCarthy JV, Cotter TG. Cell shrinkage and apoptosis: a role for potassium and sodium ion efflux. Cell Death and Differentiation. 1997;4:756–770. doi: 10.1038/sj.cdd.4400296. 10.1038/sj.cdd.4400296. [DOI] [PubMed] [Google Scholar]
- Marunaka Y. Hormonal and osmotic regulation of NaCl transport in renal distal nephron epithelium. Japanese The Journal of Physiology. 1997;47:499–511. doi: 10.2170/jjphysiol.47.499. [DOI] [PubMed] [Google Scholar]
- Marunaka Y, Doi Y, Nakahari T. Bumetanide and bicarbonate increase short-circuit current in fetal lung epithelium. General Pharmacology. 1995;26:1513–1517. doi: 10.1016/0306-3623(95)00032-1. [DOI] [PubMed] [Google Scholar]
- Nakahari T, Imai Y. Transient swelling of salivary acinus induced by acetylcholine stimulation: water secretion pathway in rat submandibular gland. Journal of Membrane Biology. 1998;161:287–296. doi: 10.1007/s002329900335. 10.1007/s002329900335. [DOI] [PubMed] [Google Scholar]
- Nakahari T, Marunaka Y. ADH-evoked [Cl−]i-dependent transient in whole cell current of distal nephron cell line A6. American Journal of Physiology. 1995a;268:F64–72. doi: 10.1152/ajprenal.1995.268.1.F64. [DOI] [PubMed] [Google Scholar]
- Nakahari T, Marunaka Y. Regulation of whole cell currents by cytosolic cAMP, Ca2+, and Cl− in rat fetal distal lung epithelium. American Journal of Physiology. 1995b;269:C156–162. doi: 10.1152/ajpcell.1995.269.1.C156. [DOI] [PubMed] [Google Scholar]
- Nakahari T, Marunaka Y. Regulation of cell volume by β2-adrenergic stimulation in rat fetal distal lung epithelial cells. Journal of Membrane Biology. 1996;151:91–100. doi: 10.1007/s002329900060. 10.1007/s002329900060. [DOI] [PubMed] [Google Scholar]
- Nakahari T, Marunaka Y. β-Agonist-induced activation of Na+ absorption and KCl release in rat fetal distal lung epithelium: a study of cell volume regulation. Experimental Physiology. 1997;82:521–536. doi: 10.1113/expphysiol.1997.sp004044. [DOI] [PubMed] [Google Scholar]
- Nakahari T, Murakami M, Yoshida H, Miyamoto M, Sohma Y, Imai Y. Decrease in rat submandibular acinar cell volume during ACh stimulation. American Journal of Physiology. 1990;258:G878–886. doi: 10.1152/ajpgi.1990.258.6.G878. [DOI] [PubMed] [Google Scholar]
- Robertson MA, Foskett JK. Na+ transport pathways in secretory acinar cells: membrane cross talk mediated by [Cl−]i. American Journal of Physiology. 1994;267:C146–156. doi: 10.1152/ajpcell.1994.267.1.C146. [DOI] [PubMed] [Google Scholar]
- Rupnik M, Zorec R. Intracellular Cl− modulates Ca2+-induced exocytosis from rat melanotrophs through GTP-binding proteins. Pflügers Archiv. 1995;431:76–83. doi: 10.1007/BF00374379. [DOI] [PubMed] [Google Scholar]
- Schlatter E, Ankorina-Stark I, Cermak R, Haxelmans S, Kleta R, Hisch JR. Cell shrinkage activates a cation conductance in principal cells of rat cortical collecting duct. Cellular Physiology and Biochemistry. 1997;7:321–332. [Google Scholar]
- Segawa A, Terakawa S, Yamashina S, Hopkins CR. Exocytosis in living salivary glands: direct visualization by video-enhanced microscopy and confocal laser microscopy. European Journal of Cell Biology. 1991;54:322–330. [PubMed] [Google Scholar]
- Seidler U, Sewing K-F R. Ca2+-dependent and -independent secretagogue action on gastric mucus secretion in rabbit mucosal explants. American Journal of Physiology. 1989;256:G739–746. doi: 10.1152/ajpgi.1989.256.4.G739. [DOI] [PubMed] [Google Scholar]
- Shrode LD, Klein JD, O'Neil WC, Douglas PB, Putnum RW. Shrinkage-induced activation of Na+/H+ exchange: role of cell density and myosin light chain phosphorylation. American Journal of Physiology. 1997;272:C1968–1979. doi: 10.1152/ajpcell.1997.272.6.C1968. [DOI] [PubMed] [Google Scholar]
- Suzuki AG, Kaneyama J, Tsukamoto M, Kaneko K, Suzuki Y. Stimulation of Cl− and HCO3− secretion by intramural cholinergic neurons in guinea pig antrum in vitro. American Journal of Physiology. 1993;264:G118–125. doi: 10.1152/ajpgi.1993.264.1.G118. [DOI] [PubMed] [Google Scholar]
- Suzuki Y, Ohtsuyama M, Samman G, Sato F, Sato K. Ionic basis of methacholine-induced shrinkage of dissociated eccrine clear cells. Journal of Membrane Biology. 1991;123:33–41. doi: 10.1007/BF01993960. [DOI] [PubMed] [Google Scholar]
- Szaski K, Buday L, Kapus A. Shrinkage-induced protein tyrosine phosphorylation in chinese hamster ovary cells. Journal of Biological Chemistry. 1997;272:16670–16678. doi: 10.1074/jbc.272.26.16670. [DOI] [PubMed] [Google Scholar]
- Takemura T, Sato F, Saga K, Suzuki Y, Sato K. Intracellular ion concentrations and cell volume during cholinergic stimulation of eccrine secretory coil cells. Journal of Membrane Biology. 1991;119:211–219. doi: 10.1007/BF01868726. [DOI] [PubMed] [Google Scholar]
- Terakawa S, Suzuki Y. Exocytosis in colonic goblet cells visualized by video-enhanced light microscopy. Biochemical and Biophysical Research Communications. 1991;176:466–472. doi: 10.1016/0006-291x(91)90947-6. [DOI] [PubMed] [Google Scholar]
- Tohda H, Foskett JK, O'Brodovich H, Marunaka Y. Cl− regulation of Ca2+-activated non-selective cation channel in β-agonist-treated fetal distal lung epithelium. American Journal of Physiology. 1994;266:C105–109. doi: 10.1152/ajpcell.1994.266.1.C104. [DOI] [PubMed] [Google Scholar]
- Toyomoto T, Knutsen D, Soos G, Sato K. Na-K-2Cl cotransporters are present and regulated in simian eccrine clear cells. American Journal of Physiology. 1997;273:R270–277. doi: 10.1152/ajpregu.1997.273.1.R270. [DOI] [PubMed] [Google Scholar]
- Zhang GH, Cragoe EJ, Jr, Melvin JE. Na+ influx is mediated by Na+-K+-2Cl− cotransport and Na+-H+ exchange in sublingual mucous acini. American Journal of Physiology. 1993;264:C54–62. doi: 10.1152/ajpcell.1993.264.1.C54. [DOI] [PubMed] [Google Scholar]