

Abstract
Mitochondrial regulation of the cytosolic Ca2+ concentration ([Ca2+]c) in guinea-pig single colonic myocytes has been examined, using whole-cell recording, flash photolysis of caged InsP3 and microfluorimetry.
Depolarization increased [Ca2+]c and triggered contraction. Resting [Ca2+]c was virtually restored some 4 s after the end of depolarization, a time when the muscle had shortened to 50 % of its fully relaxed length. The muscle then slowly relaxed (t½ = 17 s).
The decline in the Ca2+ transient was monophasic but often undershot or overshot resting levels, depending on resting [Ca2+]c. The extent of the overshoot or undershoot increased with increasing peak [Ca2+]c.
Carbonyl cyanide m-chlorophenyl hydrazone (CCCP; 5 μM), which dissipates the mitochondrial proton electrochemical gradient and therefore prevents mitochondrial Ca2+ accumulation, slowed Ca2+ removal at high (> 300 nM) but not at lower [Ca2+]c and abolished [Ca2+]c overshoots. Oligomycin B (5 μM), which prevents mitchondrial ATP production, affected neither the rate of decline nor the magnitude of the overshoot.
During depolarization, the global rhod-2 signal (which represents the mitochondrial matrix Ca2+ concentration, [Ca2+]m) rose slowly in a CCCP-sensitive manner during and for about 3 s after depolarization had ended. [Ca2+]m then slowly decreased over tens of seconds.
Inhibition of sarcoplasmic reticulum Ca2+ uptake with thapsigargin (100 nM) reduced the undershoot and increased the overshoot.
Flash photolysis of caged InsP3 (20 μM) evoked reproducible increases in [Ca2+]c. CCCP (5 μM) reduced the magnitude of the [Ca2+]c transients evoked by flash photolysis of caged InsP3. Oligomycin B (5 μM) did not reduce the inhibition of the InsP3-induced Ca2+ transient by CCCP thus minimizing the possibility that CCCP lowered ATP levels by reversing the mitochondrial ATP synthase and so reducing SR Ca2+ refilling.
While CCCP reduced the magnitude of the InsP3-evoked Ca2+ signal, the internal Ca2+ store content, as assessed by the magnitude of ionomycin-evoked Ca2+ release, did not decrease significantly.
[Ca2+]c decline in smooth muscle, following depolarization, may involve mitochondrial Ca2+ uptake. Following InsP3-evoked Ca2+ release, mitochondrial uptake of Ca2+ may regulate the local [Ca2+]c near the InsP3 receptor so maintaining the sensitivity of the InsP3 receptor to release Ca2+ from the SR.
An increased cytosolic Ca2+ concentration ([Ca2+]c) is the major trigger for smooth muscle contraction; relaxation follows the return of [Ca2+]c to resting levels. Mechanisms which restore resting [Ca2+]c include a Ca2+ pump and a Na+-Ca2+ exchanger in the plasma membrane and a sarcoplasmic reticulum (SR) Ca2+ pump. The contribution of each varies with the smooth muscle, the mode of its activation and the experimental approach (see Kamishima & McCarron, 1998 for references). Despite reports of their low affinity for Ca2+, mitochondria are now also accepted as important regulators of [Ca2+]c (e.g. Fry et al. 1989; Rizzuto et al. 1993; Friel & Tsien, 1994; Werth & Thayer 1994; Budd & Nicholls, 1996; Drummond & Fay, 1996; Herrington et al. 1996). The strategic localization of mitochondria close to Ca2+ release or influx pathways may expose the mitochondria to microdomains of high Ca2+ and permit them to accumulate the ion even during small increases in the bulk average [Ca2+]c (Rizzuto et al. 1993).
Following large increases in [Ca2+]c, smooth muscle contraction can be fully sustained even after [Ca2+]c has been restored almost to resting levels. Maintained small increases in [Ca2+]c (e.g. following depolarization) may arise from a continued Ca2+ influx or, in some cells, from mitochondrial Ca2+ efflux (Friel & Tsuen, 1994; Herrington et al. 1996; Park et al. 1996).
In non-excitable cells, mitochondria may also regulate the inositol trisphosphate (InsP3)-sensitive internal Ca2+ store which is activated by G-protein-coupled receptors (Gamberucci et al. 1994; Marriot & Mason, 1995; Jouaville et al. 1995; Simpson & Russell, 1996; Hoth et al. 1997; Landolfi et al. 1998). Control of the InsP3-sensitive Ca2+ store by mitochondria may occur in several ways. For example, the maintenance of a low subsarcolemma Ca2+ concentration by mitochondria, in some cells, enables continued store-operated Ca2+ influx across the plasmalemma (Hoth et al. 1997; Landolfi et al. 1998). Alternatively, mitochondria may control the Ca2+ concentration near the InsP3 receptor so regulating the opening of this channel in response to InsP3 (Jouaville et al. 1995; Simpson & Russell, 1996). Mitochondrial control of ATP and/or ADP levels may also modulate the store-operated Ca2+ entry (Gamberucci et al. 1994; Mariot & Mason, 1995; Innocenti et al. 1996).
In contrast, little is known of the mitochondrial regulation of the InsP3-sensitive store in excitable cells. Accordingly, in the present study, the role of mitochondria in regulating the increases in [Ca2+]c evoked by its influx through voltage-dependent Ca2+ channels and by release from the InsP3-sensitive store has been examined in single smooth muscle cells. Ca2+ removal from the cytosol, following depolarization-evoked Ca2+ entry, was found to involve a rapid mitochondrial Ca2+ uptake. Following its subsequent efflux from mitochondria, this Ca2+ elevated [Ca2+]c for a prolonged period. Mitochondria also regulated the InsP3-sensitive store since inhibition of mitochondrial Ca2+ uptake resulted in a signficantly reduced magnitude of the InsP3-evoked Ca2+ transient. This reduction occurred even though the Ca2+ content of the internal store remained unchanged. A preliminary account of these findings has been presented to the Physiological Society (McCarron & Muir, 1998).
METHODS
From male guinea-pigs (500-700 g) stunned by a blow to the head and killed by exsanguination, a segment of distal colon (∼5 cm) was removed and transferred to a Sylgard-coated (Dow Corning) Petri dish containing an oxygenated (95 % O2-5 % CO2) physiological saline solution (PSS) of the following composition (mM): NaCl, 118.4; NaHCO3, 25; KCl, 4.7; NaH2PO4, 1.13; MgCl2, 1.3; CaCl2, 2.7; and glucose, 11 (pH 7.4). A longitudinal incision was made in the colon from the anal end, the submucosa removed and the circular muscle dissected from the longitudinal layer (Lim & Muir, 1983). Unless otherwise stated all experimental procedures were carried out at room temperature (20-22°C).
Cell dissociation
Strips of colonic circular muscle (2 × 0.5 cm) were placed in a solution containing (mM): NaCl, 137; KCl, 5; MgCl2, 1; CaCl2, 1.8; Hepes, 10; and glucose, 11 (pH adjusted to 7.4 with NaOH). Single cells were dissociated using a two-step enzymatic process. The muscle was initially digested (30 min at 35°C) with papain (1-4 mg ml−1) and dithioerythritol (0.5 mg ml−1) in a low Ca2+ solution containing (mM): sodium glutamate, 80; NaCl, 54; KCl, 5; MgCl2, 1; CaCl2, 0.1, Hepes, 10; glucose, 10; and 0.2, EDTA (to remove heavy metals); the pH adjusted at room temperature to 7.3 using NaOH. During a second incubation, the tissue was further digested (30 min at 35°C) in the low Ca2+ saline containing collagenase (type H or F; 1-3 mg ml−1) then rinsed several times with the enzyme-free low Ca2+ solution then again rinsed in Eagle's minimum essential spinner medium (S-MEM) lacking Ca2+ (GibcoBRL). Single smooth muscle cells were dispersed by trituration with a Pasteur pipette, stored at 4°C and used the same day.
Current recordings
Membrane currents were measured using conventional, whole-cell, tight seal recording. The composition of the extracellular solution was (mM): sodium glutamate, 80; NaCl, 40; tetraethylammonium chloride, 20; MgCl2, 1.1; CaCl2, 3; Hepes, 10; and glucose, 10 (pH 7.4 with NaOH). Unless otherwise stated, the pipette solution contained (mM): Cs2SO4, 85; CsCl, 20; MgCl2, 1; MgATP, 3; pyruvic acid, 2.5; malic acid, 2.5; NaH2PO4, 1; creatine phosphate, 5; GTP, 0.5; Hepes, 30; and fura-2 pentapotassium salt, 0.050 (if rhod-2 or fluo-3 was used fura-2 was omitted from the pipette solution). Whole-cell currents were amplified by an Axopatch 1D (Axon Instruments, Foster City, CA, USA), filtered at 500 Hz (8-pole bessel filter; Frequency Devices, Haverhill, MA, USA), and sampled at 1.5 kHz using a digidata interface pCLAMP software (version 6.0.1, Axon Instruments). In most cases, the duration of each voltage pulse was 1.6 s. To permit longer current recordings, the sampling frequency was reduced from 1.5 to 0.5 kHz after the first 1.2 s of the depolarization. Therefore, it was possible to obtain a current recording of 20 s. In some experiments recording time was increased further using Axotape (Axon Instruments).
Ca2+ measurements
[Ca2+]c was measured using the membrane-impermeable fura-2 (potassium salt, 50 μM) introduced into the cell from the patch pipette. Fluorescence measurements were made using a microfluorimeter consisting of an inverted fluorescence microscope (Nikon diaphot) and a photomultiplier tube with a bi-alkali photocathode. The excitation wavelengths (340 and 380 nm, 7 nm bandpass) were provided by a PTI deltascan (Photon Technology International Inc, East Sheen, London, UK). The cell was illuminated every 10 ms for 8.5 ms with each wavelength. [Ca2+]c measurements were made therefore at a frequency of 50 Hz. The excitation light passed through a 425 nm short pass filter (76 % transmission at 340 nm and 80 % transmission at 380 nm) and a field stop diaphragm was used to reduce background fluorescence. A 400 nm long pass dichroic mirror (94 % transmission at 510 nm) reflected the excitation wavelengths onto the cell. A 570 nm short pass dichroic mirror (82 % transmission at 510 nm) passed the emission light through a 505 nm barrier filter (60 nm bandpass, 88 % transmission at 510 nm) onto the photomultiplier for photon counting. Longer wavelengths from bright field illumination with a 610 nm Shott glass filter (90 % transmission) were reflected onto a CCD camera (Sony model XC-75) mounted onto the viewing port of the delta scan allowing the cell to be monitored during the course of the experiments. All interference filters and dichroic mirrors were obtained from Glen Spectra (London, UK). Background fluorescence was measured with the pipette attached to the cell but before rupturing the membrane. This background was subtracted from the fluorescence counts obtained during the experiments. The Kd for fura-2 was determined as 280 nM from an in vitro calibration. Rmin and Rmax were also determined from in vitro calibrations and decreased by 15 % to adjust for cell viscosity (Poenie, 1990).
Mitochondial matrix Ca2+ concentration [Ca2+]m was measured using the rhod-2 introduced into the cells in the AM form (5 μM). The AM ester of rhod-2 is positively charged and so will tend to partition into mitochondria in response to the large negative membrane potential (-150 mV to -180 mV) where the dye is cleaved and trapped. After loading, in whole-cell mode, cells were dialysed for at least 15 min to remove residual dye from the cytosol. However, to ensure [Ca2+]m was measured, at the end of each experiment carbonyl cyanide m-chlorophenylhydrazone (CCCP), which dissipates the mitochondrial membrane potential and therefore prevents mitochondrial Ca2+ accumulation, was applied. Rhod-2 was excited with light at 488 nm (7 nm bandpass) reflected off a 557 nm long pass dichroic mirror (94 % transmission). Emission light was passed through a 565 nm long pass filter (90 % transmission) to the photomultiplier, again operating in photon counting mode. Bright field illumination was not used during these experiments and background fluorescence was not subtracted.
When caged InsP3 was used, the longer wavelength non-ratiometric Ca2+ indicator fluo-3 (150 μM) was used to avoid photolysis of the caged compounds by the excitation light. The indicator was excited at 488 nm (bandpass 9 nm) through the epi-illumination port of the microscope (using one arm of a bifurcated quartz fibre optic bundle). Excitation light was reflected off a 505 nm long pass dichroic mirror and emission light was guided through a 535 nm barrier filter (bandpass 35 nm) to a photomultiplier in photon counting mode. To photolyse caged compounds, the output of a xenon flashlamp (Hi-Tech) was passed though a UG-5 filter to select ultraviolet light and merged into the excitation light path of the microfluorimeter using the second arm of the quartz bifurcated fibre optic bundle. The nominal flash lamp energy was 230 J with a flash duration of about 1 ms.
Analysis of [Ca2+]c decline
The rate of [Ca2+]c decline (dCa/dt) was measured as a function of the [Ca2+]c. Due to noise inherent in the high temporal resolution [Ca2+]c measurements, the raw data were smoothed using polynomial fits to the data beginning on the first data point after repolarization. The polynomial (5th-9th order) fit to the data was selected by the highest r2 value. The derivative was subsequently obtained by averaging the slopes of two adjacent data points. The rate of decline was expressed as a function of the [Ca2+]c.
When appropriate, results were expressed as means ±s.e.m. of n cells and the statistical test applied was Student's t test with P < 0.05 considered significant.
Drugs and chemicals
Fura-2 pentapotassium salt, fluo-3 pentapotassium salt and rhod-2 AM were purchased from Molecular Probes, Inc. (Eugene, OR, USA). Caged Ins(1,4,5)P3-trisodium salt and thapsigargin were purchased from Calbiochem-Novabiochem Ltd. Apart from these, all other reagents were purchased from Sigma, UK.
RESULTS
Effects of depolarization on [Ca2+]c
Depolarization to 0 mV, from a holding potential of -70 mV, triggered a Ca2+ current (ICa) and raised [Ca2+]c (Fig. 1). The mean [Ca2+]c increased from 98 ± 15 nM to 657 ± 45 nM (n = 44) during depolarization and fell towards resting levels after depolarization.
Figure 1.

Depolarization-evoked increases in [Ca2+]c and contraction
A depolarizing pulse to 0 mV (holding potential -70 mV, C) induced an inward ICa (B) and increased [Ca2+]c (A). The inset in A shows the [Ca2+]c, ICa and membrane voltage on an expanded time axis. Following the rise in [Ca2+]c contraction occurred (D); this reached a maximum at about the same time as the [Ca2+]c was returning to resting levels; thereafter the cell slowly relaxed with a half time of 17 s. However, [Ca2+]c remained slightly above resting levels for an extended time following depolarization. Time alignment of the video-taped contractile behaviour of the cell (E), with [Ca2+]c, was achieved by illumination of the cell with an LED triggered by depolarization. The depolarization and [Ca2+]c were also digitized and recorded on computer.
Depolarization-evoked increases in [Ca2+]c reflect mainly Ca2+ influx from the extracellular space. Store disruption with thapsigargin (100 nM), cyclopiazonic acid (10 μM) or ryanodine (50 μM) had little effect on the rise in [Ca2+]c produced by depolarization (not shown). The depolarization-evoked increase in [Ca2+]c evoked single cell contraction which peaked as [Ca2+]c was approaching resting levels (Fig. 1). Thereafter, the cell relaxed slowly with a t½ of 16.7 ± 7 s. For comparison, [Ca2+]c declined, following the end of the depolarizing pulse, with a t½ of 1.4 ± 0.1 s.
As it declined, [Ca2+]c either plateaued above (i.e. exceeded) resting levels (overshoot), or transiently fell beneath resting levels (undershoot; Fig. 2Aa and Ab) before returning. The overshoot averaged 22 ± 5 nM [Ca2+]c (n = 12; Fig. 2Aa) above resting levels and persisted, decaying with a t½ of 38 ± 6 s. During the undershoot [Ca2+]c fell to 22 ± 5 nM below resting levels and returned to resting levels in 14 ± 6 s (n = 12; Fig. 2Ab).
Figure 2. Variation in the characteristics of Ca2+ transients following depolarization.

Aa and b, following a depolarization to 0 mV (holding potential -70 mV), provided resting [Ca2+]c did not exceed 90 nM, the transient after an initial peak plateaued above resting levels (overshot) for a considerable period (tens of seconds) before slowly returning to resting levels (Aa). Following a depolarization to 0 mV (holding potential -70 mV), provided resting [Ca2+]c exceeded 90 nM, the transient undershot resting levels (Ab). The insets represent the information in Aa and Ab on semi-log scales. Ba and b, the ordinates represent the [Ca2+]c after depolarization minus the resting [Ca2+]c. A negative value thus indicates an undershoot and a positive value an overshoot. Whether or not an overshoot or undershoot occurred was determined by the values of the resting [Ca2+]c before depolarization and not by the peak [Ca2+]c achieved during the repolarization. Thus no correlation existed with peak [Ca2+]c (Bb) but a significant correlation between resting [Ca2+]c and overshooting and undershooting occurred (Ba). The lines plotted in Ba and Bb are linear regressions. Ca and b, plots of [Ca2+]c against time showed that the peak [Ca2+]c achieved during the depolarization determined the magnitude of the overshoot and undershoot. The peak [Ca2+]c was proportional to the magnitude of the overshoot and undershoot. The durations of the first and second depolarizing pulses were 500 and 1600 ms, respectively.
Whether or not an overshoot or undershoot was observed depended on the resting [Ca2+]c (Fig. 2Ba) but not upon the peak [Ca2+]c attained (Fig. 2Bb) though the extent of the overshoot or undershoot increased with increasing peak [Ca2+]c (Fig. 2A). When the resting [Ca2+]c exceeded about 90 nM, the Ca2+ transient was likely to undershoot following depolarization; when below about 90 nM the Ca2+ transient formed a plateau above resting levels, i.e. overshot.
Effects of CCCP on [Ca2+]c decline
The large proton electrochemical driving force is an electrochemical potential for mitochondrial Ca2+ uptake by the uniporter (see reviews by Nicholls & Ackerman, 1982; Gunter et al. 1994). The protonophore CCCP (5 μM) dissipates both the proton and electrical potential gradients and so prevents Ca2+ accumulation. Three to four minutes after the addition of CCCP, resting [Ca2+]c was not altered significantly (P > 0.05; 127 ± 27 nM before and 141 ± 34 nM after CCCP). However, CCCP increased the peak [Ca2+]c during the depolarization and slowed the subsequent rate of [Ca2+]c decline (Fig. 3). The peak [Ca2+]c during the depolarization increased from 637 ± 69 nM to 712 ± 71 nM after CCCP (P < 0.05,n = 10). Attenuation of the velocity of decline by CCCP, however, diminished as the [Ca2+]c fell towards resting levels (see Fig. 3). The average velocity of [Ca2+]c decline, in ten cells, before and after the addition of CCCP is illustrated in Fig. 3 (lower panel). The CCCP-sensitive component of [Ca2+]c decline, i.e. the inferred mitochondrial Ca2+ uptake, removed [Ca2+]c at a rate of about 100 nM s−1 at 600 nM [Ca2+]c but accounted little for its removal at concentrations below 300 nM.
Figure 3. The effect of CCCP on depolarization-evoked Ca2+ transients.
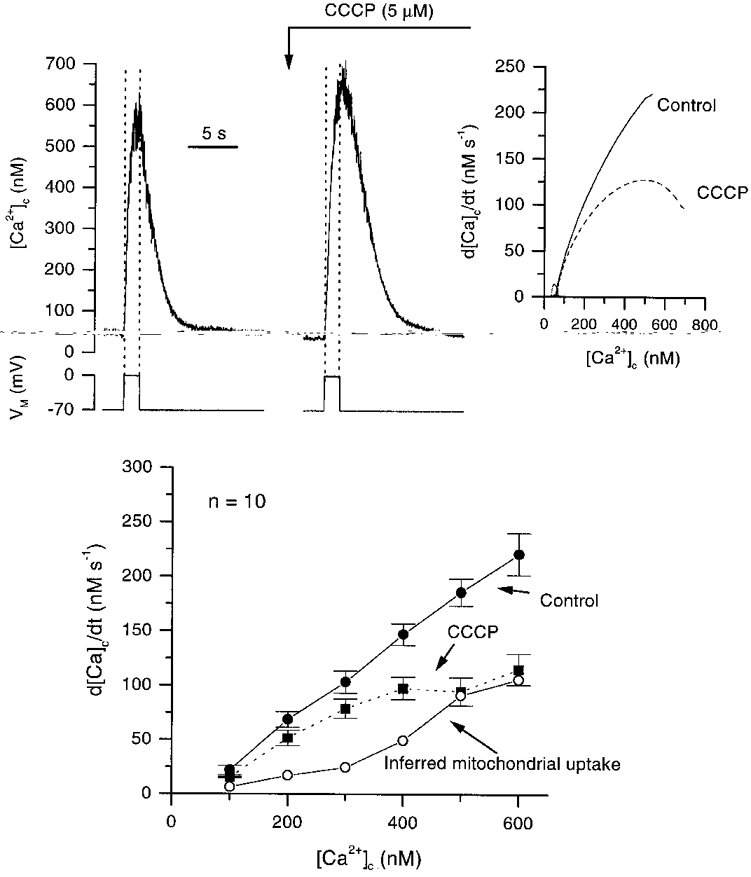
CCCP (5 μM) increased the peak [Ca2+]c achieved during the transient in response to a depolarizing pulse to 0 mV (holding pulse -70 mV) and slowed the rate of decline on repolarization compared with controls. The rate of decline of the two transients is shown on the upper right-hand panel. The derivative was obtained from high order polynomial fits to the declining phase of the transient (see Methods for full description). Lower panel is a summary of the rates of decline for ten cells in the presence and absence of CCCP. The inferred mitochondrial contribution to the decline of [Ca2+]c was obtained by subtracting control rates from those seen in CCCP.
CCCP abolishes overshoots but not undershoots
These experiments suggest that mitochondria could play a role in the decline of [Ca2+]c over the physiological [Ca2+]c range. Yet, disruption of the mitochondrial uptake of Ca2+ by CCCP did not attenuate the rate of decline of Ca2+ at low [Ca2+]c. Indeed, in those cells in which the [Ca2+]c overshot, the restoration of [Ca2+]c, following depolarization, was accelerated when mitochondrial Ca2+ uptake was inhibited as evidenced by CCCP's abolition of the overshoot (Fig. 4A). In three such cells the overshoot averaged 25 ± 14 nM in the absence and 0 ± 8 nM in the presence of CCCP. One explanation for this observation is that mitochondria rapidly accumulate Ca2+ at high [Ca2+]c, and subsequently export it as [Ca2+]c approaches resting levels (Werth & Thayer 1994; Herrington et al. 1996).
Figure 4. The effect of CCCP on the overshoots and undershoots of Ca2+ transients.
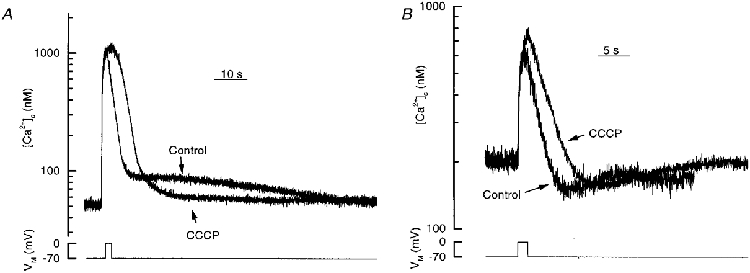
A, the control response displayed an overshoot which decayed with a half time of 38 ± 6 s (n = 12). In the presence of CCCP (5 μM), the overshoot was abolished. B, undershoots following depolarizations were not blocked by CCCP. [Ca2+]c is shown on a semi-log scale.
The undershoot, however, does not involve mitochondrial Ca2+ uptake since CCCP did not reduce its magnitude (Fig. 4A). Indeed in four experiments the [Ca2+]c during the undershoot averaged 39 ± 14 nM below resting levels before, and 38 ± 15 nM below resting levels after CCCP (5 μM). However, the time course of the undershoot to resting levels was significantly increased by CCCP from 13 ± 5 to 30 ± 5 s (n = 4). Presumably the increased time course in the presence of CCCP reflects a small mitochondrial release of Ca2+ that occurs during the undershoot under control conditions.
Effects of depolarization on [Ca2+]m
To test the possibility that mitochondria accumulate and then release Ca2+, [Ca2+]m was measured with rhod-2. A depolarizing pulse (1.6 s to 0 mV, holding potential -70 mV) increased [Ca2+]m. In contrast to [Ca2+]c, however, [Ca2+]m continued to rise after the end of the depolarizing pulse for about 3 s and thereafter declined (Fig. 5). Photon counts increased following the depolarization, peaked at 64 ± 13 (× 10−3) c.p.s. (n = 3) above resting levels then slowly decreased towards resting values with a t½ of 41 ± 7 s (n = 3). After CCCP (5 μM) little change in [Ca2+]m occurred following depolarization; photon counts peaked at 16 ± 4 (× 103) c.p.s. above resting levels (n = 3). The inset in Fig. 5 plots the same [Ca2+]m data on an expanded time axis together with the [Ca2+]c signal recorded with fura-2 (from a separate experiment). In cells displaying overshoots the plateau in [Ca2+]c was maintained during the decline in [Ca2+]m (Fig. 5 inset). Indeed, the decay of [Ca2+]m and the [Ca2+]c overshoot had similar time courses with half times of 41 ± 7 (n = 3) and 38 ± 6 s (n = 12), respectively, (P > 0.05). The rate of decline in [Ca2+]m was comparable with that of cardiac myocytes (Bassani et al. 1993; Zhou et al. 1998) but slower than that reported in other cells (e.g. Rizzuto et al. 1993, 1994; Babcock et al. 1997).
Figure 5. The effect of CCCP on the mitochondrial matrix Ca2+ concentration [Ca2+]m as measured by rhod-2.
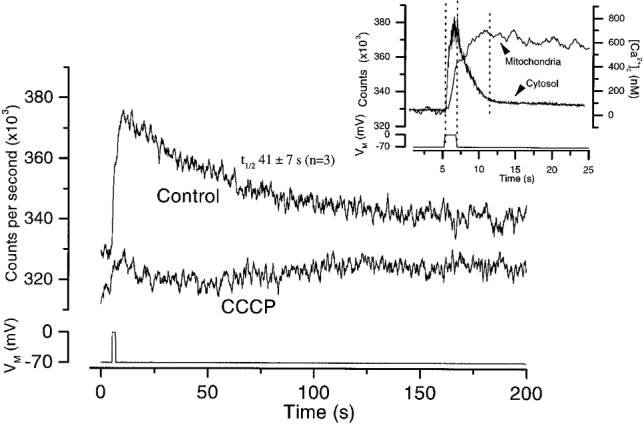
[Ca2+]m increased following a depolarization but more slowly than did increases in [Ca2+]c. Increases in [Ca2+]m were markedly inhibited by CCCP (5 μM). The inset is a composite figure of [Ca2+]m on an expanded time scale together with, for comparison, a representative [Ca2+]c change, from another cell, occurring with an identical depolarization.
Effects of oligomycin B on depolarization-evoked Ca2+ transients
In addition to blocking mitochondrial Ca2+ accumulation, CCCP also inhibits mitochondrial ATP production. Indeed, dissipating the proton gradient will result in the mitochondrial ATP synthase causing breakdown (rather than synthesis) of ATP. The potential depletion of ATP by CCCP could alter the kinetics of the Ca2+ transient, independently of any role mitochondria may have in removing Ca2+, due to a reduction of the ATP supply to Ca2+ pumps. As a control, therefore, an inhibitor of oxidative phosphorylation (oligomycin B, 5 μM) was used. Oligomycin B, while preventing ATP synthesis, leaves the proton gradient intact for Ca2+ transport. The rate of decline of [Ca2+]c in the presence of oligomycin B was comparable with that in its absence (Fig. 6). Apparently, in the absence of mitochondrial ATP synthesis, the Ca2+-ATPases are adequately supported by both the 3 mM ATP and 5 mM phosphocreatine in the patch pipette filling solution.
Figure 6. The effect of oligomycin B on Ca2+ transients.

A, oligomycin (5 μM) did not alter the peak [Ca2+]c transient markedly in response to a depolarizing pulse to 0 mV (holding pulse - 70) or slow the rate of decline of the Ca2+ transient following repolarization. B shows superimposed traces. C, summary of the rates of decline of Ca2+ with time in control and oligomycin B-treated cells (n = 4).
Effects of thapsigargin on [Ca2+]c undershoots and overshoots
Undershoots in [Ca2+]c following cell activation (Fig. 2) have been reported in several cell types, including smooth muscle (Becker et al. 1989). They may arise from a facilitated Ca2+ uptake into the SR (Baro et al. 1993). This possibility was examined in colonic myocytes using the SR Ca2+ pump inhibitor thapsigargin. Thapsigargin (100 nM; Fig. 7A) abolished the undershoot (from -38 ± 10 nM [Ca2+]c) below resting levels in controls to 4 ± 5 nM [Ca2+]c above resting levels in thapsigargin (n = 5), a result consistent with the undershoot occurring from an accelerated Ca2+ uptake into the SR.
Figure 7. The effects of thapsigargin on overshoots and undershoots of Ca2+ transients.

Inhibition of the sarcoplasmic reticulum Ca2+-ATPase with thapsigargin (100 nM) blocked the undershoot (A), but increased the overshoot (B).
Thapsigargin also increased the magnitude of the overshoot from 19 ± 4 nM [Ca2+]c above resting levels (controls) to 31 ± 3 nM (Fig. 7A; n = 4). This result is consistent with a maintained SR Ca2+ accumulation during the overshoot. Indeed, several studies have suggested a close proximity of the SR and mitochondria raising the possibility that mitochondria, by accumulating Ca2+, may regulate SR function because of their influence on microdomains of high [Ca2+]c (e.g. Jouaville et al. 1995).
Effect of CCCP on InsP3-evoked Ca2+ transients
Caged InsP3 (20 μM) was included in the patch pipette filling solution, together with the Ca2+ indicator fluo-3 (150 μM). Approximately reproducible liberation of Ca2+ from the internal store was achieved by flash photolysing caged InsP3 (Fig. 8A). On return towards resting levels the transient displayed a small overshoot, the baseline remaining elevated after InsP3-evoked Ca2+ release (Fig. 8A). In other cells, undershoots were also observed (not shown). However, small slow changes in the fluorescence signal, when fluo-3 is used as the [Ca2+]c indicator, are difficult to interpret since the contractile behaviour of the cells will alter the fluoresence signal obtained with the single wavelength indicator by changing the proportion of the cell in the image mask. In a separate series of experiments, uncaging InsP3 again evoked reproducible increases in [Ca2+]c. However, after the addition of CCCP, which itself produced a transient small increase in [Ca2+]c, presumably reflecting mitochondrial Ca2+ efflux, subsequent release of Ca2+ by InsP3 diminished (Fig. 8A and C). Thus after 3 min, CCCP had markedly reduced the InsP3-evoked Ca2+ transient to 0.39 ± 0.1 of the normalized control value of 1 (n = 6).
Figure 8. Effect of CCCP on InsP3-evoked Ca2+ release.
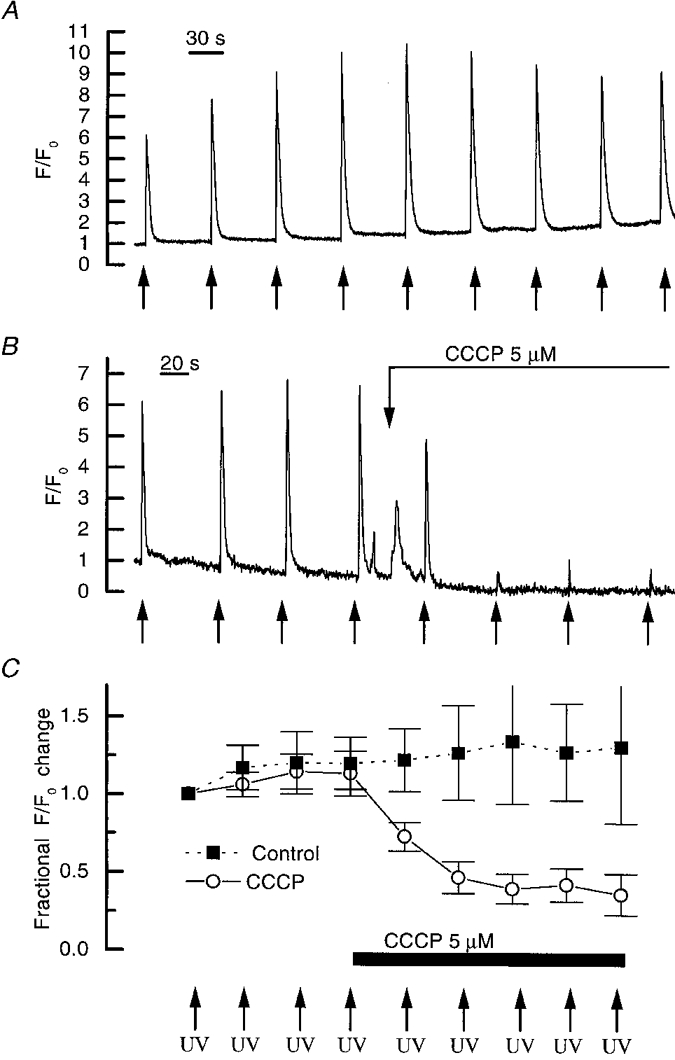
A, approximately reproducible increases in [Ca2+]c were evoked by uncaging InsP3. B, however, after disruption of mitochondrial [Ca2+]c accumulation with CCCP, the magnitude of the InsP3-evoked [Ca2+]c increase rapidly diminished. C summarizes control experiments ( n = 6) demonstrating reproducible increases in the fractional fluorescence ratio and the inhibition of increases by CCCP (n = 6). Arrows indicate UV flashes. The fluorescence data are plotted as the ratio of the measured fluorescence signal (F) with reference to the resting (F0).
By collapsing the mitochondrial proton gradient, CCCP will prevent mitochondrial ATP synthesis. To ensure that CCCP did not prevent SR refilling, by reduction of local ATP levels, cells were pre-treated with oligomycin B (5 μM), to block the mitochondrial ATP synthase, before addition of CCCP (5 μM). Pre-treatment with oligomycin did not reduce the ability of CCCP to inhibit the InsP3-evoked Ca2+ transient (n = 3; not shown).
One interpretation of these observations is that the mitochondria by uptake and release of Ca2+ contribute directly or indirectly to the refilling of the InsP3-sensitive store. Alternatively mitochondrial Ca2+ uptake may maintain a local low concentration of Ca2+ near the InsP3 receptor so preventing inactivation of the InsP3 receptor by Ca2+. To distinguish between these possibilities the Ca2+ store content was fully discharged with ionomycin in the presence and absence of CCCP (5 μM) and oligomycin B (5 μM). Ionomycin (1 μM) was added in a Ca2+-free bathing solution containing 1 mM EGTA and 3 mM MgCl2.
Mitochondrial disruption with CCCP and oligomycin did not alter the magnitude of the ionomycin-evoked Ca2+ transient despite a clear reduction of the InsP3-evoked Ca2+ transient (Fig. 9). Thus the time integrated fluoresence ratio (F/F0) averaged 213 ± 89 fluoresence ratio units under control conditions and 279 ± 114 fluoresence ratio units in the presence of CCCP and oligomycin. For comparison the integrated fluoresence ratio evoked by InsP3 from control cells was 20 ± 6 (n = 7) and in the cells treated with mitochondrial inhibitors (but before their addition) the integrated fluoresence ratio was 17 ± 5 (n = 7). In the CCCP and oligomycin B-treated cells the magnitude of the InsP3 transient was reduced by both drugs to 0.54 ± 0.06 of a normalized value of 1 (n = 7).
Figure 9. Effects of CCCP and oligomycin on InsP3- and ionomycin-evoked Ca2+ release.

A, uncaging InsP3 and ionomycin each increased [Ca2+]c. However while disruption of mitochondrial [Ca2+]c accumulation with CCCP reduced the magnitude of the InsP3-evoked [Ca2+]c (B), the ionomycin-evoked transient, in another cell, was not markedly reduced. The Ca2+-free bathing solution contained 1 mM EGTA and 3 mM MgCl2. The fluorescence data are plotted as the ratio of the measured fluorescence signal (F) with reference to the resting signal (F0).
DISCUSSION
Mitochondria are clearly important in the regulation of [Ca2+]c in colonic myocytes. The present findings show that during depolarization-evoked increases in [Ca2+]c, mitochondria rapidly accumulate and subsequently export Ca2+ as [Ca2+]c approached resting levels. Mitochondrial accumulation of Ca2+ contributed significantly to the decline of [Ca2+]c above a cytosolic Ca2+ concentration of 300 nM, consistent with the notion of a ‘set-point’ at which mitochondrial uptake and efflux are balanced (Nicholls, 1978). The efflux of Ca2+ from mitochondria, at low [Ca2+]c, led to a small elevation of [Ca2+]c that persisted for some tens of seconds after the depolarization had ended, co-incident with the slow rate of muscle relaxation.
Mitochondria also regulate the release of Ca2+ from the InsP3-sensitive store in colonic myocytes. Inhibition of mitochondrial Ca2+ accumulation decreased the magnitude of the InsP3-evoked Ca2+ transient. Mitochondrial inhibitors are known to decrease Ca2+ release from the InsP3-sensitive store in non-excitable cells, an effect attributed to mitochondrial regulation of cytosolic Ca2+ or ATP levels. For example, in lymphocytes and fibroblasts mitochondrial inhibitors decreased store-operated Ca2+ entry at the plasma membrane (Hoth et al. 1997; Landolfi et al. 1998). This has led to the proposal that mitochondrial Ca2+ uptake maintains low subsarcolemma Ca2+ levels, enabling prolonged store-operated Ca2+ entry. Additionally, in Xenopus oocytes and cultured oligodendrocytes, inhibition of mitochondrial uptake has led to alterations of local Ca2+ in the vicinity of the InsP3 receptor so modulating receptor opening in response to InsP3 (Jouaville et al. 1995; Simpson & Russell, 1996). Mitochondrial inhibitors of Ca2+ uptake may decrease store-operated Ca2+ entry or Ca2+ pump activity in the internal store by localized ATP depletion, alteration of the ATP/ADP ratio or increases in ADP. These activities may also modify InsP3-evoked Ca2+ release (Gamberucci et al. 1994; Mariot & Mason, 1995; Innocenti et al. 1996; Landolfi et al. 1998).
In the present study, mitochondrial depolarization with CCCP significantly reduced the InsP3-evoked Ca2+ transient. However, neither the Ca2+ store content, as evidenced by the magnitude of ionomycin-evoked Ca2+ transients, nor the SR Ca2+ pump activity, as measured by the magnitude of the undershoot, were altered by the mitochondrial inhibitors. These results suggest that neither store refilling nor ATP levels were significantly altered by disruption of mitochondria. Rather, the results are consistent with the regulation of Ca2+ near the InsP3 receptor by the drugs. Hence following InsP3-evoked Ca2+ release, local high concentrations of [Ca2+]c around the InsP3 receptor may have decreased the release of Ca2+ from the SR because of the Ca2+ dependency of the InsP3 receptor (Bezprozvanny et al. 1991; Hirose et al. 1998). Mitochondrial Ca2+ uptake, following InsP3-evoked Ca2+ release, by maintaining a local low [Ca2+]c, facilitates the release of Ca2+ by the InsP3 receptors.
Mitochondria remain important in Ca2+ homeostasis despite their uniporter having a low affinity for Ca2+ (Gunter & Pfeiffer, 1990). At least two explanations may reconcile this apparent anomaly; (a) the uniporter's affinity in vivo may be much higher than that determined from in vitro studies (see Gunter & Gunter, 1994 for references) and (b) higher concentrations of Ca2+ may reside nearer the mitochondria than elsewhere. Indeed, the uptake of Ca2+ by mitochondria in HeLa cells and hepatocytes, despite their low affinity for Ca2+, was attributed to microdomains of high Ca2+ near InsP3 receptors and/or Ca2+ channels in the plasma membrane (Rizzuto et al. 1994). Interestingly, the distribution of mitochondria within the cell may be related to the metabolic requirements of the cell and is far from random. In the endothelial cell line (ECV304), for example, less than 4 %, and in HeLa cells 65 % of mitochondria were within 700 nm of the endoplasmic reticulum. In ECV304 cells, 14 % and in HeLa cell less than 6 % of the mitochondria lay within 700 nm of the inner surface of the plasma membrane (Lawrie et al. 1996). Examination the of spatial relationship between the mitochondria and endoplasmic reticulum (ER) in HeLa cells revealed that the former comprised a large interconnected tubular network with numerous close contacts with the ER (Rizzuto et al. 1998). One functional consequence of this anatomical arrangement was that, on the release of Ca2+ from the ER by InsP3, the mitochondria were exposed to a higher concentration of Ca2+ than the cytosol (Rizzuto et al. 1998). The close apposition of mitochondria and SR in colonic myocytes is also suggested from the present results. [Ca2+]c overshoots, after depolarizations, were increased by blocking SR Ca2+ accumulation. Thus, both the accumulation of Ca2+ by the mitochondria and its efflux from them to the SR, may be facilitated by the close apposition of mitochondria and SR. The most obvious consequence of this strategic localization, as revealed by the present study, is the control by mitochondria of InsP3-evoked Ca2+ release as a result of their regulating the local [Ca2+]c in the vicinity of the InsP3 receptor.
Evidence for the involvement of mitochondria in the present study, relied, in part, on the use rhod-2 AM, a lipophilic cationic dye which largely accumulates in the organelle (e.g. Babcock et al. 1997; Peng et al. 1998). Although a fraction of the dye would have remained in the cytosol, even after dialysis, there is little likelihood that the depolarization-evoked rhod-2 signal was cytosolic in origin. Immediately after the test depolarization, CCCP was applied and the depolarization repeated some 3-4 min later. CCCP blocked the depolarization-evoked rhod-2 signal (Fig. 5); had the latter been cytosolic in origin it would have been increased by the drug (Figs 3 and 4).
The view that mitochondria are important in the regulation of cellular Ca2+ in the present study also depends on the selectivity of CCCP as an inhibitor of mitochondrial Ca2+ accumulation. One possible complication of its use is that SR Ca2+ accumulation may require a SR proton gradient which could also be disrupted by the protonophore. Although the plasmalemma Ca2+ pump transports H+ as a counter ion (see Carafoli, 1992 for references), whether or not the SR Ca2+ uptake involves such a mechanism is unclear (but see Inesi, 1985). Active transport of Ca2+ from the SR is electrogenic and could develop large membrane voltages (Meissner, 1981). A secondary passive outflow of K+ or H+ from the SR, following Ca2+ accumulation, maintains pump activity by balancing charge movements across the SR membrane. Under these conditions an increased proton permeability (with CCCP) would increase, rather than decrease, Ca2+ accumulation by the SR. Additionally, were CCCP to inhibit Ca2+ accumulation by the SR, then the effects of CCCP and thapsigargin on the Ca2+ transient should be similar. This was not observed; thapsigargin increased depolarization-evoked [Ca2+]c overshoots and blocked [Ca2+]c undershoots, while CCCP blocked only the overshoots. Nor are the effects of CCCP likely to have arisen from a change in cytosolic pH or the ATP: ADP ratio. Throughout the present investigation, cells were dialysed with a high concentration of Hepes buffer (30 mM) together with 3 mM ATP and 5 mM creatine phosphate to minimize these possibilities.
An increase in mitochondrial-matrix Ca2+ co-ordinates an increased production of ATP by mitochondria (McCormack et al. 1990; Denton & McCormack 1990; Duchen 1992; Hajnoczky et al. 1995; Rutter et al. 1996; Peuchen et al. 1996). During periods of elevated [Ca2+]c the resulting increased contractile behaviour will be matched by an increased ATP supply. The persistent elevation of [Ca2+]c, as a result of its efflux from the mitochondria, may also form part of a ‘pulse stretching mechanism’ (Park et al. 1996) that may be of particular significance in smooth muscle. During sustained activation, the largest increase in [Ca2+]c and myosin phosphorylation occurs generally in the first 60 s, after which both decline even though tone remains. This, the ‘latch state’, is characterized by a decreased rate of cross bridge cycling and ATP utilization and it enables smooth muscle to maintain force at relatively low [Ca2+]c. The mitochondrial export of Ca2+ may prolong the contractile response observed to transient activation during the latch state.
When resting [Ca2+]c was greater than 90 nM, Ca2+ transients undershot following depolarization. At higher [Ca2+]c, when presumably the cell is activated, the undershoot may act as a negative feedback system reducing contractile behaviour. Conversely the overshoot, at low [Ca2+]c when the cell is quiescent, by increasing [Ca2+]c may act as a positive feedback system to increase contractile activity.
Together the data presented here suggest that mitochondria play a central role in regulating Ca2+ in smooth muscle. Mitochondrial Ca2+ uptake and export, while presumably altering mitochondrial ATP production, may also regulate InsP3-evoked Ca2+ release by controlling the local Ca2+ concentration around the InsP3 receptor and possibly force production through persistent elevations in [Ca2+]c.
Acknowledgments
The authors are grateful for the advice and expertise of Dr P. L. Becker (Emory University, Atlanta, USA) and the constructive suggestions of the Editor. J. McC. was funded by The Wellcome Trust (054328/Z/98/Z) and British Heart Foundation.
References
- Babcock DF, Herrington J, Goodwin PC, Park YB, Hille B. Mitochondrial participation in the intracellular Ca2+ network. Journal of Cell Biology. 1997;136:833–844. doi: 10.1083/jcb.136.4.833. [DOI] [PMC free article] [PubMed] [Google Scholar]
- Bassani JWM, Bassani RA, Bers DM. Ca2+ cycling between sarcoplasmic reticulum and mitochondria in rabbit cardiac myocytes. The Journal of Physiology. 1993;460:603–621. doi: 10.1113/jphysiol.1993.sp019489. [DOI] [PMC free article] [PubMed] [Google Scholar]
- Baro I, O'Neill SC, Eisner DA. Changes of intracellular [Ca2+] during refilling of sarcoplasmic reticulum in rat ventricular and vascular smooth muscle. The Journal of Physiology. 1993;465:21–41. doi: 10.1113/jphysiol.1993.sp019664. [DOI] [PMC free article] [PubMed] [Google Scholar]
- Becker PL, Singer JJ, Walsh JV, Fay FS. Regulation of calcium concentration in voltage-clamped smooth muscle cells. Science. 1989;244:211–214. doi: 10.1126/science.2704996. [DOI] [PubMed] [Google Scholar]
- Bezprozvanny I, Watras J, Ehrlich BE. Bell-shaped calcium-response curves of Ins(1,4,5)P3- and calcium-gated channels from endoplasmic reticulum of cerebellum. Nature. 1991;351:751–754. doi: 10.1038/351751a0. [DOI] [PubMed] [Google Scholar]
- Budd SL, Nicholls DG. A re-evaluation of the role of mitochondria in neuronal Ca2+ homeostasis. Journal of Neurochemistry. 1996;66:403–411. doi: 10.1046/j.1471-4159.1996.66010403.x. [DOI] [PubMed] [Google Scholar]
- Carafoli E. The Ca2+ pump of the plasma membrane. Journal of Biological Chemistry. 1992;267:2115–2118. [PubMed] [Google Scholar]
- Denton RM, McCormack JG. Ca2+ as a second messenger within mitochondria of the heart and other tissues. Annual Review of Physiology. 1990;52:451–466. doi: 10.1146/annurev.ph.52.030190.002315. 10.1146/annurev.ph.52.030190.002315. [DOI] [PubMed] [Google Scholar]
- Drummond RM, Fay FS. Mitochondria contribute to Ca2+ removal in smooth muscle cells. Pflügers Archiv. 1996;431:473–482. doi: 10.1007/BF02191893. [DOI] [PubMed] [Google Scholar]
- Duchen MR. Ca2+-dependent changes in the mitochondrial energetics in single dissociated mouse sensory neurons. Biochemical Journal. 1992;283:41–50. doi: 10.1042/bj2830041. [DOI] [PMC free article] [PubMed] [Google Scholar]
- Friel DD, Tsien RW. An FCCP-sensitive Ca2+ store in bullfrog sympathetic neurons and its participation in stimulus-evoked changes in [Ca2+]i. Journal of Neuroscience. 1994;14:4007–4024. doi: 10.1523/JNEUROSCI.14-07-04007.1994. [DOI] [PMC free article] [PubMed] [Google Scholar]
- Fry CH, Miller DJ, Harding DP, Harrison SM. The contribution of mitochondrial calcium ion exchange to relaxation of tension in cardiac muscle. Molecular and Cellular Biochemistry. 1989;89:127–133. doi: 10.1007/BF00220764. [DOI] [PubMed] [Google Scholar]
- Gamberucci A, Innocenti B, Fulceri R, Banegyi G, Giunti R, Pozzan T, Benedetti A. Modulation of Ca2+ influx dependent on store depletion by intracellular adenine-guanine nucleotide levels. Journal of Biological Chemistry. 1994;269:23597–23602. [PubMed] [Google Scholar]
- Gunter TE, Pfeiffer DR. Mechanisms by which mitochondria transport calcium. American Journal of Physiology. 1990;258:C755–786. doi: 10.1152/ajpcell.1990.258.5.C755. [DOI] [PubMed] [Google Scholar]
- Gunter TE, Gunter KK, Sheu S-S, Gavin CE. Mitochondrial calcium transport: physiology and pathological revelance. American Journal of Physiology. 1994;267:C313–339. doi: 10.1152/ajpcell.1994.267.2.C313. [DOI] [PubMed] [Google Scholar]
- Gunter KK, Gunter TE. Transport of calcium by mitochondria. Journal of Bioenergetics and Biomembranes. 1994;26:471–485. doi: 10.1007/BF00762732. [DOI] [PubMed] [Google Scholar]
- Hajnoczky G, Robb-Gaspers LD, Seitz MD, Thomas AP. Decoding of cytosolic calcium oscillations in the mitochondria. Cell. 1995;82:415–424. doi: 10.1016/0092-8674(95)90430-1. [DOI] [PubMed] [Google Scholar]
- Herrington J, Park YB, Babcock DF, Hille B. Dominant role of the mitochondria in clearance of large Ca2+ loads from rat adrenal chromaffin cells. Neuron. 1996;16:219–228. doi: 10.1016/s0896-6273(00)80038-0. [DOI] [PubMed] [Google Scholar]
- Hirose K, Kadowaki S, Iino M. Allosteric regulation by cytoplasmic Ca2+ and IP3 of the gating of IP3 receptors in permeabilized guinea-pig vascular smooth muscle. The Journal of Physiology. 1998;506:407–414. doi: 10.1111/j.1469-7793.1998.407bw.x. [DOI] [PMC free article] [PubMed] [Google Scholar]
- Hoth M, Fanger CM, Lewis RS. Mitochondrial regulation of store-operated calcium signalling in T lymphocytes. Journal of Cell Biology. 1997;137:633–648. doi: 10.1083/jcb.137.3.633. [DOI] [PMC free article] [PubMed] [Google Scholar]
- Inesi G. Mechanisms of calcium transport. Annual Review of Physiology. 1985;47:573–601. doi: 10.1146/annurev.ph.47.030185.003041. [DOI] [PubMed] [Google Scholar]
- Innocenti B, Pozzan T, Fasolato C. Intracellular ADP modulates the Ca2+ release-activated Ca2+ current in a temperature- and Ca2+-dependent way. Journal of Biological Chemistry. 1996;271:8582–8587. doi: 10.1074/jbc.271.15.8582. [DOI] [PubMed] [Google Scholar]
- Jouaville LS, Ichas F, Holmuhamedov EL, Camacho P, Lechieter JD. Synchronization of calcium waves by mitochondrial substrates in Xenopus laevis oocytes. Nature. 1995;377:438–441. doi: 10.1038/377438a0. [DOI] [PubMed] [Google Scholar]
- Kamishima T, McCarron JG. Ca2+ removal mechanisms in rat cerebral resistance size arteries. Biophysical Journal. 1998;75:1767–1773. doi: 10.1016/S0006-3495(98)77618-0. [DOI] [PMC free article] [PubMed] [Google Scholar]
- Landolfi B, Curci S, Debellis L, Pozzan T, Hofer AM. Ca2+ homeostasis in the agonist-sensitive internal store: Functional interactions between mitochondria and the ER measured in situ in intact cells. Journal of Cell Biology. 1998;142:1235–1243. doi: 10.1083/jcb.142.5.1235. [DOI] [PMC free article] [PubMed] [Google Scholar]
- Lawrie AM, Rizzuto R, Pozzan T, Simpson AWN. A role for calcium influx in the regulation of mitochondrial calcium in endothelial cells. Journal of Biological Chemistry. 1996;271:10753–10759. doi: 10.1074/jbc.271.18.10753. [DOI] [PubMed] [Google Scholar]
- Lim SP, Muir TC. Mechanisms underlying the electrical and mechanical responses of the guinea-pig internal anal spincter to field stimulation and drugs. British Journal of Pharmacology. 1983;86:427–437. doi: 10.1111/j.1476-5381.1985.tb08912.x. [DOI] [PMC free article] [PubMed] [Google Scholar]
- McCarron JG, Muir TC. Mitochondrial regulation of the cytosolic calcium concentration in guinea-pig colonic smooth muscle. The Journal of Physiology. 1998;509.P:28–29P. doi: 10.1111/j.1469-7793.1999.149aa.x. [DOI] [PMC free article] [PubMed] [Google Scholar]
- McCormack JG, Halestrap AP, Denton RM. Role of calcium ions in regulation of mammalian intramitochondrial metabolism. Physiological Reviews. 1990;70:391–425. doi: 10.1152/physrev.1990.70.2.391. [DOI] [PubMed] [Google Scholar]
- Marriot I, Mason MJ. ATP depletion inhibits capacitative Ca2+ entry in rat thymic lymphocytes. American Journal of Physiology. 1995;269:C766–774. doi: 10.1152/ajpcell.1995.269.3.C766. [DOI] [PubMed] [Google Scholar]
- Meissner G. Calcium transport and monovalent cation and proton fluxes in sarcoplasmic reticulum vesicles. Journal of Biological Chemistry. 1981;256:636–643. [PubMed] [Google Scholar]
- Nicholls DG, Akerman K. Mitochondrial calcium transport. Biochimica et Biophysica Acta. 1982;683:57–88. doi: 10.1016/0304-4173(82)90013-1. [DOI] [PubMed] [Google Scholar]
- Nicholls DG. The regulation of extra-mitochondrial free Ca2+ by rat liver mitochondria. Biochemical Journal. 1978;176:463–474. doi: 10.1042/bj1760463. [DOI] [PMC free article] [PubMed] [Google Scholar]
- Park YB, Herrington J, Babcock DF, Hille B. Ca2+ clearance mechanisms in isolated rat adrenal chromaffin cells. The Journal of Physiology. 1996;492:329–346. doi: 10.1113/jphysiol.1996.sp021312. [DOI] [PMC free article] [PubMed] [Google Scholar]
- Peng TI, Jou MJ, Sheu SS, Greenamyre JT. Visualization of NMDA receptor-induced mitochondrial calcium accumulation in striatal neurons. Experimental Neurology. 1998;149:1–12. doi: 10.1006/exnr.1997.6599. [DOI] [PubMed] [Google Scholar]
- Peuchen S, Duchen MR, Clark JB. Energy metabolism of adult astrocytes in vitro. Neuroscience. 1996;71:855–883. doi: 10.1016/0306-4522(95)00480-7. [DOI] [PubMed] [Google Scholar]
- Poenie M. Alteration of intracellular fura-2 fluorescence by viscosity. A simple correction. Cell Calcium. 1990;11:85–91. doi: 10.1016/0143-4160(90)90062-y. [DOI] [PubMed] [Google Scholar]
- Rizzuto RC, Bastianutto M, Brini M, Pozzan T. Mitochondrial calcium homeostasis in intact cells. Journal of Cell Biology. 1994;126:1183–1194. doi: 10.1083/jcb.126.5.1183. [DOI] [PMC free article] [PubMed] [Google Scholar]
- Rizzuto R, Brini M, Murgia M, Pozzan T. Microdomains with high Ca2+ close to IP3-sensitive channels that are sensed by neighbouring mitochondria. Science. 1993;262:744–747. doi: 10.1126/science.8235595. [DOI] [PubMed] [Google Scholar]
- Rizzuto R, Pinton P, Carrington W, Fay FS, Fogarty KE, Lifshitz LM, Tuft RA. Close contacts with the endoplasmic reticulum as determinants of mitochondrial Ca2+ responses. Science. 1998;280:1763–1766. doi: 10.1126/science.280.5370.1763. [DOI] [PubMed] [Google Scholar]
- Rutter GA, Burnett R, Ruzzuto M, Brini M, Murgia M, Pozzan T, Tavare JM, Denton RM. Subcellular imaging of intramitochondrial Ca2+ with recombinant targeted aquorin: significance for the regulation of pyruvate dehydrogenase activity. Proceedings of the National Academy of Sciences of the USA. 1996;93:5489–5494. doi: 10.1073/pnas.93.11.5489. [DOI] [PMC free article] [PubMed] [Google Scholar]
- Simpson PB, Russell JT. Mitochondria support inositol 1,4,5-trisphosphate-mediated waves in cultured oligodendrocytes. Journal of Biological Chemistry. 1996;271:33493–33501. doi: 10.1074/jbc.271.52.33493. [DOI] [PubMed] [Google Scholar]
- Werth JL, Thayer SA. Mitochondria buffer physiological calcium loads in cultured rat dorsal root ganglion neurons. Journal of Neuroscience. 1994;14:348–356. doi: 10.1523/JNEUROSCI.14-01-00348.1994. [DOI] [PMC free article] [PubMed] [Google Scholar]
- Zhou Z, Matlib MA, Bers DM. Cytosolic and mitochondrial Ca2+ signals in patch clamped mammalian ventricular myocytes. The Journal of Physiology. 1998;507:379–403. doi: 10.1111/j.1469-7793.1998.379bt.x. [DOI] [PMC free article] [PubMed] [Google Scholar]