

Abstract
Recent investigations have shown that the glycoprotein erythropoietin (Epo) and its specific receptor (EpoR) are present in the mammalian brain including human, monkey and mouse. These findings suggest a local action of Epo in the nervous system. The aim of this study was to elucidate a possible functional interaction of Epo with neuronal cells.
To examine the influence of externally applied Epo on Ca2+ homeostasis the human neuroblastoma cell line SK-N-MC was chosen as a suitable in vitro model for undifferentiated neuronal cells.
Expression of the EpoR in SK-N-MC cells was detected by reverse transcription-PCR, Western blot and immunofluorescence analysis.
Patch-clamp studies of SK-N-MC cells confirmed the expression of T-type Ca2+ channels, whose peak macroscopic current was increased by the addition of recombinant human Epo (rhEpo) to the bathing medium.
Confocal laser scanning microscopy analysis of SK-N-MC cells confirmed a transient increase in intracellular free [Ca2+] in response to externally applied rhEpo.
The transient response to Epo was dependent on external Ca2+ and remained even after depletion of internal Ca2+ stores by caffeine or thapsigargin. However, after depletion the response to Epo was absent when cells were superfused with the T-type Ca2+ channel blocker flunarizine.
This study demonstrates that Epo can interact with neuronal cells by affecting Ca2+ homeostasis through an increase in Ca2+ influx via plasma membrane T-type voltage-dependent Ca2+ channels.
Erythropoietin (Epo), the principal regulator of erythropoiesis, is a glycoprotein hormone produced primarily in the adult kidney and fetal liver (for review see Jelkmann, 1992; Fisher, 1997). The levels of Epo in the organism are regulated by oxygen tension since hypoxic conditions increase Epo gene expression. Erythroid precursor cells, which occur in the adult bone marrow and fetal liver, are known to express the Epo receptor (EpoR) on the cell surface. Binding of Epo to its receptor induces differentiation and proliferation of these precursor cells (for review see Damen & Krystal, 1996).
Recently, EpoR expression has also been observed in the central nervous system and in neuronal cell lines. In particular, a functional EpoR was detected in PC12 and SN6 cells, two cell lines with neuronal characteristics (Masuda et al. 1993). Specific Epo binding sites have been localized in specific areas of the adult mouse brain, including hippocampus and cerebral cortex (Digicaylioglu et al. 1995). More recently, expression of EpoRs was also demonstrated at the mRNA level in human and monkey brain (Marti et al. 1996, 1997; Juul et al. 1998) and in primary cultures of rat hippocampal and cerebral cortical neurones (Morishita et al. 1997). Due to the blood-brain barrier, which selectively separates the brain circulation from that of the rest of the organism, a local production of and a role for Epo were suggested. The observation that Epo is produced in astrocytes implied a paracrine action of Epo in which Epo would be released by astrocytes and then bind to the EpoR on adjacent neurones (Masuda et al. 1994; Marti et al. 1996). Initial studies have provided evidence for Epo action in the central nervous system: for example Epo increased the survival of rat cholinergic septal neurones lesioned by fimbria-fornix transactions, and augmented choline acetyltransferase activity in primary cultured mouse septal neurones and in a cholinergic hybridoma cell line (Konishi et al. 1993). EpoR expression during development of the mouse brain (Liu et al. 1997) and the human spinal cord (Juul et al. 1998) was demonstrated, perhaps indicating a role for Epo in the differentiation of the brain. Recently, Morishita et al. (1997) showed that Epo prevents glutamate-induced neuronal death of rat hippocampal and cortical neurones. However, it is not clear so far how Epo acts in neuronal cells, and which signal transduction mechanisms mediate the observed effects. Studies in erythroid precursors suggest that Epo elevates intracellular Ca2+ levels through voltage-independent Ca2+ channels (Miller & Cheung, 1994). Similarly, Epo induced a rapid and transient increase of intracellular Ca2+ levels in the rat phaeochromocytoma cell line PC12 (Masuda et al. 1993).
In this study, we investigated whether recombinant human Epo (rhEpo) could affect Ca2+ homeostasis in the neurone-derived human cell line SK-N-MC. We demonstrate that the EpoR is expressed in these cells and that Epo stimulates the activity of T-type voltage-dependent Ca2+ channels. Our results suggest a possible role for Epo in the brain through regulation of Ca2+ homeostasis in neurones by modulation of Ca2+ channels.
METHODS
Cell culture
The human neuroblastoma cell line SK-N-MC (American Type Culture Collection HTB-10, Rockville, MD, USA) was cultivated in Dulbecco's modified Eagle's medium (DMEM; Gibco-BRL) supplemented with 10 % heat-inactivated fetal calf serum (FCS; Boehringer-Mannheim), 100 u ml−1 penicillin, 100 mg ml−1 streptomycin (both from Sigma), 1 × minimal essential medium non-essential amino acids, 2 mM L-glutamine and 1 mM sodium pyruvate (all Gibco-BRL) in a humidified atmosphere containing 5 % CO2 at 37°C.
The human Epo-dependent leukaemia cell line UT-7 (a generous gift from C. Lacombe, ICGM, Paris, France) was cultivated as described above with the addition of 1 u ml−1 rhEpo (Boehringer-Mannheim) to the medium.
RNA preparation and reverse transcription (RT)-PCR
Total RNA was isolated from the two cell lines according to the method of Chomczynski & Sacchi (1987), with some modifications. One millilitre of the denaturing solution D was added to 107 cells. Solution D contained 4 M guanidine thiocyanate (Fluka Chemie AG, Buchs, Switzerland), 25 mM sodium citrate pH 7 (Sigma), 0·5 % sarcosyl (Sigma) and 0·1 M 2-mercaptoethanol (Sigma). Total RNA was separated from DNA and protein by adding 0·1 ml of 2 mM sodium acetate pH 4, 1 ml of water-saturated phenol and 0·2 ml of chloroform-isoamyl alcohol (49 : 1). After mixing, the suspension was chilled on ice for 15 min and then centrifuged at 10 000 g for 20 min at 4°C. The RNA present in the aqueous phase was precipitated with isopropanol (Sigma) at -20°C for 1 h, followed by centrifugation at 10 000 g for 30 min at 4°C. The precipitation in isopropanol was repeated after having dissolved the pellet again in solution D. Finally, the RNA was washed in 75 % ethanol, centrifuged for 8 min at 15 000 g at 4°C and vacuum dried (15 min). The pelleted RNA was then dissolved in diethyl pyrocarbonate (DEPC)-treated water by heating at 65°C for 10 min. Resuspended RNA was quantified by spectrophotometric absorbance at 260 nm. Total RNA (10 μg) from both SK-N-MC and UT-7 cells was reverse transcribed into cDNA according to the instructions provided with the Promega Reverse Transcription System (Promega, Catalysis AG, Wallisellen, Switzerland). PCR for the human EpoR was performed using a sense primer to exon 3 (5′-ACCGTGTCATCCACATCAAT-3′) and an antisense primer to exon 7 (5′-GCCTTCAAACTCGCTCTCTG-3′) (Marti et al. 1996). The amplification profile (35 cycles) was 94°C for 1 min, 61°C for 1 min and 72°C for 1·5 min. The resulting PCR fragments were visualized on ethidium bromide-stained 1 % agarose gels.
Western blot analysis
Total cellular lysates from the cell lines SK-N-MC and UT-7 (105 cells) were prepared using RIPA buffer consisting of 10 mM TrisCl pH 8·0, 1 mM EDTA, 150 mM NaCl, 1 % Triton X-100 (Sigma), 1 % sodium deoxycholate and 0·1 % SDS. The lysates (10 μg protein per slot) as well as (0·5 μg per slot) recombinant soluble human EpoR (rhEposR; 307-ER-050, R&D systems, UK), as a control, were separated by SDS-PAGE on a 7·5 % gel at 100 mV for 40 min and transferred onto a nitrocellulose membrane. After blocking overnight at 4°C with 4 % non-fat milk in phosphate-buffered saline (PBS; consisting of 140 mM NaCl, 3 mM KCl, 8 mM Na2HPO4 and 1·5 mM KH2PO4, pH 7·4), the nitrocellulose filter was incubated with a mouse monoclonal antibody (1 : 100 in 4 % milk) raised against the human EpoR (mh2er/7.9.2, a generous gift from Genetics Institute, Cambridge, MA, USA) for 2 h at room temperature. The membrane was then washed three times with PBS and immersed in 4 % milk in PBS containing peroxidase-conjugated goat anti-mouse IgG (Pierce Chemical Company, Rockford, IL, USA; dilution 1 : 5000) for 1 h at room temperature (22-25°C). Protein signals were detected by an enhanced chemiluminescence Western blotting detection system (Pierce).
Immunofluorescence
For immunofluorescence analysis, SK-N-MC cells were grown on glass coverslips for 3 days and then fixed for 10 min with 4 % formaldehyde in PBS (pH 7·5), followed by extensive washing with PBS. The cells were permeabilized with 0·2 % Triton X-100 in PBS for 5 min and then carefully washed with PBS. Application of the primary antibodies was preceded by blocking the cells with 10 % FCS in PBS for 30 min. Two different monoclonal antibodies against the human EpoR were used: mh2er/7.9.2 and mh2er/16.5.1 at a 1 : 10 dilution (Genetics Institute, Andover, MA, USA). In addition, we used a 1 : 100 dilution of a monoclonal antibody against MAP1b (Sigma), the major microtubule-associated protein in the developing brain. Incubation with the primary antibody was performed at room temperature for 2 h, followed by careful washing with PBS. For secondary labelling, the cells were incubated with a CY3-conjugated donkey anti-mouse secondary antibody (Jackson ImmunoResearch Laboratories, Inc., West Grove, PA, USA; 1 : 200 dilution) for 45 min at room temperature and then washed with PBS. The coverslips were mounted with mounting solution containing 1·5 % DABCO (1,4-diazabicyclo[2.2.2]octane, Sigma) and 90 % glycerol in PBS (pH 8·6). Fluorescence microscopy was carried out with a BioRad MRC 600 confocal microscope (Glattbrugg, Switzerland).
Electrophysiology and data analysis
All experiments were performed at room temperature using the patch-clamp technique in the whole-cell configuration. Three days after passage, SK-N-MC cells were washed in a bath solution consisting of (mM): 130 NaCl, 5 KCl, 1 MgCl2, 10 CaCl2, 5 glucose, 10 Hepes and 0·0015 tetrodotoxin (TTX), adjusted to pH 7·4. The pipette for the whole-cell recording was filled with an intracellular-like solution containing (mM): 140 CsCl, 4 NaCl, 5 EGTA, 2 MgCl2, 0·5 CaCl2 and 10 Hepes (pH 7·2). Patch pipettes were pulled from borosilicate glass capillaries using a programmable pipette puller (BB-CH-PC, Mecanex SA, Switzerland). After fire polishing the tips to an internal diameter of approximately 2-3 μm, the electrodes had resistances typically in the range 3-7 MΩ. All the cells in a Petri dish were continuously superfused with the control bath solution, whereas the single cell tested during one experiment was locally superfused with the use of a small pipette placed above the cell. Depending on the experiments, the test solutions consisted of the normal bath solution with the addition of the Ca2+ channel blockers NiCl2 (2 mM) and diphenylpiperazine flunarizine (500 μM) (both from Sigma) or different concentrations of rhEpo. The cell membrane voltage was held at -100 mV and whole-cell currents were recorded in response to depolarizing steps at different test potentials. Currents were measured and filtered at 2 kHz with an Axopatch 200A amplifier (Axon Instruments Inc.). Data were stored and analysed using a PC-based data acquisition system, DATAC (Bertrand & Bader, 1986).
Confocal Ca2+ measurements
SK-N-MC cells grown for 3 days on glass coverslips were inserted into a superfusion chamber mounted on an inverted microscope (Nikon Diaphot, Nikon, Japan). The microscope was equipped with a Zeiss Neofluar × 63 oil-immersion lens, NA 1·25 (Carl Zeiss, Germany). Ca2+ measurements using the acetoxymethyl ester form of the Ca2+ indicator fluo-3 (fluo-3 AM, Molecular Probes) were performed as described previously (Lipp & Niggli, 1993). SK-N-MC cells were incubated at 20-23°C with 2-5 μmol l−1 fluo-3 AM, diluted from a 1 mmol l−1 stock solution of fluo-3 AM in DMSO (Fluka AG) with 25 % pluronic F-127 (Molecular Probes). After a loading period of 20 min, the solution was exchanged with a bath solution containing (mM): 130 NaCl, 5 KCl, 1 MgCl2, 10 CaCl2, 5 glucose and 10 Hepes (pH 7·4). Rapid (t½= 500 ms) changes of the extracellular solution were performed using a gravity-driven superfusion system. Fluorescence measurements were performed with a confocal laser scanning microscope (MRC 1000, BioRad) equipped with an argon ion laser. For excitation of fluo-3 AM the 488 nm line of the laser was used (about 74 μW on preparation), and emitted fluorescence was measured at a wavelength > 515 nm. The z-resolution was approximately 1 μm. To obtain the time course of Ca2+ signals, images were repeatedly acquired with a frequency of 1-2 Hz. The [Ca2+]i was computed using the self-ratio method (Lipp & Niggli, 1993) assuming a resting [Ca2+]i of 100 nM and a Kd of 400 nM. Image analysis was performed on an Apple PowerPC 8100/100 with a customized version of image processing software (NIH-Image). All experiments were carried out at room temperature.
Presentation of data and statistics
Where appropriate, data are given as means ±s.e.m. of n experiments. Student's t test was used to evaluate the significance of differences.
RESULTS
EpoR is expressed in SK-N-MC cells
A prerequisite for our study was the expression of the EpoR in human SK-N-MC cells. To test whether EpoR mRNA was present, we isolated total RNA and subsequently performed RT-PCR using primers to the human sequence of exon 3 and exon 7. As a positive control, we used the Epo-dependent leukaemia cell line UT-7, which is known to express the EpoR (Komatsu et al. 1993). A fragment of the expected size of 485 bp was observed by agarose gel electrophoresis in both cell lines (Fig. 1A), indicating the presence of EpoR mRNA in SK-N-MC cells.
Figure 1. EpoR is expressed in SK-N-MC cells.
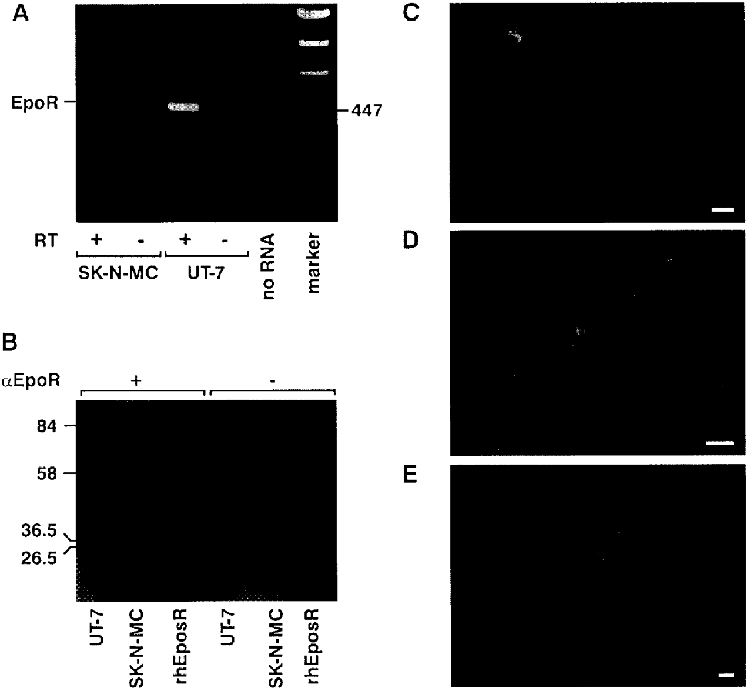
A, detection of EpoR mRNA in SK-N-MC and UT-7 cells by RT-PCR. One microgram of total RNA from each cell line was reverse transcribed and amplified. After gel electrophoresis through 1 % agarose, the reaction products were stained with ethidium bromide and photographed. The amplified product length for the human EpoR is 495 bp. +/- RT, reaction with and without reverse transcriptase; no RNA, no sample RNA added. B, detection of EpoR protein. A mouse monoclonal antibody against the extracellular domain of the EpoR detected a single band of 68 kDa in the UT-7 cells (positive control) and in SK-N-MC cells. The same antibody recognized the soluble form of the rhEpoR (32 kDa). The right half of the Western blot shows the negative control where incubation with the primary antibody was omitted. C, immunodetection of the EpoR. Fluorescence was detected on the plasma membrane and in the cytoplasm in most cells, although with different intensities. D, the same cells presented in C at greater magnification, showing the distribution of the receptor on the membrane and cytoplasm. E, incubation of fixed cells with the monoclonal antibody against the microtubule-associated protein MAP1b (MAP5) resulted in staining of filamentous structures in the cytoplasm. In each photograph, bar = 10 μm.
To demonstrate the expression of the EpoR at the protein level too, we performed Western blot analysis using total cellular lysates prepared from SK-N-MC cells and from UT-7 cells for comparison (Fig. 1B). A mouse monoclonal antibody raised against the extracellular domain of the human EpoR detected a single band with a molecular size of 68 kDa in both cell lines. The same antibody bound to the soluble form of the rhEpoR which has a known size of 32 kDa, indicating that this antibody specifically recognizes the EpoR.
Finally, the use of immunofluorescence allowed us to investigate the expression pattern of the EpoR in SK-N-MC cells. As shown in Fig. 1C and in more detail in Fig. 1D, almost all cells expressed the EpoR on the plasma membrane and, surprisingly, in the cytoplasm. No fluorescence was observed when the primary antibody was omitted (data not shown). The neuronal identity of SK-N-MC cells was verified by using a monoclonal antibody against the microtubule-associated protein MAP1b, a marker for neuronal cells. As expected, the fluorescence appeared on filamentous structures in the cytoplasm (Fig. 1E).
Characterization of calcium channels in SK-N-MC cells
Electrophysiological characterization of SK-N-MC cells was performed using the whole-cell patch-clamp technique. Immediately after obtaining access to the cytoplasm, the cells typically showed a resting potential of -37 ± 10 mV (n= 10 cells). In the voltage-clamp mode we applied depolarizing steps to potentials in the range between -60 and +60 mV from a holding potential of -100 mV. This led to the activation of voltage-sensitive currents which, based on their general appearance, we attributed to K+ and Na+ channel activity (data not shown). To test specifically for the presence of voltage-gated Ca2+ channels, we selectively blocked outward K+ currents with internal CsCl and inward Na+ currents with external TTX. In fact, currents that could be attributed to voltage-activated Na+ channels were not consistently observed with this particular cell line. Nevertheless, to prevent possible contamination we routinely superfused the cells with TTX. Under these conditions and in the presence of external Ca2+ (10 mM), voltage steps induced a rapidly inactivating current as shown in Fig. 2A, which was maximally activated at -20 mV (Fig. 2B). Assuming Nernst conditions applied, the reversal potential of around +60 mV suggested that the observed current was a Ca2+ current. We also determined the inactivation curve for the Ca2+ current by stepping the potential to various voltages for 60 ms followed by 20 ms at -100 mV and then measuring the remaining current evoked by a voltage step to -20 mV. This relationship showed that at the resting potential of the SK-N-MC cells (-40 to -50 mV) about 40 % of the channels could still be activated (Fig. 2C).
Figure 2. Characterization of the T-type Ca2+ channels.
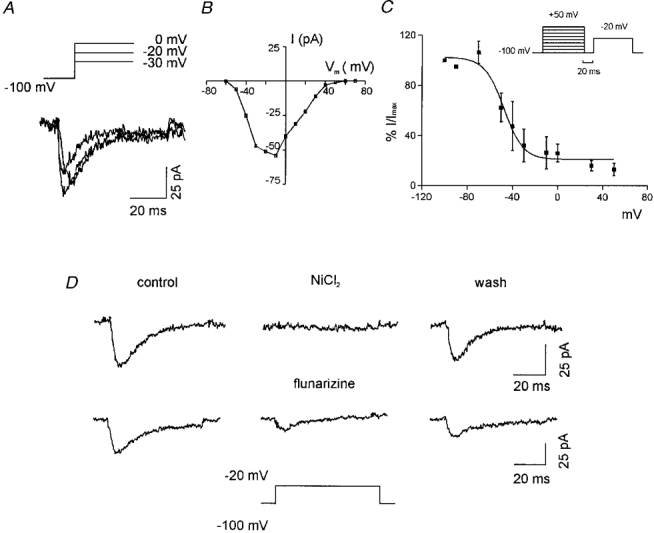
A, examples of whole-cell Ca2+ current traces activated by three different step potentials (shown above the traces) from a holding potential of -100 mV. B, leak-subtracted current-voltage relationship obtained by measuring the peak current at different test potentials from a holding potential of -100 mV for one representative cell. C, steady-state inactivation curve for the T-type Ca2+ current. Inset shows the pulse protocol used. Points (means ±s.e.m.; n= 3) indicate the fraction of current at a test potential of -20 mV following a 60 ms prepulse at the potentials indicated on the abscissa. The continuous curve represents a Boltzmann function fitted to the data points. The Boltzmann equation parameters are: (I/Imax)max= 102·4, V½= -47·7 mV, slope = -8·5 mV. D, identification of the T-type Ca2+ channels by blocking the current recorded at a test potential of -20 mV with two specific blockers, 2 mM NiCl2 (upper traces) and 500 μM flunarizine (lower traces). The wash consisted of the reperfusion of the cells with the control external solution: significant recovery was only observed in the case of NiCl2.
Due to the inactivating kinetics and the activation at voltages less than zero, the current observed was considered to be most probably due to low voltage-activated Ca2+ channels (T-type). We confirmed this notion by using NiCl2 and diphenylpiperazine flunarizine, both blockers of T-type Ca2+ channels (Wang et al. 1990). As shown in Fig. 2D the voltage-activated current was blocked by both agents. Consistent with this behaviour was the finding that nifedipine and ω-conotoxin (blockers of L-type and N-type Ca2+ channels, respectively) had no effect (data not shown). Since both L- and N-type Ca2+ channels are activated at high voltages, we confirmed the absence of these channels by adding NiCl2 or flunarizine. As expected, stimulation of cells to more depolarized potentials from a holding potential of -60 mV did not elicit inward currents. Taken together, these findings indicated that SK-N-MC cells express the low voltage-activated (T-type) Ca2+ channels but not the high voltage-activated ones.
Superfusion of rhEpo leads to an increase in peak Ca2+ current
To analyse whether Epo may alter Ca2+ homeostasis by modulating the activity of Ca2+ channels, we recorded the whole-cell current activated at -20 mV (maximum peak current) with a holding potential of -100 mV. After obtaining stable current traces, we superfused the cells with the control bath solution containing 10 mM Ca2+ and then switched to another solution containing 10 mM Ca2+ and rhEpo. As shown in Fig. 3A (upper traces), superfusion with 20 u ml−1 (6 nM) rhEpo for 3-5 min increased the peak current by 20 % without any apparent change in the macroscopic kinetics. No change in the recorded currents was observed when cells were superfused with the vehicle solution for rhEpo (Fig. 3A, lower traces), suggesting that rhEpo was responsible for the elevation of the peak current. Wash-out of the Epo response with the control bath solution (Fig. 3A) was observed only in a few cases: typically in 5 out of 15 cells per experiment the peak current returned to basal levels, whereas in the majority of cases the peak current remained elevated suggesting that the Epo-induced elevation of the Ca2+ current was not reversible. Superimposition of the traces (data not shown) indicated that neither activation nor inactivation kinetics appeared to be affected by Epo superfusion.
Figure 3. Addition of rhEpo induces an increase of the peak Ca2+ current.
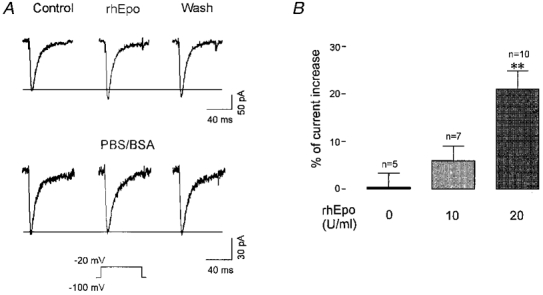
A, upper traces, the effect of rhEpo is shown as an increase of the peak current of the central trace compared with the control trace on the left. The trace on the right shows that it was not possible to reverse the Epo effect with up to 30 min wash-out. The lower traces represent the negative control for another cell whereby superfusion with the vehicle solution for Epo (PBS-0·1 % BSA) did not induce an increase of the peak current. B, pooled data showing the change in the Ca2+ current caused by the vehicle solution (negative control) and by two different concentrations of rhEpo. Only 20 u ml−1 rhEpo induced a significant increase of the current compared with the control experiment. **P < 0·0001, according to Student's t test.
To determine the range of Epo effects on Ca2+ channels, several concentrations of rhEpo (from 1 to 100 u ml−1) were applied to SK-N-MC cells. Compared with the results obtained with the vehicle solution, a slight but statistically insignificant elevation of the whole-cell current was observed in the presence of 10 u ml−1 rhEpo (n= 7), whereas a statistically significant increase of 21 ± 4 % (n= 10) was induced by 20 u ml−1 rhEpo (Fig. 3B). Higher concentrations of rhEpo (up to 100 u ml−1), however, did not alter the peak current significantly.
In addition, the effect of rhEpo was tested on the activity of K+ channels with 140 mM KCl in the pipette instead of CsCl. Under these conditions, no changes in the outward currents induced by voltage steps from a holding potential of -60 mV to test potentials in the range 0 to +60 mV were observed when cells were superfused with 20 u ml−1 rhEpo. We confirmed that, from the same batch of cells, an increase in T-type Ca2+ current was observed in response to rhEpo as reported above (data not shown). These results confirmed a specific effect of Epo on the T-type Ca2+ channels.
Epo influences cytoplasmic Ca2+ levels
In the electrophysiological experiments described above, the lack of reversibility of the Epo effect meant that we had to discard each Petri dish after the first application of rhEpo. Furthermore, in some cases we also recorded from cells that showed no increase in Ca2+ current in response to rhEpo. To overcome these limitations we used a Ca2+ imaging technique which allowed us to measure Ca2+ changes in several cells simultaneously. To this end, the cells were loaded with the Ca2+ indicator fluo-3 and, in response to external application of different factors, changes in the fluorescence ratio, representing changes in cytosolic [Ca2+], were monitored in small populations of cells (typically, n= 4-5) with a confocal laser scanning microscope (Fig. 4A, image 1). The cells were continuously superfused with a bath solution containing 10 mM Ca2+. Switching to a bath solution containing PBS-0·1 % BSA, the vehicle for rhEpo, did not change the fluorescence ratio. In contrast, superfusion with 20 u ml−1 of rhEpo induced a number of different responses, as in the typical experiment shown in Fig. 4A. Out of four selected cells, one cell showed a large increase in fluorescence, whereas another did not respond at all (traces a and d, respectively). Two other cells, corresponding to traces b and c, responded with smaller increases and a different time course: whereas cell b showed a decrease of fluorescence after about 250 s, the increase of fluorescence in cell c persisted for as long as Epo was present.
Figure 4. Epo and caffeine effects on cytoplasmic Ca2+ levels in SK-N-MC cells.
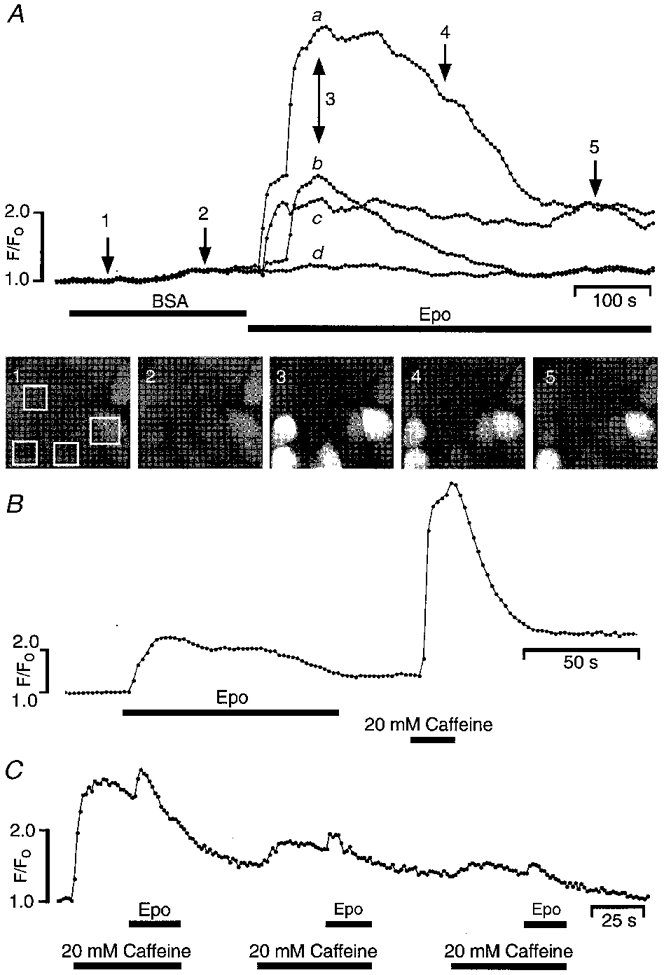
A, intracellular Ca2+ measurements performed with confocal laser microscopy on fluo-3 AM-loaded cells. Four different cells, indicated by the four white boxes in the first snapshot below the fluorescence traces, were monitored for changes of Ca2+ levels with time. Snapshot images (1-5) were taken at different times during each superfusion step, indicated with arrows. Superfusion of the cells with a solution containing 0·1 % BSA (vehicle solution for Epo) did not have any effect on the fluorescence ratio. Switching to a solution containing 20 u ml−1 rhEpo induced an increase of fluorescence. Note that the cells responded with different time courses as indicated by the traces labelled a-d (see text). The fluorescence peaks in traces b and c correspond to 415 nM and 312 nM Ca2+, respectively. B, an Epo-sensitive cell also responded to the external application of 20 mM caffeine with a larger increase of fluorescence, suggesting that Epo does not deplete the internal Ca2+ stores. C, gradual depletion of the caffeine-sensitive stores by three consecutive caffeine stimulations. The time course of the fluorescence response is shown for two representative cells. The application of Epo during stimulation with caffeine induced a further small increase of the fluorescence. In all cases, external solution contained 130 mM NaCl and 10 mM CaCl2.
In contrast to the electrophysiological measurements, which indicated that the effect of Epo was on transmembrane Ca2+ flux, we could not exclude the possibility that activation of the EpoR led to Ca2+ release from intracellular stores. To distinguish between the two mechanisms, we investigated the cellular response to Epo under conditions in which the intracellular Ca2+ stores were depleted. As shown in Fig. 4B, the external application of 20 mM caffeine (an agonist of the ryanodine receptor involved in Ca2+-induced Ca2+ release) induced a large and rapid increase of the fluorescence in a cell which had previously responded to Epo. The response to caffeine was larger than the response to Epo, suggesting that if Epo interacts with the internal stores at all, it is unable to deplete the internal Ca2+ stores, at least at the concentration used here. However, when the internal stores were gradually depleted by repeated applications of caffeine, as indicated by the steady decrease in fluorescence in Fig. 4C, rhEpo continued to induce a small increase of [Ca2+] superimposed on the caffeine response. This behaviour would be consistent with an Epo-induced Ca2+ influx.
To test this hypothesis further and to identify the mediator of this influx, we performed another set of experiments using thapsigargin, a calcium-ATPase inhibitor which is known to deplete intracellular Ca2+ stores. Since we observed that some cells pretreated with thapsigargin still gave a transient increase in fluorescence in response to caffeine, implying the existence of thapsigargin-insensitive stores, we routinely superfused cells for 1·5 min with 20 mM caffeine before applying Epo. As shown in Fig. 5A, under these conditions Epo still increased the Ca2+ level in the presence of 10 mM external Ca2+. Furthermore, the removal of extracellular Ca2+ (Fig. 5B) abolished the Epo-induced increase of [Ca2+], indicating that an external source of Ca2+ was required. Moreover, as shown in Fig. 5C, when this protocol was repeated in the presence of flunarizine to block T-type Ca2+ channels, no significant increase in fluorescence was observed. This finding confirmed the electrophysiological results and suggested that activation of T-type Ca2+ channels alone most probably accounts for the transient Epo-induced changes in fluorescence and that no other transmembrane pathways were involved.
Figure 5. T-type Ca2+ channels are involved in the Epo-induced increase of cytoplasmic Ca2+ levels.
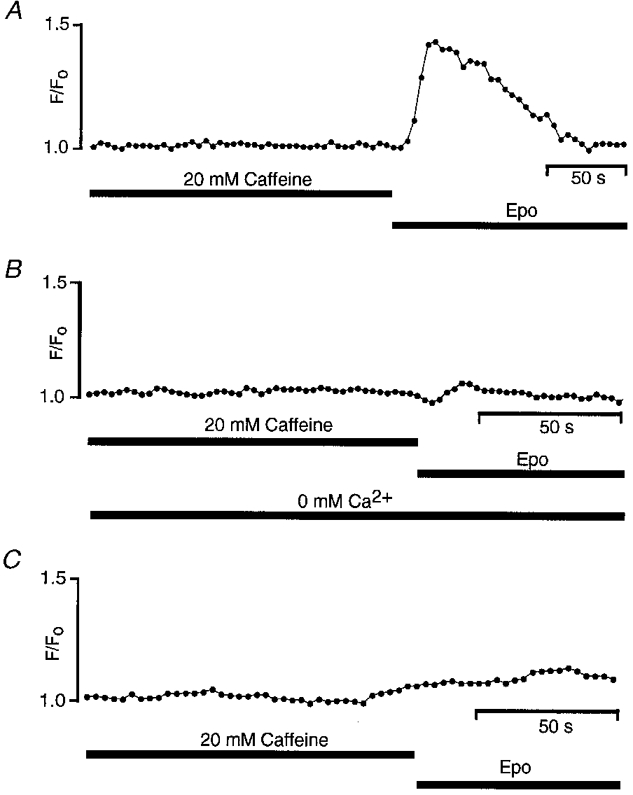
All cells were preincubated for 20 min with 100 nM thapsigargin to deplete the internal Ca2+ stores. A, the superfusion of 20 mM caffeine did not induce a [Ca2+] increase. Superfusion with 20 u ml−1 Epo, instead, induced an increase of the fluorescence ([Ca2+]= 148 nM) when 10 mM Ca2+ was present outside the cells. The removal of external Ca2+ (B) or the block of the T-type Ca2+ channel by 500 μM flunarizine (C) abolished the Epo-induced elevation of fluorescence.
DISCUSSION
In the present study, we characterized the effects of the haematopoietic growth factor Epo on the Ca2+ homeostasis of human neurone-derived cells. The neuroblastoma cell line SK-N-MC provides a good model for neurones: for example, these cells express choline acetyltransferase which is responsible for the production of the neurotransmitter acetylcholine (Barnes et al. 1981) and, as shown in this work, they also express the microtubule-associated protein MAP1b (MAP5), a characteristic protein that is present in cerebral neurones (Riederer et al. 1986). Of crucial importance in the present study was the presence of EpoR mRNA and protein in SK-N-MC cells. Using immunofluorescence, we have provided the first demonstration at the single cell level that the EpoR is localized at the plasma membrane and, surprisingly, also in the cytoplasm. Since in these experiments SK-N-MC cells were not exposed to Epo, internalization of the receptor upon binding to its ligand appears to be unlikely (Youssoufian et al. 1993). Although we cannot completely exclude an internalization of the receptor during the preparation procedure, fixation with formaldehyde should have prevented any movement of proteins from the membrane. We therefore cannot explain the finding of EpoRs in the cytoplasm.
To date an electrophysiological characterization of SK-N-MC cells has not been reported. In our patch-clamp investigations we routinely observed currents that could be attributed to the presence of K+- and Ca2+-selective channels. We applied voltage protocols to identify the type of Ca2+ channel present and were only able to detect the T-type, the activity of which was clearly modulated by external application of Epo. An effect of Epo on intracellular Ca2+ levels mediated by Ca2+ influx has been shown indirectly in the rat PC12 cell line by fluorescence Ca2+ measurements (Masuda et al. 1993). However, no data are available showing a modulation by Epo of Ca2+ current in neuronal cells. In erythroblasts, Cheung et al. (1997) found that Epo modulated voltage-independent Ca2+ channels. These experiments were carried out at the single channel level and Epo increased the open probability and the mean open time of the channel in these erythroid cells (Cheung et al. 1997). In contrast, we performed whole-cell experiments using neuronal cells and observed an increase of the peak current without changes in the apparent macroscopic kinetics, which allowed us to exclude an increase of the mean open time of the channels as being responsible for the Epo effect. Our present results are in agreement with studies on the effect of other cytokines on Ca2+ channel activity. For example, it has been shown that interleukin-1β and tumour necrosis factor-α increase the L-type Ca2+ current without affecting the activation kinetics in vascular smooth muscle cells (Wilkinson et al. 1996). Alternatively, the Epo effect on the whole-cell Ca2+ current could be explained in terms of an increase either in the conductance of the channels or in the number of available channels. A single channel study would be necessary to determine which of these possibilities is correct.
The maximal increase of peak current was obtained with 20 u ml−1 Epo, whereas higher and lower concentrations were not effective, suggesting a bell-shaped dose-response curve for Epo. Such dose-response curves are typical for cytokines (see Fuh et al. 1992; Magazin et al. 1994; Bellone et al. 1995). For example, according to the growth hormone receptor model of Fuh et al. (1992), high concentrations of the ligand antagonize initiation of the signal by preventing homodimerization of the receptor. Furthermore, the same concentration of Epo (20 u ml−1) increased calcium concentrations in endothelial (Haller et al. 1996) and vascular smooth muscle cells (Morakkabati et al. 1996), whereas in rat PC12 cells the optimal concentration was 10 u ml−1 (Masuda et al. 1993). Normal serum concentrations of Epo range between 0·006 and 0·015 u ml−1, but can increase dramatically during hypoxia up to 0·3-0·4 u ml−1 (Erslev, 1991). Thus, our optimal Epo concentration is around 1000 times higher than the normoxic serum level and approximately 30 times higher than the hypoxic serum concentrations. At first sight, this suggests that supraphysiological concentrations of Epo are required to modulate Ca2+ homeostasis in non-erythroid cells. However, even in erythroblasts high Epo concentrations were used to monitor Ca2+ influx (Miller & Cheung, 1994), indicating that local Epo concentrations necessary to mediate signal transduction might be considerably higher than serum levels. Such a scenario might also be true for the brain where local production of Epo in astrocytes has been proposed (Marti et al. 1996) and as yet the concentration of Epo protein in the brain has not been quantified.
A further factor that might influence the effective concentration of Epo required to elicit a response is the fact that we used commercially available rhEpo preparations for our study. Since it has been shown that brain-derived Epo differs from renal and hepatic Epo, and that the EpoR expressed in PC12 cells has a lower ligand affinity than the erythroid EpoR (Masuda et al. 1993), the rhEpo used here might not be optimal for the specific conditions in the brain, perhaps explaining the relatively high dose necessary to observe effects of Epo.
The results of confocal laser scanning microscopy indicate that Epo induces an elevation in [Ca2+]i via Ca2+ influx. First, increased fluorescence signals were obtained from cells in which the internal stores were depleted by thapsigargin and caffeine. Second, after blocking the T-type Ca2+ channels with flunarizine or removal of external Ca2+, Epo failed to raise the [Ca2+] in cells pretreated with thapsigargin and caffeine, demonstrating that the Ca2+ influx is most likely to occur by the activation of T-type Ca2+ channels. Further support for this conclusion comes from our electrophysiological findings, which indicated that Epo induces an increase in T-type Ca2+ channel current and, based on the inactivation curve, that about 40 % of the total channels would still be capable of activation at the resting potential at which the Ca2+ measurements were made.
The focus of the present study was the elucidation of an Epo-induced influx of Ca2+ via voltage-activated Ca2+ channels. In addition, the increase of [Ca2+] observed during caffeine superfusion (Fig. 4B) suggests that in SK-N-MC cells, the Ca2+-induced Ca2+ release mechanism might be activated. Further experiments focusing on the intracellular mechanism of Ca2+ release will be necessary to investigate this proposal.
In summary, we demonstrated that externally applied rhEpo can act as a Ca2+ homeostasis modulator in a neuronal cell line. Our data allowed us to identify one pathway in EpoR signalling, involving an enhanced activity of the T-type Ca2+ channels. The physiological significance of the Epo effect on Ca2+ homeostasis in neurones is not yet clear. Pretreatment of cortical and hippocampal neurones with Epo has been demonstrated to have a neuroprotective action against glutamate-induced excitotoxicity during ischaemia (Morishita et al. 1997; Sakanaka et al. 1998). A preconditioning sublethal ischaemic insult has been shown to protect neuronal cells against a subsequent and more severe insult (Liu et al. 1992; Mattson, 1997). Moreover, a relationship between the initial intracellular Ca2+ level during excitatory amino acid exposure and the propensity to undergo neurodegeneration has been shown (Tymianski et al. 1993; Eimerl & Schramm, 1994). We might therefore speculate that activation of EpoRs and the observed increase of Ca2+ levels might be involved in ischaemic preconditioning. Further studies are required to investigate such a novel role of Epo in the brain.
Acknowledgments
The authors thank C. Lacombe and A. Dürrer for providing UT-7 and SK-N-MC cell lines, respectively, Genetics Institute (Cambridge, MA, USA) for supplying anti-EpoR antibodies, I. Kvietikova, D. Chilov and P. Spielmann for technical help, R. H. Wenger for discussion and C. Gasser for the artwork. This project was supported by grants from the Fonds für Medizinische Forschung University of Zurich, the Julius Klaus-Stiftung, the EMDO-Stiftung and the Swiss National Science Foundation (31-47111.96).
References
- Barnes EN, Biedler JL, Spengler BA, Lyser KM. The fine structure of continuous human neuroblastoma lines SK-N-SH, SK-N-BE, and SK-N-MC. In Vitro. 1981;17:619–631. doi: 10.1007/BF02618461. [DOI] [PubMed] [Google Scholar]
- Bellone G, Geuna M, Carbone A, Silvestri S, Foa R, Emanuelli G, Matera L. Regulatory action of prolactin on the in vitro growth of CD34+ve human hematopoietic progenitor cells. Journal of Cellular Physiology. 1995;163:221–231. doi: 10.1002/jcp.1041630202. [DOI] [PubMed] [Google Scholar]
- Bertrand D, Bader CR. DATAC: a multipurpose biological data analysis program based on mathematical interpreter. International Journal of Bio-Medical Computing. 1986;18:193–202. doi: 10.1016/0020-7101(86)90016-4. [DOI] [PubMed] [Google Scholar]
- Cheung JY, Zhang XQ, Bokvist K, Tillotson DL, Miller BA. Modulation of calcium channels in human erythroblasts by erythropoietin. Blood. 1997;89:92–100. [PubMed] [Google Scholar]
- Chomczynski P, Sacchi N. Single-step method of RNA isolation by acid guanidinium thiocynate-phenol-chloroform extraction. Analytical Biochemistry. 1987;162:156–159. doi: 10.1006/abio.1987.9999. [DOI] [PubMed] [Google Scholar]
- Damen JE, Krystal G. Early events in erythropoietin-induced signalling. Experimental Hematology. 1996;24:1455–1459. [PubMed] [Google Scholar]
- Digicaylioglu M, Bichet S, Marti HH, Wenger RH, Rivas LA, Bauer C, Gassmann M. Localisation of specific erythropoietin binding sites in defined areas of the mouse brain. Proceedings of the National Academy of Sciences of the USA. 1995;92:3717–3720. doi: 10.1073/pnas.92.9.3717. [DOI] [PMC free article] [PubMed] [Google Scholar]
- Eimerl S, Schramm M. The quantity of calcium that appears to induce neuronal death. Journal of Neurochemistry. 1994;62:1223–1226. doi: 10.1046/j.1471-4159.1994.62031223.x. [DOI] [PubMed] [Google Scholar]
- Erslev AJ. Erythropoietin. New England Journal of Medicine. 1991;324:1339–1344. doi: 10.1056/NEJM199105093241907. [DOI] [PubMed] [Google Scholar]
- Fisher JW. Erythropoietin: physiologic and pharmacologic aspects. Proceedings of the Society for Experimental Biology and Medicine. 1997;216:358–369. doi: 10.3181/00379727-216-44183. [DOI] [PubMed] [Google Scholar]
- Fuh G, Cunningham BC, Fukunaga R, Nagata S, Goeddel GV, Wells JA. Rational design of potent antagonists to the human growth hormone receptor. Science. 1992;256:1677–1680. doi: 10.1126/science.256.5064.1677. [DOI] [PubMed] [Google Scholar]
- Haller H, Christel C, Dannenberg L, Thiele P, Lindschau C, Luft FC. Signal transduction of erythropoietin in endothelial cells. Kidney International. 1996;50:481–488. doi: 10.1038/ki.1996.339. [DOI] [PubMed] [Google Scholar]
- Jelkmann W. Erythropoietin: structure, control of production, and function. Physiological Reviews. 1992;72:449–489. doi: 10.1152/physrev.1992.72.2.449. [DOI] [PubMed] [Google Scholar]
- Juul SE, Anderson DK, Christensen RD. Erythropoietin and erythropoietin receptor in the developing human central nervous system. Pediatric Research. 1998;43:40–49. doi: 10.1203/00006450-199801000-00007. [DOI] [PubMed] [Google Scholar]
- Komatsu N, Yamamoto M, Fujita H, Miwa A, Hatake K, Endo T, Okano H, Katsube T, Fukumaki Y, Sassa S, Miura Y. Establishment and characterisation of an erythropoietin-dependent subline, UT-7/Epo, derived from human leukaemia cell line, UT-7. Blood. 1993;82:456–464. [PubMed] [Google Scholar]
- Konishi Y, Chui D-H, Hirose H, Kunishita T, Tabira T. Trophic effect of erythropoietin and other hematopoietic factors on central cholinergic neurones in vitro and in vivo. Brain Research. 1993;609:29–35. doi: 10.1016/0006-8993(93)90850-m. 10.1016/0006-8993(93)90850-M. [DOI] [PubMed] [Google Scholar]
- Lipp P, Niggli E. Ratiometric confocal Ca2+-measurements with visible wavelength indicators in isolated cardiac myocytes. Cell Calcium. 1993;14:359–372. doi: 10.1016/0143-4160(93)90040-d. 10.1016/0143-4160(93)90040-D. [DOI] [PubMed] [Google Scholar]
- Liu C, Shen K, Liu Z, Noguchi CT. Regulated human erythropoietin receptor expression in mouse brain. Journal of Biological Chemistry. 1997;272:32395–32400. doi: 10.1074/jbc.272.51.32395. 10.1074/jbc.272.51.32395. [DOI] [PubMed] [Google Scholar]
- Liu Y, Kato H, Nakata N, Kogure K. Protection of rat hippocampus against ischemic neuronal damage by pretreatment with sublethal ischemia. Brain Research. 1992;586:121–124. doi: 10.1016/0006-8993(92)91380-w. 10.1016/0006-8993(92)91380-W. [DOI] [PubMed] [Google Scholar]
- Magazin M, Guillemot JC, Vita N, Ferrara P. Interleukin-13 is a monocyte chemoattractant. European Cytokine Network. 1994;5:397–400. [PubMed] [Google Scholar]
- Marti HH, Gassmann M, Wenger RH, Kvietikova I, Morganti-Kossmann MC, Kossmann T, Trentz O, Bauer C. Detection of erythropoietin in human liquor: intrinsic erythropoietin production in the brain. Kidney International. 1997;51:416–418. doi: 10.1038/ki.1997.55. [DOI] [PubMed] [Google Scholar]
- Marti HH, Wenger RH, Rivas LA, Straumann U, Digicaylioglu M, Henn V, Yonekawa Y, Bauer C, Gassmann M. Erythropoietin gene expression in human, monkey and murine brain. European Journal of Neuroscience. 1996;8:666–676. doi: 10.1111/j.1460-9568.1996.tb01252.x. [DOI] [PubMed] [Google Scholar]
- Masuda S, Nagao M, Takahaty K, Konoshi Y, Gallyas F, Tabira T, Sasaki R. Functional erythropoietin receptor of the cells with neuronal characteristics. Journal of Biological Chemistry. 1993;268:11208–11216. [PubMed] [Google Scholar]
- Masuda S, Okano M, Yamagishi K, Nagao M, Ueda M, Sasaki R. A novel site of erythropoietin production. Oxygen-dependent production in cultured rat astrocytes. Journal of Biological Chemistry. 1994;269:19488–19493. [PubMed] [Google Scholar]
- Mattson MP. Neuroprotective signal transduction: relevance to stroke. Neuroscience and Biobehavioral Reviews. 1997;21:193–206. doi: 10.1016/s0149-7634(96)00010-3. 10.1016/S0149-7634(96)00010-3. [DOI] [PubMed] [Google Scholar]
- Miller BA, Cheung JY. Mechanisms of erythropoietin signal transduction: involvement of calcium channels. Proceedings of the Society for Experimental Biology and Medicine. 1994;206:263–267. doi: 10.3181/00379727-206-43756. [DOI] [PubMed] [Google Scholar]
- Morakkabati N, Gollnick F, Meyer R, Fandrey J, Jelkmann W. Erythropoietin induces Ca2+ mobilisation and contraction in rat mesangial aortic smooth muscle cultures. Experimental Hematology. 1996;24:392–397. [PubMed] [Google Scholar]
- Morishita E, Masuda S, Nagao M, Yasuda Y, Sasaki R. Erythropoietin receptor is expressed in rat hippocampal and cerebral cortical neurones, and erythropoietin prevents in vitro glutamate-induced neuronal death. Neuroscience. 1997;76:105–116. doi: 10.1016/s0306-4522(96)00306-5. 10.1016/S0306-4522(96)00306-5. [DOI] [PubMed] [Google Scholar]
- Riederer B, Cohen R, Matus A. MAP5: a novel brain microtubule-associated protein under strong developmental regulation. Journal of Neurocytology. 1986;15:763–775. doi: 10.1007/BF01625193. [DOI] [PubMed] [Google Scholar]
- Sakanaka M, Wen TC, Matsuda S, Masuda S, Morishita E, Nagao M, Sasaki R. In vivo evidence that erythropoietin protects neurones from ischemic damage. Proceedings of the National Academy of Sciences of the USA. 1998;95:4635–4640. doi: 10.1073/pnas.95.8.4635. 10.1073/pnas.95.8.4635. [DOI] [PMC free article] [PubMed] [Google Scholar]
- Tymianski M, Charlton MP, Carlen PL, Tator CH. Source specificity of early calcium neurotoxicity in cultured embryonic spinal neurones. Journal of Neuroscience. 1993;13:2085–2104. doi: 10.1523/JNEUROSCI.13-05-02085.1993. [DOI] [PMC free article] [PubMed] [Google Scholar]
- Wang R, Karpinski E, Wu LY, Pang PK. Flunarizine selectively blocks transient calcium channel currents in N1E-115 cells. Journal of Pharmacology and Experimental Therapeutics. 1990;254:1006–1011. [PubMed] [Google Scholar]
- Wilkinson MF, Earle ML, Triggle CR, Barnes S. Interleukin-1β, tumor necrosis factor-α, and LPS enhance calcium channel current in isolated vascular smooth muscle cells of rat tail artery. FASEB Journal. 1996;10:785–791. doi: 10.1096/fasebj.10.7.8635696. [DOI] [PubMed] [Google Scholar]
- Youssoufian H, Longmore G, Neumann D, Yoshimura A, Lodish HF. Structure, function, and activation of the erythropoietin receptor. Blood. 1993;9:2223–2236. [PubMed] [Google Scholar]