

Abstract
If a purpose of photostasis - absorption of a constant number of photons by the retina, regardless of incident light levels - is to maintain rods at saturation during the light period, then in retinal regions where light intensity is low, rhodopsin concentration should be high, and vice versa.
Our ocular transmission photometric measurements revealed that the distribution of light intensity across the rat retina was not as simple as had been thought and, furthermore, that the local concentration of rhodopsin had a high negative correlation with the light intensity.
The reciprocity between these two parameters leads to nearly uniform rates of photon absorption in rods across the retina.
Penn & Williams (1986) showed that groups of rats, each group born and raised at a different intensity of cyclic light, absorbed the same number of photons in their retinas daily; they called this phenomenon ‘photostasis’ and the number of photons absorbed the ‘photostasis number’. Light absorption was regulated despite substantial differences in rod cell count, length of rod outer segments (ROS), concentration of rhodopsin in ROS, and rhodopsin regeneration rate constants. Moreover, rat retinas respond to variations in environmental lighting by changing these light-absorbing properties (Schremser & Williams, 1995a, b), yet the photostasis number is maintained at about 1016 per eye per day (Williams, 1998). For example, if a rat is moved to low light intensity from high, rhodopsin is upregulated, ROS are lengthened, rhodopsin concentration in the ROS increases and, in general, regeneration rate constants are increased. If the move is to a higher from a lower light intensity, the modifications are the reverse.
The light-absorbing properties of dark-adapted rods depend heavily on ROS ‘renewal’, a complex turnover process that replaces a portion of the ROS each day. In the course of about 10 days, the entire rat ROS is replaced. It is through this process that rhodopsin concentration in individual rods can be changed - if the portions replaced on a series of days incorporate more rhodopsin than the older portions did, the average concentration in that ROS rises until all portions have been replaced (Schremser & Williams, 1995b).
Renewal sets the amount of rhodopsin present in the eye at the beginning of the ‘day’. When the lights come on in the morning, rhodopsin absorbs light and begins to ‘bleach’, a process that renders the pigment colourless; if the rate of absorption is great enough, light absorption saturates the rod response to light (Aguilar & Stiles, 1954; Pirenne, 1962), eliminating the usefulness of the rod for vision. During daylight intensities, cones produce visual responses, and the neural circuitry of the vertebrate retina provides cone-dominated pathways for these responses.
About an hour into the lights-on period, the retina reaches a steady state wherein the rhodopsin bleaching rate equals its regeneration rate (Rapp & Williams, 1980; Williams et al. 1998a). The level of rhodopsin in the steady state determines the moment-to-moment availability of rhodopsin for absorbing light. A recent report from our laboratory (Williams et al. 1998b) showed that the rate of photon absorption in this steady state is regulated such that the average rod absorbs about 14 000 photons s−1 and that this rate is representative of most, if not all, rods in albino and pigmented rat retinas. This absorption rate lies within the range of rates known to saturate rods from several mammalian species (Aguilar & Stiles, 1954; Pirenne, 1962; Nakatani et al. 1991). If maintaining rods in saturation is a function of photostasis, then most, perhaps all, rods in a single retina should absorb at this rate. As a consequence, in retinal regions where the light intensity is low (e.g. the periphery), rhodopsin concentration should be high; in regions of high light intensity, it should be low.
The purpose of this study was to measure both light intensity and rhodopsin concentration over wide regions of the retina within intact rat eyes. We found that rod absorption rates were nearly equal in all areas. This result arises because rhodopsin concentration and intensity of incident light bear a reciprocal relationship to each other across the retina.
METHODS
Fourteen Sprague-Dawley albino rats (both male and female) 18-50 weeks of age were used in this experiment. All were donated to this study, and all procedures, before and after the rats were obtained for this work, conformed to National Institutes of Health, Association for Research in Vision and Ophthalmology, and Florida State University guidelines for the care and use of animals in research. Before this study, six of these rats (the older ones) had been used in a non-invasive taste-preference experiment; these were housed in standard cages with ceiling-mounted lighting fixtures. The other eight had not been used in any experiment but were housed in a cubicle in which lighting fixtures were mounted in the corners and provided more uniform lighting to all the rats therein. No attempt had been made to record the previous light history of any of these rats, but all were kept in our 3 lx colony room for 3-6 weeks before being used here. In all cases the light-dark cycle was 12 h-12 h.
For this work, we modified our ocular transmission photometer (OTP), described elsewhere (Williams & Webbers, 1995; Williams et al. 1998b), such that it monitored four retinal regions within a single eye (Fig. 1A). Briefly, the OTP measures the intensity of light transmitted through excised eyes. Intense, actinic bleaching light, passing through the normal optics of an eye, traverses all of the ocular media including the photoreceptor-retinal pigment epithelium-choroid complex. The fraction of the light that is not absorbed or back-scattered exits through the sclera, where it is sampled by four fine-tipped ‘optical pickups’ that touch the external surface of the sclera. The pickups convey the light to a photon-counting system, where photon rates are measured, log transformed, recorded, and displayed against time. The bleaching beam from a ‘green’ He-Ne laser (543 nm; Melles-Griot) delivers up to 1015 photons s−1 to the eye by way of a Ganzfeld (field of uniform light intensity). Measurement of the Ganzfeld output (photons s−1) at the position of the rat cornea showed that the maximum variation across the aperture was 3.5 %. Achieving this uniformity was important: we had to be sure that any non-uniformities in the intensity distributions found inside the eyes were not produced by non-uniform intensity distributions outside the eyes. To rule out the possibility that asymmetries in the apparatus caused the observed distributions of intensity, we rotated the eyes used in two runs (nos 23 and 24) 180 deg so that the superior retina viewed the part of the Ganzfeld usually viewed by the inferior retina and vice versa. The two runs yielded results entirely consonant with those of other runs.
Figure 1. The OTP and typical results.
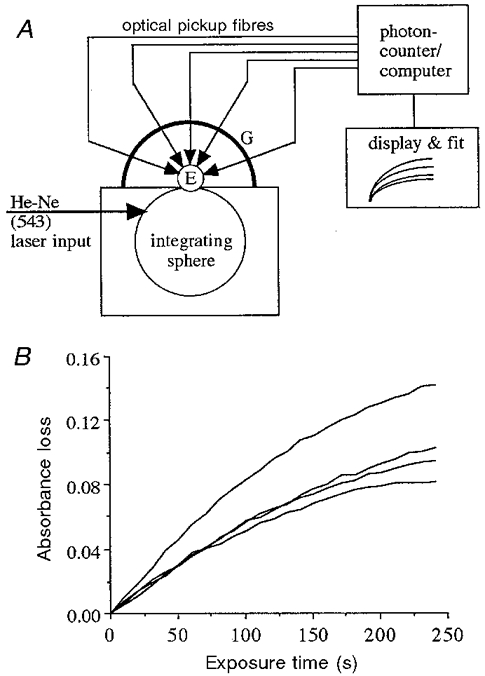
A, schematic drawing of the OTP. The eye, E, with normal optics intact, is positioned such that it views an integrating sphere, whose output is a uniform Ganzfeld (maximum variation across the aperture = 3.5 %). Fibre-optic ‘pickups’ held by the goniometer, G, touch the external sclera at locations measured in degrees from the optic nerve. When laser light is admitted to the integrating sphere, some of the light enters the eye, traverses the entire globe, and exits through the sclera, where its intensity is monitored by the photon-counting system. The laser light causes rhodopsin to bleach, which, in turn, results in an increase in light intensity emanating from the sclera. B, log intensity functions obtained at four locations across the rat retina (eye no. 20). Curves such as these were fitted with the function Δt% =Δ(1 - e-t/τ). From the fit, the values of Δ and 1/τ were obtained. Even though the curves were still rising, indicating that the bleaching process was not complete in this eye, tests proved that curve fitting provides accurate Δ and 1/τ values. In this figure these functions have unequal Δ values, i.e. vertical excursions are not equal, and unequal 1/τ values, although this inequality is less obvious by simple inspection.
The mature rat retina normally has 1.75 × 10⁷ rods (Lashley, 1932; Cone, 1963) and subtends an area of 80-90 mm2 (Hughes, 1979). Scale drawings of the pickup, sclera, choroid and retina, done with appropriate refractive indices, showed that each optical pickup collects light from an area of retina of about 0.8 mm in diameter, corresponding to about 2 % of the rods in the rat retina. The pickups are attached to a goniometer, calibrated in 10 deg steps out to ±70 deg from the optic nerve.
Rats were killed in dim red light by asphyxiation at maximal CO2 concentrations followed by exsanguination. An eye, marked for orientation, was then excised, trimmed of debris, and introduced into the OTP such that it viewed the Ganzfeld. Then, under visual control in red light, the stump of the optic nerve was aligned with a reference pointer that was fixed at 0 deg, and the four optical pickups were brought into contact with the sclera.
The OTP was placed under computer control, the eye was suddenly exposed to the full intensity of the laser-lighted Ganzfeld, and simultaneously, the photon-counting system began to monitor the light transmitted through the sclera at the chosen locations. Using an 800 ms dwell at each pickup station, a computer stepper-motor system scanned all four stations in sequence and then flew back to the first station to repeat the process. Photons were counted and the results stored for later display as log10(counts s−1), a parameter that is inversely proportional to absorbance and therefore to concentration. The intensity of this transmitted light increased with time as rhodopsin inside the eye bleached. The asymptotic, ‘total’ change in log10(counts s−1), Δ, was directly proportional to the amount of rhodopsin per unit area in the dark-adapted eye at the given location (Williams & Webbers, 1995). The run length necessary for the bleaching of rhodopsin to near-asymptotic levels was typically 300-500 s.
The data were stored as log10(counts s−1) at each time, plotted, and then fitted with a simple exponential of the form (Williams & Webbers, 1995):
where Δt% is the absorbance change at any time t, Δ is the total change for complete bleaching, and τ is the time constant of the bleaching process. Note that 1/τ is proportional to the light intensity that causes the bleach. Thus, from the curve fit, we obtained both the total absorbance change, Δ, and 1/τ at each of the four retinal regions monitored by the pickups. The product, (1/τ)Δ, which is proportional to the initial rate of photon absorption per unit area, was then calculated for the individual retinal regions.
Tests proved (a) that bleaching did not have to be complete to yield excellent fitted values of Δ and τ and (b) that neither photo-products nor self-screening affected the results (Williams & Webbers, 1995; Williams et al. 1998b).
RESULTS
Figure 1B shows examples of intensity changes obtained from a single eye. The signal-to-noise ratio was very high and permitted the precise fitting of exponential functions to the curves. Each fitted function then gave the local absorbance change, Δ (proportional to the local rhodopsin concentration), and the exponential time constant, τ. The inverse of τ was proportional to the intensity of light on the rods at each location. Note that the vertical excursions of these functions in Fig. 1B were not equal; the respective fitted Δ values were likewise not equal. Further, although less obvious, the time constants were not equal for the exponentials; the local intensities were therefore not the same at the various probe locations.
Figure 2 shows typical curve-fit values of Δ and 1/τ against retinal position for 6 of the 27 eyes. The most distinctive feature of these results was the reciprocal relationship between Δ and 1/τ: where one was high the other was low and vice versa. The ‘goodness-of-fit’ error bars are given to reflect the high signal-to-noise ratio of the data.
Figure 2. Fitted values of Δ (continuous lines) and 1/τ (dashed lines) for six eyes.
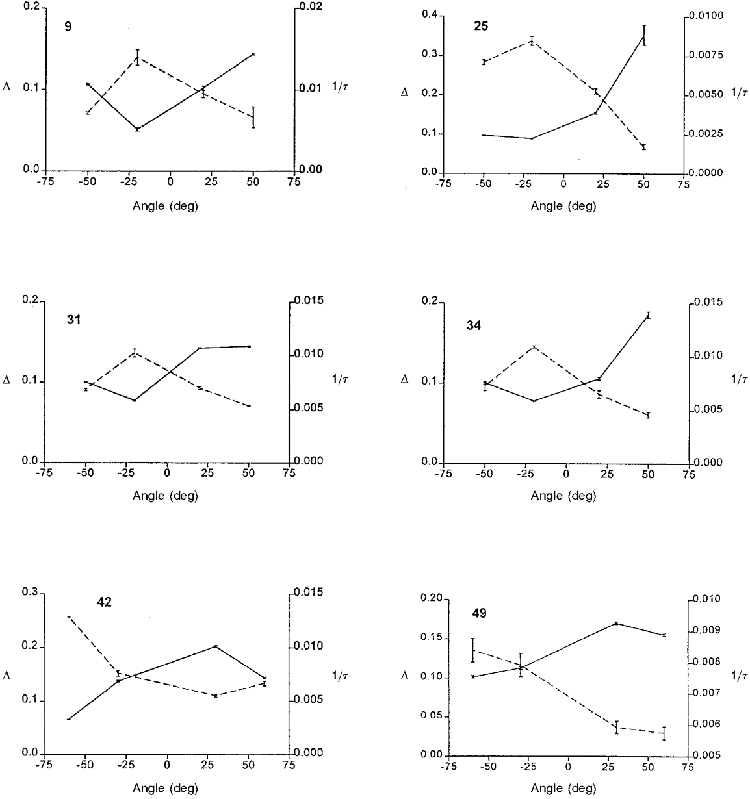
The number in the upper left corner of each panel is the eye number. Where Δ is low, 1/τ is high and vice versa. This previously unsuspected reciprocity implies that the rate of photon absorption is fairly uniform across these retinas. Individual data points are shown and error bars are ‘goodness-of-fit’ error bars.
Figure 3 presents the mean and standard error of Δ and 1/τ for all 27 eyes. All Δ points were compared with the highest Δ (+50 deg); all 1/τ points were compared with the lowest 1/τ (+60 deg). Symbols (* and +) denote statistical significance (P < 0.05) of the differences according to a one-factor ANOVA followed by a paired comparison of points with the Fisher PLSD test. These results clearly show that the highest light intensity and lowest rhodopsin concentration were found in the inferior retina, whereas the reverse was true for the superior retina.
Figure 3. Mean Δ (continuous line) and 1/τ (dashed line) values for all eyes.
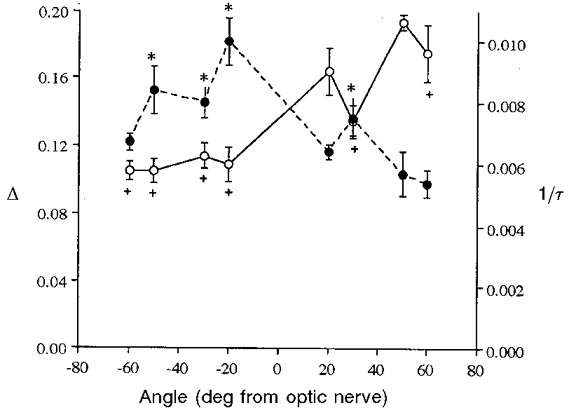
The highest Δ (○) and lowest 1/τ (•) values are found at +50 deg and +60 deg, respectively. All other points in each function are compared to these for significant differences (symbols + and * refer to Δ and 1/τ points, respectively, and indicate significance at P < 0.05). See text for further details.
Further, the highest Δ value was found in the superior retina (both overall and in each of the 27 eyes), as was the lowest light intensity in each eye. Conversely, in all but one eye (no. 27, +30 deg), the lowest rhodopsin concentration was found in the inferior retina, as was the highest light intensity in all but six cases. Evidence from diverse experiments indicates that these findings are not artifactual. For example, rod outer segments of rats raised in dim light were longest in the superior retina, and this region is also more susceptible to light damage than is the inferior retina (Penn & Williams, 1986; Williams et al. 1998a).
To portray further the non-random distributions of Δ and 1/τ values, we tabulated the 15 lowest (< 0.090) and highest (> 0.170) values of Δ and the 15 lowest (< 0.0050) and highest (> 0.0094) 1/τ values. The locations where these extreme values were measured are given in Table 1. Note that most of the lowest Δ values and highest 1/τ values were found in the inferior retina and that most of the highest Δ values and lowest 1/τ values were found in the superior retina. These data were used in a chi-squared test, and the hypotheses were tested that rhodopsin and light intensity are uniformly distributed across the rat retina. The hypotheses were not sustained (P < 0.005 for both Δ and 1/τ). These conservative P values show that there is virtually no chance that these distributions were uniform.
Table 1. Distributions of 15 highest and 15 lowest values of Δ and 1/τ.
| Δ values | 1/τ values | |||
|---|---|---|---|---|
| Highest | Lowest | Highest | Lowest | |
| Superior retina | 15 | 2 | 3 | 13 |
| Inferior retina | 0 | 13 | 12 | 2 |
In a chi-squared test, the hypotheses that rhodopsin and light intensity are uniformly distributed across the rat retina were rejected (P < 0.005 in both cases).
The rate at which rods absorb light at any given location is given by:
where Φ is the photo-sensitivity, a property of the rhodopsin molecule and assumed here to be constant; I is the local intensity; and R is the local rhodopsin concentration. Thus, the rate of absorption is proportional to the product IR. The values of 1/τ and Δ, presented above, are in fact proportional to I and R, respectively, and therefore their product is proportional to the local rate of absorption. Furthermore, a consequence of the reciprocal relationship between Δ and 1/τ is that they compensate for each other, nearly equalizing the absorption rates across the retina. Table 2 presents the highest, lowest and mean Δ values, their corresponding 1/τ values, and the mean values for all data. It shows that, despite the order-of-magnitude ranges of Δ and 1/τ, the product of the two is constant within about 18 %. Figure 4 presents the same result but shows all the data. The slope of the line in Fig. 4 (0.00070 s−1) is equivalent to the product of Δ and 1/τ, but does not exactly match the mean value given in Table 2 because the line was drawn according to the least-squares method, to minimize the squared distance of all points from that line, whereas the values in Table 2 are the means of pairs of points that were determined together.
Table 2. Highest, lowest and overall mean values of Δ and τ.
| Eye number | Δ | 1/τ | Δ(1/τ) |
|---|---|---|---|
| 9 | 0.05112 | 0.01396 | 0.000713 |
| 37 | 0.5576 | 0.00157 | 0.000875 |
| Mean | 0.1355 | 0.00716 | 0.000877 |
| (0.0626) | (0.00236) | (0.000199) |
Values in parentheses are standard deviations.
Figure 4. Least-squares plot of all Δ and τ data (n = 108 data points, all angles, all eyes).
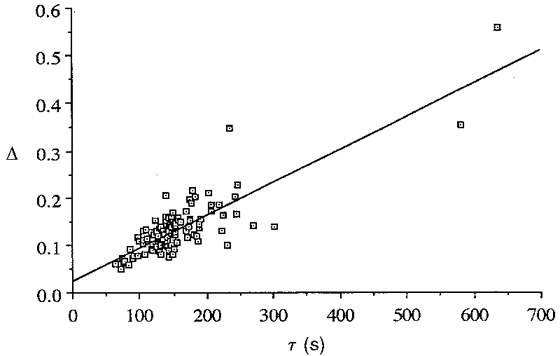
The points define a good straight line (r2 = 0.86), and the slope (0.00070 s−1) is equal to the least-squares product Δ(1/τ). Most of the points cluster about the mean values of Δ and τ, but two points with extreme values are also shown. Even these two points nearly fit on the line, demonstrating that the reciprocal relationship between Δ and 1/τ produces a near-constant product, the initial rate of photon absorption.
DISCUSSION
Our study, the first in which rhodopsin and light intensity distributions have been measured in individual eyes, discloses the previously unsuspected feature that the two parameters are inversely related. The bleaching rate, embodied in τ, gives the in situ, functional intensity incident locally on the rods. Perhaps the main advantage of the OTP is that previous methods for measuring intensity were invasive and risked introducing artifacts (Kooijman & Witmer, 1986).
The strong implication of our results is that local rhodopsin concentration is regulated by the local intensity of incident light. Our previous work had shown only that the ‘global’ rhodopsin content of the rat eye is inversely related to the light intensity of the habitat. More surprising than the local regulation, however, is that in a rat eye viewing a uniformly lighted Ganzfeld, light incident on the retina is distributed non-uniformly across the retina. The maximum deviation across the Ganzfeld aperture was 3.5 %, but the observed bleaching rates differed by a factor of 10.
Why should there be a lower light intensity and more rhodopsin in the superior retina? We might speculate that the lighting in one of the animal colonies, coming from ceiling fixtures, directed more light to the inferior than to the superior retina. Such a distribution of light might account for the lower rhodopsin concentration in the inferior retina, but it does not explain why the animals that lived with laterally lighted cages were not different in this regard. Furthermore, and perhaps most importantly, neither of the colony lighting styles can explain why the Ganzfeld light is distributed non-uniformly. The optics of the rat eye might divert light away from other retinal regions and project it onto the inferior retina, either through an unusual distribution of refractive indices across the lens, the cornea, or both or because some structure(s) within the eye or retina reflects light away from the superior retina. Indeed, Campbell & Rushton (1955) reported that light reflected from nerve fibres, unevenly distributed across the human retina, might explain the reflection-densitometric observation that less rhodopsin seemed to exist nasal to the optic disc than temporal to it. They did not think it likely that two regions of the human rod ring had different rhodopsin concentrations. The present work shows that such local concentration differences should not be ruled out.
Our study provides direct evidence from individual eyes that the rate of photon absorption is nearly uniform across the rat retina despite the large regional differences in rhodopsin concentration and light intensity. This result supports our contention that one of the manifestations of photostasis is the maintenance of rod absorption rate at saturation levels. The present study shows that this rate is made nearly uniform across the retina by local adaptation of individual rods to local light intensity.
The maintenance of photostasis requires regulation of both the total rhodopsin content of the dark-adapted eye and the rate at which bleached rhodopsin is regenerated during light exposure. The former is the baseline of pigment, which is apparently controlled by habitat light intensity and day length; it is the amount of rhodopsin an animal has at the start of the day (Penn & Williams, 1986; Williams & Thistle, 1998). The latter determines the moment-to-moment availability of rhodopsin during the day for absorbing light and is known to depend on the extent of bleach (Penn & Williams, 1986, and references cited therein). How are these processes controlled?
It has been shown that the baseline levels of rhodopsin are plastic, responding to changes in the environmental light intensity (Schremser & Williams, 1995a; Williams & Thistle, 1998), but the molecular mechanisms whereby gene expression is changed by these environmental parameters are not yet understood. For example, Farber et al. (1991) reported that the level of opsin mRNA in rats raised in cyclic light differs greatly from that in rats raised in darkness. Yet Schremser & Williams (1995b) find no differences in opsin mRNA between rats raised at two different intensities of cyclic light. The latter study further showed that mRNA level is unchanged when rats are switched from a low to a high light intensity, even though new opsin synthesis is reduced to near-zero levels on the first day of that intensity switch.
The discrepancy may result from differences in method. Schremser & Williams (1995b) used Northern blots to analyse the mRNA results and an external truncated opsin standard added in known amounts to retinal homogenates. Farber et al. (1991) used slot blots and relied on internal, constitutive standards. In addition, the basic lighting protocols differed: Schremser & Williams compared two intensities of cyclic light; Farber et al. compared cyclic light and darkness. Although such differences can be cited, it is not clear how to reconcile the results from the two experiments. Obviously, the question of gene regulation in maintaining photostasis needs further study.
Acknowledgments
We thank Drs J. C. Smith and P. Trombley for the animals and Dr A. B. Thistle for editing the manuscript.
References
- Aguilar M, Stiles WS. Saturation of the rod mechanism of the retina at high levels of stimulation. Optica Acta. 1954;1:59–65. [Google Scholar]
- Campbell FW, Rushton WAH. Measurement of the scotopic pigment in the living human eye. The Journal of Physiology. 1955;130:131–147. doi: 10.1113/jphysiol.1955.sp005399. [DOI] [PMC free article] [PubMed] [Google Scholar]
- Cone RA. Quantum relations of the rat electroretinogram. Journal of General Physiology. 1963;46:1267–1286. doi: 10.1085/jgp.46.6.1267. [DOI] [PMC free article] [PubMed] [Google Scholar]
- Farber DB, Seager-Danciger JS, Organisciak DT. Levels of mRNA encoding proteins of the cGMP cascade as a function of light environment. Experimental Eye Research. 1991;53:781–786. doi: 10.1016/0014-4835(91)90114-t. 10.1016/0014-4835(91)90114-T. [DOI] [PubMed] [Google Scholar]
- Hughes A. A schematic eye for the rat. Vision Research. 1979;19:569–588. doi: 10.1016/0042-6989(79)90143-3. 10.1016/0042-6989(79)90143-3. [DOI] [PubMed] [Google Scholar]
- Kooijman AC, Witmer FK. Light distribution on the retina of a wide-angle theoretical eye. Journal of the Optical Society of America. 1986;73:57–64. doi: 10.1364/josa.73.001544. [DOI] [PubMed] [Google Scholar]
- Lashley KS. The mechanism of vision. V. The structure and image-forming power of the rat's eye. Journal of Comparative Psychology. 1932;13:173–200. [Google Scholar]
- Nakatani K, Tamura T, Yau K-W. Light adaptation in retinal rods of the rabbit and two other non-primate mammals. Journal of General Physiology. 1991;97:413–435. doi: 10.1085/jgp.97.3.413. 10.1085/jgp.97.3.413. [DOI] [PMC free article] [PubMed] [Google Scholar]
- Penn JS, Williams TP. Photostasis: regulation of daily photon-catch by rat retinas in response to various cyclic illuminances. Experimental Eye Research. 1986;43:915–928. doi: 10.1016/0014-4835(86)90070-9. [DOI] [PubMed] [Google Scholar]
- Pirenne MH. Liminal brightness increments. In: Davson H, editor. The Eye. New York: Academic Press; 1962. pp. 159–174. [Google Scholar]
- Rapp LM, Williams TP. A parametric study of retinal light-damage in albino and pigmented rats. In: Williams TP, Baker BN, editors. Effects of Constant Light on Visual Processes. New York: Plenum Press; 1980. pp. 135–159. [Google Scholar]
- Schremser J-L, Williams TP. Rod outer segment renewal as a mechanism for adaptation to a new intensity environment. I. Rhodopsin levels and ROS length. Experimental Eye Research. 1995a;61:17–24. doi: 10.1016/s0014-4835(95)80054-9. [DOI] [PubMed] [Google Scholar]
- Schremser J-L, Williams TP. Rod outer segment renewal as a mechanism for adaptation to a new intensity environment. II. Rhodopsin synthesis and packing density. Experimental Eye Research. 1995b;61:25–32. doi: 10.1016/s0014-4835(95)80055-7. [DOI] [PubMed] [Google Scholar]
- Williams TP. Light history and photostasis: what is a ‘normal’ rat retina? In: Williams TP, Thistle AB, editors. Photostasis and Related Phenomena. New York: Plenum Press; 1998. pp. 17–32. [Google Scholar]
- Williams TP, Henrich S, Reiser M. Effect of eye closures and openings on photostasis in albino rats. Investigative Ophthalmology and Visual Science. 1998a;39:603–609. [PubMed] [Google Scholar]
- Williams TP, Thistle AB, editors. Photostasis and Related Phenomena. New York: Plenum Press; 1998. [Google Scholar]
- Williams TP, Webbers JP. Photometer for measuring intensity and rhodopsin distributions in intact eyes. Applied Optics. 1995;34:5720–5724. doi: 10.1364/AO.34.005720. [DOI] [PubMed] [Google Scholar]
- Williams TP, Webbers JPP, Giordano L, Henderson RP. Distribution of photon absorption rates across the rat retina. The Journal of Physiology. 1998b;508:515–522. doi: 10.1111/j.1469-7793.1998.515bq.x. [DOI] [PMC free article] [PubMed] [Google Scholar]