

Abstract
We performed single channel analysis on human α3 acetylcholine receptors (AChRs) in Xenopus oocytes and native AChRs from the human neuroblastoma cell line IMR-32. α3 AChRs exhibit channel properties that reflect subunit composition.
α3β2 AChR open times were 0.71 ± 0.14 and 3.5 ± 0.4 ms with a predominant conductance of 26 pS. α3β4 AChRs had open times of 1.4 ± 0.2 and 6.5 ± 0.8 ms and a predominant conductance of 31 pS. Burst times were 0.82 ± 0.12 and 5.3 ± 0.7 ms for α3β2 and 1.7 ± 0.1 and 16 ± 1 ms for α3β4. Desensitization was faster for AChRs with the β2 subunit than for those with the β4 subunit.
One open time for α3α5β2 AChRs (5.5 ± 0.3 ms) was different from those of α3β2 AChRs. For α3α5β4 AChRs, an additional conductance, open time and burst time (36 pS, 22 ± 3 ms and 43 ± 4 ms, respectively) were different from those for α3β4 AChRs.
α3 AChRs were inhibited by hexamethonium or mecamylamine. The rate constants for block of α3β4 by hexamethonium and of α3β2 by mecamylamine were 1.2 × 10⁷ and 4.6 × 10⁷ M−1 s−1, respectively.
AChRs from IMR-32 cells had a predominant conductance of 32 pS and open times of 1.5 ± 0.3 and 9.6 ± 1.2 ms. These properties were most similar to those of α3β4 AChRs expressed in oocytes. Antibodies revealed that 5 ± 2% of IMR-32 α3 AChRs contained α5 subunits and 6 ± 2% contained β2 subunits. IMR-32 α3 AChRs are primarily α3β4 AChRs.
Neuronal nicotinic acetylcholine receptors (AChRs) are expressed throughout the central and peripheral nervous system where their subunits are encoded by eleven genes identified as α2-9 and β2-4 (Papke, 1993; McGehee & Role, 1995; Lindstrom, 1996). The large variety of possible subunit combinations resulting from the multitude of nicotinic genes has led to considerable functional diversity for nicotinic AChRs expressed in tissues throughout the nervous system and in heterologous expression systems. Genes for multiple AChR subunits are often transcribed within the same cell. For example, neurons of peripheral ganglia have been shown to express α3, α5, α7, β2 and β4 subunits (McGehee & Role, 1995; Lindstrom, 1996). AChRs that are expressed in ganglia represent the best-characterized source of native neuronal nicotinic AChRs at many levels including functional, structural and histological (reviewed in the following: Papke, 1993; Sargent, 1993; McGehee & Role, 1995; Lindstrom, 1996). AChRs expressed in ganglia have been attributed mainly to two types, the α7 type that may be homomeric, and the α3 type that consists of α3 subunits assembled with α5, β2 and/or β4 subunits. α7 AChRs are characterized by their sensitivity to inhibition by α-bungarotoxin (α-BuTX), rapid desensitization and relatively low sensitivity to activation by acetylcholine (ACh), while α3 AChRs are α-BuTX insensitive, desensitize more slowly and are activated by ACh with more potency.
The subunit composition of AChRs has been shown to determine a number of pharmacological and functional properties. These include apparent affinities for both agonists and antagonists, agonist efficacy and desensitization rates (Luetje et al. 1990; Cachelin & Jaggi, 1991; Luetje & Patrick, 1991; Papke & Heinemann, 1994). Determining the subunit composition of human ganglionic AChRs is crucial to understanding the physiological roles played by these AChRs and to developing effective therapeutic agents that may target particular AChRs.
The dependence of AChR function on subunit composition has been studied extensively through expression of invitro transcribed RNA in Xenopus oocytes coupled with electrophysiological approaches. Early studies that utilized this approach quickly established the functionality of pairwise combinations of α2, α3 or α4 with β2 or β4 subunits (Papke, 1993, and references therein). On the other hand, early attempts to establish the functionality of α5, α6 and β3 were unsuccessful when these were coinjected with any known α or β subunit. Much later studies established functionality for the α6 subunit when coexpressed with the β2 or β4 subunits (Gerzanich et al. 1996; Fucile et al. 1998). Recent reports suggest that the α5 subunit of chicken or human does not contribute to the agonist binding site but serves a structural role, since assembly into surface AChRs requires both an α3 and a β subunit (Conroy et al. 1992; Wang et al. 1996). Assembly of the human α5 subunit into α3 AChRs altered many of the functional and pharmacological properties of the resulting AChRs (Gerzanich et al. 1998). Similarly, the α5 subunit altered the functional properties of α4β2 AChRs (Ramirez-Latorre et al. 1996; Kuryatov et al. 1997). Finally, the β3 subunit has recently been shown to assemble with α4 AChRs in rat brain (Forsayeth & Kobrin, 1997) and to assemble into functional AChRs when expressed heterologously with α3 and β4 subunits (Groot-Kormelink et al. 1998).
Even though the functional properties of ganglionic α3 AChRs have been well described, questions concerning the subunit composition of native α3 AChRs remain (McGehee & Role, 1995; Lindstrom, 1996). To address these questions many studies have relied on approaches that utilize pharmacological fingerprinting of heterologously expressed AChRs. Pharmacological profiles established for these subunit-defined AChRs and for AChRs studied in native tissues provide a basis for comparison. Matches between profiles substantiate subunit identity. However, no exact match has been found between heterologous AChRs and native ganglionic AChRs (Covernton et al. 1994; Sivilotti et al. 1997). This might reflect differences in the expression environment between native cells and heterologous systems.
Here, we have used single channel analysis to characterize the impact of the various AChR subunits that have been identified in ganglia on human α3 AChR function, i.e. AChRs formed from coexpression of α3, α5, β2 and β4 subunits in pairs or as triplets. We have found that for human α3 AChRs, substituting β4 for β2 resulted in an increase in open and burst times, with a slight change in channel conductance. When the α5 subunit was coexpressed with α3β2, the resulting α3α5β2 AChRs had a new open time that was not observed for α3β2 AChRs. When the α5 subunit was coexpressed with α3β4, the α3α5β4 AChRs had a new open time, altered burst times and an additional conductance state that were not observed for α3β4 AChRs. Comparison of oocyte-expressed AChR single channel properties with those of AChRs in the human neuroblastoma cell line IMR-32 suggests that the predominant functional AChR expressed in these cells is probably composed of α3 and β4 subunits. Functional properties that were linked to the presence of β2 and α5 subunits in heterologous AChRs were not observed in AChRs recorded from IMR-32 cells. This was consistent with the low level of β2- and α5-containing AChRs identified by radioimmunoassay of these cells.
METHODS
Oocyte expression
cRNA from linearized cDNA templates for the human α3 (Wang et al. 1996), α5 (generously provided by Chini et al. 1992), β2 (Anand & Lindstrom, 1990) and β4 (Gerzanich et al. 1996) AChR subunits was synthesized in vitro using either T7 or SP6 RNA polymerase (depending on the expression vector) with mMessage mMachine (Ambion, Austin, TX, USA). As described previously (Wang et al. 1996), oocytes were removed surgically from Xenopus laevis under anaesthesia with 0.2 % tricaine (Sigma) in accordance with guidelines set forth by the Institutional Animal Care and Use Committee (IACUC) at the University of Pennsylvania under an approved protocol on file with that office. IACUC operates under an institutional Animal Welfare Assurance (A3079-01) on file with the Office for Protection from Research Risks at the National Institutes of Health, Rockville, MD, USA. After enzymatic dispersal oocytes were injected cytosolically with 10-25 ng of RNA per oocyte and incubated at 18°C in Leibovitz L-15 media (Gibco Laboratories) diluted 50 % in 10 mM Hepes (pH 7.3 with NaOH). Expression levels were monitored by two-electrode voltage clamp in oocytes that had been injected at least 4 days earlier. Near-saturating concentrations of ACh (usually 300 μM) were applied to the oocytes by a gravity fed glass capillary tube that was connected to a reservoir mounted above the recording chamber. ND-96 was used for recording and had the following composition (mM): NaCl, 96; KCl, 2; MgCl2, 1; CaCl2, 1.8; and Hepes, 5; pH 7.6 with NaOH and atropine sulfate (1 μM). Electrodes were filled with 3 M KCl and had resistances of 3-5 and 0.5-3 MΩ for the voltage and current electrodes, respectively. Oocytes clamped at -50 mV that exhibited currents greater than 5 μA were selected for attempts at single channel recording in isolated outside-out patches.
Electrophysiology - Xenopus oocytes
Xenopus oocytes were manually stripped of the vitelline membrane following osmotic shrinking with a 200 mM potassium aspartate solution (Methfessel et al. 1986). Outside-out configuration patches (Hamill et al. 1981) were formed from stripped oocytes expressing recombinant human AChRs. Single channel recordings were made in the ND-96 solution that was used for the oocyte screening. The patch pipette contained a solution consisting of (mM): CsF, 80; CsCl, 20; Cs-EGTA, 10; Hepes, 10; and MgATP, 3; pH 7.2 with CsOH. Electrodes were formed from borosilicate glass tubing (World Precision Instruments) and had resistances of typically 7-15 MΩ.
Electrophysiology - IMR-32 cells
IMR-32 cells were obtained from American Type Culture Collection (Rockville, MD, USA) and maintained in culture medium consisting of a combination of Ham's F12 and Eagle's Minimal Essential Medium (MEM) (1:1; Sigma), and 10 % fetal bovine serum (Hyclone Laboratories, Logan, UT, USA). For recording, cells were detached by incubation in 5 mM EDTA in standard phosphate-buffered saline and then resuspended in normal culture medium followed by plating onto bare 12 mm diameter glass coverslips. After 1 day, the serum in the medium was reduced to 1 % to increase the number of surface AChRs as measured by binding of 125I-mAb 210, a monoclonal antibody that binds to α3 and α5 subunits. Recordings were attempted 3-7 days after plating to allow for adequate cell attachment. For IMR-32 cells, the same solutions that were used for recording oocyte-expressed AChRs were used with the addition of 50 mM dextrose (Sigma) to the external (bath) solution to increase the osmolarity, which seemed to promote better seal formation. Recordings for IMR-32 and heterologous α3β4 AChRs were also performed under ‘high sodium conditions’, reflecting the higher concentration of sodium in the external solution, which contained (mM): NaCl, 165; KCl, 5; CaCl2, 2; Hepes, 5; and dextrose, 10; pH 7.3 with NaOH. Patch pipettes under high sodium conditions contained a solution consisting of (mM): caesium gluconate, 145; Cs-EGTA, 10; and Hepes, 10; pH 7.2 with CsOH.
Data acquisition and analysis
Single channel currents were activated in patches by application of ACh flowing from one barrel of a two-barrel glass capillary tubing. Prior to the application of agonist, the patch was isolated in a continuously flowing control solution from the other barrel. Drug solutions were selected between by a 6-way valve. All drugs were prepared by diluting from stocks that were stored either frozen (acetylcholine chloride and hexamethonium bromide; both from Sigma) or at 4°C (mecamylamine; Merck Sharp & Dohme Research Laboratories, Rahway, NJ, USA). Recordings were obtained with an Axopatch-1D amplifier (Axon Instruments) and sampled with a VR-10A digital data recorder (Instrutech Corp., Great Neck, NY, USA) onto video media (Sharp Corp., Osaka, Japan; VHS model VC-A206C) for later analysis. Signals were sampled off-line at 10 kHz (for dwell times) or 15 kHz (for all-points amplitude determinations and channel block experiments) (Axoscope 2.0, Axon Instruments) and were usually filtered at 3 kHz, while some patches required 2 kHz filtering (Frequency Devices, Inc., Haverhill, MA, USA; Model 902; 8-pole Bessel, -3 dB) for analysis, due to higher noise levels. All single channel analyses and fitting were performed with pCLAMP 6.0.3 (Axon Instruments). For channel open time determinations, events list files were formed by visual inspection of the data and manually accepting or rejecting putative events. The data in the events list files were then log binned into histograms using seven to nine bins per decade and fitted with exponential functions using the method of maximum likelihood of the estimator and a Simplex algorithm. Events having durations of less than two sample intervals were ignored during fitting which would concatenate the events flanking those which were expunged. The number of components that best described the fits was evaluated by visual scrutiny of the goodness of the fit and by the natural logarithm of the ratio of the maximum likelihood for each model defined as follows: ln(maximum likelihood of the estimator for a model with n+ 1 components/maximum likelihood of the estimator for a model with n components). The log of the likelihood ratio was usually necessary only when the improvement in the estimate was questioned between two and three components. In this case, values less than 3 for the ratio were considered insufficient improvement to justify the greater number of parameters.
Burst durations were estimated by determining a critical gap time that would establish a delineation between intraburst closed times and interburst closed times so that the theoretical rate of misclassification of each as the other would be equal. The probability density functions describing the fits (see Fig. 5) of the brief and long closed times were integrated, set equal, and then solved (Maple V, release 3; Waterloo Maple, Waterloo, Ontario, Canada) for the critical time at which the areas of overlap were equal (e.g. Magleby & Pallotta, 1983; Jaramillo & Schuetze, 1988). Estimates for the critical times were evaluated further using the test burst interval that is part of pSTAT (pCLAMP 6.0.3) by optimizing both burst duration and the number of closings per burst. The procedure involves incremental increases in the critical time value while analysing the relationship to mean burst duration (or closings per burst) until a plateau reveals possible burst structure from events list analysis files. Mean channel burst times defined by the resulting critical time approximate the activation period of the AChR, i.e. the rate of channel closures that are followed by agonist dissociation and/or the rate at which AChR desensitization occurs. Typical critical gap times usually ranged between 1 and 3 ms. Closed times shorter than the critical gap were considered intraburst closed times and those longer than the critical gap were considered interburst closed times. Misclassification rates of closed times according to intrabursts erroneously classified as interbursts or interbursts erroneously classified as intrabursts were sometimes as high as 5 % of all closed intervals. Misclassification occurred due to the overlap in distributions of the inter- and intraburst closed intervals (see Fig. 5).
Figure 5. Closed time distributions for α3 AChRs expressed in oocytes.

Examples of closed time distributions were fitted with exponential functions as described in Methods. For these patches, four components could adequately describe the data. The time constants determined from the fits are given for each patch. These values were used to set the critical times for burst definitions. For α3β2 and α3α5β2 AChRs, the fastest time constant was defined as the intraburst closed time, while the three longer time constants were set as between burst closed times. For α3β4 and α3α5β4 AChRs, the two shortest time constants were set as intraburst closed times, while the two longest time constants were set as between burst closed times. Channels were activated by 1 μM ACh for α3β2 and α3α5β2, while 5 μM ACh was used for α3β4 and α3α5β4 AChRs. The holding potential was -80 mV.
Open level amplitude histograms (mean amplitude of samples during individual channel openings) were formed by conventional binning of accepted events that were longer in duration than 2.5 times the filter rise time (Tr = 0.3321/fc, where fc is the effective cut-off frequency of the system). The resulting distributions were fitted with a Gaussian function of the appropriate number of components. Conductances were determined from the slope of a linear fit of channel amplitudes determined at several holding potentials. The slopes at negative voltages were extrapolated to estimate their reversal potentials. This reversal potential was used to calculate a chord conductance for channels with insufficient activity to determine a true slope conductance by using the amplitude at -80 mV and then dividing by the difference between the holding potential and the reversal potential. All conductances were then corrected for liquid junction potentials that were measured for the appropriate recording conditions (Neher, 1992). For patches recorded with ND-96 conditions, the liquid junction potential was 9 mV and for patches recorded with high sodium conditions, the liquid junction potential was 13 mV. For graphical representation, histograms with fits were exported to Origin (Microcal Software, Inc., Northampton, MA, USA). Representative single channel traces were constructed by opening data files in Axograph 3.55 (Axon Instruments) and exporting data to Canvas 5.0 (Daneba Software, Inc., Miami, FL, USA).
Radioimmunoassays (RIA)
IMR-32 cells were grown as described above until just before confluence in T-175 (175 cm2) tissue culture flasks (Falcon 3112, Becton Dickinson, Franklin Lakes, NJ, USA) then detached with 5 mM EDTA in phosphate-buffered saline, pelleted by centrifugation, and frozen after removal of media. Previously frozen IMR-32 cells were suspended in a 2 % Triton X-100 buffer (50 mM Na2HPO4-NaH2PO4 pH 7.5, 50 mM NaCl, 5 mM EDTA, 5 mM EGTA, 5 mM benzamidine, 15 mM iodoacetamide, 2 mM phenylmethylsulfonyl fluoride and 2 % Triton X-100) at a 3 : 1 to 6 : 1 ratio (buffer volume : cell volume) and placed on a rotating mixer for 1 h at 4°C. Cellular debris was removed by centrifugation and supernatant extract was collected.
For solid phase RIA, AChRs solubilized in Triton X-100 buffer were incubated in Immulon 4 microwells (Dynatech Laboratories, Chantilly, VA, USA) coated with monoclonal antibody mAb 210 (specific for α3 and α5 AChRs; Wang et al. 1996) or mAb 295 (specific for β2 AChRs; Whiting & Lindstrom, 1988) with 5-15 nM 3H-epibatidine for 12 h at 4°C. Unbound material was removed from wells by washing 3 times with cold 0.5 % Triton X-100 in 100 mM NaCl. Bound AChRs were eluted from wells with 2.5 % SDS containing 5 %β-mercaptoethanol. The amount of bound 3H-epibatidine was determined by liquid scintillation counting. Background was determined using wells coated with bovine serum albumin or by including 2 mM nicotine in antibody-coated wells.
For immunoprecipitation assays, the IMR-32 AChRs were solubilized in Triton X-100 buffer as above and then incubated with excess mAb 210 or rat antiserum to human α5 (Wang et al. 1998) in the presence of 5-15 nM 3H-epibatidine for 12 h at 4°C. mAb 299 (Kuryatov et al. 1997) or a rat antiserum to human α4 (antigen was a bacterially expressed human α4 construct; A. Kuryatov & J. Lindstrom, unpublished data) were used to test for the presence of α4 AChRs in IMR-32 extracts. Rat antiserum to α6 AChR subunits (antigen was a bacterially expressed human α6 construct; A. Kuryatov & J. Lindstrom, unpublished data) was also tested on IMR-32 AChR extracts. Excess sheep anti-rat IgG was then added to precipitate antibody-bound AChRs for 2 h at 4°C. The mixture was then diluted 1 : 10 with 0.5 % Triton X-100 in 100 mM NaCl and centrifuged to pellet the precipitate. The pellet was washed two more times with the 0.5 % Triton X-100 solution and then suspended in 2.5 % SDS-5 %β-mercaptoethanol. The amount of epibatidine bound was determined by liquid scintillation counting. Background was determined by parallel assays containing normal rat serum instead of the antibody used for testing.
RESULTS
The β subunit determines the single channel conductance of α3 AChRs
We investigated the contributions of β2, β4 and α5 subunits to human α3 AChRs expressed in Xenopus oocytes and compared the channel properties with those of AChRs expressed by IMR-32 human neuroblastoma cells.
Application of ACh to outside-out patches from oocytes expressing AChRs resulting from combinations of these subunits evoked single channel activity that exhibited differing kinetic behaviour. Examples of channel activity reflecting these AChR subunit combinations are shown in Fig. 1.
Figure 1. Heterologous α3 AChR single channel currents.

Each panel depicts representative single channel recordings for outside-out patches from oocytes that were injected with the indicated combination of human AChR subunit transcripts. ACh concentrations were 1, 5, 10 and 5 μM for α3β2, α3α5β2, α3β4 and α3α5β4, respectively. All channels were recorded at a holding potential of -80 mV. The data were filtered at 2 kHz for display and are not necessarily contiguous.
α3β2 AChRs activated by ACh (0.5-1 μM) exhibited channel openings that had two different conductance levels. Open level histograms revealed amplitudes of -1.6 ± 0.1 (mean ±s.e.m.; n = 6 patches) and -2.1 ± 0.1 pA (n = 7; Fig. 2) at a holding potential of -80 mV. The slope conductance of these channels was determined from their current-voltage relationship using all-point amplitude histograms fitted to Gaussian functions having the appropriate number of components. The slope conductance of between -100 and -40 mV for the higher conductance type of α3β2 AChRs was 26 pS. This represented the predominant (78 %) conductance during prolonged recording (not shown). The extrapolated reversal potential was not significantly different from 0 mV (P > 0.05, Student's t test; n = 5) as would be expected for a non-selective cation channel. At positive holding potentials, a slight outward rectification in the slope conductance was observed between +40 and +60 mV (not shown). Although not as prevalent as the 26 pS channel openings, lower conductance openings were often observed (in 6 out of 7 patches) that had sufficient activity to determine a slope conductance of 21 pS. This lower conductance channel opening also displayed a slight outward rectification at positive holding potentials. The lower conductance channel openings were more prevalent during the beginning of the agonist applications, which is when the amplitudes were measured for the slope conductance.
Figure 2. Representative open level amplitude histograms for α3 AChRs expressed in oocytes.

For each subunit composition, open level amplitude histograms were constructed from events list files created to include all event amplitudes that could be discerned for a particular patch (either one or two conductance levels). The fits to Gaussian functions with the appropriate number of components are also shown. For the α3α5β4 AChRs, distributions for two patches are superimposed. One of the patches has two components and the other only one, while together they represent the three conductances observed for this subunit combination. The mean values represent the mean from several patches including the example shown. The holding potential was -80 mV.
α3β4 AChRs activated by ACh (5 μM) exhibited channel openings that had predominantly a single conductance. At -80 mV, the amplitude of these channel openings was -2.3 ± 0.1 pA (n = 4; Fig. 2). A lower amplitude channel opening (-1.6 ± 0.1 pA; n = 3) was sometimes present, but at low frequency. The slope conductances of these AChRs were 31 and 24 pS, respectively. The extrapolated reversal potentials were not significantly different from 0 mV (P > 0.05; n = 4). At positive holding potentials, the currents showed slight outward rectification, similar to that observed for α3β2 AChRs.
Channel open times of α3β2 AChRs are faster than those of α3β4 AChRs
Open time histograms of α3β2 AChR activity were best fitted by double exponential probability density functions with time constants of 0.71 ± 0.14 and 3.5 ± 0.4 ms (n = 6; Fig. 3). All patches had both components. The area under the components of the fitted function correlates with the number of openings that each time constant represents. Thus, 65 % of the channel openings were of the faster type and 35 % were the slower type.
Figure 3. Representative open time distributions for α3 AChRs expressed in oocytes.
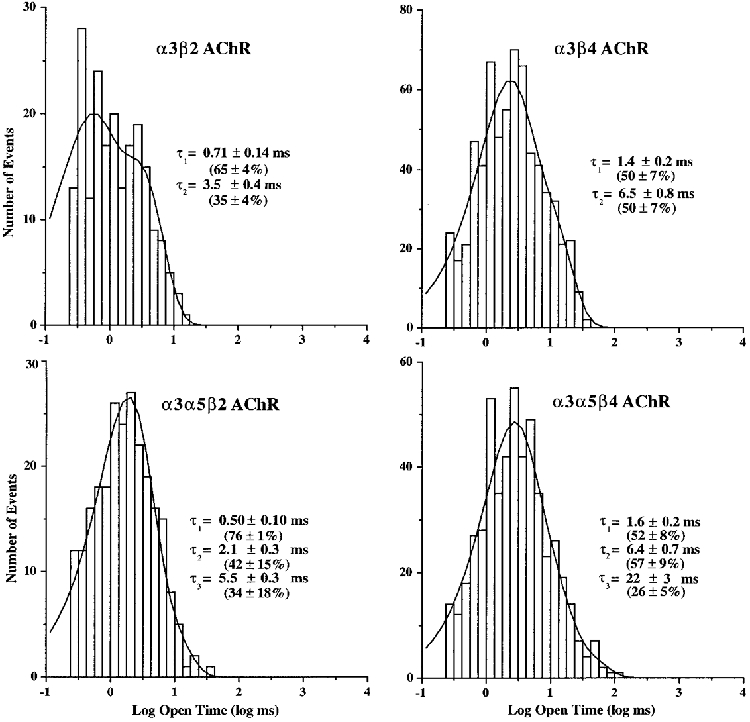
For each subunit combination, log-binned histograms were constructed from events list files for the predominant conductance for that channel. As shown, the histograms were fitted with exponential functions of the appropriate number of components using the method of maximum likelihood. Time constants reflect the mean values observed for all patches including components that may not have been present in the representative example. Percentages reflect the mean areas from the fits that correspond to each exponential component when present. The holding potential was -80 mV.
Open time histograms for α3β4 AChRs were also best fitted by double exponential functions having time constants of 1.4 ± 0.2 and 6.5 ± 0.8 ms (n = 5; Fig. 3). All patches contained both components. Each component represented 50 % of the distributions, which indicated that the gating of the α3β4 channel favoured the two types of openings equally.
α3β2 AChRs exhibit shorter bursts than α3β4 AChRs
The tendency of α3 AChRs to run down during recording complicates the evaluation of burst durations since channel activity cannot be monitored for extended periods to distinguish unequivocally between desensitized and resting states. The problem of run-down has previously been reported for nicotinic AChRs (Fenwick et al. 1982; Alkondon et al. 1994). Attempts to counter run-down by altering the recording electrode solution in ways that have proven useful in other systems were unsuccessful. Changes that were tested included addition of phosphocreatine, creatinine phosphokinase, Mg-ATP and/or the catalytic subunit of protein kinase A or changing to a purely chloride-based recording solution. It is possible that the problem of run-down might be avoided under cell-attached recording, but our experience has been that endogenous stretch-activated channels in oocytes (Methfessel et al. 1986) present a bigger problem when using this configuration.
Even though the actual values of burst durations might be adversely affected by less than optimal conditions for burst analysis, values obtained in this way provide insight into gating mechanisms for these AChRs. Furthermore, burst times broaden our understanding of the overall impact that various AChR subunits have on α3-type nicotinic AChR gating and help correlate single channel behaviour with macroscopic currents. Burst durations were defined by evaluating closed time distributions (Fig. 5) for the appropriate critical gap time that would be likely to encompass channel closures that occur during the time that agonist is bound by the AChR (see Methods).
Histograms of burst durations for α3β2 AChRs were best described by double exponential functions. The time constants for the two components were 0.82 ± 0.12 and 5.3 ± 0.7 ms (n = 6; Fig. 4). Each component was present in all patches and represented 57 and 43 % of the openings, respectively. The mean number of openings in the longer duration bursts was two, based on the open times. Increasing the burst critical closed time up to fivefold had little effect on time constants that described the burst distributions, which supports the idea that the definition of intra- and interburst closed times was adequate.
Figure 4. Representative burst durations for α3 AChRs expressed in oocytes.
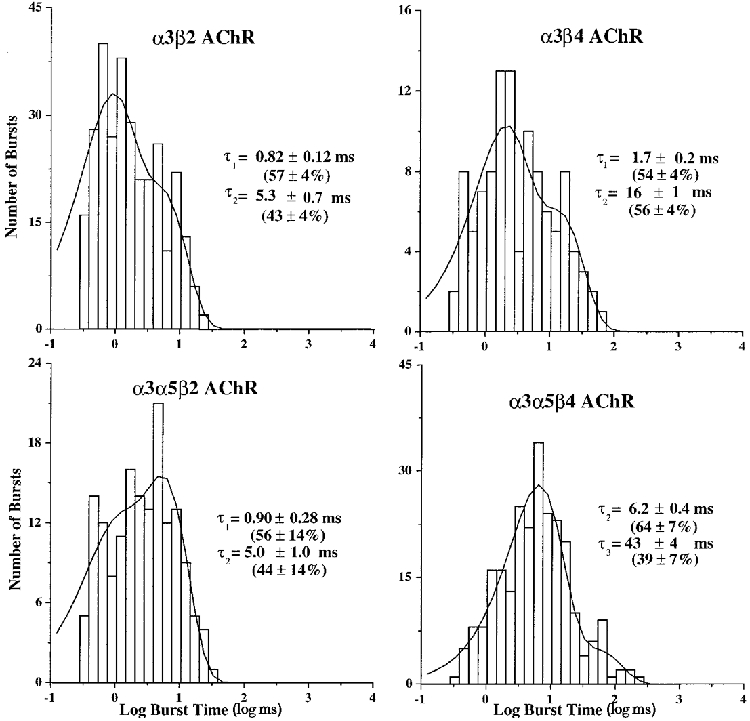
For each subunit combination, log-binned histograms were constructed from events list files for the predominant channel conductance. The burst criterion times were evaluated as described in Methods. The histograms were fitted with exponential functions of the appropriate number of components using the method of maximum likelihood. The time constants reflect the mean of values observed for all patches for that AChR. The percentages reflect the mean areas from the fits that correspond to each exponential component when present. The holding potential was -80 mV.
α3β4 AChR burst time histograms were also best described by double exponential functions, having time constants of 1.7 ± 0.2 and 16 ± 1.0 ms (n = 5; Fig. 4). All patches contained both components and they represented 54 and 56 % of the bursts, respectively. The mean number of openings per long burst was approximately two. The duration of the shorter burst was the same as the shorter open time, which reveals a distinction between the transition that accounts for terminating these openings and the transition that accounts for terminating longer duration bursts. The longer burst duration of α3β4 channels compared with α3β2 channels reflects a slower rate of channel closure in combination with slower desensitization resulting in longer activation during agonist binding to the AChR. This difference correlates with the slower time course in the decay of α3β4 AChR macroscopic currents compared with the decay of α3β2 AChR macroscopic currents (Wang et al. 1996; Chavez-Noriega et al. 1997; Gerzanich et al. 1998).
α3β2 AChRs desensitize and inactivate faster than α3β4 AChRs
At similar concentrations of ACh, α3β2 AChRs had a greater tendency to desensitize than α3β4 AChRs. For example, when α3β2 channels were activated with 5 μM ACh, high levels of channel activity that desensitized relatively quickly were observed. Histograms of averaged channel opening frequency over the first 100 s of the recording could be fitted with a double exponential function having time constants of 1.1 and 37 s (data not shown). By contrast, when 5 μM ACh was applied to patches containing α3β4 AChRs, the average frequency histogram of channel activity was best fitted by a function having time constants of 3.2 and 127 s (data not shown). This indicated that α3β2 AChRs desensitized faster than α3β4 AChRs. Additionally, both channel types exhibited permanent inactivation or ‘run-down’ during recordings. α3β2 AChR channels exhibited run-down faster than α3β4 AChRs, even when recorded at agonist concentrations that favoured less desensitization. Although not determined precisely, permanent inactivation typically occurred for α3β2 AChRs within about 4-5 min during continuous recording, while α3β4 AChRs remained active 3-4 times longer. These results are consistent with the faster decay of macroscopic currents for human α3β2 compared with α3β4 AChRs when expressed in oocytes (Wang et al. 1996; Chavez-Noriega et al. 1997; Gerzanich et al. 1998).
α5 subunits have little effect on α3β2 AChR single channel properties in contrast with the large effect of α5 on α3β4 AChR single channel properties
Coexpression of α5 with the α3 and β2 subunits yielded single channel behaviour that had subtle differences compared with that observed for α3β2 AChRs (Fig. 1). Amplitude distributions for α3α5β2 AChRs exhibited two conductance levels. These conductances were essentially the same as those seen for α3β2 AChRs (Fig. 2). The amplitudes were -1.5 and -2.0 pA at -80 mV. The proportions of channel openings for each conductance type, when present, were 50 and 60 % for the lower and higher conductance channels, respectively. Four out of five patches had the lower conductance channel openings, while all patches had the higher conductance channel openings. The slope conductances for these AChRs were not determined due to difficulties in achieving adequate expression levels during coexpression of the α5 subunit with the α3 and β2 subunits. This problem was unique to coexpression of α5 with the β2 subunit, and was not found with the β4 subunit (see below). However, assuming the same reversal potential for α3α5β2 as was found for α3β2 AChRs, the slope conductances were estimated to be 22 and 26 pS, which were not different from the values estimated for α3β2 AChRs. Similar to what was observed for α3β2 AChRs, the channel activity from coexpression of α3, β2 and α5 subunits inactivated within 2-3 min after onset of activity during continuous recording and within about 5 min after pulling the patch, even if not continuously in agonist.
Incorporation of the α5 subunit caused the appearance of a new component in the open time distributions compared with those observed for α3β2 AChRs. The distributions of open times were fitted by double exponential functions for all patches. After pooling the results from the fits of all patches, three time constants were identified, which were 0.50 ± 0.10, 2.1 ± 0.3 and 5.5 ± 0.3 ms (Fig. 3). Four out of five patches had the fastest component, while each of the other components was present in three out of five patches. The percentages of openings for each component when it was present were 76, 42 and 34 %, respectively.
The burst distributions for α3α5β2 AChRs were all fitted best by double exponential functions. The mean time constants were 0.90 ± 0.28 and 5.0 ± 1.0 ms. All patches (n = 5) had both components and they represented 56 and 44 % of the bursts, respectively (Fig. 4).
Coexpression of α5 with α3 and β4 subunits caused a considerable change in the single channel properties compared with α3β4 AChRs. The α3α5β4 AChRs had an additional larger conductance channel, a longer channel open duration and increased burst duration. Application of ACh (5 μM) to patches containing AChRs formed from coexpression of α3, α5 and β4 subunits evoked high levels of well-sustained channel activity. Desensitization occurred over a period of 2-3 min, but channel activity could be recovered by periodically moving between control and agonist solutions.
Three separate channel amplitudes were observed, which were -1.7, -2.2 and -2.6 pA at -80 mV (Fig. 2). The lowest amplitude channel appeared in three out of ten patches, the intermediate channel appeared in nine out of ten patches, and the largest amplitude channel appeared in three out of ten patches. The proportions of channel openings for each channel level were 39, 81 and 51 %, when present, respectively. Only the intermediate amplitude channel type had sufficient activity to obtain recordings at enough holding potentials to determine a slope conductance, which was 31 pS. This conductance was not significantly different from the conductance determined for oocytes expressing α3β4 AChRs. The extrapolated reversal potential was not significantly different from 0 mV (P > 0.05; n = 5). By assuming the same reversal potential, the slope conductances were calculated to be 24 pS for the lower amplitude channel and 36 pS for the higher amplitude channel.
The open time distributions for the AChRs formed by coexpression of the α3, α5 and β4 subunits were usually best fitted by double exponential functions. Only three out of ten patches exhibited the presence of all three components. The channel kinetics appeared to be similar for all conductance levels. The time constants for the three different open times were 1.6 ± 0.2, 6.4 ± 0.7 and 22 ± 3 ms (Fig. 3). The components were present in seven, seven and eight out of ten patches, respectively, and represented 52, 57 and 26 %, respectively, of the open times when present. We considered the possibility that agonist concentration might influence the observed kinetic properties by differentially activating (or by failing to activate) AChRs of different compositions that had differing agonist affinities, but this was not evident from the data, which was recorded mostly at concentrations of 5 or 10 μM ACh. However, if this was the case, one might expect to see a change in kinetic properties over the time course of a recording. Such instability would be evident in scatter analysis of open time versus elapsed time of recording. Such an analysis (Fig. 7) indicated that both short and long duration openings occurred throughout a recording of α3α5β4 activity, which only differs from α3β4 activity in the magnitude of the longer duration openings. Although some of the single channel properties found for α3α5β4 AChRs resemble those of α3β4 AChRs, the emergence and prominence of the longest duration channel type (Fig. 6) leads to the conclusion that it reflects a novel population of channels. These channels can be attributed logically to AChRs that have incorporated the α5 subunit. However, there was not an exclusive correlation between the largest conductance and longest duration opening, since the intermediate conductance channel exhibited long duration openings as well. This point raises the possibility of multiple conductance levels for α5 AChRs and shows that conductance alone may be inadequate to identify the presence of the α5 subunit in AChRs that also contain α3 and β4 subunits.
Figure 7. Open time versus time elapsed during recording of α3β4 AChRs and α3α5β4 AChRs in oocytes.
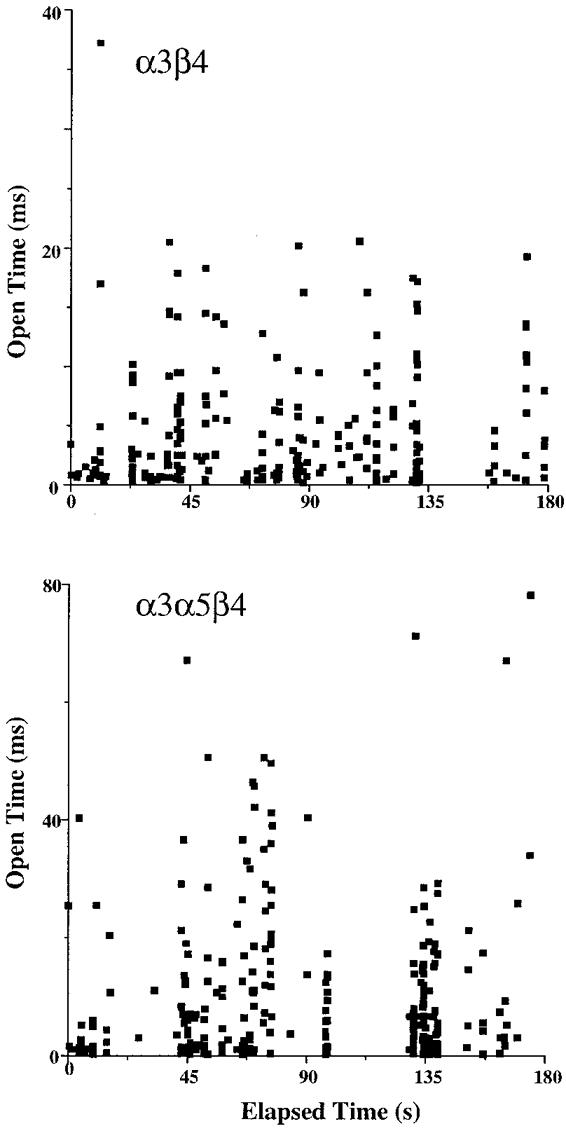
These plots demonstrate the persistence of channels of all kinetic types throughout the duration of the recordings. Note the difference in ordinate magnitudes for the two channel types and the much longer duration channel openings for α3α5β4 versusα3β4 AChRs.
Figure 6. Segments of recording demonstrating the longer bursting channels of α3α5β4 AChRs.
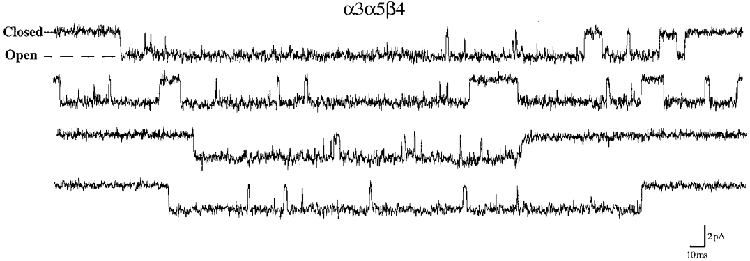
This recording was made at -80 mV and has been scaled so that it can be compared directly to the recordings presented in Fig. 1. Note the dramatic increase in duration of channel openings and bursts compared with α3β4 AChRs without the α5 subunit.
The burst kinetics for AChRs formed from α3, α5 and β4 subunits were distinct from those observed for α3β4 AChRs. The mean burst times were 6.2 ± 0.4 (n = 9) and 43 ± 4 ms (n = 8; Fig. 4). The two components were present in nine or eight out of ten patches, respectively, and represented 64 and 39 %, respectively, of bursts when present. Examples of the longer duration bursts observed for α3α5β4 AChRs are shown in Fig. 6. Judging from the open durations, the bursts for α3α5β4 AChRs reflected both single and multiple openings (2-4 on average) of the channel, assuming that the 6 ms burst included 2 and 6 ms channel openings and the 43 ms burst included the 22 ms openings as well as the others. The burst criterion time could be increased up to fivefold without a significant difference in the burst distributions. The persistence of the longer duration openings throughout the recording (Fig. 7) supports the conclusion that incorporation of the α5 subunit is reflected in the longer duration bursts.
Sensitivity of α3β2 and α3β4 AChRs to inhibition by hexamethonium or mecamylamine
Single channel recordings from patches excised from Xenopus oocytes can sometimes be contaminated by spontaneous activity from an endogenous non-selective cation channel that is mechanosensitive (Methfessel et al. 1986). Although this ‘stretch-activated’ channel activity is less common in the outside-out patch configuration, it was sometimes observed during attempts at recording AChR activity for the present study. Patches that clearly exhibited these spontaneous stretch-activated channels were not used for analysis. To demonstrate the nicotinic nature of the channels analysed for the present study, and to distinguish them from the possible stretch-activated channels, activity recorded in some patches was blocked by the traditional nicotinic antagonists mecamylamine and hexamethonium. Channel activity evoked by application of 1 μM ACh to an outside-out patch from an oocyte expressing α3β2 AChRs was blocked nearly completely by mecamylamine (50 μM) or hexamethonium (100 μM; Fig. 8A). α3α5β2 AChRs were also blocked by mecamylamine (Fig. 8A). The channels that remained in the presence of this high concentration of mecamylamine had shorter duration open times and much reduced open frequency, consistent with a high affinity channel block mechanism. Channels that were blocked by hexamethonium were of shorter open duration, but their open frequency appeared less affected, consistent with a lower affinity channel block.
Figure 8. Channel blockade of oocyte-expressed α3 AChR single channel currents by hexamethonium or mecamylamine.
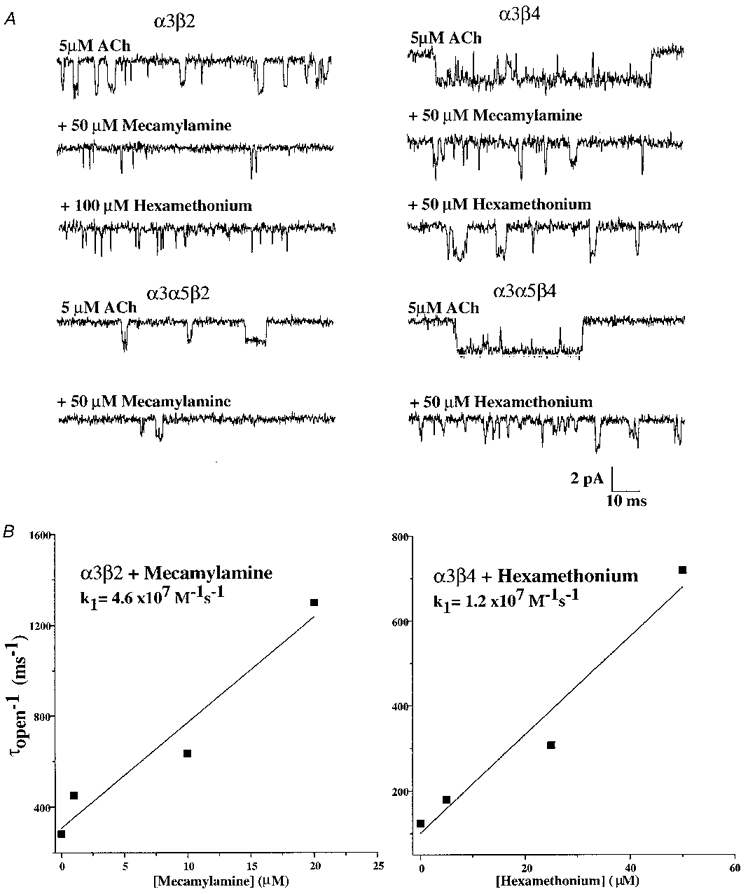
A, all α3 subunit combinations were sensitive to inhibition by hexamethonium or mecamylamine. α3β2 and α3α5β2 AChRs were potently inhibited by mecamylamine as evidenced by the large reduction in opening frequency and shorter duration openings. Hexamethonium blocked α3β4 and α3α5β4 AChRs by reducing the channel open duration but did not reduce the channel open frequency. All traces were recorded at -80 mV. The block by both agents was reversible after 1 min washout. B, the relationship for reciprocal open time versus concentration of the blocking agent reveals their forward block rate constants. The relationship for hexamethonium block of α3β4 AChRs revealed a blocking rate of 1.2 × 10⁷ M−1 s−1. For mecamylamine block of α3β2 AChRs, the rate constant was 4.6 × 10⁷ M−1 s−1.
The channel open durations for α3β2 AChRs were measured in the presence of a series of mecamylamine concentrations (5-25 μM) to quantify the inhibition of this AChR. The channel open duration decreased as the concentration of mecamylamine was increased. Fitting the slope of the relationship between the reciprocal of the channel open time (1/τopen) and the mecamylamine concentration allowed the second order rate constant to be approximated (Fig. 8B). Using this approach, the rate of block of α3β2 AChRs by mecamylamine was 4.6 × 10⁷ M−1 s−1. As stated above, the channel open frequency in the presence of mecamylamine was reduced considerably, which indicated that once the channel became blocked by mecamylamine, the duration of block was relatively long. The duration of the blocked state was in the range of closed times that occur between activations by agonist and could not be readily distinguished from these closed but unblocked states. Because of this, and the fact that the channel activity was diminishing due to channel run-down, the duration of the channel blocked state was not estimated. The concentration-dependent reduction in channel open duration, however, indicated that the mechanism of inhibition was probably through open channel blockade. A 2 min wash of the patch followed by reapplication of 1 μM ACh alone showed that the channel activity recovered fully.
Similarly, mecamylamine (50 μM) blocked α3β4 AChRs. They were also blocked by hexamethonium (50 μM; Fig. 8A). Channels were first activated by application of agonist alone. Subsequent co-application of mecamylamine (50 μM) resulted in channel activity exhibiting shorter channel open times and much reduced open frequency. Application of hexamethonium with ACh evoked channels having reduced channel open durations. Similar sensitivity to block by hexamethonium was observed with α3α5β4 (Fig. 8A).
To quantify the interaction of hexamethonium with α3β4 AChRs, a series of concentrations (5-50 μM) was tested for the extent of reduction in channel open duration. As the concentration of hexamethonium was increased, channel open duration was reduced (Fig. 8B), which was consistent with open channel block. Based on the concentration dependence of the reduction in channel open duration, the rate of block of α3β4 AChRs by hexamethonium was estimated as 1.2 × 10⁷ M−1 s−1. Application of ACh alone after approximately 2 min recovery in the absence of hexamethonium showed the reversibility of this blockade. Thus, the mechanism by which hexamethonium inhibited α3β4 AChR activity was through a channel block mechanism. The potency of inhibition of α3β4 open times by hexamethonium was at least threefold lower than the inhibition of α3β2 AChRs by mecamylamine.
Single channel properties of IMR-32 AChRs resemble those of α3β4 AChRs expressed in oocytes
Application of ACh (5-10 μM) to outside-out patches from IMR-32 cells evoked moderate levels of single channel activity that remained for approximately 2-4 min in the continuous presence of agonist (Fig. 9), which was similar to heterologous α3 AChRs having the β4 subunit, but not those with the β2 subunit. The channel activity recovered partially after approximately 1 min in agonist-free solution, but it eventually inactivated completely due to run-down. Fits of open level amplitude histograms revealed a unitary amplitude of -2.2 ± 0.1 pA (n = 5) at -80 mV (Fig. 9). The chord conductance was estimated to be 32 pS. Fits of open duration histograms to double exponential functions revealed mean open times of 1.5 ± 0.3 (n = 4) and 9.6 ± 1.2 ms (n = 4) with the two components representing 48 and 52 % of the distribution, respectively. Histograms of channel burst times were fitted to reveal durations of 1.6 ± 0.4 (n = 4) and 25 ± 3.0 ms (n = 4). The components represented 54 and 46 %, respectively, when present. To aid comparison, the single channel properties of IMR-32 AChRs are summarized along with those of oocyte-expressed AChRs in Table 1. Although not exact, the channel properties of IMR-32 AChRs resemble most closely those of α3β4 AChRs.
Figure 9. Native human α3 AChR single channel currents recorded from IMR-32 neuroblastoma cells.
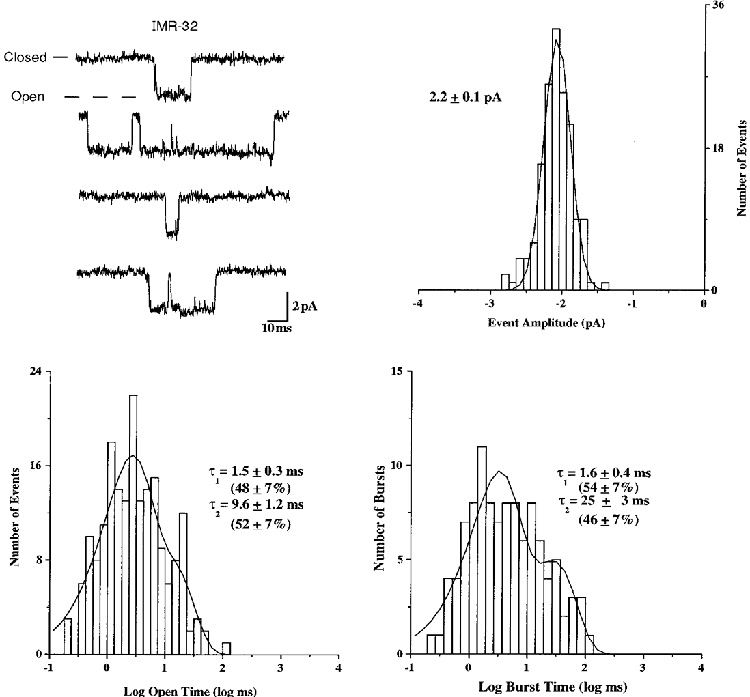
Representative examples are shown for single channel activity recorded from outside-out patches from IMR-32 cells for the distributions of amplitude, open duration and burst duration. Time constants and percentages were determined as described for figures depicting heterologously expressed AChRs. All data were recorded at -80 mV.
Table 1.
Human α3 AChR single channel properties
| Conductance (pS) | Mean open time (ms) | Mean burst time (ms) | |||||||
|---|---|---|---|---|---|---|---|---|---|
| AChR | γ1 | γ2 | γ3 | τ1 | τ2 | τ3 | τ1 | τ2 | τ3 |
| α3β2 | 21 ± 1 | 26 ± 1 | — | 0.71 ± 0.14 | 3.5 ± 0.4 | — | 0.82 ± 0.1 | 25.3 ± 0.7 | — |
| (22 ± 6%, | (78 ± 6%, | — | (65 ± 4%, | (35 ± 4%, | — | (57 ± 4%, | (43 ± 4%, | — | |
| 6/7) | 7/7) | — | 6/6) | 6/6) | — | 6/6) | 6/6) | — | |
| α3α5β2 | 22 ± 1 | 26 ± 1 | — | 0.50 ± 0.10 | 2.1 ± 0.3 | 5.5 ± 0.3 | 0.90 ± 0.28 | 5.0 ± 1.0 | — |
| (50 ± 19%, | (60 ± 18%, | — | (76 ± 1%, | (42 ± 15%, | (34 ± 18%, | (56 ± 14%, | (44 ± 14%, | — | |
| 4/5) | 5/5) | — | 4/5) | 3/5) | 3/5) | 5/5) | 5/5) | — | |
| α3β4 | 24 ± 1 | 31 ± 1 | — | 1.4 ± 0.2 | 6.5 ± 0.8 | — | 1.7 ± 0.2 | 16 ± 1.0 | — |
| (50%, | (90 ± 10%, | — | (50 ± 7%, | (50 ± 7%, | — | (54 ± 4%, | (56 ± 4%, | — | |
| 1/5) | 5/5) | — | 5/5) | 5/5) | — | 5/5) | 5/5) | — | |
| α3α5β4 | 24 ± 1 | 31 ± 1 | 36 ± 1 | 1.6 ± 0.2 | 6.4 ± 0.7 | 22 ± 3 | — | 6.2 ± 0.4 | 43 ± 4 |
| (39 ± 6%, | (81 ± 6%, | (51 ± 24%, | (52 ± 8%, | (57 ± 9%, | (26 ± 5%, | — | (64 ± 7%, | (39 ± 7%, | |
| 3/10) | 9/10) | 3/10) | 7/10) | 7/10) | 8/10) | — | 9/10) | 8/10) | |
| IMR-32 | — | 32 ± 1 | — | 1.5 ± 0.3 | 9.6 ± 1.2 | — | 1.6 ± 0.4 | 25 ± 3.0 | — |
| — | (100%, | — | (48 ± 7%, | (52 ± 7%, | — | (54 ± 7%, | (46 ± 7%, | — | |
| — | 5/5) | — | 4/4) | 4/4) | — | 3/4) | 4/4) | — | |
Conductance values were calculated as described in Methods. All values are means ± S.E.M.; — indicates component not present. Values in parentheses reflect percentage of area under distribution representing component when present, and fraction of patches having component.
IMR-32 AChRs and α3β4 AChRs were also recorded and compared under different conditions to gain insight into the effects of ionic conditions on AChR function. For these experiments, the bath solution was very similar to the ND-96 solution used for all previous experiments, but contained a higher sodium concentration and will be referred to as high sodium conditions (see Methods). The pipette solution for the high sodium conditions differed substantially from that used for all previous experiments and contained caesium gluconate instead of caesium fluoride and caesium chloride (see Methods). As can be seen in Fig. 10, the IMR-32 and α3β4 AChR channels had a remarkably similar appearance under these conditions. The mean amplitude of IMR-32 channels and that of the main conductance for α3β4 AChRs were identical. The presence of the lower conductance channel for α3β4 AChRs in oocytes was not affected by the different recording conditions. All channels had larger amplitudes under the high sodium conditions, which was consistent with the higher sodium concentration in the bath compared with the recordings made in ND-96. The presence of clear direct transitions from the main conducting state of α3β4 AChRs to the lower conductance state became evident in some patches under the high sodium conditions. The reason for the appearance of direct transitions under the high sodium conditions remains unclear. Whether the change reflects a modification of the AChR that was different for these recordings compared with the earlier data or whether the difference reflects the effects of holding potential or ionic conditions will require further investigation. The presence of the direct transition between conductance levels leads to the conclusion that the lower conductance level reflects the same population of channels giving rise to the higher conductance levels and not a structurally (with respect to subunit composition) unique population of AChRs. It is interesting to note that subconductance level transitions were not observed for IMR-32 AChRs under either recording condition.
Figure 10. Native human α3 AChR single channel currents recorded from IMR-32 neuroblastoma cells resemble oocyte-expressed α3β4 AChRs under high sodium conditions.
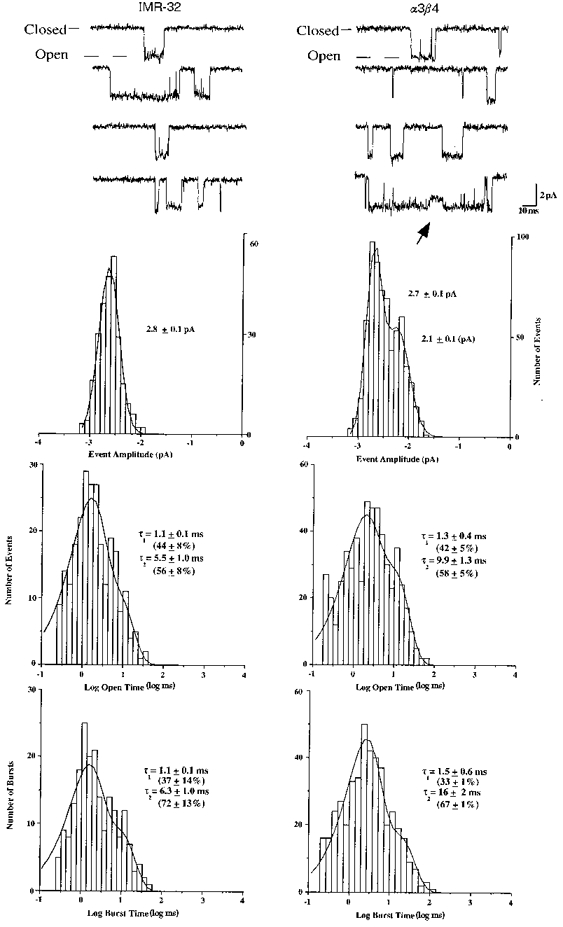
High sodium conditions had higher external sodium than previous experiments and no internal fluoride (see Methods). Representative examples are shown for channel activity recorded from outside-out patches along with the distributions of channel amplitudes, open durations and burst durations. Time constants and percentages were determined as described in earlier figures and reflect the means ±s.e.m. from three to five patches. All data were recorded at -60 mV. The arrow marks a clear transition to a subconductance state during the α3β4 AChR opening.
The channel kinetics were similar between IMR-32 and α3β4 AChRs under high sodium conditions (Fig. 10). α3β4 open times were unchanged, while IMR-32 channel openings were of somewhat shorter duration than was observed using the ND-96 solutions. Because the kinetics of α3β4 AChRs appeared to be unaffected by the recording conditions, the difference in the IMR-32 AChR properties must reflect some heterogeneity in function for these AChRs, which could be the result of different post-translational modification.
Fraction of total IMR-32 α3 AChRs containing α5 or β2 subunits
Monoclonal antibodies or subunit-specific antisera can be used to select AChRs containing particular subunits from crude extracts of IMR-32 cells, and the number of AChRs containing the particular subunit can be quantified by 3H-epibatidine binding. Using this approach, antibodies were used to determine the fraction of IMR-32 α3 AChRs that contained β2 or α5 subunits. To determine the fraction of AChRs that contained the β2 subunit, Triton X-100-solubilized AChRs from IMR-32 cells were adsorbed onto either mAb 210-coated microwells for determining the total amount of α3 AChRs or mAb 295-coated microwells for determining the total β2 AChRs that were present. The adsorbed AChRs were labelled with 3H-epibatidine and the labelled, bound AChRs were eluted and measured by liquid scintillation counting. The amount of β2 AChRs bound was 6 ± 2 % (n = 3) of the total α3 AChRs in IMR-32 cells (Fig. 11A).
Figure 11. Fraction of IMR-32 α3 AChRs that contain β2 or α5 subunits.
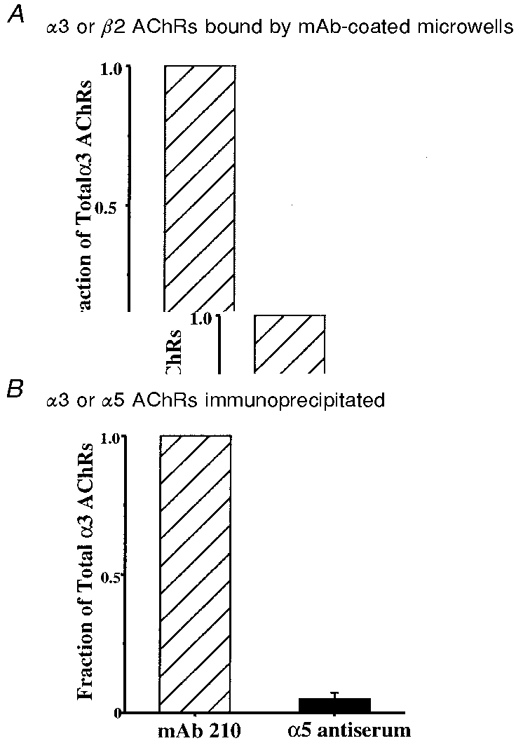
A, solid-phase RIAs were used to demonstrate the fraction of total IMR-32 α3 AChRs that contain the β2 subunit. Microwells coated with mAb 210 (to α3) or mAb 295 (to β2) were used to adsorb AChRs from Triton X-100 extracts from IMR-32 cells. The adsorbed AChRs were labelled with 3H-epibatidine for quantification. Typically, 5-12 fmol of AChR (0.15-0.20 fmol (mg wet weight cells)−1) were bound by mAb 210, while mAb 295 bound 6 ± 2 % of this amount. B, immunoprecipitation of IMR-32 AChRs was used to demonstrate the fraction of total IMR-32 AChRs that contain the α5 subunit. Triton X-100 extracts were incubated with excess mAb 210 or α5 antiserum, labelled with 3H-epibatidine, and then precipitated with excess sheep anti-rat IgG as secondary antibody. The α5 antiserum precipitated 5 ± 2 % as much AChR as mAb 210.
To determine the fraction of α3 AChRs that contained the α5 subunit, Triton X-100-solubilized AChRs were bound by mAb 210 or antiserum to α5 labelled with 3H-epibatidine, and then immunoprecipitated with sheep anti-rat IgG as the secondary antibody. The amount of α5 AChRs that could be immunoprecipitated was determined by liquid scintillation counting to be 5 ± 2 % (n = 5) of the total α3 AChRs in IMR-32 cells (Fig. 11B). Antibodies to the α4 and α6 subunits were also tested, but they detected no AChRs containing these subunits in IMR-32 cells (data not shown).
DISCUSSION
Single channel analysis provides the most direct means of characterizing the impact of a particular subunit on the functional properties of AChRs, since each subunit contributes to the formation of the ion channel through its M2 transmembrane region. Conformational changes that lead to gating presumably involve the co-ordinated movement of all subunits (Unwin, 1995). Thus, each subunit will influence the ion channel permeability, conductance and gating kinetics (reviewed in Papke, 1993). With this in mind, we have described the single channel properties of various human α3 AChR subtypes recorded from outside-out patches from Xenopus oocytes and IMR-32 neuroblastoma cells. Both single channel kinetics and conductance properties of human α3 AChRs reflect subunit composition. When expressed in pairs, changing between β2 and β4 subunits altered the kinetics of α3 AChRs with a slight effect on channel conductance. The open and burst times for α3β2 AChRs were shorter than those for α3β4 AChRs. The α5 subunit increased the channel open duration of α3α5β2 AChRs when compared with α3β2 AChRs, but had little effect on channel burst duration or channel conductance. Coexpression of the α5 subunit introduced a longer bursting and larger conductance channel for α3α5β4 AChRs when compared with α3β4 AChRs. The single channel properties of IMR-32 AChRs most closely resembled those of α3β4 AChRs expressed in oocytes. Results of RIAs using subunit-specific antibodies were consistent with this conclusion, as they revealed only low levels of β2 and α5 subunits present in the AChRs expressed by IMR-32 cells.
Influence of the β subunit on α3 AChR gating kinetics
We found that open and burst times were longer for human α3β4 AChRs than for human α3β2 AChRs. Mean open time values for α3β2 AChRs were 0.71 and 3.5 ms and for α3β4 AChRs were 1.4 and 6.5 ms. These open times are similar to values for the corresponding rat AChRs (Papke & Heinemann, 1991; but see Sivilotti et al. 1997). The interspecies sequence identities between human and rat for each of these subunits are 91 % for α3, 95 % for β2 and 84 % for β4 (Elliot et al. 1996). The difference in identity between human and rat was greater for the β4 subunit than the β2 subunit, showing that greater potential exists for functional differences for α3β4 AChRs compared with α3β2 AChRs across species. In contrast to the values obtained for human α3β4 AChRs and one earlier report for rat α3β4 AChRs (Papke & Heinemann, 1991), a recent study showed that rat α3β4 AChRs had longer open times (approximately fivefold longer) and burst durations that averaged several hundred milliseconds (Sivilotti et al. 1997). Although we have found that burst durations were longer for human α3β4 compared with α3β2 AChRs, the longer bursts were only 16 ms for α3β4, thus significantly less than the values reported for rat (Sivilotti et al. 1997). Even human α3α5β4 AChRs had burst durations that averaged only 43 ms for the slower component. Rat α3β4 AChRs also showed prevalent long-lived transitions to apparent subconducting states (Sivilotti et al. 1997) which were rare and very short lived for human α3 AChRs expressed in oocytes. The apparent functional differences between species could reflect the 16 % difference in sequence identity for the β4 subunit. Alternatively, we speculate that the functional differences could simply reflect differences in post-translational modification of the AChRs that might be influenced by the oocyte incubation medium, which consisted of Leibovitz L-15 medium in our study and was Barth's solution in the study of rat AChRs. Apparent differences between the species might also simply reflect differences between the ionic conditions used for recording in the two studies, but this seems unlikely considering the similarity in α3β4 AChR channel properties under two different conditions for the present study.
Differences in gating kinetics between human α3β2 and α3β4 AChRs parallel the approximately 25 % difference in the overall sequence identity between β subunits. The open and burst times indicate that on a time average basis the likelihood of the channel being in the open state is greater for α3β4 AChRs than for α3β2 AChRs due to this difference. The seemingly greater preference of α3β4 AChRs for the open state compared with α3β2 AChRs indicates a major contribution of the β subunit to the activation energies involved in channel gating. Differences within the M2 channel domains are not responsible since mutation of the only channel residue that differs between β2 and β4 was not sufficient to convey α3β2 AChR kinetics to α3β4 AChRs (Figl et al. 1996). Kinetic differences therefore must involve less restricted inter- or intra-subunit interactions within AChRs during gating within regions outside of the M2 domain of the β subunit.
Influence of β subunits on channel desensitization and inactivation
In addition to the difference in channel gating kinetics between α3β2 and α3β4 AChRs, there was a clear difference in the tendency of these AChRs to desensitize. The loss of channel activity during agonist application was much more pronounced for α3β2 AChRs than for α3β4 AChRs. This activation-dependent desensitization was reversible by allowing recovery in agonist-free solution. However, permanent inactivation was also observed for all α3 AChRs. This channel ‘run-down’ occurred more rapidly for α3β2 AChRs than for α3β4 AChRs expressed in oocytes. Channel activity for α3β2 AChRs disappeared completely after about 5 min of recording and would not recover when agonist was removed. By contrast, α3β4 AChRs could be activated for about 10-15 min although the level of activity decreased over the duration of the patch. Attempts to counter the run-down included using a purely chloride-based pipette solution or adding ATP, phosphocreatine, creatine phosphokinase or the catalytic subunit of protein kinase A, all of which were ineffective. This tendency to inactivate showed no clear dependence on channel activation or agonist concentration. Agonist concentration seemed to influence only the rate at which reversible inactivation (desensitization) occurred. Because of this, the ACh concentration was chosen to achieve the greatest level of channel activity without causing desensitization before permanent inactivation occurred. The large cytoplasmic loop between transmembrane domains M3 and M4 accounts for the majority of differences among AChR subunit sequences and could easily alter functional properties of AChRs by intracellular regulatory mechanisms such as phosphorylation (Huganir & Greengard, 1990). This region of the β subunits might be responsible for the differences in the rate of channel run-down between α3β2 and α3β4 AChRs.
Influence of the α subunit on conductance and kinetic properties of AChRs
The α subunit has been reported to influence the single channel properties of rat AChRs (Papke et al. 1989). Comparisons between single channel properties of human α3β2 and α4β2 AChRs (Kuryatov et al. 1997) reveal that the α subunit also influences channel properties of AChRs in a manner similar to that found for β subunits. Under the same recording conditions used for α3 AChRs, human α4β2 AChRs expressed in oocytes exhibited two conductance states having amplitudes of -1.4 and -2.3 pA at -80 mV. These values are similar to our present findings for α3β2 AChRs. The similar conductances for α3β2 and α4β2 AChRs correlate with the high sequence identity between α3 and α4 subunits within the channel region (M2). The only difference in conductance profiles between the two AChR types was the apparent preference of each AChR for a particular conductance state. For α4β2 AChRs, the frequency of occurrence of the larger and smaller conductance channels was similar, while α3β2 AChRs favoured the larger conductance channel.
Comparisons between channel kinetics for α4β2 and α3β2 AChRs reveal the impact of the α subunit on transitions between the open and closed states of the channel. Channel durations for α4β2 AChRs were 2.3 and 8.0 ms; for α3β2 AChRs they were 0.7 and 3.5 ms. This shows that the α subunit can influence gating behaviour in a manner that resembles the impact of the β subunit on AChR gating behaviour, i.e. α4β2 AChRs have a greater likelihood of being in the open state than α3β2 AChRs when activated by equipotent concentrations of agonist. This also indicates that both α and β subunits influence AChR gating and that kinetic properties of AChRs serve as useful indicators of the presence of particular subunits within native AChRs and should be used along with channel conductances when evaluating the subunit composition of native AChRs.
Functional impact of the α5 subunit on α3 AChR single channel properties
In addition to the α3, β2 and β4 subunits, ganglionic neurons also typically express the α5 subunit (Sargent, 1993; Lindstrom, 1996). In the present study, both α3α5β2 and α3α5β4 AChRs exhibited significantly longer open times compared with α3 AChRs recorded from oocytes not injected with the α5 subunit transcript. The difference observed for α3α5β2 AChRs compared with α3β2 AChRs was the introduction of a third open time that was slightly, but significantly, different from those observed for α3β2 AChRs. The burst durations for α3α5β2 AChRs were not different from those determined for α3β2 AChRs. Since simple expression of triplet combinations of subunits in oocytes does not ensure predictable incorporation of all subunits into mature surface AChRs, it is unclear whether the minimal impact of the α5 subunit on α3β2 AChRs reflected poor incorporation, or whether α5 truly has little impact on the bursting behaviour of α3α5β2 AChRs. Previous determinations of incorporation efficiency of α5 subunits into α3β2 AChRs in oocytes reported that 70 % of total AChRs contained the α5 subunit (Wang et al. 1996). This level of incorporation would presumably be sufficient to reveal the functional impact, if any, on single channel properties. Attempts at improving incorporation efficiency by altering RNA ratios were unsuccessful as far as single channel analysis was concerned. Unfortunately, AChR surface expression levels measured by macroscopic current amplitudes were reduced with increasing ratios of α5 cRNA relative to α3 and β2 cRNA. This hampered single channel recording.
The effect of the α5 subunit was especially pronounced when it was coexpressed with α3 and β4 subunits. Open time distributions for these AChRs revealed a new, slower component when compared with α3β4 open time distributions, with a time constant of 22 ms. Half of the patches exhibited this slower channel, which represented about 26 % of the distribution of all openings in patches where present. The effect of the α5 subunit on α3β4 AChR burst duration was even more remarkable. The long duration bursts for α3α5β4 AChRs averaged 43 ms compared with α3β4 bursts which were only 16 ms.
Macroscopic properties of α3 AChRs: correlations to single channel properties
The functional impact of the β subunit on the macroscopic currents of α3 AChRs has been well established (reviewed in Papke, 1993). It is not surprising that both α and β subunits can influence the functional properties of AChRs since substantial evidence has been reported that ACh binding sites are formed at interfaces between adjacent subunits and involve several parts of the extracellular domains of each (Karlin & Akabas, 1995). β2 AChRs compared with β4 AChRs exhibit reduced efficacy for activation by cytisine (Papke & Heinemann, 1994), increased rate of desensitization (Cachelin & Jaggi, 1991; Wang et al. 1996; Gerzanich et al. 1998), and greater sensitivity to inhibition by neuronal BuTX (Luetje et al. 1990). Macroscopic studies of human α3 AChRs expressed in oocytes have been reported recently by two independent groups (Wang et al. 1996; Chavez-Noriega et al. 1997; Gerzanich et al. 1998). The β subunit alters both the pharmacological characteristics and the time course of currents significantly. Whereas α3β4 AChRs exhibit a slow onset of desensitization, α3β2 AChRs desensitize much faster. Additionally, the rank order of agonist potency for α3β4 AChRs differs substantially from that for α3β2 AChRs. Although the magnitudes of agonist EC50 values reported by the two groups are somewhat disparate, both report accelerated desensitization for α3β2 compared with α3β4 AChRs, which shows that the β subunit is a major determinant of this property. Furthermore, comparisons between human α3β2 and α3β4 AChRs in permanently transfected human embryonic kidney cells also reveal dramatic differences in the desensitization rates for these AChRs when recorded with rapid agonist applications (Wang et al. 1998). The faster current decay of α3β2 AChRs compared with α3β4 AChRs correlates at the single channel level to more rapid open and burst kinetics. This probably reflects a greater rate of open channels entering the desensitized state and/or a slower rate of returning from it.
The α5 subunit is incorporated into α3 AChRs in both chicken and human (Conroy et al. 1992; Vernallis et al. 1993; Wang et al. 1996). By using subunit-specific monoclonal antibodies on human AChRs expressed in oocytes, it has been shown that when triplet combinations (α3α5βx) were expressed under conditions identical to those used here, 50 % of α3β4 and 70 % of α3β2 AChRs had the α5 subunit (Wang et al. 1996). Incorporation of the human α5 subunit into α3 AChRs altered macroscopic decay rates of both α3β2 and α3β4 AChRs, as well as modifying some of their pharmacological properties and permeability to Ca2+. Coexpression of the α5 subunit also improved the efficacy of nicotine on α3β2 AChRs to equal that of ACh (Wang et al. 1996; Gerzanich et al. 1998). The functional impact of the α5 subunit on α4β2 AChRs has also been demonstrated, with incorporation of the α5 subunit producing a channel with a larger conductance and an apparently lower affinity for ACh (Ramirez-Latorre et al. 1996). Additionally, incorporation of the α5 subunit countered some dysfunction caused by a mutation in α4β2 AChRs that has been linked to a form of epilepsy (Kuryatov et al. 1997).
The effects of the α5 subunit on open and burst times of α3β2 or α3β4 AChRs might be expected to cause a slower decay in macroscopic currents for these AChRs. However, the opposite was actually observed, with the α5 subunit accelerating the decay of macroscopic currents (Wang et al. 1996; Gerzanich et al. 1998). At the single channel level, if incorporation of the α5 subunit into α3β4 AChRs increases the entry rate into a desensitized state, increased burst duration points to an accelerated transition from a state that lies outside of a burst. Thus, the functional impact of incorporating the α5 subunit into α3 AChRs cannot be limited to transitions that dictate open and burst durations. Additionally, slower recovery from a desensitized state could be involved. The difference between altered desensitization rate and altered recovery from desensitization can be distinguished best in closed time distributions with prolonged steady-state recording of channel activity. Unfortunately, the tendency to run down hampers such analysis. Alternative approaches will probably be necessary to distinguish between these mechanisms.
Ganglionic AChR subunit composition
The subunit composition of neuronal AChRs, as for muscle AChRs, might not be static, but could change with developmental state, with cell surface location, and with different levels of neuronal activity (Sivilotti & Colquhoun, 1995). The flexibility to provide different AChR types to accommodate each of these conditions is allowed by the coexistence of multiple subunits in cells. It has been reported that α3 AChRs in chick ganglion are located both sub- and perisynaptically (Wilson-Horch & Sargent, 1996; Ullian et al. 1997). It seems plausible that α3 AChR composition could vary with location resulting in somatic and dendritic AChRs having different compositions. Subunit expression levels can also change depending on the developmental state of the neurons, which could influence subunit composition (Margiotta & Gurantz, 1989; Moss & Role, 1993; Mandelzys et al. 1994). These changes might allow differing proportions of AChRs to contain β2, β4 and/or α5 subunits. A good example illustrating the potential for AChR diversity can be found in chick ciliary ganglion neurons (Conroy & Berg, 1995). In these cells, multiple α3 AChR types could be distinguished by monoclonal antibodies. All AChRs contained α3 and β4 subunits, all α5 subunits coexisted with α3 and β4 subunits, and 20 % of total AChRs contained the β2 subunit. This showed that these cells potentially express α3β4, α3α5β4, α3β4β2 and α3α5β4β2 AChRs. Similarly, it was demonstrated with antibodies that the human neuroblastoma cell line SH-SY5Y expressed combinations of α3 AChRs with 50 % having β2 subunits and slightly less than 10 % having the α5 subunit (Wang et al. 1996, 1998). We and others have shown that the single channel functional properties of α3 AChRs can be significantly influenced by the different combinations of AChR subunits that are expressed in ganglion cells. The variety of combinations that might result could play a role in the discrepancies that have been observed when comparing the functional properties of native and heterologous AChRs (Lewis et al. 1997; Sivilotti et al. 1997), since the composition of native AChRs could easily change with cellular location or developmental state. AChR subtype-selective pharmacological tools would promote separation of subpopulations of native AChRs so that they could be studied independently of each other when they coexist in neurons (Ullian et al. 1997), which would allow easier comparison with heterologous AChRs.
Properties of IMR-32 AChRs and inferences regarding their subunit composition
Single channel currents exhibited by α3 AChRs expressed in Xenopus oocytes have allowed comparison of heterologously expressed defined AChRs with native AChRs expressed in human neuroblastoma cells. The IMR-32 cell line originated from an abdominal tumour of neural crest origin (Tumilowicz et al. 1970). These cells have previously been shown to contain functional AChRs (Lukas, 1993; Gotti et al. 1995). IMR-32 cells reportedly express α3, α5, α7, β2 and β4 subunits that are typical for ganglion-like cells (Gotti et al. 1997; Groot-Kormelink & Luyten, 1997). From these available subunits, IMR-32 cells should express both α-BuTX-sensitive α7 AChRs and α-BuTX-insensitive α3 AChRs that could consist of combinations of the remaining subunits. However, two points eliminate α7 AChRs from consideration: (1) under the present recording conditions (considering the concentration of agonist and the level of filtering), no channel activity with rapid kinetics that would correspond to human α7 AChRs was expected or observed, and (2) macroscopic currents recorded from IMR-32 cells were insensitive to block by the α7 AChR-selective antagonist methyllycaconitine at 1 μM (M. Nelson & J. Lindstrom, unpublished data). α3 AChRs expressed by IMR-32 cells would probably include one or more other subunits (i.e. β2 and/or β4, and α5). Based on the subunits expressed by these cells, possible AChR subunit combinations could be α3β2, α3β4, α3α5β2, α3α5β4, α3β2β4 and/or α3α5β2β4. When comparing the channel behaviour of heterologously expressed AChRs to that recorded from IMR-32 cells, some generalities emerge. The channel kinetics of β2 AChRs in oocytes were faster than was observed for IMR-32 AChRs, in terms of both open times and burst times. This indicates that if the β2 subunit exists in functional AChRs in IMR-32 cells, these AChRs do not make up a significant fraction of surface AChRs in these cells. In fact, RIAs utilizing mAb 295, which is specific for the β2 subunit, confirm this conclusion since only 6 % of the AChRs in IMR-32 cells possess a β2 subunit. This narrowed the possible predominant AChR type to α3β4 or α3α5β4. However, immunoprecipitation utilizing antiserum specific for the α5 subunit (Wang et al. 1998) showed that only 5 % of the AChRs in IMR-32 cells contained the α5 subunit. Additionally, antibodies to α4 and α6 subunits were unable to bind any AChRs in IMR-32 cells. Overall, the single channel functional profile for α3β4 AChRs best matches that of IMR-32 AChRs and this conclusion is supported by the lack of significant levels of both α5 and β2 subunits in the α3 AChRs that are expressed by these cells.
Factors influencing heterologous and native α3 AChR properties
Although not extreme, the biggest discrepancy between channel properties of human α3β4 AChRs expressed in oocytes and IMR-32 AChRs was in burst duration. This difference may not reflect differences in subunit composition, but may involve other factors. Previous attempts to match properties of oocyte-expressed AChRs with properties of AChRs expressed by native cells have revealed that none of the subunit combinations tested could replicate exactly the properties of native ganglionic AChRs (Covernton et al. 1994; Sivilotti et al. 1997). It is clear that AChRs expressed in oocytes often have surprisingly complex properties, even with only a single α and β subunit. This raises the possibility that differences between native cells and oocytes such as different post-translational processing, different membrane phospholipid environment, or different cytoskeletal architecture could modify functional properties of AChRs and complicate direct comparisons. The burst durations would be particularly sensitive to such modifications since bursts reflect the rate at which multiple transitions between non-conducting states and the open state occur. The transitions into desensitized states are particularly important and could be affected by post-translational modifications. Burst durations could be influenced by this rate and could thus explain the discrepancy between heterologously expressed α3β4 AChRs and IMR-32 AChRs that appear to be predominantly α3β4. Recently, the dependence of AChR function on the expression system was studied by comparing rat α3β4 AChR single channel currents expressed in three different systems: (1) native superior cervical ganglion; (2) oocytes injected with in vitro transcribed RNA; and (3) transfected mouse fibroblasts (Lewis et al. 1997). This study reported little improvement when using AChRs expressed in fibroblasts as opposed to AChRs expressed in oocytes when comparing the single channel properties with AChRs in native cells, although the fibroblast-expressed AChRs appeared to exhibit a population of channels with properties that resembled native AChRs. This might reflect the complexity of AChR composition in superior cervical ganglion, but the fact that the α3β4 AChRs in the two heterologous systems exhibited properties that differed from each other emphasizes the importance of recognizing the sensitivity of α3 AChR function to the influence of the expression environment.
In summary, our results demonstrate that each subunit that assembles into human AChRs contributes to the single channel properties of the resulting AChRs. Switching from β2 to β4 subunits results in an increase in open times and burst times accompanied by a reduced tendency for channel desensitization and run-down. Coexpression of the α5 subunit with α3 and one of the β subunits increases the open time and burst time of α3β4 AChRs, while α5 increases only the open time of α3β2 AChRs. The α5 subunit also introduced an additional larger conductance channel when coexpressed with α3 and β4 subunits, but not with α3 and β2 subunits. Finally, comparisons between the channel properties for oocyte-expressed AChRs and AChRs expressed in IMR-32 cells along with RIAs suggest that the predominant α3 AChR expressed by IMR-32 cells is one composed of α3 and β4 subunits. Other α3 AChRs may also exist in these cells, but the predominant AChR type that was observed during single channel recording was α3β4.
Acknowledgments
The authors wish to thank Dr Francesco Clementi (University of Milan, Milan, Italy) for providing the α5 cDNA, Drs Alexander Kuryatov and Fan Wang for help and suggestions with the radioimmunoassays, and Dr Gregg Wells for critical reading of the manuscript and help with the subunit sequence comparisons through the Pittsburgh Supercomputing Center.
Research in the laboratory of J. L. is supported by grants from the National Institutes of Health (NS11323), the Smokeless Tobacco Research Council, Inc., the Muscular Dystrophy Association and the Council for Tobacco Research - USA, Inc. M. E. N. is supported by a National Institutes of Health postdoctoral fellowship (NS10333). Access to the Pittsburgh Supercomputing Center was provided under National Institutes of Health National Center for Research Resources Cooperative Agreement 2 p41 RR06009.
References
- Alkondon M, Reinhardt S, Lobron C, Hermsen B, Maelicke A, Albuquerque EX. Diversity of nicotinic acetylcholine receptors in rat hippocampal neurons. II. The rundown and inward rectification of agonist-elicited whole-cell currents and identification of receptor subunits by in situ hybridization. Journal of Pharmacology and Experimental Therapeutics. 1994;271:494–506. [PubMed] [Google Scholar]
- Anand R, Lindstrom J. Nucleotide sequence of the human nicotinic acetylcholine receptor β2 subunit gene. Nucleic Acids Research. 1990;18:4272. doi: 10.1093/nar/18.14.4272. [DOI] [PMC free article] [PubMed] [Google Scholar]
- Cachelin AB, Jaggi R. β subunits determine the time course of desensitization in rat α3 neuronal nicotinic acetylcholine receptors. Pflügers Archiv. 1991;419:579–582. doi: 10.1007/BF00370298. [DOI] [PubMed] [Google Scholar]
- Chavez-Noriega LE, Crona JH, Washburn MS, Urrutia A, Elliott KJ, Johnson EC. Pharmacological characterization of recombinant human neuronal nicotinic acetylcholine receptors hα2β2, hα2β4, hα3β2, hα3β4, hα4β2, hα4β4 and hα7 expressed in Xenopus oocytes. Journal of Pharmacology and Experimental Therapeutics. 1997;280:346–356. [PubMed] [Google Scholar]
- Chini B, Clementi F, Hukovic N, Sher E. Neuronal-type α-bungarotoxin receptors and the α5-nicotinic receptor subunit gene are expressed in neuronal and nonneuronal human cell lines. Proceedings of the National Academy of Sciences of the USA. 1992;89:1572–1576. doi: 10.1073/pnas.89.5.1572. [DOI] [PMC free article] [PubMed] [Google Scholar]
- Conroy WG, Berg DK. Neurons can maintain multiple classes of nicotinic acetylcholine receptors distinguished by different subunit compositions. Journal of Biological Chemistry. 1995;270:4424–4431. doi: 10.1074/jbc.270.9.4424. [DOI] [PubMed] [Google Scholar]
- Conroy WG, Vernallis AB, Berg DK. The α5 gene product assembles with multiple acetylcholine receptor subunits to form distinctive receptor subtypes in brain. Neuron. 1992;9:679–691. doi: 10.1016/0896-6273(92)90031-8. [DOI] [PubMed] [Google Scholar]
- Covernton PJ, Kojima H, Sivilotti LG, Gibb AJ, Colquhoun D. Comparison of neuronal nicotinic receptors in rat sympathetic neurones with subunit pairs expressed in Xenopus oocytes. The Journal of Physiology. 1994;481:27–34. doi: 10.1113/jphysiol.1994.sp020416. [DOI] [PMC free article] [PubMed] [Google Scholar]
- Elliot KJ, Ellis SB, Berckhan KJ, Urrutia A, Chavez-Noriega LE, Johnson EC, Velicelebi G, Harpold MM. Comparative structure of human neuronal α2-α7 and β2-β4 nicotinic acetylcholine receptor subunits and functional expression of the α2, α3, α4, α7, β2, and β4 subunits. Journal of Molecular Neuroscience. 1996;7:217–228. doi: 10.1007/BF02736842. [DOI] [PubMed] [Google Scholar]
- Fenwick EM, Marty A, Neher E. A patch-clamp study of bovine chromaffin cells and of their sensitivity to acetylcholine. The Journal of Physiology. 1982;331:577–597. doi: 10.1113/jphysiol.1982.sp014393. [DOI] [PMC free article] [PubMed] [Google Scholar]
- Figl A, Labarca C, Davidson N, Lester HA, Cohen BN. Voltage-jump relaxation kinetics for wild-type and chimeric β subunits of neuronal nicotinic receptors. Journal of General Physiology. 1996;107:369–379. doi: 10.1085/jgp.107.3.369. [DOI] [PMC free article] [PubMed] [Google Scholar]
- Forsayeth JR, Kobrin E. Formation of oligomers containing the β3 and β4 subunits of the rat nicotinic receptor. Journal of Neuroscience. 1997;17:1531–1538. doi: 10.1523/JNEUROSCI.17-05-01531.1997. [DOI] [PMC free article] [PubMed] [Google Scholar]
- Fucile S, Matter J-M, Erkman L, Raggozino D, Barabino B, Grassi F, Alema S, Ballivet M, Esebi F. The neuronal α6 subunit forms functional heteromeric acetylcholine receptors in transfected cells. European Journal of Neuroscience. 1998;10:172–178. doi: 10.1046/j.1460-9568.1998.00001.x. [DOI] [PubMed] [Google Scholar]
- Gerzanich V, Kuryatov A, Anand R, Lindstrom J. Orphan’α6 nicotinic AChR subunit forms a functional heteromeric receptor. Molecular Pharmacology. 1996;51:320–327. [PubMed] [Google Scholar]
- Gerzanich V, Wang F, Kuryatov A, Lindstrom J. α5 subunit alters desensitization, pharmacology, Ca2+ permeability, and Ca2+ modulation of human neuronal α3 nicotinic receptors. Journal of Pharmacology and Experimental Therapeutics. 1998;286:311–320. [PubMed] [Google Scholar]
- Gotti C, Briscini L, Verderio C, Oortgiesen M, Balestra B, Clementi F. Native nicotinic acetylcholine receptors in human IMR32 neuroblastoma cells: functional, immunological and pharmacological properties. European Journal of Neuroscience. 1995;7:2083–2092. doi: 10.1111/j.1460-9568.1995.tb00630.x. [DOI] [PubMed] [Google Scholar]
- Gotti C, Fornasari D, Clementi F. Human neuronal nicotinc receptors. Progress in Neurobiology. 1997;53:199–237. doi: 10.1016/s0301-0082(97)00034-8. [DOI] [PubMed] [Google Scholar]
- Groot-Kormelink PJ, Luyten WH. Cloning and sequence of full-length cDNAs encoding the human neuronal nicotinic acetylcholine receptor (nAChR) subunits β3 and β4 and expression of seven nAChR subunits in the human neuroblastoma cell line SH-SY5Y and/or IMR-32. FEBS Letters. 1997;400:309–314. doi: 10.1016/s0014-5793(96)01383-x. [DOI] [PubMed] [Google Scholar]
- Groot-Kormelink PJ, Luyten WH, Colquhoun D, Sivilotti LG. A reporter mutation approach shows incorporation of the ‘orphan’ subunit β3 into a functional nicotinic receptor. Journal of Biological Chemistry. 1998;273:15317–15320. doi: 10.1074/jbc.273.25.15317. [DOI] [PubMed] [Google Scholar]
- Hamill OP, Marty A, Neher E, Sakmann B, Sigworth FJ. Improved patch-clamp techniques for high-resolution current recording from cells and cell-free membrane patches. Pflügers Archiv. 1981;391:85–100. doi: 10.1007/BF00656997. [DOI] [PubMed] [Google Scholar]
- Huganir RL, Greengard P. Regulation of neurotransmitter receptor desensitization by protein phosphorylation. Neuron. 1990;5:555–567. doi: 10.1016/0896-6273(90)90211-w. [DOI] [PubMed] [Google Scholar]
- Jaramillo F, Schuetze SM. Kinetic differences between embryonic- and adult-type acetylcholine receptors in rat myotubes. The Journal of Physiology. 1988;396:267–296. doi: 10.1113/jphysiol.1988.sp016962. [DOI] [PMC free article] [PubMed] [Google Scholar]
- Karlin A, Akabas MH. Toward a structural basis for the function of nicotinic acetylcholine receptors and their cousins. Neuron. 1995;15:1231–1244. doi: 10.1016/0896-6273(95)90004-7. [DOI] [PubMed] [Google Scholar]
- Kuryatov A, Gerzanich V, Nelson M, Olale F, Lindstrom J. Mutation causing autosomal dominant nocturnal frontal lobe epilepsy alters Ca2+ permeability, conductance, and gating of human α4β2 nicotinic acetylcholine receptors. Journal of Neuroscience. 1997;17:9035–9047. doi: 10.1523/JNEUROSCI.17-23-09035.1997. [DOI] [PMC free article] [PubMed] [Google Scholar]
- Lewis TM, Harkness PC, Sivilotti LG, Colquhoun D, Millar NS. The ion channel properties of a rat recombinant neuronal nicotinic receptor are dependent on the host cell type. The Journal of Physiology. 1997;505:299–306. doi: 10.1111/j.1469-7793.1997.299bb.x. [DOI] [PMC free article] [PubMed] [Google Scholar]
- Lindstrom J. Neuronal nicotinic acetylcholine receptors. In: Narahashi T, editor. Ion Channels. Vol. 4. New York: Plenum Press; 1996. pp. 377–450. [DOI] [PubMed] [Google Scholar]
- Luetje CW, Patrick J. Both α- and β-subunits contribute to the agonist sensitivity of neuronal nicotinic acetylcholine receptors. Journal of Neuroscience. 1991;11:837–845. doi: 10.1523/JNEUROSCI.11-03-00837.1991. [DOI] [PMC free article] [PubMed] [Google Scholar]
- Luetje CW, Wada K, Rogers S, Abramson SN, Tsuji K, Heinemann S, Patrick J. Neurotoxins distinguish between different neuronal nicotinic acetylcholine receptor subunit combinations. Journal of Neurochemistry. 1990;55:632–640. doi: 10.1111/j.1471-4159.1990.tb04180.x. [DOI] [PubMed] [Google Scholar]
- Lukas RJ. Expression of ganglia-type nicotinic acetylcholine receptors and nicotinic ligand binding sites by cells of the IMR-32 human neuroblastoma clonal line. Journal of Pharmacology and Experimental Therapeutics. 1993;265:294–302. [PubMed] [Google Scholar]
- Magleby KL, Pallotta BS. Burst kinetics of single calcium-activated potassium channels in cultured rat muscle. The Journal of Physiology. 1983;344:605–623. doi: 10.1113/jphysiol.1983.sp014958. [DOI] [PMC free article] [PubMed] [Google Scholar]
- Mandelzys A, Pie B, Deneris ES, Cooper E. The developmental increase in ACh current densities on rat sympathetic neurons correlates with changes in nicotinic ACh receptor α-subunit gene expression and occurs independent of innervation. Journal of Neuroscience. 1994;14:2357–2364. doi: 10.1523/JNEUROSCI.14-04-02357.1994. [DOI] [PMC free article] [PubMed] [Google Scholar]
- Margiotta JF, Gurantz D. Changes in the number, function, and regulation of nicotinic acetylcholine receptors during neuronal development. Developmental Biology. 1989;135:326–339. doi: 10.1016/0012-1606(89)90183-8. [DOI] [PubMed] [Google Scholar]
- McGehee DS, Role LW. Physiological diversity of nicotinic acetylcholine receptors expressed by vertebrate neurons. Annual Review of Physiology. 1995;57:521–546. doi: 10.1146/annurev.ph.57.030195.002513. [DOI] [PubMed] [Google Scholar]
- Methfessel C, Witzemann V, Takahashi T, Mishina M, Numa S, Sakmann B. Patch clamp measurements on Xenopus laevis oocytes: currents through endogenous channels and implanted acetylcholine receptor and sodium channels. Pflügers Archiv. 1986;407:577–588. doi: 10.1007/BF00582635. [DOI] [PubMed] [Google Scholar]
- Moss BL, Role LW. Enhanced ACh sensitivity is accompanied by changes in ACh receptor channel properties and segregation of ACh receptor subtypes on sympathetic neurons during innervation in vivo. Journal of Neuroscience. 1993;13:13–28. doi: 10.1523/JNEUROSCI.13-01-00013.1993. [DOI] [PMC free article] [PubMed] [Google Scholar]
- Neher E. Correction for liquid junction potentials in patch clamp experiments. In: Rudy B, Iverson L, editors. Ion Channels. New York: Academic Press; 1992. pp. 123–131. [DOI] [PubMed] [Google Scholar]
- Papke RL. The kinetic properties of neuronal nicotinic receptors: genetic basis of functional diversity. Progress in Neurobiology. 1993;41:509–531. doi: 10.1016/0301-0082(93)90028-q. [DOI] [PubMed] [Google Scholar]
- Papke RL, Boulter J, Patrick J, Heinemann S. Single-channel currents of rat neuronal nicotinic acetylcholine receptors expressed in Xenopus oocytes. Neuron. 1989;3:589–596. doi: 10.1016/0896-6273(89)90269-9. [DOI] [PubMed] [Google Scholar]
- Papke RL, Heinemann SF. The role of the β4-subunit in determining the kinetic properties of rat neuronal nicotinic acetylcholine α3-receptors. The Journal of Physiology. 1991;440:95–112. doi: 10.1113/jphysiol.1991.sp018698. [DOI] [PMC free article] [PubMed] [Google Scholar]
- Papke RL, Heinemann SF. Partial agonist properties of cytisine on neuronal nicotinic receptors containing the β2 subunit. Molecular Pharmacology. 1994;45:142–149. [PubMed] [Google Scholar]
- Ramirez-Latorre J, Yu CR, Qu X, Perin F, Karlin A, Role L. Functional contributions of α5 subunit to neuronal acetylcholine receptor channels. Nature. 1996;380:347–351. doi: 10.1038/380347a0. [DOI] [PubMed] [Google Scholar]
- Sargent PB. The diversity of neuronal nicotinic acetylcholine receptors. Annual Review of Neuroscience. 1993;16:403–443. doi: 10.1146/annurev.ne.16.030193.002155. [DOI] [PubMed] [Google Scholar]
- Sivilotti L, Colquhoun D. Acetylcholine receptors: too many channels, too few functions. Science. 1995;22:1681–1682. doi: 10.1126/science.7569892. [DOI] [PubMed] [Google Scholar]
- Sivilotti LG, McNeil DK, Lewis TM, Nassar MA, Schoepfer R, Colquhoun D. Recombinant nicotinic receptors, expressed in Xenopus oocytes, do not resemble native rat sympathetic ganglion receptors in single-channel behaviour. The Journal of Physiology. 1997;500:123–138. doi: 10.1113/jphysiol.1997.sp022004. [DOI] [PMC free article] [PubMed] [Google Scholar]
- Tumilowicz JJ, Nichols WW, Cholon JJ, Greene AE. Definition of a continuous human cell line derived from neuroblastoma. Cancer Research. 1970;30:2110–2118. [PubMed] [Google Scholar]
- Ullian EM, McIntosh JM, Sargent PB. Rapid synaptic transmission in the avian ciliary ganglion is mediated by two distinct classes of nicotinic receptors. Journal of Neuroscience. 1997;17:7210–7219. doi: 10.1523/JNEUROSCI.17-19-07210.1997. [DOI] [PMC free article] [PubMed] [Google Scholar]
- Unwin N. Acetylcholine receptor channel imaged in the open state. Nature. 1995;373:37–43. doi: 10.1038/373037a0. [DOI] [PubMed] [Google Scholar]
- Vernallis AB, Conroy WG, Berg DK. Neurons assemble acetylcholine receptors with as many as three kinds of subunits while maintaining subunit segregation among receptor subtypes. Neuron. 1993;10:451–464. doi: 10.1016/0896-6273(93)90333-m. [DOI] [PubMed] [Google Scholar]
- Wang F, Gerzanich V, Wells GB, Anand R, Peng X, Keyser K, Lindstom J. Assembly of the human neuronal nicotinic receptor α3 subunit with β2, β4, and α5 subunits. Journal of Biological Chemistry. 1996;271:17656–17665. doi: 10.1074/jbc.271.30.17656. [DOI] [PubMed] [Google Scholar]
- Wang F, Nelson ME, Kuryatov A, Olale F, Cooper J, Keyser K, Lindstrom J. Chronic nicotine treatment upregulates human α3β2, but not α3β4 AChRs stably transfected in human embryonic kidney cells. Journal of Biological Chemistry. 1998;273:28721–28732. doi: 10.1074/jbc.273.44.28721. [DOI] [PubMed] [Google Scholar]
- Whiting PJ, Lindstrom JM. Characterization of bovine and human neuronal nicotinic acetylcholine receptors using monoclonal antibodies. Journal of Neuroscience. 1988;8:3395–3404. doi: 10.1523/JNEUROSCI.08-09-03395.1988. [DOI] [PMC free article] [PubMed] [Google Scholar]
- Wilson-Horch HL, Sargent PB. Synaptic and extrasynaptic distribution of two distinct populations of nicotinic acetylcholine receptor clusters in the frog cardiac ganglion. Journal of Neurocytology. 1996;25:67–77. doi: 10.1007/BF02284786. [DOI] [PubMed] [Google Scholar]