

Abstract
The release of [3H]-noradrenaline ([3H]-NA) in response to nicotinic acetylcholine receptor (nAChR) agonists was compared with agonist-induced currents in cultured rat superior cervical ganglion (SCG) neurones.
[3H]-NA release in response to high concentrations of nicotinic agonists was reduced, but not fully inhibited, by the presence of either tetrodotoxin (TTX) or Cd2+ to block voltage-gated Na+ or Ca2+ channels, respectively. We used the component of transmitter release that remained in the presence of these substances (named TTX- or Cd2+-insensitive release) to pharmacologically characterize nAChRs in proximity to the sites of vesicular exocytosis (prejunctional receptors). Prejunctional nAChRs were activated by nicotinic agonists with a rank order of potency of dimethylphenylpiperazinium iodide (DMPP) > nicotine > cytisine > ACh, and with EC50 values ranging from 22 μM (DMPP) to 110 μM (ACh).
[3H]-NA release in response to low concentrations of nAChR agonists was fully inhibited by the presence of either TTX or Cd2+ (named TTX- or Cd2+-sensitive release). TTX-sensitive release was triggered by nicotinic agonists with a rank order of potency of DMPP > cytisine ≈ nicotine ≈ ACh, which due to its similarity to TTX-insensitive release indicates that it might also be triggered by prejunctional-type nAChRs. The EC50 values for TTX (Cd2+)-sensitive release were less than 10 μM for all four agonists.
By contrast to transmitter release, somatic nAChRs as seen by patch clamp recordings were most potently activated by cytisine, with a rank order of potency of cytisine > nicotine ≈ DMPP > ACh. EC50 values for the induction of currents exceeded 20 μM for all four agonists.
The nicotinic antagonist mecamylamine potently inhibited all transmitter release in response to nicotine. α-Bungarotoxin (α-BuTX) was, on the other hand, without significant effect on nicotine-induced TTX-insensitive release. The competitive antagonist dihydro-β-erythroidine (DHβE) caused rightward shifts of the dose-response curves for both TTX-sensitive and TTX-insensitive transmitter release as well as for currents in response to nicotine, with pA2 values ranging from 4.03 to 4.58.
Due to clear differences in the pharmacology of agonists we propose that nAChRs of distinct subunit composition are differentially targeted to somatic or axonal domains.
Fast cholinergic transmission through sympathetic ganglia is mediated by the activation of somatodendritic nicotinic acetylcholine (ACh) receptors (nAChRs) located within the ganglia. However, it has long been known that these neurones, in addition, have prejunctional nAChRs on their nerve endings in target organs, where nicotinic agonists cause the release of noradrenaline (NA) (Starke, 1977). In the peripheral nervous system (PNS), the biological significance of these prejunctional nAChRs is still a matter of debate (Starke, 1977; Fuder & Muscholl, 1995). This is in contrast to the central nervous system (CNS), where presynaptic nAChRs may have surpassed their postsynaptic counterparts (Role & Berg, 1996; Wonnacott, 1997).
Studies in vegetative ganglia have contributed a major share to the understanding of the function and the molecular biology of neuronal nAChRs (for reviews see Sargent, 1993; McGehee & Role, 1995b). Rat superior cervical ganglion (SCG) neurones have high levels of α3 and β4 subunit mRNA, but they also show α7, β2, α5 and α4.1 mRNA (Mandelzys et al. 1994; Rust et al. 1994; Klimaschewski et al. 1994; DeKoninck & Cooper, 1995). The many possible combinations raise the possibility that functionally distinct nAChRs might be directed to specific subcellular sites. Morphological studies with the combined use of neuronal bungarotoxin and α-bungarotoxin (α-BuTx) suggested ultrastructural heterogeneity of nAChRs at the surface membrane of rat SCG neurones (Loring et al. 1988).
We have previously shown that ACh induces the release of [3H]-noradrenaline ([3H]-NA) in cultured rat sympathetic neurones even when voltage-activated Ca2+ channels (VACCs) have been blocked by Cd2+ (Boehm & Huck, 1995). Given the Ca2+ dependence of this phenomenon (Boehm & Huck, 1995), our observations implied a prejunctional mechanism of Ca2+ influx independent of VACCs, presumably directly through nAChRs (Role & Berg, 1996; Wonnacott, 1997). We have now used this component of transmitter release to define properties of prejunctional nAChRs by means of pharmacological tools. The results from these experiments were compared with pharmacological data obtained by whole-cell patch clamp recordings, since currents elicited by nicotinic agonists are expected to reflect the properties of nAChRs at somatodendritic domains. Patch clamp as well as transmitter release experiments included not only dose-response curves from pooled observations, but also low-concentration potency ratios of agonists in the same experimental setting (Covernton et al. 1994). The observed clear differences in the rank order of potencies of agonists led us to conclude that the prejunctional receptors at varicosities are pharmacologically distinct from those at the soma, consistent with differential targeting of nAChRs of distinct subunit composition.
METHODS
Cell culture
Superior cervical ganglia (SCG) were dissected from 2-6 day old Sprague-Dawley rat pups killed by decapitation, and were dissociated as described previously (Boehm & Huck, 1995). Briefly, ganglia were freed from adhering connective tissue and blood vessels, cut into three to four pieces, and incubated in collagenase (1.5 mg ml−1; Sigma, C-9891) and dispase (3.0 mg ml−1; Boehringer Mannheim, 165859) for 20 min at 36.5°C. Subsequently, the ganglia were trypsinized (0.25 % trypsin in Tyrode solution; Worthington, 3703) for 15 min at 36.5°C and dissociated by trituration. Dissociated cells were resuspended in serum-free culture medium and plated either onto 5 mm discs (punched out of tissue culture dishes; Nunc, 153066) coated with collagen (Biomedical Technologies, BT-274) for release experiments, or onto poly-L-ornithine (100 mg l−1 H2O; Sigma, P-3655)-treated tissue culture dishes for patch clamp recordings. Cells were seeded into glass rings of 6 mm (40 000 cells for release experiments) or 8 mm diameter (30 000 cells for patch clamp) in order to confine the cell suspension to the discs or to the centre of the dishes. The culture medium consisted of Dulbecco's modified Eagle's medium (GibcoBRL, 81885-023), supplemented with 2.2 g l−1 glucose, 10 mg l−1 insulin (Sigma, I-5500), 25 000 IU l−1 penicillin, 25 mg l−1 streptomycin (GibcoBRL, 15140-106) and 10 μg l−1 nerve growth factor (Peninsula Laboratories, IP-9020). The glass rings were removed after 90 min of incubation, and heat-inactivated fetal calf serum (GibcoBRL, 10108-157) was added to a final concentration of 5 %. The cells were kept in vitro in 5 % CO2, 95 % air and at 36.5°C for 3-6 days prior to transmitter release or patch clamp experiments. Cultures kept for more than 4 days were fed after 2 or 3 days in vitro by replacing half of the culture medium. Under the culture conditions used for electrophysiology, cells more closely resembled dendrite-deficient than dendrite-bearing neurones (Lein et al. 1995), and we therefore refer to our own results on receptor-mediated currents by using the term ‘somatic’ rather than ‘somatodendritic’ nAChRs. By adopting this terminology we do, however, not exclude that dendritic nAChRs contribute to agonist-induced currents.
[3H]-Noradrenaline uptake and superfusion
The techniques of labelling cultures of rat sympathetic neurones with [3H]-noradrenaline (NA) and subsequent superfusion have previously been described in detail (Boehm & Huck, 1995). The cultures were incubated in 0.03 μM [3H]-NA in culture medium containing 1 mM ascorbic acid for 60 min. Thereafter, culture discs were transferred to small chambers and superfused with a buffer containing (mmol l−1): NaCl, 120; KCl, 3.0; CaCl2, 2.0; MgCl2, 2.0; glucose, 20; Hepes, 10; fumaric acid, 0.5; sodium pyruvate, 5.0; and ascorbic acid, 0.57; adjusted to pH 7.4 with NaOH, 25°C, at a superfusion rate of 1.1 ml min−1. The radioactivity released into the superfusate of such cultures has been shown to consist primarily of authentic [3H]-NA (Schwartz & Malik, 1993). Subsequent to a 60 min washout period, the collection of 4 min superfusate fractions was started. 3H outflow was induced either by electrical field stimulation (100 monophasic rectangular pulses delivered at 10 Hz, 0.5 ms, 50 V cm−1, 40 mA), or by adding nicotinic agonists to the superfusion medium for 15 s. Cultures were challenged with a first stimulus (S1) 12 min after the washout period (i.e. after 72 min of superfusion) and to a maximum of four additional stimuli at 20 min intervals. Concentration-response relationships for agonists were established by a total of four stimuli with increasing concentrations of the agent. Unless otherwise noted, substances such as nicotinic antagonists or TTX were present either throughout the collection period or added 8 min before and present during S2. At the end of an experiment, the remaining radioactivity in the cultures was extracted by perchloric acid and sonication. Radioactivity in extracts and collected fractions was determined by liquid scintillation counting.
Calculation of basal and stimulation-evoked tritium outflow
The basal rate of 3H outflow was obtained by dividing the radioactivity of a 4 min fraction by the total radioactivity of cultures at the beginning of the corresponding 4 min collection period. Basal outflow before S1 was termed L1. Stimulation-evoked outflow was calculated as the difference between the total 3H outflow during and after stimulation on the one hand, and the estimated basal outflow on the other hand, assuming that basal release follows a linear decline. The (stimulus-induced) difference was expressed as a percentage of the total radioactivity in the cultures at the beginning of the respective stimulation (S %). The effects of drugs added between the two stimuli were evaluated by calculating ratios of the outflow evoked by S2 and S1 (S2/ S1).
Electrophysiology
Electrophysiological recordings from neurones were performed at room temperature (20-24°C) by means of the perforated patch clamp technique (Rae et al. 1991). We used L/M-EPC-7 (List Biomedical) or Axopatch 200A (Axon Instruments) patch clamp amplifiers and pCLAMP hardware and software (Axon Instruments). Substances were applied by a DAD-12 superfusion system (Adams & List). Unless otherwise noted, agonists were applied for 1 s, and antagonists were added to the superfusion buffer 10 s before and during application of agonists. The bathing solution contained (mM): NaCl, 120; KCl, 3.0; CaCl2, 2.0; MgCl2, 2.0; glucose, 20; Hepes, 10; and TTX, 0.001; adjusted to pH 7.3 with NaOH. The internal (pipette) solution contained (mM): K2SO4, 75; KCl, 55; MgCl2, 8.0; and Hepes, 10; adjusted to pH 7.3 with KOH. Access to cells was achieved by including 200 μg ml−1 amphotericin B (Sigma, A-4888) in the internal solution and by otherwise following the directions provided by Rae et al. (1991). Recordings thus obtained were stable for hours without signs of rundown which often accompanies agonist-induced currents recorded by means of the conventional whole-cell patch clamp technique.
Statistics
All data represent arithmetic means ±s.e.m. Full concentration- response curves for agonists were fitted by unweighted non-linear regression to the logistic equation:
| (1) |
where Ex is the response; x the arithmetic dose; Emax the maximal response; p a slope factor; and EC50 the dose that gives a half-maximal response. Computation was done by using either SigmaPlot (Jandel Corporation) or the ALLFIT program (DeLean et al. 1978). The ALLFIT program calculates parameter estimates for EC50 values, p, and Emax, as well as appropriate standard errors and leaves the option to fit curves by weighted as well as by unweighted non-linear regression. Curve fits to the logistic equation were carried out with the intention of providing estimates for EC50 values of agonists and for curve shifts caused by competitive antagonists. Estimates for the slope (p), which is numerically identical to the Hill coefficient (DeLean et al. 1978), are provided primarily for the purposes of comparison with the literature, since slopes in a complex system like agonist-induced transmitter release will not only be determined by ligand-receptor interaction, but also by factors such as receptor desensitization (Covernton et al. 1994) and mechanisms downstream of ligand-receptor interaction (e.g. Ca2+-mediated exocytosis).
Low-concentration potency ratios were determined according to Covernton et al. (1994). Hence, curves from a single cell or a single release experiment were fitted simultaneously by non-linear regression with logistic equations that were constrained to be parallel (i.e. with a shared slope parameter, p). The maximum response was fixed to a value inferred from full-range concentration-response curves of previous experiments. Adequacy of the fits was judged by eye. IC50 values were defined as the concentration of an antagonist that caused 50 % inhibition of the response to a fixed concentration of an agonist.
Mechanisms of competitive antagonism were judged by means of the Schild regression (Arunlakshana & Schild, 1959):
| (2) |
where pAx% is the negative logarithm of the concentration of the inhibitor, x is the shift of the dose-response curve (dose ratio) caused by its presence, Ki is the dissociation constant of the inhibitor, and n is the slope factor. The regression line fitted to the data intersects the abscissa at a point corresponding to pA2 which in the case of n = 1 corresponds to Ki (Arunlakshana & Schild, 1959).
The significance of differences for paired and unpaired observations was evaluated by the signed-rank tests according to Wilcoxon or Mann-Whitney, respectively.
Materials
Drugs were obtained from the following sources: (-)-[ring-2,5,6-3H]-noradrenaline (56.9 Ci mmol−1; NET678) from NEN; acetylcholine chloride (ACh; A-6625), (-)-noradrenaline hydrochloride (NA; A-7381), 1,1-dimethyl-4-phenylpiperazinium iodide (DMPP; D-5891), cytisine (C-2899), CdCl2 (C-5081) and mecamylamine (M-9020) from Sigma; dihydro-β-erythroidine (DHβE; D-149) from RBI; and TTX (L8503) and α-bungarotoxin (α-BuTX; L8115) from Latoxan. Ordinary chemicals were from Merck (analytical grade). Drugs were stored as stock solutions in H2O at -20°C and diluted to the final concentrations in superfusion buffer for release experiments or in bathing solution for patch clamp recordings.
RESULTS
Two components of nicotine-induced transmitter release
Two primary mechanisms may account for transmitter release in response to nAChR activation. First, nicotinic agonists depolarize neurones to the threshold of voltage-gated Na+ channels. The ensuing action potential then causes Ca2+ entry via VACCs and Ca2+-dependent exocytosis. Second, Ca2+-dependent exocytosis occurs independently of both voltage-gated Na+ and Ca2+ channels by Ca2+ entry directly via nAChRs located at presynaptic domains (Role & Berg, 1996; Wonnacott, 1997). Hence, the obvious tools to discriminate between these two mechanisms are TTX and Cd2+, which would block voltage-gated Na+ and Ca2+ channels, respectively.
We first determined the concentrations of TTX and Cd2+ required for blocking transmitter release in response to electrical field stimulation. SCG cultures pre-loaded with [3H]-NA released small amounts of radioactivity under resting conditions (L1: 1.00 ± 0.02 %, n = 439 individual cultures) (Fig. 1C) (see also Boehm & Huck, 1995). Electrical field stimulation induced additional release that was prevented by buffer containing either TTX (> 30 nM) (Fig. 1A) or Cd2+ (> 30 μM) (Fig. 1B). These observations are in line with the conventional concept (Boehm & Huck, 1997) that electrical field stimulation generates Na+-dependent action potentials (blocked by TTX), which in turn cause Ca2+ entry via VACCs (blocked by Cd2+, see Boehm & Huck, 1995) and Ca2+-dependent exocytosis.
Figure 1. [3H]-NA release in response to electrical field stimulation or nicotine: effects of TTX and Cd2+.
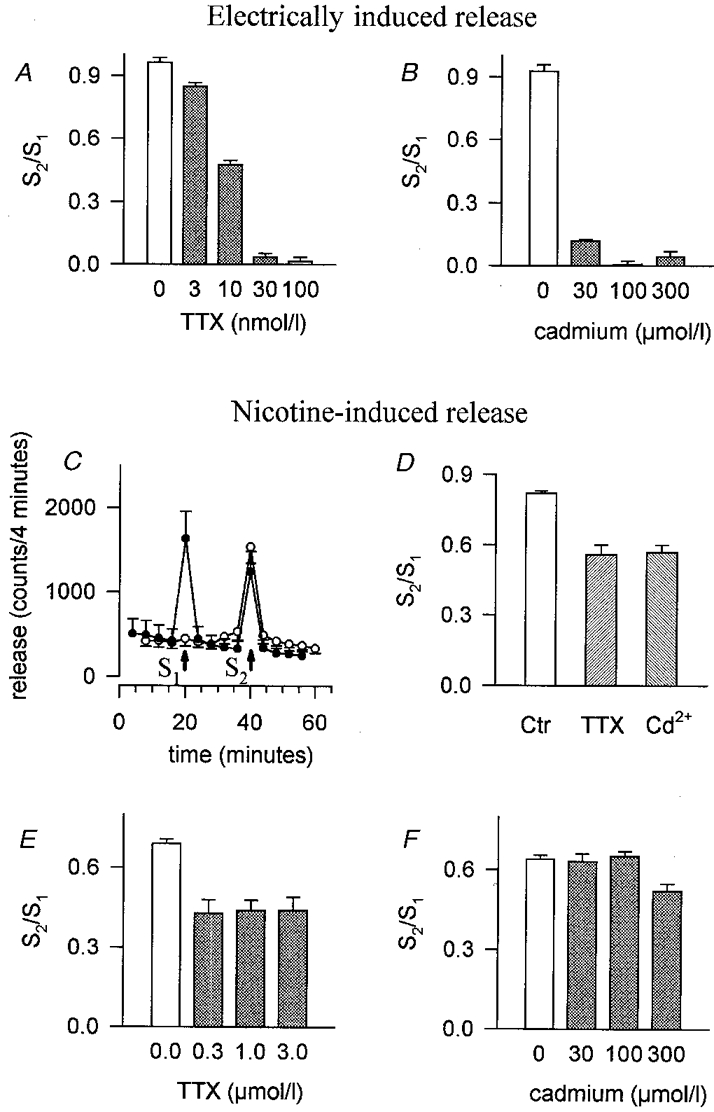
A, effect of TTX on S2/S1 ratios of transmitter release induced by electrical field stimulation. Indicated concentrations of TTX were added to the superfusion buffer 8 min before and during the second stimulus, S2. Means and s.e.m., n = 6-15 individual cultures. B, effect of Cd2+ on S2/S1 ratios of transmitter release induced by electrical field stimulation. Indicated concentrations of Cd2+ were added to the superfusion buffer 8 min before and during S2. Means and s.e.m., n = 6. C, basal transmitter release, and the release induced by 100 μM nicotine (15 s, indicated by arrows). •, control buffer containing 2 mM Ca2+; ○, superfusion buffer without (arrow at 20 min) or with (arrow at 40 min) 2 mM Ca2+. Means and s.e.m., n = 3. D, effects of 1 μM TTX or 100 μM Cd2+ on S2/S1 ratios of transmitter release induced by 100 μM nicotine. TTX or Cd2+ was added to the superfusion buffer 8 min before and during S2. Means and s.e.m., n = 12 (control, Ctr) or 6 (TTX and Cd2+). S2/S1 ratios in the presence of TTX or Cd2+ do not differ significantly (P > 0.05, Mann-Whitney test). E, effect of TTX on S2/S1 ratios of transmitter release induced by 100 μM nicotine. Indicated concentrations of TTX were added to the superfusion buffer 8 min before and during S2. Means and s.e.m., n = 6. F, effect of Cd2+ on S2/S1 ratios of transmitter release induced by 100 μM nicotine in the presence of TTX. TTX (1 μM) was included in the superfusion buffer throughout the collection of the fractions. Indicated concentrations of Cd2+ were added to the superfusion buffer 8 min before and during S2. S2/S1 ratios in the presence of Cd2+ differ from S2/S1 ratios of controls only at 300 μM Cd2+ (P < 0.01, Mann-Whitney test). Data are means and s.e.m., n = 6.
In agreement with previous reports on chick (Dolezal et al. 1995) and rat sympathetic neurone cultures (Boehm & Huck, 1995), nicotinic agonists induced a concentration-dependent release of [3H]-NA that required the presence of Ca2+ in the superfusion buffer (Fig. 1C). However, TTX at concentrations fully competent to block transmitter release by electrical field stimulation (Fig. 1A) was only partially effective when release was evoked by 100 μM nicotine (Fig. 1D and E) (see also Dolezal et al. 1995). Likewise, Cd2+ at concentrations that entirely blocked either VACCs (Hirning et al. 1988) or electrically induced transmitter release (Fig. 1B) inhibited release in response to nicotine to the same extent as TTX (Fig. 1D). Hence, blockade of voltage-gated Na+ or Ca2+ channels reveals two components of transmitter release. We call the two components TTX (or Cd2+) sensitive and insensitive, respectively.
In the presence of TTX, transmitter release induced by 100 μM nicotine was unaffected by 100 μM Cd2+ (Fig. 1F), indicating a crucial role of voltage-gated Na+ channels in the signalling cascade that leads from nAChR activation to VACC-mediated exocytosis. Hence, under these experimental conditions, depolarization due to nAChR activation seems insufficient to gate VACCs directly. The small effect of 300 μM Cd2+ on TTX-insensitive transmitter release (Fig. 1F) is most probably due to a direct inhibition of nAChRs by Cd2+ (Vijayaraghavan et al. 1992; Boehm & Huck, 1995). Nevertheless, we routinely employed this supramaximal Cd2+ concentration for determination of the Cd2+-insensitive component of transmitter release in order to rigorously rule out any contribution of VACCs.
The complementary experiment, testing the effect of TTX on the release induced by 100 μM nicotine in the presence of 100 μM Cd2+, yielded similar results (S2/S1 ratios of nicotine-induced release in the presence of Cd2+: 1.03 ± 0.02; S2/S1 ratios of nicotine-induced release in the presence of Cd2+, but with 1 μM TTX added 8 min before and during S2: 0.98 ± 0.02; n = 6 individual cultures, P > 0.05, Mann- Whitney test). Hence, mechanisms related to the generation of action potentials (such as Na+-dependent Ca2+ release from mitochondrial stores, see Rathouz et al. 1996) do not contribute to nicotine-induced transmitter release if VACCs have been blocked by Cd2+.
In sum, these experiments confirm and extend our previous observation that transmitter release in response to nAChR activation consists of two components: one that depends on, and one that is independent of VACCs (Boehm & Huck, 1995). TTX and Cd2+ appear to unveil identical aspects of VACC-independent vesicular exocytosis, and we will therefore use the terms TTX- and Cd2+-insensitive (and TTX- and Cd2+-sensitive) release in an interchangeable manner.
In order to learn more about the properties of the nAChRs that form the basis of these two mechanisms we next studied the pharmacology of four prominent nicotinic agonists.
Concentration-response relationship of transmitter release induced by nicotine, DMPP, cytisine and ACh
The concentration-response relationship of nicotine-induced transmitter release under control conditions (overall release) and in the presence of 1 μM TTX (TTX-insensitive release) is shown in Fig. 2. The remarkable relaxation of effects at high agonist concentrations, which results in bell-shaped concentration-response curves, is a common phenomenon (see also Fig. 3) that has been noted in several different preparations (see Covernton et al. 1994; Wilkie et al. 1996, and references cited therein). Subtraction of TTX-insensitive release from overall release revealed the TTX-sensitive component (Fig. 2A and B). Curves fitted to the data points of TTX-insensitive release and to calculated TTX-sensitive release revealed EC50 values of 34.6 and 7.6 μM, respectively (Fig. 2B, Table 1). Hence, the nicotine concentration required to activate the TTX-insensitive component is about fivefold that required to elicit TTX-sensitive transmitter release.
Figure 2. Concentration-response curves of nicotine-induced TTX-sensitive and TTX-insensitive transmitter release.
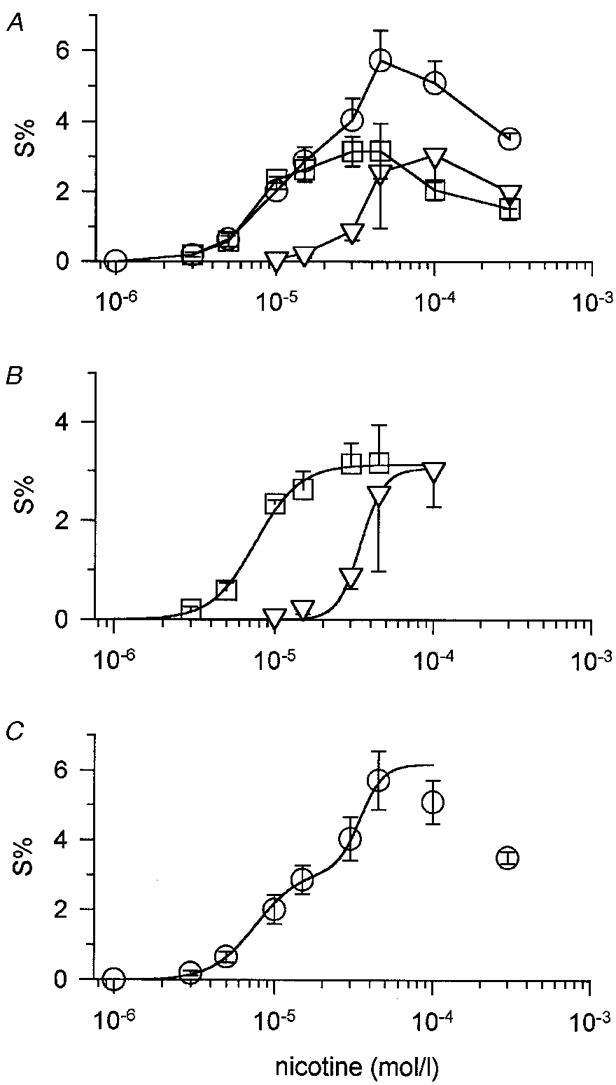
A, nicotine-induced transmitter release under control conditions (overall release, ○) and in the presence of 1 μM TTX (TTX-insensitive release, ▿). Data are means and s.e.m., n = 3-7 platings, each including 3 or 6 individual culture discs. Data points indicated by squares were obtained by subtracting mean values of nicotine-induced TTX-insensitive release (▿) from overall release (○) for the same experiment and represent TTX-sensitive release (see text). B, curve fits of TTX-sensitive (□) and TTX-insensitive release (▿). Data points were taken from A. Curves were fitted to data points using eqn (1) described in Methods. Apparent affinities for nicotine were 7.60 and 34.6 μM for TTX-sensitive and TTX-insensitive release, respectively. C, concentration dependence of nicotine-induced transmitter release under control conditions (overall release, as shown in A). The curve was obtained by summation of the two fitted curves for nicotine-induced TTX-sensitive and TTX-insensitive release shown in B.
Figure 3. Concentration-response curves of transmitter release induced by nicotinic agonists.

Aa, DMPP-induced transmitter release under control conditions (overall release, ○) and in the presence of 300 μM Cd2+ (Cd2+-insensitive release, ▿). Data are means and s.e.m. (plotted only when exceeding symbol size), n = 4-7 platings, each including 3 individual culture discs, except for 3 and 300 μM DMPP in the presence of Cd2+ (n = 2). Data points indicated by squares (Cd2+-sensitive release) were obtained by subtracting DMPP-induced release in the presence of Cd2+ (▿) from overall release (○) in the same experiment. The sum of Cd2+-sensitive and Cd2+-insensitive release may not exactly match overall release in this figure, since a greater number of experiments were pooled for constructing overall as compared with Cd2+-sensitive release (note e.g. data points at 100 μM DMPP). Ab, curve fits of Cd2+-sensitive (□) and Cd2+-insensitive (▿) DMPP-induced transmitter release. Data points were taken from Aa. Curves were fitted to data points using eqn (1). Apparent affinities for DMPP were 3.86 and 22.4 μM for Cd2+-sensitive and Cd2+-insensitive release, respectively. Ba, cytisine-induced transmitter release under control conditions (overall release, ○) and in the presence of 300 μM Cd2+ (Cd2+-insensitive release, ▿). Data are means and s.e.m., n = 3 platings, each including 3 or 6 individual culture discs. Data points indicated by squares were obtained by subtracting cytisine-induced release in the presence of Cd2+ (▿) from overall release (○) for the same experiment. Bb, curve fits of Cd2+-sensitive (□) and Cd2+-insensitive (▿) cytisine-induced transmitter release. Data points were taken from Ba. Curves were fitted to data points using eqn (1). Apparent affinities for cytisine were 7.01 and 48.7 μM for Cd2+-sensitive and Cd2+-insensitive release, respectively. Ca, ACh-induced transmitter release under control conditions (overall release, ○) and in the presence of 300 μM Cd2+ (Cd2+-insensitive release, ▿). Data are means and s.e.m., n = 3-8 platings, each including 3 individual culture discs. Data points indicated by squares were obtained by subtracting ACh-induced release in the presence of Cd2+ (▿) from overall release (○) for the same experiment. Cb, curve fits of Cd2+-sensitive (□) and Cd2+-insensitive (▿) ACh-induced transmitter release. Data points were taken from Ca. Curves were fitted to data points using eqn (1). Apparent affinities for ACh were 7.45 and 110.6 μM for Cd2+-sensitive and Cd2+-insensitive release, respectively. D, partial concentration-response curves of TTX-sensitive transmitter release induced by DMPP (▵), cytisine (▿), nicotine (○) and ACh (□) in a single experiment made up of 12 individual culture discs. Indicated concentrations of agonists, each tested in one triplet of culture discs, were added at 20 min intervals. Data points are means from 3 individual discs. Error bars (s.e.m.) did not exceed symbols. Curves were simultaneously fitted to data points with the ALLFIT routine with the constraints of a shared slope and a fixed maximum as described in Methods. Potency ratios relative to the standard (DMPP) were 0.51 for nicotine, 0.47 for cytisine and 0.36 for ACh. Averaged potency ratios from identically designed experiments are provided in Table 2A. Note that agonist concentrations employed will only induce TTX-sensitive transmitter release. E, partial concentration-response curves of TTX-insensitive transmitter release induced by DMPP (▵), cytisine (▿), nicotine (○) and ACh (□) in a single experiment in the presence of 1 μM TTX. Agonists at indicated concentrations were each added to one triplet of culture discs as described for D. Data points are means from 3 individual culture discs. Error bars (s.e.m.) did not exceed symbol size. Curves were simultaneously fitted to data points with the ALLFIT routine with the constraints of a shared slope and a fixed maximum. Potency ratios relative to the standard (DMPP) were 0.87 for nicotine, 0.61 for cytisine and 0.14 for ACh. Averaged potency ratios from identically designed experiments are provided in Table 2C.
Table 1. Effects of saturating concentrations of nicotinic agonists on induction of transmitter release and whole-cell currents.
| DMPP (27) | Cytisine (22) | Nicotine (14) | ACh (10) | |||||||||
|---|---|---|---|---|---|---|---|---|---|---|---|---|
| EC50 (μM) | p | Emax | EC50 (μM) | p | Emax | EC50 (μM) | p | Emax | EC50 (μM) | p | Emax | |
| A. Current | 20.1 | 1.87 | 72.8 | 26.1** | 1.41** | 100.6* | 21.9 | 1.30** | 64.2 | 66.4** | 1.52** | 116.2** |
| ±0.7 | ±0.06 | ±5.2 | ±1.8 | ±0.03 | ±6.7 | ±1.7 | ±0.07 | ±8.3 | ±6.7 | ±0.07 | ±11.4 | |
| B. TTX-sensitive release | 3.86 | 4.03 | 2.59 | 7.01 | 1.58 | 3.47 | 7.60 | 3.18 | 3.13 | 7.45 | 4.11 | 0.95 |
| ±1.94 | ±1.57 | ±1.88 | ±1.66 | ±0.46 | ±0.30 | ±0.44 | ±0.42 | ±0.01 | ±1.94 | ±3.40 | ±0.06 | |
| C. TTX-insensitive release | 22.4 | 3.56 | 2.53 | 48.7 | 2.59 | 3.96 | 34.6 | 6.00 | 3.05 | 110.6 | 2.14 | 1.88 |
| ±4.6 | ±2.07 | ±0.20 | ±9.22 | ±0.78 | ±0.32 | ±1.2 | ±1.01 | ±0.13 | ±14.1 | ±0.27 | ±0.14 | |
| D. Ratio insensitive/sensitive | 5.80 | 0.97 | 6.94 | 1.14 | 4.55 | 0.97 | 14.84 | 1.97 | ||||
A, EC50 values, slope factors (p) and maximal effects (Emax, pA pF−1) for agonist-induced currents recorded by the perforated patch technique as described in Methods. Representative original current traces with concentration–response curves are shown in Fig. 4 Data points are the averaged parameters (± S.E.M.) from curve fits that were constructed for each individual cell (number of cells is given beside the agonist in parentheses). Statistical differences relative to the effects of DMPP were calculated by the Mann–Whitney test
P < 0.05
P < 0.01.
From this summary it appears that maximal effects of both nicotine and DMPP were smaller than those of ACh and cytisine. DMPP effects were also consistently smaller than either cytisine- or ACh-induced peak currents when compared in identical cells (cytisine, 106 ± 10 pA pF−1; DMPP, 74 ± 6 pA pF−1; means ± S.E.M.; P < 0.01, Wilcoxon test, n = 17; ACh, 116 ± 11 pA pF−1; DMPP, 69 ± 9 pA pF−1; P < 0.01, Wilcoxon test, n = 10; see also Fig. 4Aa and Ab). By contrast, a direct comparison of maximal effects of nicotine- and cytisine-induced currents in identical cells revealed no significant difference between the two substances (nicotine, 77 ± 5 pA pF−1; cytisine, 78 ± 5 pA pF−1; means ± S.E.M.; P > 0.05, Wilcoxon test, n = 5; see also Fig. 4Ba and Bb). Averaged cell capacitance was 33 ± 1 pF (mean ± S.E.M.), n = 41 cells. B, data points taken from curve fits of Fig. 2 and Fig. 3 (Emax, S%). TTX-sensitive release also stands for Cd2+ -sensitive release. C, data points taken from curve fits of Fig. 2 and Fig. 3. TTX-insensitive release also stands for Cd2+ -insensitive release. D, ratio of TTX-insensitive/TTX-sensitive transmitter release. Note that except for ACh, the ratio of EC50 values varies by a factor of about 6 (range, 4.55–6.94).
In some experiments, the two components of agonist-induced transmitter release were separated by including 300 μM Cd2+ instead of TTX in the superfusion buffer. The concentration-response curve of nicotine-induced transmitter release in the presence of Cd2+ had an EC50 value of 32.8 ± 1.3 μM and a maximum S % of 3.32 ± 0.12 (estimate ±s.e.m., ALLFIT routine; n = 3 platings), similar to the values obtained for nicotine-induced transmitter release in the presence of TTX (Fig. 2B and Table 1). Hence, the inherent variability between experiments seems to mask the small inhibition (roughly 20 %) of nAChRs by 300 μM Cd2+ mentioned above (Fig. 1F), and we therefore used Cd2+ as an inexpensive substitute for TTX to unveil the TTX-insensitive (now called Cd2+-insensitive) component.
In analogy to the experiments just described for nicotine, release induced by the agonists DMPP, cytisine and ACh in the presence of Cd2+ will produce the Cd2+-insensitive component, which after subtraction from (overall) release in the absence of Cd2+ discloses the Cd2+-sensitive component (Fig. 3). The rank order of potency as revealed by these experiments was DMPP > cytisine ≡ nicotine ≡ ACh for the TTX (or Cd2+)-sensitive component and DMPP > nicotine > cytisine > ACh for the TTX (Cd2+)-insensitive component (Tables 1 and 2). These experiments indicate that both components of agonist-induced transmitter release were most potently elicited by DMPP. However, nicotine, cytisine and ACh appeared equipotent in evoking TTX (Cd2+)-sensitive release, but differed in potency regarding the TTX (Cd2+)-insensitive component.
Table 2. Potency ratios of cytisine, nicotine and ACh relative to DMPP for agonist-induced transmitter release (A–D) and agonist-induced currents (E–G).
| DMPP | Cytisine | Nicotine | Ach | |
|---|---|---|---|---|
| A. TTX-sensitive release, partial dose–response | 1 | 0.59 ± 0.03 (7)* | 0.56 ± 0.08 (6)* | 0.39 ± 0.05 (7)* |
| B. TTX-sensitive release, full dose–response | 1 | 0.55 | 0.50 | 0.52 |
| C. TTX-insensitive release, partial dose–response | 1 | 0.46 ± 0.06 (4)** | 0.79 ± 0.08 (4)n.s. | 0.10 ± 0.05 (4)** |
| D. TTX-insensitive release, full dose–response | 1 | 0.46 | 0.65 | 0.20 |
| E. Peak current, partial dose–response | 1 | 1.44 ± 0.07 (17)** | 0.92 ± 0.04 (17)n.s. | 0.51 ± 0.03 (17)** |
| F. Time integral of current, partial dose–response | 1 | 1.61 ± 0.07 (17)** | 0.98 ± 0.04 (17)** | 0.56 ± 0.03 (17)** |
| G. Peak current, full dose–response | 1 | 0.78 | 0.91 | 0.30 |
A, potency ratios of agonist-induced, TTX-sensitive transmitter release using DMPP as a standard. The 4 nicotinic agonists were simultaneously tested in the same experiment at concentrations (3 and 5 μM) that will only produce submaximal TTX-sensitive release (see Fig. 2 and Fig. 3). Potency ratios for individual experiments were calculated from curves simultaneously fitted to data points with logistic equations that were constrained to be parallel and to fixed maxima implied from full concentration–response curves (see Methods). Data are means ± S.E.M. from 6–7 release experiments with 3 individual culture discs for each substance (one of these experiments is shown in Fig. 3D).
Significantly different from 1 (P < 0.05, Wilcoxon test). Potency ratios of cytisine and ACh (P < 0.05), but not of nicotine and ACh (P > 0.05, Wilcoxon test) differ significantly. Note that numbers < 1 mean potencies less than DMPP. B, potency ratios calculated from EC50 values of TTX-sensitive transmitter release shown in Fig. 2 and Fig. 3 and Table 1. C, potency ratios for TTX-insensitive transmitter release (i.e. in the presence of 1 μM TTX). The 4 nicotinic agonists were simultaneously tested in the same experiment at concentrations that will only produce submaximal TTX-insensitive release (see Fig. 2 and Fig. 3). Potency ratios for individual experiments were calculated from curves simultaneously fitted to data points with logistic equations that were constrained to be parallel and to fixed maxima implied from full concentration–response curves (see Methods). Data are means ± S.E.M. from 4 release experiments with 3 individual culture discs for each substance (one of these experiments is shown in Fig. 3E).
Significantly different from 1 (P < 0.01); n. s., not significantly different from 1 (P > 0.05), Wilcoxon test. D, potency ratios calculated from EC50 values of TTX-insensitive transmitter release shown in Fig. 2 and Fig. 3 and Table 1. E, potency ratios deduced from agonist-induced peak currents. Cells were exposed to the 4 nicotinic agonists at the low-concentration end of the dose–response curve. Potency ratios were calculated from the peak currents elicited in individual cells (see Fig. 5B for an example) by curves simultaneously fitted to data points. Curve fits were performed with logistic equations that were constrained to be parallel and to a fixed maximum implied from full concentration–response curves (see Methods). Data are means ± S.E.M. of the ratios of 17 individual cells from 5 different platings. **Significantly different from 1 (P < 0.01); n. s, not significantly different from 1 (P > 0.05), Wilcoxon test. F, potency ratios deduced from 15 s time integrals of agonist-induced currents. Data points are from the same experiments described in E except that 15 s time integrals instead of maxima of currents were used for the calculation of potency ratios. **Significantly different (P < 0.01) from the respective potency ratio shown in E (Wilcoxon test). G, potency ratios calculated from the EC50 values (provided in Table 1) of full concentration–response curves of agonist-induced currents.
Due to the dual activation of both nicotinic and muscarinic receptors, effects of ACh are predictably complex. Muscarinic receptor activation inhibits transmitter release (Starke, 1977; Todorov et al. 1991; Boehm & Huck, 1995; Fuder & Muscholl, 1995; Koh & Hille, 1997), VACCs (Bernheim et al. 1992), but also M-type potassium channels (Bernheim et al. 1992) in the rat sympathetic nervous system. Hence, muscarinic receptor activation might explain some specific feature of ACh-induced transmitter release, such as the high EC50 ratio (about 15 instead of 5 as for the other nicotinic agonists) of TTX-insensitive versus TTX-sensitive transmitter release (Fig. 3 and Table 1).
For a direct evaluation of potency ratios relative to a standard, partial concentration-response curves for the four nicotinic agonists were simultaneously evaluated in the same release experiment (low-concentration potency ratios). This approach not only eliminates the variability between different experiments, it also minimizes receptor desensitization due to the lower concentrations of agonist employed. Typical experiments for TTX-sensitive and TTX-insensitive release are shown in Fig. 3D and E, respectively. TTX-sensitive release by this approach was achieved by selecting agonist concentrations previously determined to be too low to cause TTX-insensitive transmitter release (Figs 2 and 3). A summary of these experiments is provided in Table 2A (TTX-sensitive release) and C (TTX-insensitive release). Note that potency ratios thus obtained were similar to the potency ratios that were calculated from EC50 values of full concentration-response curves (Table 2B and D for TTX-sensitive and TTX-insensitive release, respectively).
Data from the experiments used to calculate low-concentration potency ratios were also analysed by pooling rates of transmitter release at a given concentration of agonist. Hence, the release induced by 1 μM agonist (TTX-sensitive release) was 0.12 ± 0.03 for DMPP, 0.04 ± 0.01 * for cytisine, 0 ** for nicotine, and 0.01 ± 0.001 ** for ACh (mean S %±s.e.m.; n = 18-20 individual cultures; significant difference from DMPP with *P < 0.05 or **P < 0.01, Mann-Whitney test). Release induced by 3 μM agonist was 1.17 ± 0.21 for DMPP, 0.77 ± 0.09 ** for cytisine, 0.56 ± 0.09 ** for nicotine, and 0.56 ± 0.20 ** for ACh (mean S %±s.e.m.; n = 18-20; difference from DMPP significant with **P < 0.01, Mann-Whitney test). Rates for TTX-insensitive transmitter release (i.e. in the presence of 1 μM TTX, see Fig. 3E) in response to 15 μM agonist were 0.35 ± 0.05 for DMPP, 0.08 ± 0.01 ** for cytisine and 0.12 ± 0.02 ** for nicotine (mean S %±s.e.m.; n = 11-12; difference from DMPP significant with **P < 0.01, Mann-Whitney test).
Hence, at a given concentration of the agonist, DMPP evoked significantly more TTX-sensitive as well as TTX-insensitive release than any of the other agonists, including cytisine. These data, as well as the calculated potency ratios (Fig. 3D and E and Table 2), translate into DMPP being the most potent of the agonists for both TTX-sensitive and TTX-insensitive transmitter release. Since this rank order of potency clearly differs from previous observations made by patch clamp recordings in (adult) rat SCG ganglia (Covernton et al. 1994), we recorded agonist-induced currents in dissociated ganglia of postnatal rats to complement our release experiments.
Whole-cell currents induced by DMPP, nicotine, cytisine and ACh
Our transmitter release experiments employed a wide range of agonist concentrations sufficient to reach a maximum response, but also partial dose-response curves that directly related the potencies of three agonists to a standard, DMPP. In order to match these observations with patch clamp experiments, we established both full and partial concentration-response curves of agonist-induced whole-cell currents.
A comparison of EC50 values (inferred from full-range dose-response curves) revealed DMPP as the most and ACh as the least potent substance for inducing currents (Fig. 4 and Tables 1 and 2), which parallels effects on transmitter release. However, DMPP was also the least efficacious of the four agonists when tested in patch clamp recordings (see legend to Table 1). A reduced maximal effect of DMPP compared with ACh has been noted previously (Mandelzys et al. 1995) and may be caused by both a pronounced channel block and receptor desensitization (Mathie et al. 1991) at high concentrations of DMPP. As a result, such high agonist concentrations can produce misleading concentration-response curves (Covernton et al. 1994), and we therefore extended our experiments to make comparisons of relative potencies at non-saturating concentrations of agonists.
Figure 4. Examples of agonist-induced whole-cell currents at a concentration range that covers saturating responses.

Aa and Ba, original traces of currents induced by DMPP, ACh, nicotine and cytisine in 2 different cells (A and B). Pairs of indicated agonists were tested in cells voltage clamped at -70 mV using the perforated patch technique as described in Methods. Agonists were applied at concentrations indicated in Ab and Bb. Ab and Bb, dose-response relationship of peak currents constructed from the original recordings shown in Aa and Ba. Data points are mean peak currents measured in duplicate (□, ACh; ▵, DMPP; ○, nicotine; ▿, cytisine). Curves fitted to data points by means of eqn (1) revealed EC50 values of 19.7 μM for DMPP, 96.4 μM for ACh, 28.5 μM for nicotine and 22.2 μM for cytisine. A summary of related experiments is provided in Table 1A.
In fact, rank orders changed significantly when recording whole-cell currents in response to low concentrations of nicotinic agonists. In line with a previous report (Covernton et al. 1994), cytisine now appeared to be the most potent agonist, followed by DMPP ≡ nicotine, and ACh (Fig. 5 and Table 2).
Figure 5. Examples of agonist-induced whole-cell currents elicited at the low-concentration end of the dose-response curve.

A, original traces of currents induced by DMPP, ACh, nicotine and cytisine. Currents were recorded in the same cell by the perforated patch technique as described in Methods, except that application times were extended to 15 s. The cell was voltage clamped at -70 mV. Apart from ACh (4 μM), agonist concentrations for the effects shown were 3 μM. B, dose-response relationship of peak currents constructed from original recordings as shown in A. Data points are mean peak currents measured in duplicate for each agonist. Curves based on eqn (1) were simultaneously fitted to data points by weighted non-linear regression using the ALLFIT routine with the constraints of a shared slope and a fixed maximum as described in Methods. Potency ratios relative to the standard (DMPP, ▵) were 1.33 for cytisine (▿), 0.69 for nicotine (○) and 0.46 for ACh (□). Note that numbers > 1 mean potencies greater than DMPP (i.e. larger effects at equal concentrations). Averaged potency ratios from identically designed experiments are provided in Table 2E. C, dose-response relationship constructed from original recordings as shown in A, but based on a 15 s time integral (i.e. the area under the curve during a 15 s application of agonist) instead of measuring peak currents as shown in B. Data points are mean 15 s time integrals of currents measured in duplicate for each agonist. Potency ratios relative to DMPP (▵) were 1.61 for cytisine (▿), 0.84 for nicotine (○) and 0.57 for ACh (□), calculated by the same method as described in B. Averaged potency ratios from identically designed experiments are provided in Table 2F.
In order to make our data comparable with previous observations (Covernton et al. 1994; Mandelzys et al. 1995) we started with conventional measurements of agonist-induced peak currents. However, transmitter release in response to nicotinic agonists might be better accounted for by choosing the charge transfer (measured by the time integral of currents) that occurs during the application of an agonist. Slopes of full-range dose-response curves (as shown in Fig. 4) thus determined became significantly steeper for all agonists tested (P < 0.01, Wilcoxon test), and EC50 values were lower particularly for DMPP (from 20.1 to 14.8 μM; P < 0.01, Wilcoxon test), but also for ACh (from 66.4 to 62.5 μM, P < 0.05, Wilcoxon test). Steeper slope factors and a leftward shift of dose-response curves were to be expected, since the time integral of currents (even for drug applications as short as 1 s) will more sensitively reflect a desensitization phenomenon than measurements of peak current.
Likewise, potency ratios determined in response to agonists at the low-concentration end of the dose-response curve were significantly affected when taking the time integral instead of the maxima of currents (Fig. 5 and Table 2). For example, cytisine was now more potent by a factor of 1.61 (instead of 1.44, P < 0.01, Wilcoxon test) than DMPP (Table 2F). Since time integrals of currents were taken from a 15 s period of drug application, these observations best match our transmitter release experiments that also used 15 s exposure times of agonists.
In sum, nicotinic agonists followed a rank order of potency of cytisine > nicotine ≡ DMPP > ACh when tested with patch clamp recordings at the low-concentration end of the dose-response curve. A different rank order of potency (DMPP ≡ nicotine > cytisine > ACh) resulted when exploring the full range of dose-response curves. However, due to pronounced desensitization at high agonist concentrations that will distort dose-response curves, potency ratios deduced from such experiments may be misleading (Covernton et al. 1994).
Effects of the nicotinic antagonists mecamylamine, DHβE and α-BuTx
The nicotinic antagonist mecamylamine (Ascher et al. 1979; Lindstrom et al. 1996) inhibited overall release (induced by 100 μM nicotine) with an IC50 value of 0.083 μM, and Cd2+-insensitive release (induced by 100 μM nicotine in the presence of 300 μM Cd2+) with an IC50 value of 0.026 μM (Fig. 6). Full inhibition of overall and Cd2+-insensitive transmitter release was observed with 10 and 1 μM mecamylamine, respectively (Fig. 6C), indicating that release in response to nicotine is specifically coupled to the activation of nAChRs.
Figure 6. Effects of mecamylamine on nicotine-induced transmitter release.

A, nicotine-induced transmitter release under control conditions (overall release, ○), and in the presence of 100 nM mecamylamine (•), 300 nM mecamylamine (▴) and 1 μM mecamylamine (▾). Note that inhibition by mecamylamine depends on the concentration of nicotine. Data are means and s.e.m. (only shown when exceeding symbol size), n = 6 individual cultures. B, insurmountable inhibition of Cd2+-insensitive transmitter release by 30 nM and 1 μM mecamylamine. Transmitter release was induced by the indicated concentrations of nicotine in the presence of 300 μM Cd2+ and in the absence (control, ○) or continuous presence of 30 nM (•) or 1 μM (▾) mecamylamine. Data are means ±s.e.m. (only shown when exceeding symbol size), n = 3-5. C, effects of mecamylamine on overall and on Cd2+-insensitive, nicotine-induced transmitter release. Transmitter release was induced by 2 successive stimuli of 100 μM nicotine (S1, S2) in the absence (overall release, ▵) or presence of 300 μM Cd2+ (Cd2+-insensitive release, ▿) and indicated concentrations of mecamylamine added to the superfusion buffer 8 min before and during S2. S2/S1 ratios in the presence of mecamylamine were compared with S2/S1 ratios under control conditions. Data are mean values of percentage inhibition (s.e.m. did not exceed symbol size), n = 3-6. The curves were fitted to data points by means of eqn (1) with fixed parameters for maximum (100 % inhibition) and minimum (0 %). Curve fits yielded IC50 values of 0.083 and 0.026 μM mecamylamine for overall and Cd2+-insensitive release, respectively.
The effects of mecamylamine on overall release were clearly dependent on concentrations of both the agonist and the antagonist (Fig. 6A). Hence, 100 nM mecamylamine inhibited the release in response to 30 μM nicotine by only 11 %, whereas release induced by 100 μM nicotine was inhibited by about 60 % (Fig. 6A and C). These observations are compatible with the concept of an open-channel, use-dependent block (Ascher et al. 1979; Gurney & Rang, 1984).
With Cd2+-insensitive transmitter release, the effects of 1 μM mecamylamine were insurmountable even by excessive concentrations of nicotine (Fig. 6B), which indicates a non-competitive mode of action. An incomplete, non-competitive inhibition of Cd2+-insensitive transmitter release was seen in the presence of 30 nM mecamylamine (Fig. 6B). Mecamylamine at 1 μM did not affect the release induced by electrical field stimulation (control S2/S1 ratio: 0.91 ± 0.02; S2/S1 ratio with 1 μM mecamylamine added 8 min before and during S2: 0.90 ± 0.03, n = 3 individual cultures).
Given their exceptional Ca2+ permeability, α-BuTx-sensitive nAChRs composed of α7 subunits (McGehee & Role, 1995b) would be particularly suitable to mediate TTX-insensitive transmitter release. However, we found 50 nM α-BuTX to be without effect on the TTX-insensitive component (control S2/S1 ratios with 100 μM nicotine in the presence of 1 μM TTX: 0.77 ± 0.01; S2/S1 ratios with α-BuTX added 16 min before and during S2: 0.81 ± 0.02; n = 15; P > 0.05, Mann-Whitney test). It has previously been shown in rat SCG neurones that DMPP-induced currents and the associated increase of intracellular Ca2+ are unaffected by α-BuTX (Trouslard et al. 1993).
Competitive antagonists are valuable tools for the characterization of receptors (Arunlakshana & Schild, 1959), and one of the best-described competitive antagonists of the nAChR is DHβE (Harvey et al. 1996). Initial experiments indicated a rightward shift without noticeable depression of the dose-response curve of nicotine-induced, overall transmitter release in the presence of 50 μM DHβE (not shown). We wanted to know whether DHβE might differentially affect TTX-sensitive and TTX-insensitive transmitter release and therefore investigated effects of the substance by protocols that would separate the two components of transmitter release (Fig. 7). Schild plots constructed from curve shifts (dose ratios) of nicotine dose-response curves in the presence and absence of DHβE (Fig. 7A and C) revealed pA2 values of 4.03 and 4.25 for TTX-sensitive and TTX-insensitive transmitter release, respectively (Fig. 7B and D). For TTX-sensitive release, the slope of the Schild regression did not significantly differ from unity (-0.87, Fig. 7B), whereas the regression line appeared significantly steeper than the expected value of -1 for TTX-insensitive release (-1.13, Fig. 7D). Possible explanations for this deviation from unity might be antagonist concentrations too low for an accurate estimate, or non-equilibrium conditions of the antagonist applied in these experiments (Fig. 7A and D). In any case, the rather close pA2 values of 4.03 and 4.25 indicate that DHβE does not seem to discriminate between nicotinic receptors that trigger transmitter release by a TTX-sensitive versus a TTX-insensitive mechanism.
Figure 7. Effects of DHβE on nicotine-induced transmitter release and on nicotine-induced currents.
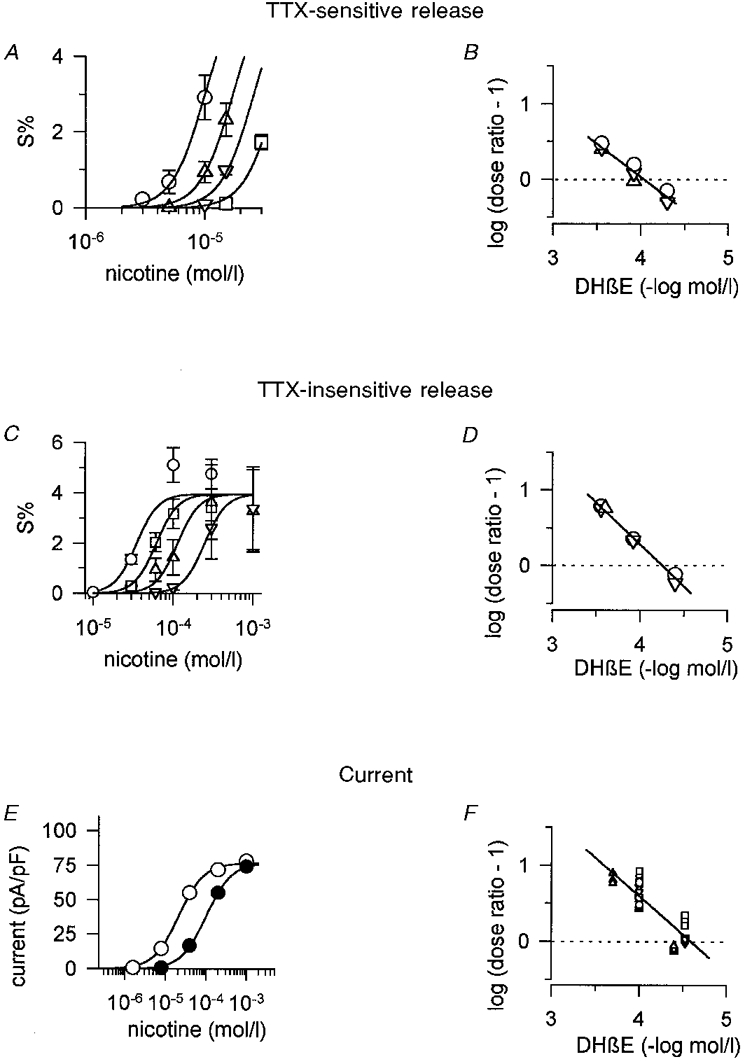
A, TTX-sensitive transmitter release induced by indicated concentrations of nicotine in the absence (○) or presence of 50 μM (▵), 120 μM (▿) and 280 μM DHβE (□). Unlike other antagonists, DHβE was added to the superfusion buffer only in combination with nicotine. Curves based on eqn (1) were simultaneously fitted to data points using the ALLFIT routine with the constraints of a shared slope and a fixed maximum as described in Methods. Curve shifts (dose ratios) caused by 50, 120 and 280 μM DHβE were 1.71, 2.58 and 4.02, respectively. Data are means ±s.e.m., n = 3 individual culture discs. Note that by selecting low concentrations, nicotine will primarily induce TTX-sensitive transmitter release (compare with C and Fig. 2). B, Schild plot of data shown in A and 2 additional, identically designed experiments. Dose ratios were calculated from curve shifts in the presence of a given concentration of the antagonist by fitting data points to eqn (1) as shown in A. Different symbols indicate 3 different release experiments. The line fitted to the data points has a slope of -0.87 ± 0.08 (estimate ±s.e.m.) which does not significantly differ from unity, as the confidence interval of the estimate of the slope included 1 at the 5 % significance level. It intersects the dotted line at 4.03 (pA2 value). C, TTX-insensitive transmitter release induced by the indicated concentrations of nicotine in the absence (○) or presence of 40 μM (□), 120 μM (▵) and 280 μM DHβE (▿). Cultures were continuously superfused with TTX-containing buffer, whereas the antagonist was added to the superfusion buffer just in combination with nicotine. Curves based on eqn (1) were simultaneously fitted to data points using the ALLFIT routine with the constraints of a shared slope and a shared maximum. Curve shifts (dose ratios) caused by 40, 120 and 280 μM DHβE were 1.76, 3.24 and 7.08, respectively. Data are means ±s.e.m., n = 3 individual culture discs. D, Schild plot of data shown in C and 2 additional, similarly designed experiments. Dose ratios were calculated from curve shifts in the presence of a given concentration of the antagonist by fitting data points to eqn (1) as shown in C. Different symbols indicate 3 different release experiments. The line fitted to the data points has a slope of -1.13 ± 0.04 (estimate ±s.e.m.) which significantly differs from unity, as the confidence interval of the estimate for the slope did not include 1 at the 5 % significance level. It intersects the dotted line at 4.25 (pA2 value). E, whole-cell currents elicited by indicated concentrations of nicotine in the absence (control, ○) or presence (•) of 100 μM DHβE at a holding potential of -70 mV. Data points are averaged peak currents of measurements in triplicate in a typical cell. In order to match observations on transmitter release, DHβE was applied only in combination with nicotine without the otherwise practised 10 s pre-exposure of cells to antagonists (see Methods). Curves based on eqn (1) were simultaneously fitted to data points using the ALLFIT routine with the constraints of a shared slope and a shared maximum. The curve shift (dose ratio) caused by DHβE was 4.74. F, Schild plot of data obtained by patch clamp recordings from 17 different cells (including the one shown in A). Dose ratios were calculated from curve shifts in the presence of a given concentration of the antagonist by fitting data points to eqn (1) as shown in A. Different symbols indicate recordings from 4 different days. Curve shifts at the low-concentration end of the nicotine dose-response curve were used if more than one (up to 3) concentration of DHβE was tested in one cell. The line fitted to the data points has a slope of -1.01 ± 0.1 (estimate ±s.e.m.), which does not significantly differ from unity, as the confidence interval of the estimate for the slope included 1 at the 5 % significance level. It intersects the dotted line at 4.58 (pA2 value).
We argued above that due to differences in the rank order of agonists somatic nAChRs differ from release-mediating prejunctional receptors. It was therefore of interest to compare the effects of DHβE on nicotine-induced currents with its effects on nicotine-induced transmitter release. In line with the known action of DHβE as a competitive antagonist (Harvey et al. 1996), the substance caused a rightward shift without noticeable depression of the dose-response curve of nicotine-induced currents (Fig. 7E). The pA2 value of 4.58 calculated from the Schild plot of these experiments (Fig. 7F) is somewhat higher than the values obtained for TTX-sensitive (4.03, Fig. 7B) and TTX-insensitive (4.25, Fig. 7D) transmitter release. However, considering much larger differences when testing DHβE on recombinant nAChRs in heterologous expression systems (Harvey et al. 1996), this difference appears too small to make a distinction between somatic and prejunctional receptors by the use of this antagonist.
DISCUSSION
Somatic and prejunctional nAChRs in rat SCG neurones
Nicotinic ACh receptor activation in cultured rat superior cervical ganglion cells revealed two constituents of Ca2+-dependent transmitter release: one component which relies on both voltage-gated Na+ channels (indicated by TTX sensitivity) and VACCs (indicated by Cd2+ sensitivity), probably reflecting the traditional efferent visceromotor signal transduction through the ganglion; and a second component that persists in the presence of TTX and Cd2+. Ca2+ influx obligatory for transmitter release could in the latter case occur by nAChRs if they were located in proximity to the presynaptic stores. nAChRs meet both requirements for such a mechanism: they are highly permeant for Ca2+ (Trouslard et al. 1993; McGehee & Role, 1995b; Rathouz et al. 1996), and they have been demonstrated to be present at presynaptic sites in both the CNS and the PNS (Wonnacott, 1997). Both components of transmitter release - Cd2+ sensitive as well as Cd2+ insensitive - were blocked by low concentrations of the nicotinic antagonist mecamylamine, indicating receptor-specific events.
In the rat and chick sympathetic nervous system, Ca2+-dependent transmitter release takes place primarily at preterminal varicosities. Hence, despite observations that exocytosis does occur in the somatodendritic region of SCG cells (Zaidi & Matthews, 1997), cultured rat SCG cells accumulate and release radiolabelled NA almost entirely by axonal sprouts (Vogel et al. 1972). Likewise, uptake and release of [3H]-NA in explant cultures from chick paravertebral sympathetic neurones appears confined to neurites (Przywara et al. 1993). These reports are in line with our own experiments indicating that in explant cultures, 93.3 ± 0.8 % of [3H]-NA is accumulated into the mesh of neuronal processes, but only 6.7 ± 0.8 % (n = 14 cultures) into the portion that contains the cell bodies (data not shown). Recent observations using amperometric detection of endogenous catecholamines in dissociated rat SCG cultures also provide direct evidence for varicosities and terminals as the primary site of transmitter release (Koh & Hille, 1997).
If TTX-insensitive transmitter release is triggered by nAChRs adjacent to transmitter stores, this component should reflect properties of nAChRs located at prejunctional varicosities and nerve endings of SCG neurones. We have demonstrated here that prejunctional receptors (as seen by TTX-insensitive transmitter release) were activated by agonists following a rank order of potency of DMPP > nicotine > cytisine > ACh. This rank order differed significantly from patch clamp recordings (at non-saturating concentrations of agonist), where currents were elicited most potently by cytisine, followed by DMPP ≡ nicotine, and ACh. Our patch clamp data are in line with a previous report by Covernton et al. (1994), who recorded currents at low concentrations of agonists in whole superior cervical ganglia from adult rats. Minor differences from this study (e.g. a slightly higher potency ratio of cytisine to DMPP) may reflect differences in the age of the animals (early postnatal versus adult) or differences in the preparation (cell cultures versus intact ganglia). Our results also agree with observations by Mandelzys et al. (1995), who in cell cultures from newborn rat SCG found cytisine to be more potent than DMPP. Hence, somatic nAChRs as reflected by patch clamp recordings were most potently activated by cytisine, whereas prejunctional nAChRs were most sensitive to DMPP. From this difference we conclude that nAChRs differ at the two sites.
It should be noted that our techniques do not allow for the discrimination of individual receptors, or in case of transmitter release, not even for the response of individual cells. Hence, we are dealing with populations of receptors when recording whole-cell currents, or with populations of cells in our release experiments. In addition to ‘cytisine-sensitive receptors’, a lesser number of ‘DMPP-sensitive nAChRs’ might therefore be located at somatic sites (e.g. concentrated at the axon-initial segment where they might effectively trigger action potentials), just as low numbers of ‘cytisine-sensitive receptors’ might occur prejunctionally. Furthermore, our conclusion that nAChRs differ at the two sites would be invalid if a non-representative population of neurones that do not significantly contribute to TTX-insensitive transmitter release had been selected incidentally for patch clamp recordings. Though our experiments to determine low-potency ratios included only 17 cells we consider this unlikely, since SCG neurones more sensitive to cytisine than to DMPP have been consistently found in similarly designed studies (Covernton et al. 1994; Mandelzys et al. 1995).
Somewhat surprisingly, the rank order of potency for TTX-sensitive transmitter release more closely paralleled TTX-insensitive release than that deduced from patch clamp recordings. Hence, not cytisine, but DMPP was the most potent substance for eliciting TTX-sensitive release. This result implies that in our cell culture system, prejunctional - and not somatic-type - nAChRs generate the component of transmitter release that is action potential mediated. From previous in vivo and ex vivo experiments we know that in adrenergic nerve endings nAChRs are functionally linked to voltage-gated Na+ channels, since nicotinic agonists can elicit antidromic volleys upon infusion into sympathetically innervated tissues (Krauss et al. 1970). However, nicotinic agonists added to a culture were expected to activate primarily nAChRs at somatic sites and thus trigger orthodromic action potentials with ensuing transmitter release. We may speculate that upon simultaneous exposure of both somatic and prejunctional receptors to nicotinic agonists, prejunctional receptors may be more sensitive to DMPP than somatic receptors to cytisine. Likewise, DMPP-sensitive receptors located at strategic sites such as the axon-initial segment (where they might not become visible with whole-cell patch clamp recordings) could effectively trigger action potentials. Enriched immunoreactivity of the GABAA receptor α2 subunit at the axon-initial segment has recently been shown in hippocampal and cortical pyramidal cells (Loup et al. 1998).
In comparison with TTX-sensitive transmitter release, significantly higher agonist concentrations were required to elicit the TTX-insensitive component. This difference may arise from distinct receptor populations that trigger TTX-sensitive and TTX-insensitive transmitter release. Alternatively, it might be explained by the two different pathways of signal transduction. For TTX-sensitive release, lower agonist concentrations are probably required to depolarize neurones (primarily by Na+ influx through the receptor) to the threshold for the generation of action potentials. TTX-insensitive release might, on the other hand, demand high agonist concentrations to allow Ca2+ influx directly through prejunctional nAChRs (Role & Berg, 1996; Wonnacott, 1997) sufficient for Ca2+-dependent exocytosis.
Effects of DHβE
The nicotinic antagonist DHβE potently blocks agonist-induced [3H]-dopamine (DA) release in the striatum (Sacaan et al. 1995; Clarke & Reuben, 1996), but has much less effect on [3H]-NA release in the hippocampus (Sacaan et al. 1995). This functional variance may be explained on the grounds of receptor subunit composition (which differs between the two structures; see Clarke & Reuben, 1996, and references cited therein), since both α and β subunits participate in determining the sensitivity to this antagonist (Harvey et al. 1996). Thus, α3β4-containing receptors expressed in Xenopus oocytes were much less sensitive than either α4β4- (factor of 120) or α3β2-containing receptors (factor of 56) (Harvey et al. 1996). We saw a rather small difference in the pA2 values for DHβE inhibition of transmitter release (4.03 and 4.25 for the TTX-sensitive and TTX-insensitive component, respectively) and nicotine-induced currents (4.58). This indicates that DHβE does not seem to be a suitable tool for distinguishing between somatic and prejunctional nAChRs in SCG neurones.
Prejunctional nicotinic receptors in the sympathetic nervous system
Transmitter release at neuroeffector junctions of the autonomic nervous system occurs at varicosities which may or may not have features of prejunctional membrane specializations. Yet, these varicosities usually lack typical postjunctional membrane specializations found at CNS synapses (Hirst et al. 1996). A wealth of data based on tools of classical pharmacology indicate that nicotinic receptors are associated with the terminal varicose part of the sympathetic nervous system (reviewed in Starke, 1977). In some of the preparations, release of [3H]-NA in response to nicotinic receptor activation could still be induced in the presence of TTX (Krauss et al. 1970), indicating that transmitter release does not depend on the generation of action potentials (Westfall & Brasted, 1972). Bioassay experiments using the rabbit ear artery have shown some concentration dependence in that contractions of the artery were potently inhibited by TTX at low concentrations of nicotine, but were reduced to a much lesser extent with high concentrations of nicotine (Furchgott et al. 1975).
nAChR activation in sympathetic terminals might occur by ACh originating from cholinergic fibres in close apposition to adrenergic varicosities (Starke, 1977), but the physiological significance of this mechanism has been disputed (Starke, 1977; Fuder & Muscholl, 1995). At prejunctional sites, effects of nicotinic receptor activation other than on transmitter release have not yet been reported. As before, we are left with the puzzle of the presence of receptors of unknown physiological meaning.
Presynaptic nicotinic ACh receptors in the CNS and PNS
The biological significance of presynaptic nicotinic receptors has recently been reviewed (Role & Berg, 1996; Wonnacott, 1997). Compared with effects in the CNS, the concentrations of nicotinic agonists required to induce release from cultured rat SCG neurones are high. Hence, typical concentrations for the activation of presynaptic or preterminal receptors in the CNS are 1 μM nicotine or less (Sacaan et al. 1995; McGehee et al. 1995a; Clarke & Reuben, 1996; Wilkie et al. 1996). Nicotine at 1 μM did not per se elicit any significant transmitter release in our cultures. In addition, we found S2/S1 ratios of electrically induced transmitter release were unaffected when 1 μM nicotine was added 8 min before and during S2 (S2/S1 under control conditions: 0.98 ± 0.02; with 1 μM nicotine added to superfusion medium 8 min before and during S2: 0.95 ± 0.06; n = 6 and 7 individual cultures, respectively; P > 0.05, Mann-Whitney test).
In keeping with our observations in rat SCG neurones, (TTX sensitive) NA release in the hippocampus slice preparation (EC50, 91.6 μM) also requires high concentrations of nicotine (Sacaan et al. 1995). In addition, these receptors display an exceptional sensitivity to DMPP (Sacaan et al. 1995; but see Clarke & Reuben, 1996; Sershen et al. 1997), which we also observed in our release experiments. By comparison, DA release from rat striatum slice is relatively insensitive to DMPP, is evoked by low concentrations of nicotine (EC50, 3.7 μM), and is unaffected by TTX (Sacaan et al. 1995). An equally large difference of potency was observed for the release of NA (EC50, 6.5 μM) and dopamine (EC50, 0.16 μM) from hippocampal and striatal synaptosomes in response to nicotine (Clarke & Reuben, 1996). [3H]-ACh release from hippocampal synaptosomes is, on the other hand, highly nicotine sensitive (EC50, 0.99 μM) (Wilkie et al. 1996).
Hence, our data bear remarkable similarities to nicotinic receptor-mediated [3H]-NA release from the rat hippocampus in that (1) agonist concentrations to induce release are relatively high, (2) DMPP is the most potent agonist, and (3) DHβE is a weak antagonist in both preparations. We are unaware of reports on other regions of either the CNS or the PNS with a rank order of potency of agonists which gets as close to our results as the nicotinic receptors that trigger [3H]-NA release from the hippocampus. [3H]-ACh release from the SCG itself is, for example, most potently induced by nicotine, followed by DMPP and cytisine (Liang & Vizi, 1997). NA release from the guinea-pig vas deferens appears equally sensitive to DMPP and nicotine, with no intrinsinc activity of cytisine (Todorov et al. 1991). Not one cell out of the 11 intracardiac parasympathetic neurones with divergent patterns of agonist potencies and subunit compositions (Poth et al. 1997), and none of the 17 SCG cells included in our patch clamp experiments to establish low-concentration potency ratios (individual rank orders not shown, see Fig. 5 for an example and Table 2 for a summary) matches the rank order of potency observed in our release experiments. Recently, α-conotoxin AuIB from Conus aulicus which selectively blocks α3β4 nAChRs expressed in Xenopus oocytes was shown to inhibit nicotine-induced [3H]-NA release from the hippocampus, but not [3H]-DA release from rat striatal synaptosomes (Luo et al. 1998). It will be interesting to test α-conotoxin AuIB, and also the α3β2-specific α-conotoxin MII (Cartier et al. 1996) in our preparation.
Subunit composition of nAChRs in the rat SCG
Traditionally, the subunit composition of native receptors is deduced by comparison with receptors expressed in heterologous systems (McGehee & Role, 1995b). Considering first TTX-insensitive release as a paradigm of prejunctional nAChRs, our results resemble rat α3β4 expressed in HEK 293 cells (Wong et al. 1995) that are activated by a rank order of potency of DMPP > cytisine ≡ nicotine > ACh. Likewise, human α3β4 expressed in Xenopus oocytes shows a rank order that matches our observations on TTX-insensitive transmitter release (Chavez-Noriega et al. 1997). However, mounting evidence suggests that only pairwise combinations of subunits may not adequately reflect native nAChRs (Vernallis et al. 1993; Conroy & Berg, 1995; Wang et al. 1996; Ramirez-Latorre et al. 1996) and that properties of recombinant receptors are affected by the choice of the heterologous expression system (Lewis et al. 1997). In the light of these findings, a poor match of the functional properties of heterologously expressed nAChRs and our own observations for either transmitter release or currents in response to nicotinic agonists may not be unexpected (Covernton et al. 1994; Chavez-Noriega et al. 1997; Lewis et al. 1997; Stauderman et al. 1998).
In conclusion, our results indicate that nAChRs with distinct pharmacological properties exist at somatic and prejunctional domains in rat SCG neurones. The subunit composition of these receptors is not known, but further experiments based on morphological techniques with subunit-specific antibodies (Ullian & Sargent, 1995), or release experiments on SCG neurones that lack individual nAChR subunits (McGehee & Role, 1995b; Zoli et al. 1998) will help to identify the α and β subunits that assemble into prejunctional receptors.
Acknowledgments
We thank David A. Brown, Michael Freissmuth and Lorna W. Role for valuable comments on the manuscript. Expert technical assistance was provided by Gabriele Koth, Andrea Motejlek and Karin Schwarz. Supported by the Austrian Science Foundation, Project P-11607MED to S. H.
References
- Arunlakshana O, Schild HO. Some quantitative uses of drug antagonists. British Journal of Pharmacology. 1959;14:48–58. doi: 10.1111/j.1476-5381.1959.tb00928.x. [DOI] [PMC free article] [PubMed] [Google Scholar]
- Ascher P, Large WA, Rang HP. Studies on the mechanism of action of acetylcholine antagonists on rat parasympathetic ganglion cells. The Journal of Physiology. 1979;295:139–170. doi: 10.1113/jphysiol.1979.sp012958. [DOI] [PMC free article] [PubMed] [Google Scholar]
- Bernheim L, Mathie A, Hille B. Characterization of muscarinic receptor subtypes inhibiting Ca2+ current and M current in rat sympathetic neurons. Proceedings of the National Academy of Sciences of the USA. 1992;89:9544–9548. doi: 10.1073/pnas.89.20.9544. [DOI] [PMC free article] [PubMed] [Google Scholar]
- Boehm S, Huck S. α2-Adrenoreceptor-mediated inhibition of acetylcholine-induced noradrenaline release from rat sympathetic neurons: an action at voltage-gated Ca2+ channels. Neuroscience. 1995;69:221–231. doi: 10.1016/0306-4522(95)00235-b. [DOI] [PubMed] [Google Scholar]
- Boehm S, Huck S. Receptors controlling transmitter release from sympathetic neurons in vitro. Progress in Neurobiology. 1997;51:225–242. doi: 10.1016/s0301-0082(96)00056-1. [DOI] [PubMed] [Google Scholar]
- Cartier GE, Yoshikami D, Gray WR, Luo S, Olivera BM, McIntosh JM. A new α-conotoxin which targets α3β2 nicotinic acetylcholine receptors. Journal of Biological Chemistry. 1996;271:7522–7528. doi: 10.1074/jbc.271.13.7522. 10.1074/jbc.271.13.7522. [DOI] [PubMed] [Google Scholar]
- Chavez-Noriega LE, Crona JH, Washburn MS, Urrutia A, Elliott KJ, Johnson EC. Pharmacological characterization of recombinant human neuronal nicotinic acetylcholine receptors hα2β2, hα2β4, hα3β2, hα3-β4, hα4β2, hα4β4, and hα7 expressed in Xenopus oocytes. Journal of Pharmacology and Experimental Therapeutics. 1997;280:346–356. [PubMed] [Google Scholar]
- Clarke PBS, Reuben M. Release of [3H]-noradrenaline from rat hippocampal synaptosomes by nicotine: mediation by different nicotinic receptor subtypes from striatal [3H]-dopamine release. British Journal of Pharmacology. 1996;117:595–606. doi: 10.1111/j.1476-5381.1996.tb15232.x. [DOI] [PMC free article] [PubMed] [Google Scholar]
- Conroy WG, Berg DK. Neurons can maintain multiple classes of nicotinic acetylcholine receptors distinguished by different subunit compositions. Journal of Biological Chemistry. 1995;270:4424–4431. doi: 10.1074/jbc.270.9.4424. [DOI] [PubMed] [Google Scholar]
- Covernton PJO, Kojima H, Sivilotti LG, Gibb AJ, Colquhoun D. Comparison of neuronal nicotinic receptors in rat sympathetic neurones with subunit pairs expressed in Xenopus oocytes. The Journal of Physiology. 1994;481:27–34. doi: 10.1113/jphysiol.1994.sp020416. [DOI] [PMC free article] [PubMed] [Google Scholar]
- DeKoninck P, Cooper E. Differential regulation of neuronal nicotinic ACh receptor subunit genes in cultured neonatal rat sympathetic neurons: Specific induction of α7 by membrane depolarization through a Ca2+/calmodulin-dependent kinase pathway. Journal of Neuroscience. 1995;15:7966–7978. doi: 10.1523/JNEUROSCI.15-12-07966.1995. [DOI] [PMC free article] [PubMed] [Google Scholar]
- DeLean A, Munson PJ, Rodbard D. Simultaneous analysis of families of sigmoidal curves: application to bioassay, radioligand assay, and physiological dose-response curves. American Journal of Physiology. 1978;235:E97–102. doi: 10.1152/ajpendo.1978.235.2.E97. [DOI] [PubMed] [Google Scholar]
- Dolezal V, Schobert A, Hertting G. Differences of the electrical and nicotinic receptor stimulation-evoked liberation of norepinephrine from chicken sympathetic neurons in culture: possible involvement of different pools of the transmitter. Neurochemical Research. 1995;20:261–267. doi: 10.1007/BF00969541. [DOI] [PubMed] [Google Scholar]
- Fuder H, Muscholl E. Heteroreceptor-mediated modulation of noradrenaline and acetylcholine release from peripheral nerves. Reviews of Physiology, Biochemistry and Pharmacology. 1995;126:265–412. doi: 10.1007/BFb0049778. [DOI] [PubMed] [Google Scholar]
- Furchgott RF, Steinsland OS, Wakade TD. Studies on prejunctional muscarinic and nicotinic receptors. In: Almgren O, Carlsson A, Engel J, editors. Chemical Tools in Catecholamine Research. North Holland Publishing Company; 1975. pp. 167–174. [Google Scholar]
- Gurney AM, Rang HP. The channel-blocking actions of methonium compounds on rat submandibular ganglion cells. British Journal of Pharmacology. 1984;82:623–642. doi: 10.1111/j.1476-5381.1984.tb10801.x. [DOI] [PMC free article] [PubMed] [Google Scholar]
- Harvey SC, Maddox FN, Luetje CW. Multiple determinants of dihydro-β-erythroidine sensitivity on rat neuronal nicotinic receptor α subunits. Journal of Neurochemistry. 1996;67:1953–1959. doi: 10.1046/j.1471-4159.1996.67051953.x. [DOI] [PubMed] [Google Scholar]
- Hirning LD, Fox AP, McCleskey EW, Olivera BM, Thayer SA, Miller RJ, Tsien RW. Dominant role of N-type Ca2+ channels in evoked release of norepinephrine from sympathetic neurons. Science. 1988;239:57–61. doi: 10.1126/science.2447647. [DOI] [PubMed] [Google Scholar]
- Hirst GDS, Choate JK, Cousins HM, Edwards FR, Klemm MF. Transmission by post-ganglionic axons of the autonomic nervous system: the importance of the specialized neuroeffector junction. Neuroscience. 1996;73:7–23. doi: 10.1016/0306-4522(96)00031-0. 10.1016/0306-4522(96)00031-0. [DOI] [PubMed] [Google Scholar]
- Klimaschewski L, Reuss S, Spessert R, Lobron C, Wevers A, Heym C, Maelicke A, Schröder H. Expression of nicotinic acetylcholine receptors in the rat superior cervical ganglion on mRNA and protein level. Molecular Brain Research. 1994;27:167–173. doi: 10.1016/0169-328x(94)90199-6. 10.1016/0169-328X(94)90199-6. [DOI] [PubMed] [Google Scholar]
- Koh D-S, Hille B. Modulation by neurotransmitters of catecholamine secretion from sympathetic ganglion neurons detected by amperometry. Proceedings of the National Academy of Sciences of the USA. 1997;94:1506–1511. doi: 10.1073/pnas.94.4.1506. 10.1073/pnas.94.4.1506. [DOI] [PMC free article] [PubMed] [Google Scholar]
- Krauss KR, Carpenter DO, Kopin IJ. Acetylcholine-induced release of norepinephrine in the presence of tetrodotoxin. Journal of Pharmacology and Experimental Therapeutics. 1970;173:416–421. [PubMed] [Google Scholar]
- Lein P, Johnson M, Guo X, Rueger D, Higgins D. Osteogenic protein-1 induces dendritic growth in rat sympathetic neurons. Neuron. 1995;15:597–605. doi: 10.1016/0896-6273(95)90148-5. 10.1016/0896-6273(95)90148-5. [DOI] [PubMed] [Google Scholar]
- Lewis TM, Harkness PC, Sivilotti LG, Colquhoun D, Millar NS. The ion channel properties of rat recombinant neuronal nicotinic receptor are dependent on the host cell type. The Journal of Physiology. 1997;505:299–306. doi: 10.1111/j.1469-7793.1997.299bb.x. [DOI] [PMC free article] [PubMed] [Google Scholar]
- Liang SD, Vizi ES. Positive feedback modulation of acetylcholine release from isolated rat superior cervical ganglion. Journal of Pharmacology and Experimental Therapeutics. 1997;280:650–655. [PubMed] [Google Scholar]
- Lindstrom J, Anand R, Gerzanich V, Peng X, Wang F, Wells GB. Structure and function of neuronal nicotinic acetylcholine receptors. Progress in Brain Reseach. 1996;109:125–137. doi: 10.1016/s0079-6123(08)62094-4. [DOI] [PubMed] [Google Scholar]
- Loring RH, Sah DWY, Landis SC, Zigmond RE. The ultrastructural distribution of putative nicotinic receptors on cultured neurons from the rat superior cervical ganglion. Neuroscience. 1988;24:1071–1080. doi: 10.1016/0306-4522(88)90088-7. 10.1016/0306-4522(88)90088-7. [DOI] [PubMed] [Google Scholar]
- Loup F, Weinmann O, Yonekawa Y, Aguzzi A, Wieser H-G, Fritschy J-M. A highly sensitive immunofluorescence procedure for analyzing the subcellular distribution of GABAA receptor subunits in the human brain. Journal of Histochemistry and Cytochemistry. 1998;46:1129–1139. doi: 10.1177/002215549804601005. [DOI] [PubMed] [Google Scholar]
- Luo S, Kulak JM, Cartier GE, Jacobsen RB, Yoshikami D, Olivera BM, McIntosh JM. α-Conotoxin AuIB selectively blocks α3β4 nicotinic acetylcholine receptors and nicotine-evoked norepinephrine release. Journal of Neuroscience. 1998;18:8571–8579. doi: 10.1523/JNEUROSCI.18-21-08571.1998. [DOI] [PMC free article] [PubMed] [Google Scholar]
- McGehee DS, Heath MJS, Gelber S, Devay P, Role LW. Nicotine enhancement of fast excitatory synaptic transmission in CNS by presynaptic receptors. Science. 1995a;269:1692–1696. doi: 10.1126/science.7569895. [DOI] [PubMed] [Google Scholar]
- McGehee DS, Role LW. Physiological diversity of nicotinic acetylcholine receptors expressed by vertebrate neurons. Annual Review of Physiology. 1995b;57:521–546. doi: 10.1146/annurev.ph.57.030195.002513. 10.1146/annurev.ph.57.030195.002513. [DOI] [PubMed] [Google Scholar]
- Mandelzys A, DeKoninck P, Cooper E. Agonist and toxin sensitivities of ACh-evoked currents on neurons expressing multiple nicotinic receptor subunits. Journal of Neurophysiology. 1995;74:1212–1221. doi: 10.1152/jn.1995.74.3.1212. [DOI] [PubMed] [Google Scholar]
- Mandelzys A, Pie B, Deneris ES, Cooper E. The developmental increase in ACh current densities on rat sympathetic neurons correlates with changes in nicotinic ACh receptor subunit gene expression and occurs independent of innervation. Journal of Neuroscience. 1994;14:2357–2364. doi: 10.1523/JNEUROSCI.14-04-02357.1994. [DOI] [PMC free article] [PubMed] [Google Scholar]
- Mathie A, Cull-Candy SG, Colquhoun D. Conductance and kinetic properties of single nicotinic acetylcholine receptor channels in rat sympathetic neurones. The Journal of Physiology. 1991;439:717–750. doi: 10.1113/jphysiol.1991.sp018690. [DOI] [PMC free article] [PubMed] [Google Scholar]
- Poth K, Nutter TJ, Cuevas J, Parker MJ, Adams DJ, Luetje CW. Heterogeneity of nicotinic receptor class and subunit mRNA expression among individual parasympathetic neurons from rat intracardiac ganglia. Journal of Neuroscience. 1997;17:586–596. doi: 10.1523/JNEUROSCI.17-02-00586.1997. [DOI] [PMC free article] [PubMed] [Google Scholar]
- Przywara DA, Bhave SV, Chowdhury PS, Wakade TD, Wakade AR. Sites of transmitter release and relation to intracellular Ca2+ in cultured sympathetic neurons. Neuroscience. 1993;52:973–986. doi: 10.1016/0306-4522(93)90544-p. 10.1016/0306-4522(93)90544-P. [DOI] [PubMed] [Google Scholar]
- Rae J, Cooper K, Gates P, Watsky M. Low access resistance perforated patch recordings using amphotericin B. Journal of Neuroscience Methods. 1991;37:15–26. doi: 10.1016/0165-0270(91)90017-t. 10.1016/0165-0270(91)90017-T. [DOI] [PubMed] [Google Scholar]
- Ramirez-Latorre J, Yu CR, Qu X, Perin F, Karlin A, Role LW. Functional contributions of α5 subunit to neuronal acetylcholine receptor channels. Nature. 1996;380:347–351. doi: 10.1038/380347a0. 10.1038/380347a0. [DOI] [PubMed] [Google Scholar]
- Rathouz MM, Vijayaraghavan S, Berg DK. Elevation of intracellular calcium levels in neurons by nicotinic acetylcholine receptors. Molecular Neurobiology. 1996;12:117–131. doi: 10.1007/BF02740649. [DOI] [PubMed] [Google Scholar]
- Role LW, Berg DK. Nicotinic receptors in the development and modulation of CNS synapses. Neuron. 1996;16:1077–1085. doi: 10.1016/s0896-6273(00)80134-8. 10.1016/S0896-6273(00)80134-8. [DOI] [PubMed] [Google Scholar]
- Rust G, Burgunder J-M, Lauterburg TE, Cachelin AB. Expression of neuronal nicotinic acetylcholine receptor subunit genes in the rat autonomic nervous system. European Journal of Neuroscience. 1994;6:478–485. doi: 10.1111/j.1460-9568.1994.tb00290.x. [DOI] [PubMed] [Google Scholar]
- Sacaan AI, Dunlop JL, Lloyd GK. Pharmacological characterization of neuronal acetylcholine gated ion channel receptor-mediated hippocampal norepinephrine and striatal dopamine release from rat brain slices. Journal of Pharmacology and Experimental Therapeutics. 1995;274:224–230. [PubMed] [Google Scholar]
- Sargent PB. The diversity of neuronal nicotinic acetylcholine receptors. Annual Review of Neuroscience. 1993;16:403–443. doi: 10.1146/annurev.ne.16.030193.002155. 10.1146/annurev.ne.16.030193.002155. [DOI] [PubMed] [Google Scholar]
- Schwartz DD, Malik KU. Cyclic AMP modulates but does not mediate the inhibition of [3H]norepinephrine release by activation of alpha-2 adrenergic receptors in cultured rat ganglion cells. Neuroscience. 1993;52:107–113. doi: 10.1016/0306-4522(93)90186-j. 10.1016/0306-4522(93)90186-J. [DOI] [PubMed] [Google Scholar]
- Sershen H, Balla A, Lajtha A, Vizi ES. Characterization of nicotinic receptors involved in the release of noradrenaline from the hippocampus. Neuroscience. 1997;77:121–130. doi: 10.1016/s0306-4522(96)00425-3. 10.1016/S0306-4522(96)00425-3. [DOI] [PubMed] [Google Scholar]
- Starke K. Regulation of noradrenaline release by presynaptic receptor systems. Reviews of Physiology, Biochemistry and Pharmacology. 1977;77:1–124. doi: 10.1007/BFb0050157. [DOI] [PubMed] [Google Scholar]
- Stauderman KA, Mahaffy LS, Akong M, Velicelebi G, Chavez-Noriega LE, Crona JH, Johnson EC, Elliott KJ, Gillespie A, Reid RT, Adams P, Harpold MM, Corey-Naeve J. Characterization of human recombinant neuronal nicotinic acetylcholine receptor subunit combinations α2β3, α3β4, and α4β4 stably expressed in HEK293 cells. Journal of Pharmacology and Experimental Therapeutics. 1998;284:777–789. [PubMed] [Google Scholar]
- Todorov L, Windisch K, Shersen H, Lajtha A, Papasova M, Vizi ES. Prejunctional nicotinic receptors involved in facilitation of stimulation-evoked noradrenaline release from the vas deferens of the guinea-pig. British Journal of Pharmacology. 1991;102:186–190. doi: 10.1111/j.1476-5381.1991.tb12151.x. [DOI] [PMC free article] [PubMed] [Google Scholar]
- Trouslard J, Marsh SJ, Brown DA. Calcium entry through nicotinic receptor channels and calcium channels in cultured rat superior cervical ganglion cells. The Journal of Physiology. 1993;468:53–71. doi: 10.1113/jphysiol.1993.sp019759. [DOI] [PMC free article] [PubMed] [Google Scholar]
- Ullian EM, Sargent PB. Pronounced cellular diversity and extrasynaptic localization of nicotinic acetylcholine receptor subunit immunoreactivities in the chicken pretectum. Journal of Neuroscience. 1995;15:7012–7023. doi: 10.1523/JNEUROSCI.15-11-07012.1995. [DOI] [PMC free article] [PubMed] [Google Scholar]
- Vernallis AB, Conroy WG, Berg DK. Neurons assemble acetylcholine receptors with as many as three kinds of subunits while maintaining subunit segregation among receptor subtypes. Neuron. 1993;10:451–464. doi: 10.1016/0896-6273(93)90333-m. [DOI] [PubMed] [Google Scholar]
- Vijayaraghavan S, Pugh PC, Zhang Z, Rathouz MM, Berg DK. Nicotinic receptors that bind α-bungarotoxin on neurons raise intracellular free Ca2+ Neuron. 1992;8:353–362. doi: 10.1016/0896-6273(92)90301-s. [DOI] [PubMed] [Google Scholar]
- Vogel SS, Silberstein SD, Berv KR, Kopin IJ. Stimulation-induced release of norepinephrine from rat superior cervical ganglia in vitro. European Journal of Pharmacology. 1972;20:308–311. doi: 10.1016/0014-2999(72)90191-4. 10.1016/0014-2999(72)90191-4. [DOI] [PubMed] [Google Scholar]
- Wang F, Gerzanich V, Wells GB, Anand R, Peng X, Keyser K, Lindstrom J. Assembly of human neuronal nicotinic receptor α5 subunits with α3, β2, and β4 subunits. Journal of Biological Chemistry. 1996;271:17656–17665. doi: 10.1074/jbc.271.30.17656. 10.1074/jbc.271.30.17656. [DOI] [PubMed] [Google Scholar]
- Westfall TC, Brasted M. The mechanism of action of nicotine on adrenergic neurons in the perfused guinea-pig heart. Journal of Pharmacology and Experimental Therapeutics. 1972;182:409–418. [PubMed] [Google Scholar]
- Wilkie GI, Hutson P, Sullivan JP, Wonnacott S. Pharmacological characterization of a nicotinic autoreceptor in rat hippocampal synaptosomes. Neurochemical Research. 1996;21:1141–1148. doi: 10.1007/BF02532425. [DOI] [PubMed] [Google Scholar]
- Wong ET, Holstad SG, Mennerick SJ, Hong SE, Zorumski CF, Isenberg KE. Pharmacological and physiological properties of a putative ganglionic nicotinic receptor, α3β4, expressed in transfected eucaryotic cells. Molecular Brain Research. 1995;28:101–109. doi: 10.1016/0169-328x(94)00189-l. 10.1016/0169-328X(94)00189-L. [DOI] [PubMed] [Google Scholar]
- Wonnacott S. Presynaptic nicotinic ACh receptors. Trends in Neurosciences. 1997;20:92–98. doi: 10.1016/s0166-2236(96)10073-4. 10.1016/S0166-2236(96)10073-4. [DOI] [PubMed] [Google Scholar]
- Zaidi ZF, Matthews MR. Exocytotic release from neuronal cell bodies, dendrites and nerve terminals in sympathetic ganglia of the rat, and its differential regulation. Neuroscience. 1997;80:861–891. doi: 10.1016/s0306-4522(96)00664-1. 10.1016/S0306-4522(96)00664-1. [DOI] [PubMed] [Google Scholar]
- Zoli M, Lena C, Piciotto MR, Changeux J-P. Identification of four classes of brain nicotinic receptors using β2 mutant mice. Journal of Neuroscience. 1998;18:4461–4472. doi: 10.1523/JNEUROSCI.18-12-04461.1998. [DOI] [PMC free article] [PubMed] [Google Scholar]