

Abstract
Soleus biopsies were obtained from four male astronauts 45 days before and within 2 h after a 17 day spaceflight.
For all astronauts, single chemically skinned post-flight fibres expressing only type I myosin heavy chain (MHC) developed less average peak Ca2+ activated force (Po) during fixed-end contractions (0.78 ± 0.02 vs. 0.99 ± 0.03 mN) and shortened at a greater mean velocity during unloaded contractions (Vo) (0.83 ± 0.02 vs. 0.64 ± 0.02 fibre lengths s−1) than pre-flight type I fibres.
The flight-induced decline in absolute Po was attributed to reductions in fibre diameter and/or Po per fibre cross-sectional area. Fibres from the astronaut who experienced the greatest relative loss of peak force also displayed a reduction in Ca2+ sensitivity.
The elevated Vo of the post-flight slow type I fibres could not be explained by alterations in myosin heavy or light chain composition. One alternative possibility is that the elevated Vo resulted from an increased myofilament lattice spacing. This hypothesis was supported by electron micrographic analysis demonstrating a reduction in thin filament density post-flight.
Post-flight fibres shortened at 30 % higher velocities than pre-flight fibres at external loads associated with peak power output. This increase in shortening velocity either reduced (2 astronauts) or prevented (2 astronauts) a post-flight loss in fibre absolute peak power (μN (fibre length) s−1).
The changes in soleus fibre diameter and function following spaceflight were similar to those observed after 17 days of bed rest. Although in-flight exercise countermeasures probably reduced the effects of microgravity, the results support the idea that ground-based bed rest can serve as a model of human spaceflight.
In conclusion, 17 days of spaceflight decreased force and increased shortening velocity of single Ca2+-activated muscle cells expressing type I MHC. The increase in shortening velocity greatly reduced the impact that impaired force production had on absolute peak power.
Humans experience muscle atrophy, weakness and fatigue following as little as 7 days of spaceflight (Grigoryeva & Kozlovskaya, 1987; Convertino, 1990; Edgerton et al. 1995). The countermeasures employed during spaceflights have not been completely successful in preventing reductions in muscle mass and alterations in neuromuscular performance (Grigoryeva & Kozlovskaya, 1987; Edgerton et al. 1995). In a variety of animal models, changes in muscle recruitment patterns (Roy et al. 1996), muscle fibre type composition (Caiozzo et al. 1996), cellular processes of excitation- contraction coupling (Stevens & Mounier, 1992) and cross-bridge mechanisms of contraction (Reiser et al. 1987; Gardetto et al. 1989; McDonald & Fitts, 1993; Widrick et al. 1996) occur in the absence of weight-bearing activity. A better understanding of how humans respond to spaceflight is a requirement for the development of more effective countermeasures. This knowledge will most probably be attained by utilizing experimental approaches capable of isolating specific aspects of the human neuromuscular system for study.
One model that meets this requirement is the chemically skinned muscle fibre preparation. This single cell preparation eliminates the potential confounding effects of motor unit recruitment patterns, muscle architecture and muscle tissue heterogeneity on measurements of contractile function. Since skinned fibres are activated by known concentrations of free Ca2+, the functional properties of the myofilaments can be assessed independently of membrane and t-tubular action potential propagation and sarcoplasmic reticulum Ca2+ release. When combined with gel electrophoresis, this preparation makes it possible to relate the mechanical properties of the cell to contractile protein isoform expression.
The primary goal of the present work was to use single chemically skinned muscle fibre segments to determine whether cross-bridge mechanisms of human muscle contraction were affected by 17 days of spaceflight. Since we had previously used identical methodology to investigate the effects of a 17 day period of bed rest on human soleus muscle fibre function (Widrick et al. 1997a, 1998), our secondary goal was to test the validity of ground-based bed rest as a model of human spaceflight. Preliminary reports of this data have been presented in abstract form (Fitts et al. 1997; Widrick et al. 1997b).
METHODS
Flight and subjects
The subjects in this study were four male astronauts aboard the National Aeronautics and Space Administration (NASA) Life and Microgravity Spacelab (LMS) Space Shuttle mission (STS-78). Prior to the flight, their average age, height, body mass and maximal oxygen consumption were 42.8 ± 3.8 years, 182.9 ± 7.5 cm, 85.7 ± 6.2 kg and 3.59 ± 0.26 l min−1, respectively. The duration of the spaceflight was 17 days (June 20 to July 7, 1996).
Each subject provided written informed consent prior to participation. The study was reviewed and approved by the appropriate committees at each institution.
Muscle biopsies
Forty-five days prior to launch, a pre-flight muscle sample was obtained from the left soleus using the percutaneous needle biopsy technique. The sample was obtained 45 days pre-flight to insure that the biopsy site was fully healed before flight such that there would be no chance of any complication that could prevent a crew member from flying. This time also allowed for the maximal number of pre-flight single skinned fibres to be studied. To prevent muscle adaptations between the pre-flight biopsy and flight day zero, the crew maintained a constant daily activity pattern for the 3 months prior to flight. A post-flight biopsy from the right soleus was obtained within the first 3 h after the Shuttle landed. To minimize activity, the subjects were confined to a wheelchair between the Shuttle landing and the muscle biopsy procedure.
Each muscle sample was placed on saline-soaked gauze and divided longitudinally into several portions. One portion was placed in a small vial containing cold (4°C) skinning solution (for composition, see below). These samples were packed on ice and shipped overnight to Marquette University where they were immediately placed in fresh skinning solution and stored at -20°C. All contractile measurements were conducted during the next 28 days.
A second portion of each muscle sample was pinned at a mild stretch and immersion fixed in a 0.1 M cacodylate buffer (pH 7.2) containing 4 % glutaraldehyde and 2 % paraformaldehyde with 5 mM calcium chloride. This sample was shipped overnight at 4°C to the Medical College of Wisconsin for osmium post fixation and embedding for electron microscopy as previously described (Riley et al. 1998).
Physiological testing and in-flight activities
Subjects underwent standardized physiological testing before (90, 60, 30 and 15 days before launch), during (day 2 or 3, day 8 or 9, and day 12 or 13) and after the flight (post-flight days 2 and 8). Each testing session consisted of determinations of isometric and isokinetic torque of the right ankle extensors using a specially designed torque-velocity device and incremental supine cycle ergometry performed at work rates up to 85 % of pre-flight VO2,max. These sessions were identical to those of an earlier ground-based 17 day bed rest microgravity simulation study that have been described in detail previously (Widrick et al. 1997a).
Solutions
The skinning, relaxing and activating solutions were identical in composition to those used in our previous bed rest studies (Widrick et al. 1997a, 1998). The skinning solution contained: 125 mM potassium propionate, 20 mM imidazole (pH 7.0), 2 mM EGTA, 4 mM ATP, 1 mM MgCl2 and 50 % glycerol (v/v).
The composition of the relaxing and activating solutions were determined using an iterative computer program (Fabiato & Fibiato, 1979). Stability constants were adjusted for temperature, pH and ionic strength (Godt & Lindley, 1982). Each solution contained (mM): 7 EGTA, 20 imidazole, 14.5 creatine phosphate, 1 free Mg2+ and 4 free MgATP. Ionic strength and pH were adjusted to 180 mM and 7.0, respectively, by addition of KCl and KOH. The free Ca2+ concentration of the relaxing and activating solutions were pCa 9 and pCa4.5, respectively, where pCa = -log free [Ca2+]. Activating solutions containing free Ca2+ concentrations ranging from pCa 6.8 to pCa 4.7 were made by mixing appropriate volumes of the pCa 9.0 and pCa 4.5 solutions.
Fibre preparation
On the day of an experiment, fibre bundles were transferred from skinning to cold (4°C) relaxing solution. A single fibre segment was isolated and transferred to a small glass-bottomed chamber (∼1 ml) that was milled into a stainless-steel plate. While submerged under relaxing solution, the fibre ends were securely fastened to a force transducer (Cambridge Model 400; Cambridge Technology, Inc., Watertown, MA, USA) and a servo-motor (Cambridge Model 300B; Cambridge Technology, Inc.) as previously described (Gardetto et al. 1989; Widrick et al. 1997a). Following the mounting procedure, the fibre was briefly bathed in relaxing solution containing 0.5 % Brij-58 (polyoxyethylene 20 cetyl ether; Sigma Chemical Co.).
The stainless-steel plate was fastened to the stage of an inverted microscope so that the fibre could be viewed at × 800 during data collection. Sarcomere length was adjusted to 2.5 μm using a calibrated eyepiece micrometer. Fibre length (FL) was measured as the length of the fibre suspended between the two attachment points. A Polaroid photo was taken of the fibre while it was briefly suspended in air (< 5 s). The width of the fibre was measured at three points along the photo and the mean value was used to calculate fibre diameter assuming the fibre forms a circular cross-section when suspended in air (Metzger & Moss, 1987).
Experimental procedures
Experimental procedures were identical to those used previously for our human bed rest study (Widrick et al. 1997a, 1998). Fibres were subjected to slack tests to determine Vo (see Fig. 1) and isotonic load clamps to determine force-velocity-power parameters (see Fig. 2). Force-pCa relationships were determined by activating fibres in a series of solutions having free Ca2+ concentrations ranging from pCa 6.8 to pCa 4.7. Hill plot analysis was used to determine the activation threshold and Ca2+ sensitivity of individual fibres (see Fig. 3). Some fibres were subjected to sinusoidal length changes (frequency, 1.5 kHz; amplitude, 0.05 % of FL), first in relaxing solution and then after attaining peak Ca2+ activated force. Changes in length (Δlength) and force (Δforce) were used to calculate peak elastic modulus, or Eo (Eo= ((Δforce in pCa 4.5 - Δforce in pCa 9.0)/(Δlength)) (FL/fibre cross-sectional area (CSA))).
Figure 1. Superimposed force records of a maximally Ca2+-activated pre-flight (A) and post-flight (B) soleus fibre obtained immediately following slack steps of 200, 250, 300, 350 and 400 μm.
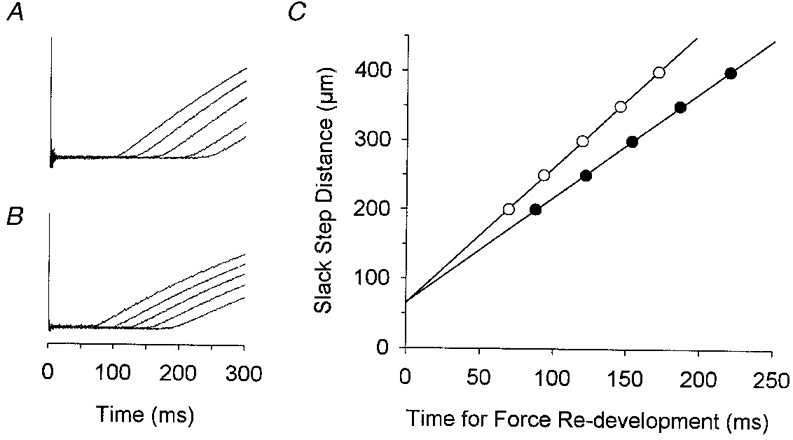
The slack step caused force to drop to baseline after which the fibre shortened under no load. Unloaded shortening ended with the re-development of force. The force records have been superimposed to illustrate the longer duration of unloaded shortening following the longer slack steps. In C, the time required for the re-development of force has been plotted vs. the imposed slack step distance. The slope of the least-squares regression line, after normalization to the length of the fibre, defines Vo. In this example, the Vo of the pre-flight (•) and post-flight (○) fibre was 0.62 and 0.85 FL s−1, respectively. Compliance, determined from the y axis intercepts, was < 3 % of fibre length for each fibre. Gel electrophoresis indicated that each fibre expressed only type I MHC.
Figure 2. Force-velocity relationship of a human pre-flight soleus fibre.
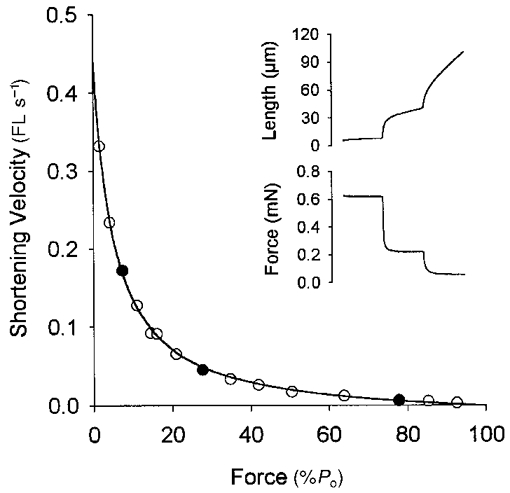
Fibre length and force records obtained during a series of three isotonic contractions are illustrated in the upper right portion of the figure. Each isotonic step was 100 ms in duration. Total fibre shortening across all three steps was < 20 % of the initial fibre length. Force and shortening velocity were determined over the second half of each record with shortening velocity normalized to fibre length. The three isotonic steps illustrated in this figure represented loads of 7, 28 and 78 % of peak isometric force (Po) and are denoted in the force-velocity curve by the filled symbols. In all, 15 force-velocity data points were obtained and fitted by the Hill equation (Hill, 1938) yielding a Vmax (determined by extrapolation of the curve to a load of zero) of 0.44 FL s−1 and a/Po of 0.050 for this particular fibre. Subsequent gel electrophoresis indicated that this fibre expressed solely type I MHC.
Figure 3. Force-pCa relationship (A) and Hill plot analysis (B) of a single pre-flight soleus fibre.
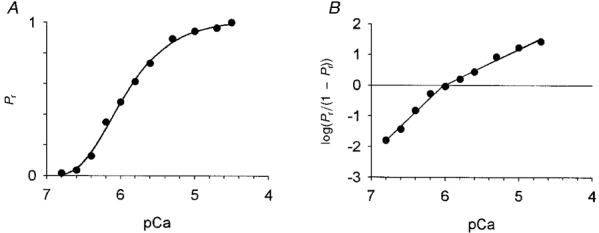
The fibre was activated in solutions with free Ca2+ concentrations ranging from pCa 6.8 to 4.7. The initial and final contraction and every 4th or 5th intervening contraction, was performed at a pCa of 4.5. In A, forces have been plotted relative to peak force at pCa 4.5, i.e. Pr= (force at sub-maximal activation)/(force at pCa 4.5). Hill plots were fitted to the data (B). Half-maximal activation, or pCa50, was defined as the mean abscissal intercept of the Hill plots fitted to data above and below Pr= 0.5. The Ca2+ activation threshold, calculated from the plot of Pr < 0.5, was defined as the pCa where log(Pr/(1 - Pr)) equalled -2.5. For this particular fibre, activation threshold and half-maximal activation occurred at pCa values of 7.09 and 6.02, respectively. The slope of the force-calcium relationship was determined for forces greater (n1) and less (n2) than 50 % of the maximal Ca2+-activated force. Subsequent gel electrophoresis indicated that this fibre expressed type I MHC.
The analog signals from the force transducer and servomotor were monitored on a digital oscilloscope before being amplified, digitized and interfaced to a personal computer. Customized software coordinated data collection, data storage and on-line analysis as previously described (Widrick et al. 1997a, 1998). In all cases, Po was defined as the difference between baseline force in relaxing solution and maximal force attained during Ca2+ activation. Activating and relaxing solutions were maintained at 15°C for all experiments.
Gel electrophoresis
Following physiological testing, the fibre segment was removed from the apparatus, solubilized in 10 μl of an SDS sample buffer and stored at -80°C. Later, fibres were run on 5 and 12 % polyacrylamide gels and silver stained as previously described (McDonald & Fitts, 1993; Widrick et al. 1997a). Representative 5 and 12 % gels, used for the identification of myosin heavy chain (MHC) and myosin light chain (MLC) isoforms, respectively, are presented in Fig. 4. A computer-based image analysis system and software (SigmaGel, Jandel Scientific Software) were used to quantify the relative density of each MLC band (Widrick et al. 1997a).
Figure 4. Representative SDS-polyacrylamide gels illustrating MHC and MLC expression in single human soleus fibres.
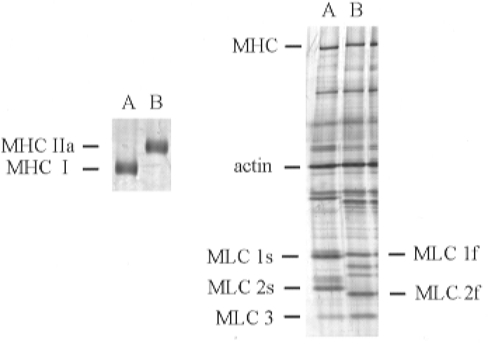
Left: 5 % gel demonstrating separation of type I and IIa MHC in two single soleus fibres. Right: 12 % gel illustrating MLC composition of the same two single fibres. Fibre Vo was 1.09 FL s−1 for the type I fibre in lane A and 4.09 FL s−1 for the type IIa fibre in lane B.
Statistical analysis
Eighteen to thirty-four slow type I fibres (by definition fibres that expressed only type I MHC) were studied for each subject. These fibres were analysed with an ANOVA in which pre- and post-flight fibres were nested within subjects. When a significant treatment (spaceflight) effect was observed, a Student's two-tailed t test was used to identify which subjects showed significant differences between pre- and post-spaceflight means.
As would be expected from the fibre type distribution of the soleus, the number of fast type IIa fibres studied (by definition fibres that expressed only fast type IIa MHC) was considerably smaller than for the type I population. In fact, there were instances where no type IIa fibres were observed for an individual subject-treatment combination. Consequently, type IIa fibres were pooled across subjects and a two-tailed t test used to determine differences between pre- and post-spaceflight means. Even fewer hybrid fibres (by definition fibres containing both type I and IIa MHC) were isolated and thus no statistical tests were performed on these data. However, we have presented means ±s.e.m. for these fibres because of the rarity of human spaceflight data.
A one-way ANOVA was used to compare the relative responses of type I soleus fibres ((post mean - pre mean)/pre mean) × 100 %) during 17 days of spaceflight to the relative responses observed in our previous 17 day bed rest study (Widrick et al. 1997a, 1998).
All statistical analyses were conducted at a level of significance of P < 0.05.
RESULTS
Fibre MHC and MLC composition
Contractile properties were determined on 114 pre- and 132 post-flight fibres randomly isolated from the soleus muscle biopsies. On average, 91 % of these pre- and 79 % of these post-flight fibres expressed type I MHC. Our results indicate a significant spaceflight-induced decline in the percentage of fibres expressing type I MHC (χ2= 8.24, P < 0.05) and a corresponding increase in fibres containing type IIa MHC. However, when fibre type was determined by histochemical myosin ATPase analysis of the entire biopsy cross-section, no significant change in fibre type distribution was observed (S. W. Trappe and D. L. Costill, unpublished observations). Additionally, there was considerable inter-subject variability in the single fibre analysis (Table 1). The overall reduction in the expression of type I MHC could be attributed entirely to the responses of astronauts B and C. It was also apparent that even within these two individuals, the response to spaceflight varied. For subject C, the loss of type I fibres was offset by an increase in fibres expressing exclusively the type IIa MHC isoform. For subject B, spaceflight induced the expression of type I/IIa hybrid fibres, while the proportion of fibres expressing only type IIa MHC did not change.
Table 1. Myosin heavy chain composition of pre-and post-spaceflight soleus fibres.
| Type I | Type I/IIa | Type IIa | ||||
|---|---|---|---|---|---|---|
| Subject | Pre | Post | Pre | Post | Pre | Post |
| A | 97% (34) | 93% (26) | — | 7% (2) | 3% (1) | — |
| B | 90% (18) | 77% (27) | — | 14% (5) | 10% (2) | 9% (3) |
| C | 88% (30) | 65% (24) | — | — | 12% (4) | 35% (13) |
| D | 88% (22) | 84% (27) | 12% (3) | 3% (1) | — | 13% (4) |
Values are the percentage of fibres expressing type I, IIa or I/IIa MHC for each subject–treatment combination. Number of fibres in parentheses.
All of the fibres expressing type I MHC also expressed the slow isoforms of MLC 1 and 2. Twenty-six out of the twenty-seven type IIa fibres expressed fast MLC1 and MLC2 (we were unable to determine MLC composition for one of the type IIa fibres). All of the hybrid type I/IIa fibres expressed both slow and fast MLCs.
Fibre diameter and peak force
On average, the diameter of the type I fibres declined from 96 ± 1 μm (104 fibres) to 88 ± 1 μm (104 fibres) following 17 days of spaceflight. This is equivalent to an overall 8 % reduction in fibre diameter or to a 15 % reduction in fibre cross-sectional area. The overall average peak absolute force (mN) dropped by 21 %, from 0.99 ± 0.03 to 0.78 ± 0.02 mN. Thus, peak force declined out of proportion to the loss in fibre cross-sectional area resulting in an average 4 % reduction in peak force per fibre cross-sectional area (pre: 135 ± 2 kN m−2, 104 fibres; post: 129 ± 2 kN m−2, 104 fibres).
The results from the nested ANOVA (Table 2) revealed that the response to the spaceflight treatment differed significantly between subjects. Fibres obtained from subjects B and D were affected more by spaceflight than fibres from subjects A and C. Post hoc analysis indicated that astronauts B and D both showed significant reductions in fibre diameter, peak absolute force and peak force per fibre cross-sectional area (all P < 0.05). In contrast, post-flight fibres from subject A showed no significant atrophy, but still produced significantly less peak force (P < 0.05) as a result of a trend toward a reduction in peak force per fibre cross-sectional area (P = 0.06). Post-flight fibres from subject C were significantly smaller in diameter than pre-flight fibres (P < 0.05) and tended to produce less force after the flight (P = 0.10). It is likely that this reduction in peak force would have attained statistical significance if not for a small, non-significant increase in the average force per cross-sectional area of the post-flight fibres from this individual. However, what is most important is the observation that the reduction in peak force (mN) noted for those fibres obtained from subjects B and D was 2-3 times greater than the reductions noted for subjects A and C.
Table 2. Diameter, peak Ca2+ -activated force and peak force per fibre cross-sectional area of pre-and post-spaceflight type I soleus fibres.
| Diameter (μm) | Po (mN) | Po (kN m−2) | ||||
|---|---|---|---|---|---|---|
| Subject | Pre | Post | Pre | Post | Pre | Post |
| A | 98 ± 2 | 96 ± 2 | 1.03 ± 0.04 | 0.91 ± 0.03* | 138 ± 4 | 127 ± 4† |
| B | 108 ± 3 | 87 ± 2* | 1.15 ± 0.06 | 0.69 ± 0.03* | 127 ± 4 | 117 ± 2* |
| C | 89 ± 2 | 82 ± 1* | 0.82 ± 0.05 | 0.72 ± 0.03† | 128 ± 4 | 135 ± 4 |
| D | 93 ± 2 | 86 ± 2* | 1.02 ± 0.04 | 0.79 ± 0.03* | 149 ± 4 | 136 ± 3* |
Values are means ± S.E.M. of type I fibres. Number of fibres per subject same as in Table 1. Po, peak isometric force.
P < 0.05.
0.10 > P > 0.05, post- vs. pre-flight.
Electron micrographs revealed thinner Z-lines and myofibrils in the post-flight fibres indicative of fibre atrophy (Fig. 5). When sectioned in cross-section, the density of thin filaments (normalized for the sarcomere length of the fixed fibre) was reduced in the post-flight fibres (Fig. 6). A-band thin filament density declined by 26 % in post-flight fibres as a result of a 17 % reduction in total thin filament number coupled with a 9 % increase in the number of filaments too short to extend into the A-band.
Figure 5. Electron micrographs of longitudinal sections of soleus muscle fibres obtained from subject D before (upper photo) and after the flight (lower photo).
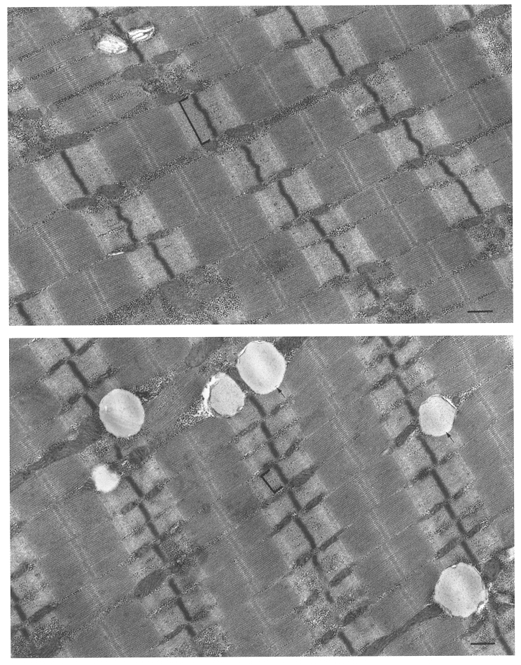
The paucity of sarcoplasmic reticulum membranes indicates that both fibres are slow fibres. Thin myofibrils and short Z lines (brackets) indicate atrophy of the post-flight fibre. The mitochondria and glycogen-like particles are similar in both fibres but the higher content of lipid droplets (arrows) is characteristic of post-flight muscle. Scale bars, 0.5 μm.
Figure 6. High magnification cross-sectional views of the thick and thin filament overlap region in the A-bands of a soleus muscle fibre biopsied before (upper photo) and after (lower figure) spaceflight (subject C).
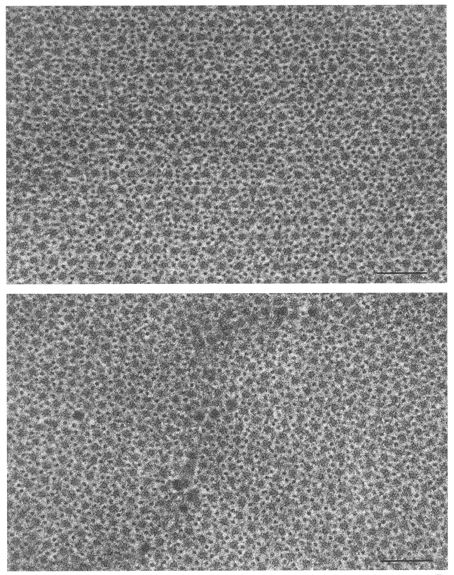
Myofilament packing density is reduced post-flight because of a disproportionate loss of thin filaments. Scale bars, 0.1 μm.
The shaded circles in Fig. 7 illustrate the relationship between type I fibre diameter and Po for each individual subject. Significant correlations were observed between type I fibre diameter and Po for all subject-treatment combinations with correlation coefficients ranged from 0.70 (subject A, post-flight) to 0.87 (subject B, post-flight). Very few of the post-flight type I fibres obtained from subjects B, C and D had diameters > 100 μm or produced peak forces > 1.0 mN, even though fibres with these characteristics made up a substantial proportion of their pre-flight fibre populations.
Figure 7. Relationships between fibre diameter and peak Ca2+-activated isometric force (Po).
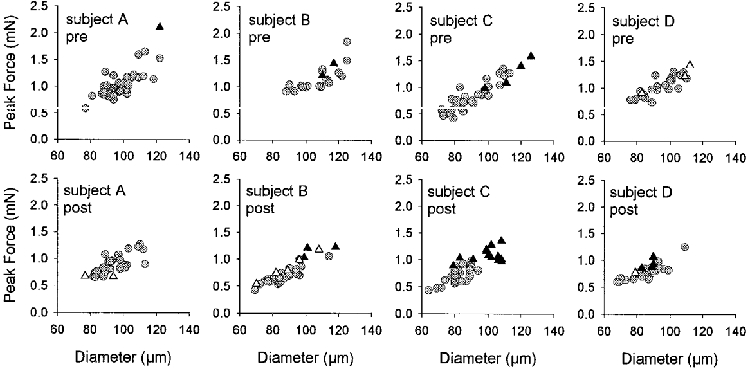
Each symbol represents the results of a single soleus fibre. Type I fibres, shaded circles. Type IIa fibres, filled triangles. Type I/IIa fibres, open triangles.
On average, peak elastic modulus (Eo) was lower after the flight (pre: 2.67 ± 0.07, 72 fibres; post: 2.21 ± 0.05, 92 fibres). The nested ANOVA revealed that fibres obtained from astronauts A, B and D showed significant reductions in this variable (Table 3). Fibre Eo declined out of proportion to the reduction in peak isometric force (Po) so that the average Po/Eo ratio was increased after spaceflight (pre: 49.2 ± 0.9, 72 fibres; post: 55.7 ± 0.10, 92 fibres). The same subjects showing significant reductions in Eo also showed significant increases in the Po/Eo ratio (Table 3).
Table 3. Peak stiffness (Eo) and the Po/Eo ratio of pre-and post-spaceflight type I soleus fibres.
| Eo | Po/Eo | |||
|---|---|---|---|---|
| Subject | Pre | Post | Pre | Post |
| A | 2.47 ± 0.09 | 2.00 ± 0.09* | 50.5 ± 1.1 | 60.3 ± 2.0 * |
| B | 2.73 ± 0.17 | 2.05 ± 0.08* | 47.3 ± 1.9 | 54.4 ± 1.9* |
| C | 2.37 ± 0.12 | 2.45 ± 0.10 | 51.6 ± 2.8 | 52.3 ± 1.7 |
| D | 3.05 ± 0.12 | 2.36 ± 0.10* | 47.6 ± 1.5 | 55.4 ± 2.3* |
Values are means ± S.E.M. of type I fibres. Number of fibres per subject (pre, post): subject A (23, 24); subject B (15, 24); subject C (14, 21); subject D (20, 23). Eo, peak elastic modulus; Po, peak isometric force.
P < 0.05, post- vs. pre-flight.
Figure 8 illustrates the force-pCa relationships of fibres expressing type I MHC. Before the flight, the free Ca2+ required for the Ca2+ activation threshold and half-maximal activation (pCa50) was 0.103 ± 0.004 μmol and 1.25 ± 0.05 μmol, respectively, and the slopes of the force-calcium relationships at forces greater (n1) and less (n2) than 50 % of maximal Ca2+-activated force were 1.37 ± 0.05 and 2.29 ± 0.05, respectively (52 fibres). The nested ANOVA indicated a significant spaceflight treatment effect for the free Ca2+ concentration associated with half-maximal activation, but not for the activation threshold or the parameters n1 or n2. Post hoc analysis revealed that fibres obtained from subject B required 0.31 μmol, or 29 %, more free Ca2+ (P < 0.05) to attain half-maximal activation after the flight. This is illustrated by the rightward shift in the force-pCa relationship for fibres obtained from this subject (Fig. 8).
Figure 8. Force-pCa relationships for type I fibres obtained before (• and continuous lines) and after (○ and dashed lines) spaceflight.
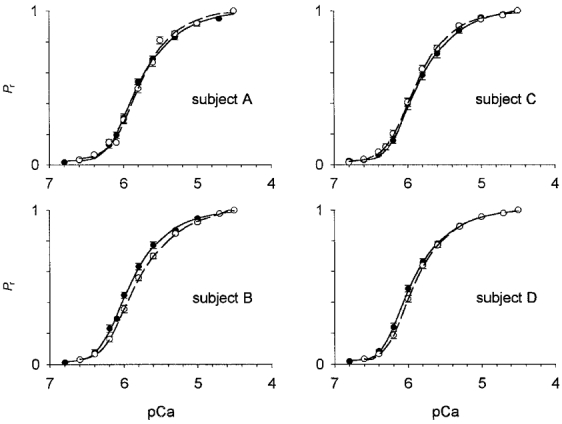
Forces observed during sub-maximal activation (Pr) were expressed relative to force obtained at pCa 4.5. Symbols and error bars represent means ± 1 s.e.m. Total number of fibres studied were (pre, post): subject A: 15, 23; subject B: 10, 21; subject C: 14, 20; subject D: 13, 16. All fibres expressed type I MHC on 5 % gels.
Pre-flight type IIa fibres were significantly larger in diameter (pre: 115 ± 4 μm, n = 7; post: 98 ± 2 μm, n = 20; P < 0.05) and produced significantly greater Po (1.41 ± 0.14 vs. 1.06 ± 0.03 mN; P < 0.05) than the post-flight IIa fibres (see Fig. 7 for the data on individual fibres). Po/CSA was similar between pre- and post-flight type IIa fibres (pre: 134 ± 8 kN m−2; post: 143 ± 5 kN m−2; P > 0.05). Post-flight type I/IIa fibres were 14 % smaller in diameter (pre: 101 ± 9 μm, n = 3; post: 87 ± 4 μm, n = 8), produced 9 % less Po/CSA (pre: 148 ± 10 kN m−2; post: 134 ± 6 kN m−2), and consequently attained a Po that was 34 % lower than pre-flight I/IIa fibres (pre: 1.19 ± 0.15 mN; post: 0.79 ± 0.07 mN).
Fibre Vo
The Vo of type I fibres increased by an average of 30 % with spaceflight (pre: 0.64 ± 0.02 FL s−1, 104 fibres; post: 0.83 ± 0.02 FL s−1, 104 fibres). The nested ANOVA indicated a significant spaceflight treatment effect and post hoc analysis revealed that fibre Vo increased after the flight for all four subjects (Table 4). This is well illustrated in Fig. 9 where the post-flight distribution of fibre Vo values shifted to the right, i.e. to faster velocities, for each of the four astronauts. Average post-flight Vo of the fast type IIa fibres was 55 % greater than the pre-flight mean (pre: 2.90 ± 0.40 FL s−1, n = 7; post: 4.49 ± 0.44 FL s−1, n = 20; P < 0.05).
Table 4. Unloaded shortening velocity of pre- and post-spaceflight type I soleus fibres.
| Vo (FL s−1) | ||
|---|---|---|
| Subject | Pre | Post |
| A | 0.69 ± 0.03 | 0.80 ± 0.04* |
| B | 0.72 ± 0.04 | 0.89 ± 0.06* |
| C | 0.51 ± 0.02 | 0.80 ± 0.03* |
| D | 0.65 ± 0.04 | 0.85 ± 0.03* |
Values are means ± S.E.M. of type I fibres. Number of fibres per subject same as in Table 1. Vo, unloaded shortening velocity; FL, fibre length.
P < 0.05, post- vs. pre-flight.
Figure 9. Vo histograms of pre- and post-flight fibres from each subject.
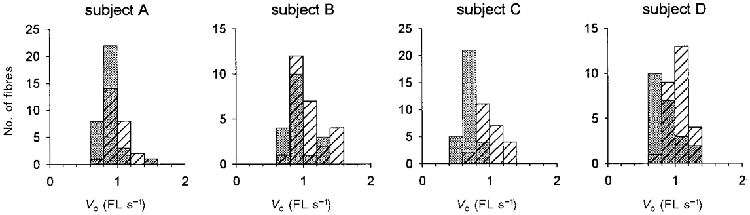
Pre-flight distributions are indicated by the shaded bars. Post-flight distributions are indicated by the hatched bars.
To investigate possible causes for the elevated Vo of the type I post-flight fibres, we calculated the ratio of MLC3 to the slow isoform of MLC2 (MLC2s). This ratio has been reported to be directly related to Vo in intermediate and high velocity fibres from small mammals (Greaser et al. 1988; Sweeney et al. 1988). There was an overall increase in the ratio of MLC3 to MLC2s with flight (Table 5), a change that was confined to type I fibres obtained from subjects A and C. However, these changes in type I fibre MLC isoform composition could not account for the Vo results as there was no significant correlation between MLC3/MLC2s and type I fibre Vo for any of the subject-treatment combinations in this study (Table 5).
Table 5. Relationship between MLC3/MLC2 and unloaded shortening velocity for pre- and post-spaceflight type I soleus fibres.
| MLC3/MLC2s | Correlation with Vo | |||
|---|---|---|---|---|
| Subject | Pre | Post | Pre | Post |
| A | 0.252 ± 0.019 | 0.369 ± 0.029* | 0.26 | −0.30 |
| B | 0.330 ± 0.031 | 0.285 ± 0.033 | −0.11 | −0.08 |
| C | 0.263 ± 0.025 | 0.432 ± 0.045* | 0.05 | −0.20 |
| D | 0.264 ± 0.020 | 0.298 ± 0.025 | 0.29 | −0.17 |
Values are means ± S.E.M. of type I fibres. Number of fibres per mean same as Table 1.
P < 0.05, post- vs. pre-flight.
Isotonic contractile properties
The Hill equation (Hill, 1938) was fitted to isotonic data collected from a sub-set of the type I fibres (95 pre- and 93 post-flight fibres). Significant treatment effects were noted for all three parameters describing the force-velocity relationships (Vmax, Po (in both mN and kN m−2), a/Po). Fibre Vmax pooled across subjects rose from an average of 0.38 ± 0.01 FL s−1 before the flight (95 fibres) to 0.55 ± 0.02 FL s−1 after the flight (93 fibres) while average Po fell from 0.98 ± 0.02 to 0.78 ± 0.02 mN. The shape of the force-velocity relationship became more curved as a/Po decreased from a pre-flight mean of 0.048 ± 0.002 to a post-flight mean of 0.038 ± 0.002. Individual changes in Vmax, Po and a/Po are illustrated in the composite force-velocity relationships of Fig. 10. Note that even though the Vmax mean values were less than the corresponding Vo values for any given individual, the post-flight increases in both measurements of shortening velocity were qualitatively similar. A similar relationship between Vo and Vmax has been noted by others (Julian & Moss, 1981). Peak power occurs at shortening velocities and forces considerably less than Vmax and Po, respectively. Furthermore, peak power may not change in direct proportion to alterations in Vmax and Po due to shifts in the shape of the force-velocity relationship. Therefore, we examined the velocity of shortening and force under those conditions that elicited the peak power output of a fibre (Table 6). Significant spaceflight effects were noted for all variables. At peak power output the shortening velocity (FL s−1 at peak power) rose, while the absolute force (mN) produced by fibres fell for all subjects. In addition, fibres from two astronauts showed a significant mean reduction in the force per fibre cross-sectional area attained at peak power after the flight.
Figure 10. Force-velocity and force-power relationships of pre- and post-flight soleus fibres.
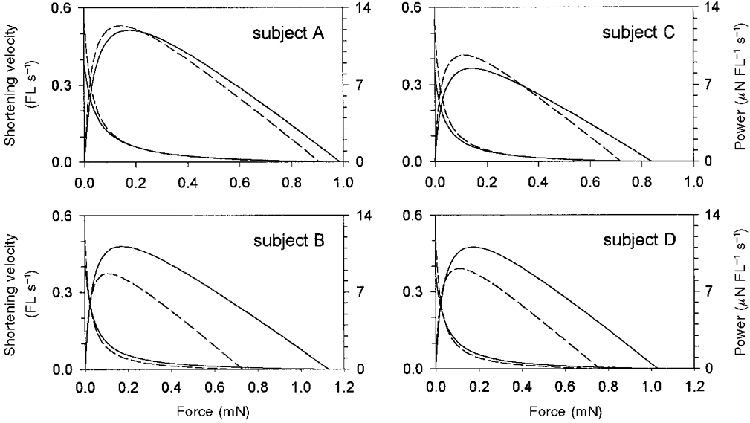
Continuous lines represent composite pre-flight force-velocity and force-power relationships. Dashed lines represent composite post-flight force-velocity and force-power relationships.
Table 6. Shortening velocity and force at peak power output of pre- and post-flight type I soleus fibres.
| FL s−1 at peak power | mN at peak power | kN m−2 at peak power | ||||
|---|---|---|---|---|---|---|
| Subject | Pre | Post | Pre | Post | Pre | Post |
| A | 0.068 ± 0.002 | 0.087 ± 0.003* | 0.179 ± 0.007 | 0.146 ± 0.007* | 24.8 ± 0.8 | 20.5 ± 0.7* |
| B | 0.064 ± 0.002 | 0.078 ± 0.004* | 0.175 ± 0.007 | 0.115 ± 0.007* | 20.1 ± 1.1 | 18.8 ± 0.8 |
| C | 0.060 ± 0.003 | 0.084 ± 0.004* | 0.147 ± 0.009 | 0.117 ± 0.006* | 22.8 ± 0.8 | 22.3 ± 1.0 |
| D | 0.064 ± 0.002 | 0.081 ± 0.003* | 0.175 ± 0.007 | 0.115 ± 0.005* | 25.6 ± 0.8 | 20.8 ± 1.1* |
Values are means ± S.E.M. of type I fibres. Number of fibres per subject (pre, post): subject A (31, 25); subject B (14, 23); subject C (28, 23); subject D (22, 22). FL, fibre length.
P < 0.05, post- vs. pre-flight.
While post-flight fibres from all subjects shortened at greater velocities but produced less absolute force than their respective pre-flight fibres, the effect that these changes had on peak power output varied dramatically between subjects. While the overall difference in peak power between pre- and post-flight fibres was very small, only 0.6 μN FL s−1 (pre: 10.6 ± 0.3 μN FL s−1; post: 10.0 ± 0.3 μN FL s−1), the nested ANOVA indicated a significant treatment effect for this variable (Table 7). Post hoc analysis revealed that fibres obtained from subjects B and D showed reductions in peak power of 22 and 18 %, respectively, after the flight. In contrast, peak power was unaffected by spaceflight for subjects A and C. This dichotomy between the peak power response of fibres obtained from subjects B and D vs. those obtained from subjects A and C is illustrated in the force-power relationships of Fig. 10. The nested ANOVA also indicated a significant treatment effect for peak power expressed relative to the cross-sectional area of the fibre (Table 7). This was due almost exclusively to the response of subject C, where normalized peak power rose by 38 %.
Table 7. Peak power results for pre-and post-flight type I soleus fibres.
| Peak power (μN FL s−1) | Peak power (kN m−2 FL s−1) | |||
|---|---|---|---|---|
| Subject | Pre | Post | Pre | Post |
| A | 12.0 ± 0.5 | 12.4 ± 0.5 | 1.67 ± 0.07 | 1.76 ± 0.05 |
| B | 11.2 ± 0.6 | 8.7 ± 0.5* | 1.28 ± 0.07 | 1.42 ± 0.05 |
| C | 8.5 ± 0.5 | 9.7 ± 0.5 | 1.33 ± 0.05 | 1.83 ± 0.07* |
| D | 11.1 ± 0.6 | 9.1 ± 0.4* | 1.62 ± 0.06 | 1.62 ± 0.06 |
Values are means ± S.E.M. of type I fibres. Number of fibres per subject same as in Table 6.
P < 0.05, post- vs. pre-flight.
Similar to the slow fibres, type IIa fibres showed a 24 % reduction (P < 0.05) in the force produced at peak power output after spaceflight. Nevertheless, Vmax rose 19 % with flight (P > 0.05) so that there was no difference (P > 0.05) in the peak power output of the pre- (50.1 ± 5.2 μN FL s−1, n = 4) and post-flight (46.5 ± 2.5 μN FL s−1, n = 11) type IIa fibres.
Comparison of spaceflight to a similar period of bed rest
In previous work, we examined the responses of type I soleus fibres to 17 days of complete bed rest (Widrick et al. 1997a, 1998). Figure 11 compares the results from this previous work to the present study. Since the number of pre and post fibres varied within and between subjects for each study, in this comparative analysis we used the average relative change observed for each individual subject. Inter-subject variability appears to be similar for each model. ANOVA indicated no differences in the relative changes between the two models for fibre diameter, Po, Po/CSA, Vo and peak power.
Figure 11. Effects of 17 days of spaceflight or ground-based bed rest on the diameter and functional properties of single type I soleus fibres.
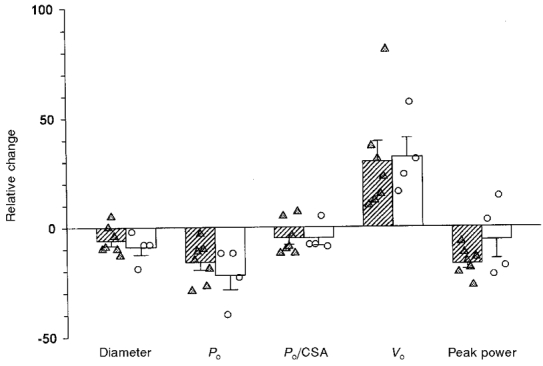
The symbols represent the mean relative change (i.e. (post-flight mean value/pre-flight mean value) × 100 %) experienced by each individual astronaut (circles) and bed rest subject (triangles). Bars represent the mean (±s.e.m.) of the individual relative changes. Bed rest data obtained from Widrick et al. 1997a, 1998. Responses of one bed rest subject have been omitted from this analysis (see Widrick et al. 1997a and 1998 for justification).
DISCUSSION
The results of this study demonstrate that cellular processes of skeletal muscle contraction are altered during a typical 17 day spaceflight aboard the Space Shuttle Columbia. Experiments utilizing fixed end, unloaded and isotonic contractions revealed alterations in force production, shortening velocity and power output of post-flight fibres expressing type I MHC. Presumably these alterations result from the lack of normal weight-bearing activity by the lower limb postural muscles in the reduced gravity conditions aboard the space shuttle. It is unlikely that the observed changes resulted from functional differences in the left (pre-flight biopsy) vs. right (post-flight biopsy) soleus. In humans, the soleus is a homogeneous slow muscle composed of ∼90 % slow type I fibres, and to our knowledge there is no size or functional differences in fibres isolated from the right and left soleus of a given individual (Widrick et al. 1997a). Companion studies on the same crew members showed that there were no functional changes in the triceps surea between 90 and 15 days pre-flight, suggesting that muscle adaptations did not occur between the pre-flight biopsy and flight day zero (authors’ unpublished observations and Narici et al. 1997).
Effect of spaceflight on fibre force
Overall, the post-flight diameter of the type I soleus fibres was reduced by 8 %, equivalent to a 15 % reduction in fibre cross-sectional area, following the flight. Our results are in good agreement with the 16 % reduction in type I vastus lateralis fibres cross-sectional area observed after an 11 day spaceflight (Edgerton et al. 1995). However, individual changes in fibre diameter with spaceflight varied between the four subjects. Only three of the four astronauts experienced significant fibre atrophy and even for these three individuals, there was a 2-fold variation in response. Previous human studies have reported substantial inter-subject variability in the atrophic response of muscle fibres to 11 days of spaceflight and to 17 days of bed rest (Edgerton et al. 1995; Widrick et al. 1997a).
Despite inter-subject differences in fibre atrophy, we found that post-flight type I fibres obtained from all four astronauts produced significantly less peak force after the flight. Since the sarcoplasmic reticulum had been rendered non-functional and fibres were directly activated with saturating levels of free Ca2+, the force decrement observed after the flight can be attributed to changes occurring at the level of the cross-bridges. The fibre atrophy experienced by three astronauts (B, C and D) would be expected to reduce force simply by lowering the number of actomyosin cross-bridges. For two of these individuals (B and D) there was a further dilution of the remaining cross-bridges as Po/CSA fell by 8-9 %. Even fibres obtained from the individual showing no atrophy (astronaut A) produced less Po/CSA after the flight. The decrease in the peak stiffness of fibres obtained from three astronauts (A, B and D) supports our interpretation of a reduction in the number of strongly bound cross-bridges per unit fibre area.
Our data demonstrate that a portion of the force loss for three of the astronauts resulted from a reduction in the ability of fibres to produce force per unit cross-sectional area. The mechanisms responsible for the decline in Po/CSA are not known. While thin filament density decreased with spaceflight, it is not known if this decreased the number of strongly bound cross-bridges. Also, quantification of the density of thin filaments within a myofibril does not address the density with which myofibrils are packed within a fibre. Thus, one must consider that changes in myofibrilar density could alter Po/CSA independently of changes in the thin filament density. Our observation of an increased Po/Eo ratio after spaceflight could be interpreted as an increase in the average force per cross-bridge. However, it has been noted by others that Eo is reduced to a greater extent than Po as the myofilament lattice is expanded (Goldman & Simmons, 1986). Thus, the observed rise in Po/Eo may have resulted from changes to the myofilament lattice rather than to any change in the force per cross-bridge.
Astronauts that experienced reductions in both fibre diameter and Po/CSA displayed a drop in peak force that was 2-3 times greater than observed for the astronauts experiencing only one of these changes. As discussed below, this has important implications regarding fibre power output following the flight. Furthermore, a reduction in force production at the cellular level may be one contributing factor to the reduced extensor muscle torque previously experienced by astronauts after flight (Grigoryeva & Kozlovskaya, 1987; Convertino, 1990; Edgerton et al. 1995). In support of this, Narici et al. (1997) found that the torque produced by the triceps surea in response to 50 Hz stimulation declined progressively during 17 days of spaceflight and was approximately 80 % of the pre-flight value 2 days following the flight. This decrement in in vivo muscle function, which was obtained by bypassing neural mechanisms modulating muscle activation, is in good agreement with our finding of a 21 % average reduction in Ca2+-activated force of single muscle cells. One additional effect to consider is the fibre type distribution. We and others (Edgerton et al. 1995) have observed a small increase in the percentage of fast type IIa fibres post-spaceflight. Although this fibre type switch may contribute to an increased whole muscle velocity it would not participate in the spaceflight-induced decline in whole muscle force. The latter is true as in humans the fast type IIa fibre has been shown to produce force either equal to or slightly greater than the slow type I fibre (Larsson et al. 1996; Widrick et al. 1996).
Prior to this flight, we studied type I soleus fibres obtained from adult males before and after 17 days of complete bed rest. During bed rest, subjects underwent the exact same physiological testing performed by the astronauts during this flight. Fibres were obtained and analysed using identical procedures. By directly comparing the results from these two studies we have attempted to assess the validity of the ground-based, head-down tilt bed rest procedure as a model of human spaceflight. The degree of fibre atrophy and the reductions in both Po and Po/CSA did not vary by more than a few per cent between spaceflight and the bed rest model. Thus, the results of this comparison indicate that in general, mechanisms of force production in type I soleus fibres respond in a similar manner to either bed rest or spaceflight. We should point out that one difference between the bed rest and spaceflight studies was that the astronauts were required by NASA flight surgeons to perform aerobic countermeasure exercise during the flight. It is impossible to evaluate how this may have affected the comparison between bed rest and spaceflight. However, Edgerton et al. (1995) concluded that, in an 11 day spaceflight, these exercises had no effect on fibre atrophy. We would concur with that conclusion based on the similarities between the bed rest (where subjects did not perform exercise countermeasures) and spaceflight results.
Bed rest and spaceflight appear to have slightly different affects on fibre Ca2+ sensitivity. Following bed rest (Widrick et al. 1998), type I soleus fibres (pooled across 7 subjects) required 50 % more free Ca2+ to attain their activation threshold. This stands in contrast to the present study where no change in the activation threshold was observed after spaceflight. We also found that the Ca2+ concentration eliciting half-maximal activation was reduced by an average of 18 % after 17 days of bed rest. Only one of the present subjects (astronaut B) showed a significant reduction in Ca2+ sensitivity with spaceflight. Interestingly, this astronaut also experienced the greatest decline in fibre diameter and the largest reduction in absolute peak Ca2+-activated force during the flight. It is also worth noting that the reduction in Ca2+ sensitivity noted for astronaut B is similar to the reduction in pCa50 observed for rat type I soleus fibres after 7-21 days of hindlimb suspension (Gardetto et al. 1989; McDonald & Fitts, 1995; Bangart et al. 1997). Rat fibres display an increase in fast isoforms of troponin T and troponin I after hindlimb suspension (Campione et al. 1993) that may explain their change in Ca2+ sensitivity (Schachat et al. 1987). We have been unable to unequivocally identify these bands after electrophoresis of human fibres. Thus, a mechanism underlying the reduced Ca2+ sensitivity of the post-flight fibres obtained from astronauts B and D is not presently clear.
Effect of spaceflight on fibre shortening velocity
The Vo of a fibre is strongly related to its MHC isoform content (Reiser et al. 1985). This relationship between Vo and MHC isoform expression was altered following the flight. Post-flight fibres that appeared to express the same slow MHC isoform as the pre-flight fibres, had velocities that were on average 30 % greater.
MLC composition is believed to play a role in modulating Vo further, at least in moderate to fast contracting fibres (Greaser et al. 1988; Sweeney et al. 1988). However, the elevated Vo of the post-flight fibres could not be attributed to changes in MLC isoform expression. All pre- and post-flight type I fibres expressed slow isoforms of MLC 1 and 2. Furthermore, even though the average amount of MLC3 present in the type I fibres increased for two individuals during the flight, levels of this MLC isoform were not correlated with Vo for any of the subjects. Finally, the observed changes in Vo could not be attributed to differences in compliance between the pre- and post-flight fibres. The y-intercepts of the slack test plots, an indication of total series compliance (Edman, 1979), averaged 3.1-4.3 % of FL for the pre-flight fibres and 3.3-3.6 % of FL for the post-flight experiments, with no significant pre- to post-flight differences observed across any of the subjects.
The mechanism responsible for the elevated Vo of the post-flight fibres is unknown. Developmental slow MHC isoforms (Hughes et al. 1993), which presumably confer a greater Vo than the adult slow isoform (Reiser et al. 1988), have been found in small amounts in rat soleus muscles after spaceflight (Allen et al. 1996). Since Vo is disproportionately affected by the slowest MHC isoform expressed by a fibre (Reiser et al. 1985), it is questionable whether these developmental isoforms were present in quantities great enough to substantially alter Vo. There are also reports that adult mammalian muscle fibres may express more than one slow MHC isoform (Fauteck & Kandarian, 1995; Galler et al. 1997), but whether this isoform(s) is faster than the adult type I isoform has not been determined. Since the slow type I fibres studied here showed only the slow type I MHC on SDS gels, it seems unlikely that the flight-induced increase in Vo was caused by an altered myosin isozyme expression.
Metzger & Moss (1987) were able to experimentally alter Vo by manipulating fibre myofilament lattice spacing. The observation that thin filament density was reduced in post-flight fibres obtained from each of the astronauts raises the possibility that alterations in myofilament geometry may have played some role in determining the contractile function of the post-flight fibres. These changes might have involved an increase in the distance between thin and thick filaments and/or a change in the geometry of the cross-bridge attachments. These alterations would be expected to have a much greater effect on shortening velocity than on force (Metzger & Moss, 1987), which is consistent with the present findings.
Comparisons between fibres obtained after 17 days of bed rest and after 17 days of spaceflight reveal almost identical responses in terms of Vo. Both conditions increased the observed Vo of the type I soleus fibres by ∼30 % above the pre-treatment mean. This appears to be a generalized response of mammalian type I fibres to non-weight bearing as similar results have been observed for rat type I soleus muscle fibres after periods of hindlimb suspension ranging from 7-21 days (Gardetto et al. 1989; McDonald & Fitts, 1993; Widrick et al. 1996).
Effect of spaceflight on fibre peak power
We expressed power in two ways: (1) in units normalized for variations in fibre length but not for fibre cross-sectional area (μN FL s−1) and (2) normalized for both fibre length and fibre cross-sectional area (kN m−2 FL s−1). The SI unit for power is the watt, or N m s−1, and since fibre power is proportional to fibre cross-sectional area and fibre length, fibre power is typically normalized to fibre volume. Note that multiplying kN m−2 FL s−1 by fibre cross-sectional area and fibre length, i.e. by fibre volume, yields units of N m s−1, or watts. Thus, power in kN m−2 FL s−1 is mathematically equivalent to watts (l of fibre)−1. The spaceflight-induced decline in fibre diameter and cross-sectional area directly contributed to the decline in peak force and power and thus to the reduced performance of the whole muscle. By expressing peak power in units of μN FL s−1, changes in cell cross-sectional area are not factored out and one obtains an indication of the effect of spaceflight-induced atrophy on fibre performance.
The overall mean peak power in μN FL s−1 showed only a small decline with spaceflight (10.6 ± 0.3 vs. 10.0 ± 0.3). However, there were important individual adaptations to flight. For astronauts A and C, the spaceflight-induced increase in fibre shortening velocity at peak power was enough to completely compensate for the reduced force such that peak power remained unchanged (Table 7). In contrast, for astronauts B and D, the increased fibre shortening velocity was insufficient to counter the decline in force, thus peak power significantly declined post-flight. Nevertheless, the increased shortening velocity was functionally important as the post-flight peak power was only 18-22 % less than the pre-flight means. Without the adaptation in velocity, power would have declined by ∼34 %. These results indicate that the elevated shortening velocity of the post-flight fibres played an important compensatory role in terms of fibre power. The reduced peak power could be entirely explained by fibre atrophy; thus when normalized to fibre volume power was unaffected by the flight (Table 7). In fact, the fibres from astronaut C showed an increased normalized peak power post-flight as velocity at peak power increased, while specific force was unaltered.
Responses of fibres expressing fast MHC isoforms
On average, type IIa fibres displayed reductions in diameter and Po and an increase in Vo that were as great as or greater than those observed for the type I fibres. This was somewhat surprising since previous work using the rat hindlimb suspension model found significant atrophy, but no changes in Po or Vo, of type IIa fibres obtained from the gastrocnemius (Gardetto et al. 1989). Taken together, these results indicate that the species and/or the muscle of origin may play an important role in determining the functional responses of type IIa fibres to prolonged non-weight bearing.
Conclusions
We observed that cross-bridge mechanisms underlying force production and shortening in human soleus fibres were altered after 17 days of spaceflight. For all four astronauts studied, soleus fibres expressing type I MHC produced less average force but shortened at a greater average velocity after the flight. Not only do the mechanisms underlying these responses appear to vary between subjects (particularly for force production), but they appear to be complex, possibly involving alterations in ultrastructural morphology. The elevated shortening velocity of the post-flight fibres may have an important functional role in preventing or attenuating potential reductions in fibre peak power.
Acknowledgments
The authors thank the crew of the LMS Spacelab flight and the scientists at National Aeronautics and Space Administration (NASA) Johnson Space Center particularly Mel Buderer, Stuart Johnston and Ladonna Miller. This study was supported by National Aeronautics and Space Administration grant NAS9-18768 to R. H. F. D. A. R received partial salary support from NASA grant NAG2-956.
References
- Allen DL, Yasui W, Tanaka T, Ohira Y, Nagaoka S, Sekiguchi C, Hinds WE, Roy RR, Edgerton VR. Myonuclear number and myosin heavy chain expression in rat soleus single muscle fibers after spaceflight. Journal of Applied Physiology. 1996;81:145–151. doi: 10.1152/jappl.1996.81.1.145. [DOI] [PubMed] [Google Scholar]
- Bangart JJ, Widrick JJ, Fitts RH. Effect of intermittent weight bearing on soleus fiber force-velocity-power and force-pCa relationships. Journal of Applied Physiology. 1997;82:1905–1910. doi: 10.1152/jappl.1997.82.6.1905. 10.1063/1.365997. [DOI] [PubMed] [Google Scholar]
- Caiozzo VJ, Haddad F, Baker MJ, Herrick RE, Prietto N, Baldwin KM. Microgravity-induced transformations of myosin isoforms and contractile properties of skeletal muscle. Journal of Applied Physiology. 1996;81:123–132. doi: 10.1152/jappl.1996.81.1.123. [DOI] [PubMed] [Google Scholar]
- Campione M, Ausoni S, Guezennec CY, Schiaffino S. Myosin and troponin changes in rat soleus muscle after hindlimb suspension. Journal of Applied Physiology. 1993;74:1156–1160. doi: 10.1152/jappl.1993.74.3.1156. [DOI] [PubMed] [Google Scholar]
- Convertino VA. Physiological adaptations to weightlessness: effects on exercise and work performance. In: Pandolf KB, Holloszy JO, editors. Exercise and Sports Sceinces Reviews. Vol. 18. Baltimore: Williams and Wilkins; 1990. pp. 119–166. [PubMed] [Google Scholar]
- Edgerton VR, Zhou M-Y, Ohira Y, Klitgaard H, Jiang B, Bell G, Harris B, Saltin B, Gollnick PD, Roy RR, Day MK, Greenisen M. Human fiber size and enzymatic properties after 5 and 11 days of spaceflight. Journal of Applied Physiology. 1995;78:1733–1739. doi: 10.1152/jappl.1995.78.5.1733. [DOI] [PubMed] [Google Scholar]
- Edman KAP. The velocity of unloaded shortening and its relation to sarcomere length and isometric force in vertebrate muscle fibres. The Journal of Physiology. 1979;291:143–159. doi: 10.1113/jphysiol.1979.sp012804. [DOI] [PMC free article] [PubMed] [Google Scholar]
- Fabiato A, Fibiato F. Calculator programs for computing the composition of the solutions containing multiple metals and ligands used for experiments in skinned muscle cells. Journal de Physiologie. 1979;75:463–505. [PubMed] [Google Scholar]
- Fauteck SP, Kandarian SC. Sensitive detection of myosin heavy chain composition in skeletal muscle under different loading conditions. American Journal of Physiology. 1995;268:C419–424. doi: 10.1152/ajpcell.1995.268.2.C419. [DOI] [PubMed] [Google Scholar]
- Fitts RH, Widrick JJ, Knuth SK, Blaser CA, Karhanek M, Trappe SW, Trappe TA, Costill DA. Force-velocity and force-power properties of human muscle fibers after spaceflight. Medicine and Science in Sports and Exercise. 1997;29:S190. abstract. [Google Scholar]
- Galler S, Hilber K, Gohlsch B, Pette D. Two functionally distinct myosin heavy chain isoforms in slow skeletal muscle fibres. FEBS Letters. 1997;410:150–152. doi: 10.1016/s0014-5793(97)00556-5. 10.1016/S0014-5793(97)00556-5. [DOI] [PubMed] [Google Scholar]
- Gardetto PR, Schluter JM, Fitts RH. Contractile function of single muscle fibers after hindlimb suspension. Journal of Applied Physiology. 1989;66:2739–2749. doi: 10.1152/jappl.1989.66.6.2739. [DOI] [PubMed] [Google Scholar]
- Godt RE, Lindley BD. Influence of temperature upon contractile activation and isometric force production in mechanically skinned muscle fibers of the frog. Journal of General Physiology. 1982;80:279–297. doi: 10.1085/jgp.80.2.279. 10.1085/jgp.80.2.279. [DOI] [PMC free article] [PubMed] [Google Scholar]
- Goldman YE, Simmons RM. The stiffness of frog skinned muscle fibres at altered lateral filament spacing. The Journal of Physiology. 1986;378:175–194. doi: 10.1113/jphysiol.1986.sp016213. [DOI] [PMC free article] [PubMed] [Google Scholar]
- Greaser ML, Moss RL, Reiser PJ. Variations in contractile properties of rabbit single muscle fibres in relation to troponin T isoforms and myosin light chains. The Journal of Physiology. 1988;406:85–98. doi: 10.1113/jphysiol.1988.sp017370. [DOI] [PMC free article] [PubMed] [Google Scholar]
- Grigoryeva LS, Kozlovskaya IB. Effect of weightlessness and hypokinesis on velocity and strength properties of human muscles. Kosmicheskaya Biologiya I Aviakosmicheskaya Meditsina. 1987;21:27–30. [PubMed] [Google Scholar]
- Hill AV. The heat of shortening and the dynamic constants of muscle. Proceedings of the Royal Society. 1938;B 126:136–195. [Google Scholar]
- Hughes SM, Cho M, Karsch-Mizrachi I, Travis M, Silberstein L, Leinwand LA, Blau HM. Three slow myosin heavy chain sequentially expressed in developing mammalian skeletal muscle. Developmental Biology. 1993;158:183–199. doi: 10.1006/dbio.1993.1178. 10.1006/dbio.1993.1178. [DOI] [PubMed] [Google Scholar]
- Julian FJ, Moss RL. Effects of calcium and ionic strength on shortening velocity and tension development in frog skinned muscle fibres. The Journal of Physiology. 1981;311:179–199. doi: 10.1113/jphysiol.1981.sp013580. [DOI] [PMC free article] [PubMed] [Google Scholar]
- Larsson L, Xiaopeng L, Berg HE. Effects of removal of weight-bearing function on contractility and myosin isoform composition in single human skeletal muscle cells. Pflügers Archiv. 1996;432:320–328. doi: 10.1007/s004240050139. [DOI] [PubMed] [Google Scholar]
- McDonald KS, Fitts RH. Effect of hindlimb unweighting on single soleus fiber maximal shortening velocity and ATPase activity. Journal of Applied Physiology. 1993;74:2949–2957. doi: 10.1152/jappl.1993.74.6.2949. [DOI] [PubMed] [Google Scholar]
- McDonald KS, Fitts RH. Effect of hindlimb unloading on rat soleus fiber force, stiffness, and calcium sensitivity. Journal of Applied Physiology. 1995;79:1796–1802. doi: 10.1152/jappl.1995.79.5.1796. [DOI] [PubMed] [Google Scholar]
- Metzger JM, Moss RL. Shortening velocity in skinned single muscle fibers. Influence of filament lattice spacing. Biophysical Journal. 1987;52:127–131. doi: 10.1016/S0006-3495(87)83197-1. [DOI] [PMC free article] [PubMed] [Google Scholar]
- Narici MV, Kayser B, Barattini P, Cerretelli P. Changes in electrically evoked skeletal muscle contractions during 17-day spaceflight and bed rest. International Journal of Sports Medicine. 1997;18:S290–292. doi: 10.1055/s-2007-972729. [DOI] [PubMed] [Google Scholar]
- Reiser PJ, Kasper CE, Greaser ML, Moss RL. Functional significance of myosin transitions in single fibers of developing soleus muscle. American Journal of Physiology. 1988;254:C605–613. doi: 10.1152/ajpcell.1988.254.5.C605. [DOI] [PubMed] [Google Scholar]
- Reiser PJ, Kasper CE, Moss RL. Myosin subunits and contractile properties of single fibers from hypokinetic rat muscles. Journal of Applied Physiology. 1987;63:2293–2300. doi: 10.1152/jappl.1987.63.6.2293. [DOI] [PubMed] [Google Scholar]
- Reiser PJ, Moss RL, Giulian GG, Greaser ML. Shortening velocity in single fibers from adult rabbit soleus muscles is correlated with myosin heavy chain composition. Journal of Biological Chemistry. 1985;260:9077–9080. [PubMed] [Google Scholar]
- Riley DA, Bain JLW, Thompson JL, Fitts RH, Widrick JJ, Trappe SW, Trappe TA, Costill DL. Disproportionate loss of thin filaments in human soleus muscle after 17-day bed rest. Muscle and Nerve. 1998;21:1280–1289. doi: 10.1002/(sici)1097-4598(199810)21:10<1280::aid-mus6>3.0.co;2-7. [DOI] [PubMed] [Google Scholar]
- Roy RR, Hodgson JA, Aragon J, Day MK, Kozlovskaya I, Edgerton VR. Recruitment of the rhesus soleus and gastrocnemius before, during and after spaceflight. Journal of Gravitational Physiology. 1996;3:11–16. [PubMed] [Google Scholar]
- Schachat FH, Diamond MS, Brandt PW. Effect of different troponin T-tropomyosin combinations on thin filament activation. Journal of Molecular Biology. 1987;198:551–554. doi: 10.1016/0022-2836(87)90300-7. [DOI] [PubMed] [Google Scholar]
- Stevens L, Mounier Y. Ca2+ movements in sarcoplasmic reticulum of rat soleus fibers after hindlimb suspension. Journal of Applied Physiology. 1992;72:1735–1740. doi: 10.1152/jappl.1992.72.5.1735. [DOI] [PubMed] [Google Scholar]
- Sweeney HL, Kushmerick MJ, Mabuchi K, Sréter FA, Gergely J. Myosin alkali light chain and heavy chain variations correlate with altered shortening velocity of isolated skeletal muscle fibers. Journal of Biological Chemistry. 1988;263:9034–9039. [PubMed] [Google Scholar]
- Widrick JJ, Bangart JJ, Karhanek M, Fitts RH. Soleus fiber force and maximal shortening velocity after non-weight bearing with intermittent activity. Journal of Applied Physiology. 1996;80:981–987. doi: 10.1152/jappl.1996.80.3.981. [DOI] [PubMed] [Google Scholar]
- Widrick JJ, Norenberg KM, Romatowski JG, Blaser CA, Karhanek M, Sherwood J, Trappe SW, Trappe TA, Costill DL, Fitts RH. Force-velocity-power and force-pCa relationships of human soleus fibers after 17 days of bed rest. Journal of Applied Physiology. 1998;85:1949–1956. doi: 10.1152/jappl.1998.85.5.1949. [DOI] [PubMed] [Google Scholar]
- Widrick JJ, Romatowski JG, Bain JLW, Trappe SW, Trappe TA, Thompson JL, Costill DL, Riley DA, Fitts RH. Effect of 17 days of bed rest on peak isometric force and unloaded shortening velocity of human soleus fibers. American Journal of Physiology. 1997a;273:C1690–1699. doi: 10.1152/ajpcell.1997.273.5.c1690. [DOI] [PubMed] [Google Scholar]
- Widrick JJ, Romatowski JG, Norenberg KM, Gettleman G, Trappe SW, Trappe TADL, Fitts RH. Effect of spaceflight on peak force and maximal shortening velocity of human soleus fibers. Medicine and Science in Sports and Exercise. 1997b;29:S190. abstract. [Google Scholar]