

Abstract
To test whether sino-aortic denervation (SAD)-induced right ventricular hypertrophy (RVH) is a consequence of baroreceptor or chemoreceptor denervation, we compared the effects of aortic denervation (AD), carotid denervation (CD), SAD and a SAD procedure modified to spare the carotid chemoreceptors (mSAD), 6 weeks after denervation surgery in rats. A sham surgery group served as the control.
The blood pressure (BP) level was unaffected by AD, CD or SAD, but increased (9%) following mSAD. The mean heart rate level was not affected. Short-term BP variability was elevated following AD (81%), SAD (144%) and mSAD (146%), but not after CD. Baroreflex heart rate responses to phenylephrine were attenuated in all denervation groups.
Significant RVH occurred only following CD and SAD. These procedures also produced high mortality (CD and SAD) and significant increases in right ventricular pressures and haematocrit (CD).
Significant left ventricular hypertrophy occurred following CD, SAD and mSAD. Normalized left ventricular weight was significantly correlated with indices of BP variability.
These results suggest that SAD-induced RVH is a consequence of chemoreceptor, not baroreceptor, denervation. Our results also demonstrate that a mSAD procedure designed to spare the carotid chemoreceptors produced profound baroreflex dysfunction and significant left, but not right, ventricular hypertrophy.
Arterial baroreceptors provide an important contribution to the regulation of heart rate and the stabilization of arterial blood pressure. In the presence of cardiovascular diseases such as hypertension, impaired baroreflex function leads to a reduced cardiac baroreflex sensitivity and an increased blood pressure variability (Floras et al. 1988). Both of these changes have been linked with the severity of the underlying disease. Reduced baroreflex sensitivity has been demonstrated to predict the susceptibility of individuals to arrhythmias and sudden death following coronary occlusion or myocardial infarction (Farrel et al. 1992). Among hypertensive patients with similar blood pressure levels, the level of hypertensive cardiovascular structural damage has been shown to be more advanced in those patients with the highest levels of blood pressure variability (Pessina et al. 1985; Parati et al. 1987; Palatini et al. 1992; Frattola et al. 1993). However, it is not entirely clear from such studies whether impaired baroreflex function represents only a marker of cardiovascular disease, or if it also actively contributes to the progression of the disease. To address this question, we have begun to investigate the pathological consequences of baroreceptor denervation in rats (Van Vliet et al. 1996).
In a recent study, we found that the impairment of baroreflex function by sino-aortic denervation (SAD) was accompanied by the development of modest left ventricular hypertrophy despite negligible changes in the 24 h mean blood pressure level (Van Vliet et al. 1996). This result suggested that baroreflex dysfunction may provide an independent contribution to the structural changes commonly associated with hypertension or other cardiovascular diseases. An unexpected finding of this study was that SAD was accompanied by even greater hypertrophy of the right ventricle. One possible explanation for the occurrence of right ventricular hypertrophy is that it may be caused by SAD-induced hypoventilation (Franchini et al. 1994), which could subsequently lead to alveolar hypoxia, hypoxic pulmonary vasoconstriction and right ventricular hypertrophy (Ou & Smith, 1983). SAD-induced hypoventilation is likely to be the result of carotid body chemoreceptor denervation, as the traditional method of SAD (Krieger, 1964) uses both mechanical and chemical procedures to ensure complete denervation of the carotid bifurcation, and hypoventilation and hypoxaemia are also seen after cutting the carotid sinus nerve (Martin-Body et al. 1985; Huckstorf et al. 1987; Fletcher et al. 1992).
The main objective of the present study was to test the hypothesis that the right ventricular hypertrophy induced by the traditional SAD procedure was the result of carotid chemoreceptor denervation. To test this hypothesis, we compared the effect of different denervation procedures on right ventricular weight. We predicted that right ventricular hypertrophy should be produced by procedures that include carotid body denervation. Such procedures included extensive carotid denervation (CD) resulting in destruction of the carotid sinus baroreceptor and carotid body chemoreceptor afferent fibres, and traditional SAD (Krieger, 1964), which combines aortic denervation with extensive carotid denervation, thereby eliminating the carotid chemoreceptor and aortic and carotid sinus baroreceptor afferent fibres. In addition, we predicted that right ventricular hypertrophy should be absent following denervation procedures designed to spare the carotid body chemoreceptors and their innervation. Such procedures included aortic denervation (AD), which produces long-term baroreflex dysfunction (Franchini & Krieger, 1992) but has no effect on chemoreflex function (Franchini & Krieger, 1992, 1993) and a modified form of SAD (mSAD) in which a more discrete method of carotid denervation intended to produced adequate baroreceptor denervation while sparing the carotid body chemoreceptors was used.
METHODS
Experiments were performed on male Long-Evans rats obtained from a local outbred colony. During the experiments, rats were housed individually, maintained on a 12 h-12 h day-night cycle, and were provided with free access to tap water and rat chow containing 0.44% sodium, 0.95% potassium and 0.97% calcium. Rats were routinely provided with a plastic tube (4 inch diameter × 6 inch length) and paper towels for nesting. The procedures and protocols used in the study were approved by Memorial University of Newfoundland's Institutional Animal Care Committee.
Denervation procedures
Denervation procedures were performed on rats weighing 125-175 g using an aseptic technique with the aid of a heated table and binocular dissecting microscope. Rats were anaesthetized with a mixture of ketamine (70 mg kg−1i.m.) and xylazine (4 mg kg−1i.m.) and treated with a penicillin G procaine suspension (Wycillin, 50 000 U i.m.), atropine sulphate (0.5 mg kg−1i.p.) and hexamethonium chloride (10 mg kg−1i.p.) (Van Vliet et al. 1996). The anaesthesia was supplemented with an additional quarter-dose if the depth of anaesthesia became too light, i.e. if the rats responded to operative procedures or exhibited a withdrawal response to a toe pinch. Rats generally recovered from surgery without event or the need for specialized post-operative care. Although most rats assumed normal grooming and nesting behaviour within a day of surgery, a high proportion of rats undergoing extensive carotid denervation exhibited altered respiratory behaviour and did not resume normal nesting procedures. Such rats were provided with increased access to food, water and nesting materials, but no other specialized post-operative care. All rats were treated with hexamethonium bromide in the drinking water (2.25 g l−1) for 4 days to attenuate the acute hypertension that may follow baroreceptor denervation.
Phenol application
The phenol solution used in denervation procedures consisted of 10% phenol in absolute ethanol, to which Malachite Green (1 mg ml−1) had been added to improve visualization of the solution. To control for the use of phenol solution in procedures involving extensive carotid denervation, phenol solution was also applied to a 1 cm segment of each common carotid artery in rats undergoing denervation procedures that did not otherwise require phenol application. In all cases, application of phenol to an area was repeated twice, and followed by repeated blotting and flushing with saline. Great care was taken to prevent the spread of the phenol solution to adjacent tissues.
Aortic denervation (AD)
On each side of the rat, aortic baroreceptor pathways were interrupted by removing a 1 cm segment of the aortic-depressor nerve, cutting the superior laryngeal nerve at its origin from the nodose ganglion, and by removal of a 1 cm segment of the cervical sympathetic trunk. In addition, phenol solution was applied to 1 cm segments of the common carotid arteries at least 1 cm caudal to the carotid bifurcations.
Carotid denervation (CD)
On each side of the rat, the superior cervical ganglion was carefully removed, along with a 1 cm segment of the cervical sympathetic trunk. This step was considered necessary to control for the cervical sympathectomy performed in all other denervation procedures. This procedure alone is unlikely to produce significant denervation of the aortic baroreceptors since their main pathways (the vagal trunk, and aortic-depressor and superior laryngeal nerves (Andrew, 1954)) were left undisturbed. The region of the carotid bifurcation was denervated by careful mechanical stripping of the adventitia from the vessels, extending approximately 5 mm along the internal, external and common carotid arteries. The region was then painted with 10% phenol in absolute ethanol. The phenol solution was then flushed from the region with saline, and the entire procedure was repeated on the other side of the rat.
Sino-aortic denervation (SAD)
This was achieved by combining the procedures for AD and CD, outlined above, except that the phenol solution was applied only to the carotid bifurcation.
Modified sino-aortic denervation (mSAD)
This method combined AD with a modified form of CD designed to preserve the carotid body chemoreceptors and their innervation. This method of CD consisted of mechanical stripping of the connective tissue and adventitia in discrete regions of the internal, external and common carotid arteries. By relying on mechanical stripping without the use of phenol solutions, the extent of the denervated region could be well controlled. Anatomical descriptions of the innervation of the carotid bifurcation in Long-Evans rats (McDonald, 1983) indicate that carotid baroreceptor and chemoreceptor fibres pass together to the carotid body, situated in the angle of the carotid bifurcation, from which the baroreceptor fibres then continue to the walls of the adjacent carotid arteries. The baroreceptor innervation is said to be most dense on the dorsolateral surface of the carotid sinus (McDonald, 1983). To avoid disturbing the carotid body and its innervation, mechanical stripping of the adventitia was restricted to the outermost three-quarters of the circumference of the internal and external carotid arteries, and the full circumference of the common carotid artery. This left a narrow strip of intact adventitia on the innermost opposing surfaces of the internal and external carotid arteries. Care was taken to minimize disturbance of the tissues situated between the two arteries. The mechanical stripping procedure was applied to approximately the first 5 mm of the internal, external and common carotid arteries.
Experimental protocol
Four weeks after denervation or sham surgery, blood pressure telemeters were implanted intraperitoneally with the catheter situated in the abdominal aorta immediately above the iliac bifurcation as previous described (Van Vliet et al. 1996), except that sodium pentobarbitone (55 mg kg−1) was routinely used as the anaesthetic agent. Supplemental quarter-doses of anaesthetic were administered as required to maintain adequate anaesthesia, defined as the lack of any responses to operative procedures and the absence of a withdrawal response to a toe pinch. Rats generally recovered without event or the need for specialized post-operative care, and assumed normal grooming and nesting behaviours within a day of surgery. Rats were housed in separate cages in a haemodynamic monitoring room within 4 days of telemeter implantation, and haemodynamic monitoring was performed by telemetry 12-14 days after telemeter implantation, 6 weeks following the original denervation surgery.
At the end of haemodynamic monitoring, rats were anaesthetized with a combination of sodium pentobarbitone (27 mg kg−1i.p.) and chloralose (1 ml (100 g)−1i.p. of a 0.5% solution maintained at 37°C). A supplemental one-third dose of chloralose was given as required to eliminate responses to a toe pinch or operative procedures. The femoral artery and vein were cannulated with PE50 and PE10 polyethylene catheters for blood pressure monitoring and drug administration, respectively. All pressures and events were recorded on a personal microcomputer using a general-purpose commercial data acquisition system (MP100, Biopac Systems, Goleta, CA, USA). A 500 μl venous blood sample was collected for the determination of haematocrit. The right jugular vein was then cannulated with a PE50 polyethylene catheter, which was advanced into the right ventricle for the measurement of right ventricular systolic blood pressure. In order to assess the baroreflex control of heart rate, an intravenous injection of phenylephrine hydrochloride (10 μg kg−1) was administered, and the peak blood pressure and heart rate responses were noted.
After deepening the anaesthetic level, the blood pressure telemeter was removed and abdominal aorta was then cannulated with a wide bore catheter to facilitate fixation of the heart. Hearts arrested with KCl were fixed by pressurized (∼80 mmHg) perfusion with phosphate-buffered physiological saline (5 min) followed by 10% neutral buffered formalin solution (15 min). Hearts were stored in 10% neutral buffered formalin until determination of left and right ventricular weights as previously described (Van Vliet et al. 1996). Ventricular weights are expressed as the total (fixed) ventricular weight per 100 g body weight.
Processing and analysis of telemetered haemodynamics
The calibrated output of an analog telemetry signal adapter (model R11CPA, Data Sciences, St Paul, MN, USA) corrected for ambient barometric pressure was processed with the use of the previously described data acquisition system and software (Montani et al. 1995), which was configured for use with rats. The system was set to sample the blood pressure waveform at 500 Hz in 3 s bursts. The program immediately computed the average systolic, diastolic and mean blood pressure and heart rate values within this sampling period, and then recorded this information on disk. The sampling protocol was repeated every 30 s (2880 samples per day). A 48 h segment of data was analysed using software written in-house, which provided descriptive statistics of the blood pressure distribution, including the means and various percentile values. Reported values of systolic, diastolic and mean blood pressure and heart rate represent the mean of 5760 individual measurements over the 48 h recording period. Hereafter, this long-term mean value of the mean blood pressure level will be referred to simply as the blood pressure level. The 1st and 99th percentiles of the blood pressure distribution were used as measures of the minimum and maximum blood pressure. In addition, the program separated the 48 h data set into a series of 96 half-hour periods. The standard deviation (s.d.) and coefficient of variation (c.v.) of blood pressure were calculated for each half-hour period. The mean s.d. of blood pressure was used a measure of the short-term variability of blood pressure, i.e. the extent of the variation in blood pressure within half-hour periods (Parati et al. 1987; Van Vliet et al. 1996). In addition, we also calculated the s.d. and c.v. of the 96 half-hourly mean blood pressure values and used the s.d. as a measure of the long-term variability of blood pressure, i.e. the extent of the variation in blood pressure between half-hour periods (Parati et al. 1987; Van Vliet et al. 1996). Similar calculations were performed for heart rate.
Pressure calibration of the telemeters was performed in vitro before installation, and these values were used 2 weeks later to provide a calibrated output from the telemetry equipment during the period of haemodynamic monitoring. The telemeters were calibrated again within 24 h of their removal, and this second set of calibration values was used to correct any drift in the offset or sensitivity of the telemeter that had occurred since their initial calibration. The absolute drift in telemeter offset and sensitivity amounted to 3.1 ± 0.3 mmHg and 1.6 ± 0.1% of scale (n = 89). The mean drift in telemeter offset and sensitivity amounted to -1.7 ± 0.4 mmHg and 0.72 ± 0.21% of scale (n = 89).
Statistics and data analysis
Data values are reported as the means ±s.e.m. The effect of the denervation procedure was assessed using analysis of variance. The Student-Newman-Keuls test was used to resolve differences from the sham group for variables in which the analysis of variance indicated a significant treatment effect. The ventricular weight data of two individual rats were excluded from analysis because the normalized weight of the right or left ventricle was at least 3 s.d. above or below the mean value for their denervation group. P < 0.05 was used as the limit of statistical significance.
RESULTS
Telemetered haemodynamics
Table 1 provides a summary of telemetered blood pressure data obtained by telemetry at the end of the fifth week following each of the denervation procedures. The blood pressure level in rats undergoing the mSAD procedure was significantly elevated above the corresponding levels in sham-operated rats (Fig. 1). The blood pressure levels of the other denervation groups were not significantly affected. Analysis of variance indicated no significant differences in pulse pressure (Table 1).
Table 1.
Effect of denervation procedures on telemetered blood pressures
| Sham (n = 21) | AD (n = 18) | mSAD (n = 18) | SAD (n = 18) | CD (n = 14) | ANOVA P value | |
|---|---|---|---|---|---|---|
| Means | ||||||
| BP (mmHg) | 102 ± 1 | 104 ± 2 | 111 ± 2* | 103 ± 1 | 104 ± 2 | 0.001 |
| SBP (mmHg) | 123 ± 1 | 123 ± 2 | 131 ± 2* | 122 ± 2 | 123 ± 2 | 0.005 |
| DBP (mmHg) | 86 ± 1 | 88 ± 1 | 94 ± 2* | 88 ± 1 | 88 ± 2 | 0.002 |
| PP (mmHg) | 37 ± 1 | 35 ± 1 | 37 ± 1 | 34 ± 1 | 35 ± 2 | 0.212 |
| BP variability | ||||||
|---|---|---|---|---|---|---|
| Short-term BP variability (mmHg) | 5.7 ± 0.1 | 10.3 ± 0.3* | 14.0 ± 1.0* | 13.9 ± 1.1* | 5.8 ± 0.1 | < 0.001 |
| Long-term BP variability (mmHg) | 6.5 ± 0.3 | 6.1 ± 0.4 | 7.3 ± 0.3 | 7.1 ± 0.4 | 6.5 ± 0.6 | 0.170 |
| 24 h BP distribution statistics | ||||||
|---|---|---|---|---|---|---|
| Minimum BP (1st percentile, mmHg) | 85 ± 1 | 70 ± 1* | 70 ± 2* | 66 ± 1* | 85 ± 1 | < 0.001 |
| Maximum BP(99th percentile, mmHg) | 122 ± 2 | 131 ± 2* | 148 ± 3* | 142 ± 3* | 125 ± 3 | < 0.001 |
| BP range (99th – 1st percentiles, mmHg) | 37 ± 1 | 61 ± 2* | 77 ± 4* | 75 ± 4* | 40 ± 2 | < 0.001 |
| BP day–night difference | ||||||
|---|---|---|---|---|---|---|
| Mid-day BP (mmHg) | 99 ± 1 | 101 ± 2 | 106 ± 2* | 99 ± 2 | 100 ± 2 | < 0.006 |
| Mid-evening BP (mmHg) | 106 ± 1 | 107 ± 2 | 115 ± 2* | 106 ± 2 | 107 ± 1 | < 0.001 |
| Day–night BP difference (mmHg) | 7.1 ± 0.6 | 5.7 ± 0.9 | 8.7 ± 0.8 | 6.8 ± 1.0 | 7.9 ± 0.6 | 0.098 |
BP, blood pressure; DBP, diastolic blood pressure; HR, heart rate; PP, pulse pressure; SBP, systolic blood pressure.
P < 0.05 compared with the sham group.
Figure 1. Mean blood pressure (BP) levels among the five groups, 6 weeks after surgery.
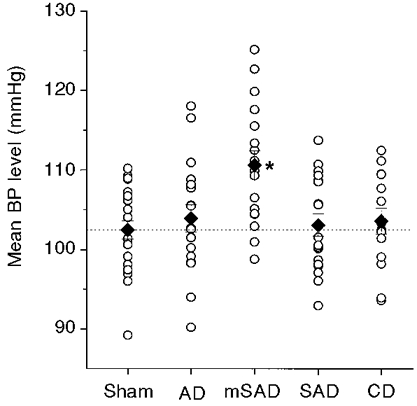
The mean BP represents the mean of 5760 samples obtained at 30 s intervals over a 48 h period using BP telemetry. ○, individual data points; ♦, group means. The interrupted line indicates the mean BP level in the sham group. * Significantly different from the sham group.
The short-term variability of blood pressure was significantly elevated in the three groups that included aortic denervation: AD, SAD and mSAD (Fig. 2, Table 1). Sino-aortic denervation resulted in a 2.4-fold increase in short-term blood pressure variability relative to the sham group, irrespective of whether the traditional (SAD) or modified (mSAD) procedure was used. Aortic denervation produced a more modest 1.8-fold increase in short-term blood pressure variability, which was significantly less than that produced by the SAD and mSAD procedures (P = 0.004 and 0.003, respectively). Short-term blood pressure variability was not affected by CD. Analysis of variance indicated no significant effect of denervation on the long-term blood pressure variability (P = 0.17; Table 1). With the exception of the CD group, denervation procedures were associated with significantly increased maximum (Fig. 3) and decreased minimum blood pressures, resulting in a marked increase in the range of blood pressure values recorded over a 48 h period (Table 1). Day-night differences in blood pressure were not significantly affected by any of the denervation procedures.
Figure 2. Short-term blood pressure (BP) variability among the five groups, 6 weeks after surgery.
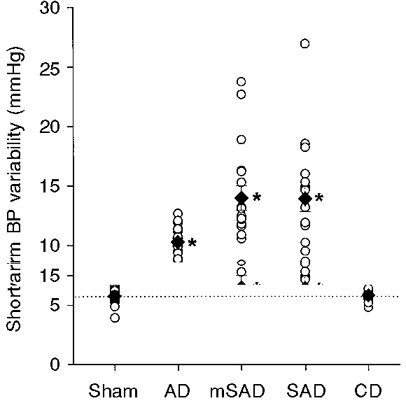
The short-term BP variability was calculated as the average standard deviation of BP values within 96 individual half-hour periods over the course of a 48 h recording. The interrupted line indicates the mean level of short-term BP variability in the sham group. * Significantly different from the sham group.
Figure 3. Peak blood pressure (BP) level in the five groups, 6 weeks after surgery.
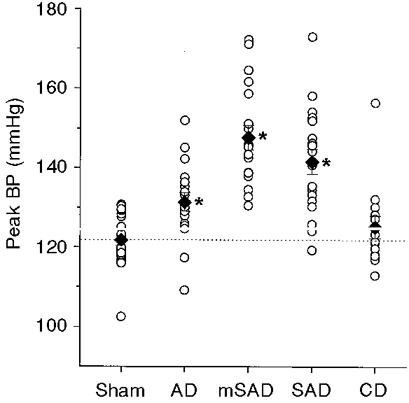
The peak BP level was determined as the BP level corresponding to the top 1 percentile of 5760 BP samples obtained over a 48 h period. ○, individual data points; ♦, group means. The interrupted line indicates the mean peak BP level of the sham group. * Significantly different from the sham groups.
There were no differences in mean heart rate level or the short-term variability of heart rate between groups except in the CD group, in which the short-term variability of heart rate was significantly increased (Table 2). The long-term variability of heart rate and the range of heart rate were significantly elevated after all denervation procedures, relative to the sham-denervated group (Table 2).
Table 2.
Effect of denervation procedures on telemetered heart rate
| Sham (n = 21) | AD (n = 18) | mSAD (n = 18) | SAD (n = 18) | CD (n = 14) | ANOVA P value | |
|---|---|---|---|---|---|---|
| Mean HR (beats min−1) | 390 ± 2 | 403 ± 6 | 397 ± 2 | 392 ± 6 | 385 ± 5 | 0.064 |
| HR variability | ||||||
|---|---|---|---|---|---|---|
| Short-term HR variability (beats min−1) | 29 ± 1 | 31 ± 1 | 30 ± 1 | 33 ± 1 | 38 ± 1* | < 0.001 |
| Long-term HR variability (beats min−1) | 53 ± 2 | 62 ± 2* | 64 ± 2* | 65 ± 2* | 63 ± 2* | < 0.001 |
| 24 h HR distribution statistics | ||||||
|---|---|---|---|---|---|---|
| Minimum HR (1st percentile, beats min−1) | 300 ± 4 | 298 ± 7 | 289 ± 3 | 282 ± 6* | 278 ± 6* | 0.026 |
| Maximum HR (99th percentile, beats min−1) | 506 ± 4 | 528 ± 5* | 522 ± 3* | 522 ± 6* | 519 ± 6 | 0.014 |
| HR range (99th – 1st percentiles, beats min−1) | 207 ± 6 | 228 ± 4* | 233 ± 5* | 239 ± 4* | 240 ± 5* | < 0.001 |
| HR day–night difference | ||||||
|---|---|---|---|---|---|---|
| Mid-day HR (beats min−1) | 349 ± 3 | 354 ± 7 | 341 ± 5 | 344 ± 6 | 335 ± 4 | 0.198 |
| Mid-evening HR (beats min−1) | 430 ± 3 | 455 ± 7* | 443 ± 5 | 438 ± 8 | 437 ± 7 | 0.045 |
| Day–night HR difference (beats min−1) | 81 ± 5 | 102 ± 6 | 102 ± 9 | 94 ± 5 | 102 ± 6 | 0.053 |
HR, heart rate.
P < 0.05 compared with the sham group.
Ventricular weights
The effects of each denervation procedure on ventricular weights are illustrated in Figs 4 and 5. Left ventricular weights were significantly increased in the mSAD, SAD and CD groups (Fig. 4). Right ventricular weights were significantly elevated in the SAD and CD groups (Fig. 5).
Figure 4. Left ventricular weights in the five groups, 6 weeks after surgery.
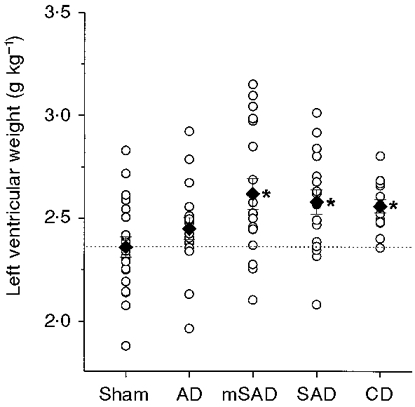
The weights are normalized to body weight. ○, individual data points; ♦, group means. The interrupted line indicates the mean left ventricular weight in the sham group. n = 21, 17, 18, 17 and 14 in the Sham, AD, mSAD, SAD and CD groups, respectively. * Significantly different from the sham group.
Figure 5. Right ventricular weights in the five groups, 6 weeks after surgery.
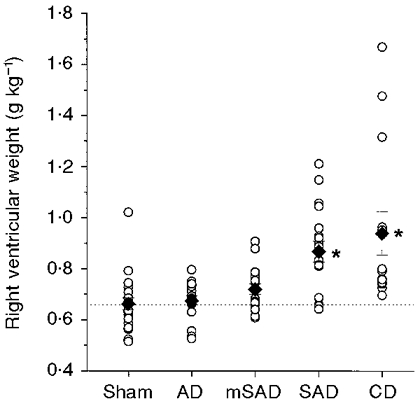
The weights are normalized to body weight. ○, individual data points; ♦, group means. The interrupted line indicates the mean right ventricular weight in the sham group. n = 21, 17, 18, 17 and 14 in the Sham, AD, mSAD, SAD and CD groups, respectively. * Significantly different from the sham groups.
Haemodynamic correlates of left ventricular hypertrophy
Regression analysis was performed to investigate the potential haemodynamic factors that correlate with the left ventricular hypertrophy induced by baroreceptor-denervation. Analysis was confined to the sham, AD and mSAD groups to avoid the potentially confounding effects of right ventricular hypertrophy present in the CD and SAD groups. A summary of the results is presented in Table 3.
Table 3.
r values for the correlation between normalized left ventricular weight and haemodynamic indices
| Variable | Sham | AD | mSAD | Sham + AD + mSAD |
|---|---|---|---|---|
| Mean BP | −0.36 | 0.19 | −0.08 | 0.18 |
| Peak BP (99%) | −0.37 | 0.37 | 0.26 | 0.42* |
| Peak BP (75%) | −0.36 | 0.20 | 0.06 | 0.26 |
| BP range (99–1%) | −0.18 | 0.47 | 0.44 | 0.49* |
| BP range (75–25%) | −0.16 | 0.18 | 0.38 | 0.40* |
| Short-term S.D.BP | −0.26 | 0.17 | 0.33 | 0.44* |
| Short-term C.V.BP | −0.13 | 0.07 | 0.38 | 0.45* |
| Long-term S.D.BP | −0.15 | 0.35 | 0.41 | 0.29* |
| Long-term C.V.BP | −0.07 | 0.30 | 0.41 | 0.22 |
| Group size | 21 | 18 | 18 | 56 |
| rcrit | ±0.43 | ±0.47 | ±0.47 | ±0.26 |
rcrit, r value for which P = 0.05.
P < 0.05.
Several measures of blood pressure variability and range were positively and significantly correlated with normalized left ventricular weight when the sham, AD and mSAD groups were combined for analysis (Table 3). Measures of variability and range were particularly well correlated with left ventricular weight (Table 3, Fig. 6). When individual groups were used for analyses, the various haemodynamic measures were insignificantly correlated with left ventricular mass. In the case of the sham group, these weak correlations tended to be negative. The long-term mean blood pressure level did not correlate with normalized left ventricular weight in any group or combination of groups.
Figure 6. Scatter plots showing the relationship between left ventricular weight (LVW) and mean blood pressure level (mean BP), the daily peak BP level (peak BP) and the short-term blood pressure variability (BPV).
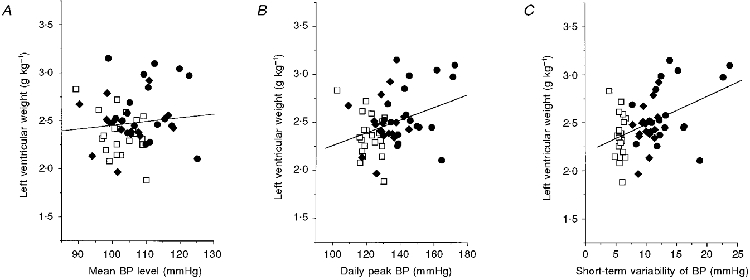
Data from the sham (□), AD (♦) and mSAD (•) groups are included (n = 56). The continuous lines represent the regression line for each scatter plot. The regression equations were: LVW = 0.007 mean BP + 1.75 (P = 0.19, r = 0.18), LVW = 0.008 peak BP + 1.4 (P = 0.001, r = 0.42), and LVW = 0.03 BPV + 2.2 (P = 0.001, r = 0.44).
Mortality
Procedures involving extensive denervation of the carotid bifurcation (CD, SAD) were associated with considerable mortality (Table 4). Although some of these rats died abruptly during denervation of the second carotid bifurcation, most deaths occurred several days after recovery from anaesthesia. All rats that died after recovery from anaesthesia exhibited a characteristic pattern of behaviour. This pattern consisted of relative inactivity (grooming, but not nest building), progressive weight loss, and slow deep breathing or gasping. However, no animals were found in a moribund state, suggesting that their death came suddenly. This characteristic pattern of behaviour was not observed in any rat that survived the full 6 week recovery period.
Table 4.
Effect of denervation procedures on mortality, phenylephrine response, haematocrit, right ventricular systolic pressure (RVSP) and body weight
| Sham | AD | mSAD | SAD | CD | ANOVA P value | |
|---|---|---|---|---|---|---|
| Mortality | 0/21 | 1/19 | 0/18 | 12/30 | 5/19 | — |
| Increase in BP following phenylephrine (mmHg) | 48 ± 3 | 59 ± 3 | 55 ± 4 | 48 ± 3 | 52 ± 4 | 0.28 |
| Fall in HR following phenylephrine (beats min−1) | 57 ± 7 | 8 ± 3* | 12 ± 3* | 10 ± 9* | 27 ± 7* | < 0.001 |
| Haematocrit (%) | 40.6 ± 0.4 | 41.7 ± 0.7 | 40.5 ± 0.8 | 42.6 ± 0.6 | 43.7 ± 0.7* | 0.004 |
| RVSP (mmHg) | 31 ± 2 | 30 ± 3 | 28 ± 1 | 34 ± 3 | 44 ± 7* | 0.022 |
| (n = 14) | (n = 8) | (n = 11) | (n = 13) | (n = 10) | ||
| Weight at first surgery (g) | 145 ± 3 | 146 ± 4 | 140 ± 2 | 154 ± 5 | 146 ± 4 | 0.130 |
| Final body weight (g) | 374 ± 6 | 336 ± 8* | 325 ± 7* | 341 ± 8* | 367 ± 10 | < 0.001 |
P < 0.05 compared with the sham group.
Phenylephrine challenge, right ventricular systolic pressure and haematocrit
Right ventricular systolic pressure (RVSP) and haematocrit (venous) were measured in each rat under anaesthesia at the end of each experiment. In addition, each rat was tested for its response to phenylephrine (10 μg kg−1i.v.). As shown in Table 4, all denervation groups responded to phenylephrine with an approximate 50 mmHg increase in blood pressure. The marked fall in heart rate that was observed in sham-denervated rats was significantly attenuated in all denervated groups. Haematocrit and RVSP were significantly increased in the CD group (Table 4).
Body weight
There were no significant differences in body weight at the time of the denervation surgery (Table 4). Six weeks after surgery, the body weight of sham-operated rats had increased from 145 ± 3 to 374 ± 6 g (Table 4). Relative to sham-operated rats, a significant reduction in final body weight occurred in groups of rats that underwent aortic denervation (AD, mSAD and SAD) (Table 4). The final body weight of the CD group was not significantly different from that of the sham group.
DISCUSSION
Effect of denervation procedures on right ventricular hypertrophy
The main objective of the present study was to test the hypothesis that the right ventricular hypertrophy that we previously observed following SAD in the rat was a consequence of chemoreceptor, and not baroreceptor, denervation. The differences observed in right ventricular weights between the denervation groups were consistent with this hypothesis. Significant increases in right ventricular weight occurred only in the CD and SAD groups, being absent in the AD and mSAD groups (Fig. 5). Thus the occurrence of right ventricular hypertrophy was associated only with procedures that included extensive carotid denervation.
The carotid body is thought to contain the main population of oxygen-sensitive chemoreceptors in the rat, with minor additional contributions from abdominal paraganglia and possibly the central nervous system (Cardenas & Zapata, 1983; Martin-Body et al. 1985, 1986). Aortic chemoreceptors appear to be negligible in this species (Sapru & Krieger, 1977; Martin-Body et al. 1986; Franchini & Krieger, 1992, 1993). Relative to a number of other common mammals, the carotid body chemoreceptors in the rat provide an unusually high level of hypoxic respiratory drive, estimates ranging as high as 30% (Hayashi et al. 1983). Carotid denervation results in severely impaired chemoreflex function (Cardenas & Zapata, 1983; Martin-Body et al. 1985, 1986; Huckstorf et al. 1987; Franchini & Krieger, 1993; Lagneaux & Lecomte, 1994; B. N. Van Vliet & L. Chafe, unpublished observations) and reduced respiratory drive (Hayashi et al. 1983) resulting in chronic hypoxaemia, hypercapnoea and acidosis (Martin-Body et al. 1985; Huckstorf et al. 1987; Franchini & Krieger, 1992; Franchini et al. 1994). Hypoxaemia has also been described following SAD (Franchini et al. 1994). Thus the right ventricular hypertrophy associated with CD and SAD procedures may result from the severe respiratory changes that are known to follow these procedures. More specifically, we propose that the CD- and SAD-induced right ventricular hypertrophy occurs as a consequence of the pulmonary hypertension produced by hypoxic pulmonary vasoconstriction in response to hypoventilation-induced alveolar hypoxia (Ou & Smith, 1983).
Our conclusions are based partly on the absence of right ventricular hypertrophy in the mSAD group, and on the assumption that the carotid bodies were spared by the mSAD procedure. Although we did not systematically test all denervation groups for chemoreceptor function, tests performed on a subgroup of mSAD rats from this study 6 weeks after denervation under pentobarbitone-chloralose anaesthesia found that their ventilatory response to a 30 s exposure to 8% O2 (19 ± 3% increase in ventilatory frequency, n = 13) was statistically equivalent to that of sham-operated rats (23 ± 4% increase in ventilatory frequency, n = 12). This result is also consistent with the significant increases in haematocrit in the CD group, which is presumed to represent a response to chronic hypoxaemia. Although haematocrit also tended to be increased in the SAD group, this tendency did not reach statistical significance.
In the CD group, right ventricular hypertrophy was also accompanied by a significant elevation of the RVSP. Taken together with the significant increase in haematocrit, these findings are consistent with the presence of chronic hypoxaemia and fixed pulmonary hypertension in this group. Surprisingly, neither the haematocrit nor RVSP were significantly elevated in the SAD group despite the presence of significant right ventricular hypertrophy. The lack of a significant increase in RVSP suggests that right ventricular hypertrophy was not the result of fixed (i.e. structural) pulmonary hypertension in SAD rats, but does not rule out the possibility that transient pulmonary hypertension may occur in association with the most severe periods of hypoventilation over the course of a day. This possibility is supported by reports that intermittent alveolar hypoxia is sufficient to produce right ventricular hypertrophy in rats (Ostadal et al. 1981) and that, in addition to the chronic hypoventilation that occurs in the waking state, more profound ventilatory disturbances (ventilatory arrhythmias, end expiratory pauses, apnoeas) occur during rapid eye movement sleep in SAD and CD rats (Hofer, 1985). However, it remains unclear why the CD and SAD groups should differ in these regards, since the SAD procedure should produce the same degree of chemoreceptor denervation as the CD procedure, if not greater. It is possible that these results reflect an effect of the extent of baroreceptor denervation on the ventilatory effects produced by chemoreceptor denervation.
Effect of denervation procedures on mortality
Our results suggest that carotid body denervation is responsible for mortality following the SAD procedure. Marked mortality rates occurred in groups that included extensive carotid denervation: 40% in SAD, and 26% in CD rats. High mortality rates have also been described by other investigators following SAD in adult rats (33%; Krieger, 1964) and following CD or SAD in neonatal rats (up to 59%; Hofer, 1984; Shair & Myers, 1997). In contrast to the mortality rates produced by the CD and SAD procedures, we found mortality to be low or absent in rats in which the chemoreceptors were spared: 0% in the mSAD procedure, and 5% in AD rats. It was notable that the AD and CD procedures appeared to interact to produce even higher rates of mortality when combined (5% in AD, 26% in CD, and 40% in SAD). This is surprising considering the negligible mortality following AD and the apparent absence of chemoreceptors in the aortic nerve of the rat (Sapru & Krieger, 1977; Martin-Body et al. 1986; Franchini & Krieger, 1992, 1993). However, a similar interaction between AD and CD to increase mortality has been reported in neonatal rats (Hofer, 1985).
The literature suggests that the occurrence of CD- and SAD-induced mortality is variable from study to study. Thus whereas 33-40% mortality has been described in adult rats following SAD in the present and in a previous study (Krieger, 1964), mortality was reportedly absent in a study by Haun & Alexander (1985) unless SAD was combined with lesioning of the fastigial nucleus. Similarly, we found that there was no mortality associated with the traditional SAD procedure in a previous study involving twenty rats from the same outbred Long-Evans colony used in the present study (Van Vliet et al. 1996). Finally, the incidence of CD-induced mortality was reported to be age dependent in neonatal rat pups, being restricted to pups less than 3 weeks of age (Hofer, 1984; Shair & Myers, 1997). Together, these results demonstrate that increased mortality is a variable, and certainly not inevitable, consequence of extensive CD or SAD.
Effect of denervation procedures on left ventricular hypertrophy
In a previous study, we described the presence of significant left ventricular hypertrophy following SAD in rats (Van Vliet et al. 1996). The physiological significance of the left ventricular hypertrophy in that study was not clear because of the presence of an even more profound right ventricular hypertrophy that appears to be a consequence of chemoreceptor denervation (see above). The results of the present study are therefore important in that they demonstrate that baroreceptor denervation induced modest left ventricular hypertrophy in the mSAD group (Fig. 4), in which right ventricular hypertrophy was absent (Fig. 5).
Although a number of previous studies have demonstrated various forms of cardiovascular damage following baroreceptor denervation in experimental animals (Boyd & McCullagh, 1938; Dammin et al. 1956; Krieger, 1964; Orfila et al. 1993), this is the only study so far to take special precautions to consider the potential contribution of chemoreceptor denervation to the results. This is an important distinction, since significant left ventricular hypertrophy was also produced by extensive denervation of the carotid bifurcation, even though the long-term mean blood pressure level and short-term blood pressure variability were not chronically affected.
A second unique aspect of the present study is that it rules out the possibility that the left ventricular hypertrophy induced by baroreceptor denervation may be a consequence of a sustained increase in the mean blood pressure level. Although the long-term mean blood pressure level was significantly elevated in the mSAD group, we found left ventricular hypertrophy to be correlated with several indices of blood pressure variability (Table 3; Fig. 6B and C), but not the long-term mean blood pressure level (Fig. 6A). In clinical studies in which blood pressure variability has been linked to hypertensive target organ damage, this linkage was established, in part, by comparing the target organ damage of patients who had similar blood pressure levels, but were divided into groups of high and low blood pressure variability (Pessina et al. 1985; Parati et al. 1987; Palatini et al. 1992). A similar method was used in our previous study to demonstrate that the increase in left ventricular weight following baroreceptor denervation was significant even when subgroups of denervated and sham-operated rats with equivalent long-term mean blood pressure levels were compared (Van Vliet et al. 1996). A similar result can be obtained if we repeat this analysis using our present data. For subgroups of mSAD (n = 10) and sham (n = 13) rats selected on the basis of their mean blood pressure levels (105 ± 1 vs. 105 ± 1 mmHg, P = 0.86), significant left ventricular hypertrophy (2.64 ± 0.28 vs. 2.38 ± 0.18 g kg−1, P < 0.03), increased short-term blood pressure variability (12.2 ± 2.2 vs. 6.0 ± 0.4 mmHg, P < 0.001), and increased maximum blood pressure levels (140 ± 6 vs. 126 ± 4 mmHg, P < 0.001) persist in the mSAD compared with the sham rats, despite the equivalence of the long-term mean blood pressure level in the two subgroups. Taken together with the lack of correlation of the long-term mean blood pressure level with normalized left ventricular weight, our results suggest that the modest left ventricular hypertrophy that follows baroreceptor denervation is independent of the final blood pressure level.
Effect of denervation procedures on the mean blood pressure level
We took a number of precautions in this study to minimize the effect of environmental stress on the measured blood pressure levels of our rats. These precautions included the use of telemetry, which permitted the blood pressure signal to be recorded in the rat's home cage and room without tethers or restraint. Furthermore, we reported the long-term (48 h) mean blood pressure level, which may reduce the impact of arousal or other short-term factors on the blood pressure level (Norman et al. 1981). Using this approach we found that, with the exception of the mSAD group, denervation procedures had very little effect on the long-term mean blood pressure level. The absence of an increase in blood pressure level in rats undergoing the traditional SAD procedure is slightly at odds with our previous study in which a slight (5%) but significant increase in pressure was noted (Van Vliet et al. 1996). This relatively small discrepancy may be related to small changes in our protocol: for example, we used an increased recovery time following telemeter implantation in the present study (from 8 to 12 days), and we housed the rats individually in the present study, rather than in pairs. Our finding of no chronic increase in the level of blood pressure following SAD is well within the spectrum of results reported by other investigators who, using chronic catheters installed in chronically denervated rats, have described moderate (≤ 10%) increases (e.g. Trisdale & Krieger, 1984; Buchholz et al. 1986; Osborn, 1991) or decreases (Osborn & England, 1990; Osborn & Provo, 1992) in the mean blood pressure level, or no change (Norman et al. 1981; Franchini & Krieger, 1992).
In contrast to the controversy associated with SAD, most studies have described sustained increases in the level of blood pressure following AD (e.g. Fink et al. 1980, 1981; Franchini & Krieger, 1992). In the present study, however, we found no evidence for a hypertensive effect of AD, despite clear evidence of baroreflex dysfunction in the form of increased blood pressure variability and attenuated heart rate responses to phenylephrine. It should be noted that no change in the mean blood pressure level was also reported by Osborn & England (1990). These discrepancies are unlikely to be due to differences in the methodology used to assess the blood pressure level, as at least one study reported a significant (15%) increase in the level of blood pressure using similar precautions to our own: long-term (72 h) direct recordings of blood pressure performed 2-7 days following catheter implantation, 10 weeks following denervation surgery (Fink et al. 1981). Nor are they easily explained by differences in rat strain as both Osborn & England (1990) and Fink et al. (1981) used rats of the Sprague-Dawley strain (albeit not from the same supplier), yet obtained contradictory results. Thus the source of the discrepancy between studies remains unresolved. In any case, however, our results, along with those of Osborn & England (1990), demonstrate that hypertension is not an inevitable consequence of AD in rats.
In contrast with the CD, AD and SAD groups, we did find a significant increase in the mean blood pressure level in the mSAD group. We have no previous data with which to compare this result since, to the best of our knowledge, this is the first report of combined denervation of the aortic and carotid sinus baroreceptors using procedures intended to spare the carotid body chemoreceptors in rats. The increased level of blood pressure in mSAD rats, but not in SAD rats, is consistent with the suggestion of Franchini & Krieger (1992) that chemoreceptor denervation is capable of moderating a hypertensive effect of baroreceptor denervation. In a detailed comparison of the effect of different denervation procedures on the level of blood pressure, they found significant increases (9%) following chronic (20 days) AD, significant decreases (11%) following chronic CD, and no significant change following chronic SAD (Franchini & Krieger, 1992). They suggested that baroreceptor and chemoreceptor denervation had opposite effects on blood pressure level, and that these effects were additive: CD lowered the level of blood pressure as a consequence of carotid body denervation, and AD increased the blood pressure level as a consequence of baroreceptor denervation. When combined (i.e. SAD), the two procedures had little effect on the level of blood pressure. Subsequently, Franchini et al. (1994) provided evidence that the hypotensive effect of CD may be mediated by hypoxaemia. Though this explanation is consistent with the results that we have obtained in the mSAD group, it is not consistent with the normal blood pressure levels found in the AD and CD groups in the present study. Irrespective of the cause of the hypertension in mSAD rats, it is important to consider that the magnitude of the increase in blood pressure level in this group was relatively modest (9%). According to our correlational analysis, this modest increase in the long-term mean blood pressure level was without effect on left ventricular weight.
Acknowledgments
This research was supported by grants from the Medical Research Council of Canada and the Heart and Stroke Foundation of New Brunswick.
References
- Andrew BL. A laryngeal pathway for aortic baroreceptor impulses. The Journal of Physiology. 1954;125:352–360. doi: 10.1113/jphysiol.1954.sp005163. [DOI] [PMC free article] [PubMed] [Google Scholar]
- Boyd JD, McCullagh GP. Experimental hypertension following carotico-aortic denervation in the rabbit. Quarterly Journal of Experimental Physiology. 1938;27:293–307. [Google Scholar]
- Buchholz RA, Hubbard JW, Nathan MA. Comparison of 1-hour and 24-hour pressure recordings in central or peripheral baroreceptor-denervated rats. Hypertension. 1986;8:1154–1163. doi: 10.1161/01.hyp.8.12.1154. [DOI] [PubMed] [Google Scholar]
- Cardenas H, Zapata P. Ventilatory reflexes originating from carotid and extracarotid chemoreceptors in rats. American Journal of Physiology. 1983;244:R119–125. doi: 10.1152/ajpregu.1983.244.1.R119. [DOI] [PubMed] [Google Scholar]
- Dammin GJ, Goldman ML, Schroeder HA, Pace MG. Arterial hypertension in dogs. II. The effects of neurogenic hypertension with a study of periodic renal biopsies over a seven year period. Laboratory Investigation. 1956;5:72–96. [PubMed] [Google Scholar]
- Farrel TG, Odemuyiwa O, Bashir Y, Cripps TR, Malik M, Ward DE, Camm AJ. Prognostic value of baroreflex sensitivity testing after acute myocardial infarction. British Heart Journal. 1992;67:129–137. doi: 10.1136/hrt.67.2.129. [DOI] [PMC free article] [PubMed] [Google Scholar]
- Fink GD, Bryan WJ, Mann M, Osborn J, Werber A. Continuous blood pressure measurement in rats with aortic baroreceptor deafferentation. American Journal of Physiology. 1981;241:H268–272. doi: 10.1152/ajpheart.1981.241.2.H268. [DOI] [PubMed] [Google Scholar]
- Fink GD, Kennedy F, Bryan WJ, Werber A. Pathogenesis of hypertension in rats with chronic aortic baroreceptor deafferentation. Hypertension. 1980;2:319–325. doi: 10.1161/01.hyp.2.3.319. [DOI] [PubMed] [Google Scholar]
- Fletcher EC, Lesske J, Behm R, Miller CC, III, Stass H, Unger T. Carotid chemoreceptors, systemic blood pressure, and chronic episodic hypoxia mimicking sleep apnea. Journal of Applied Physiology. 1992;52:1978–1984. doi: 10.1152/jappl.1992.72.5.1978. [DOI] [PubMed] [Google Scholar]
- Floras JS, Hassan O, van Jones J, Osikowska BA, Sever PS, Sleight P. Consequences of impaired arterial baroreflexes in essential hypertension: effects on pressor responses, plasma noradrenaline, and blood pressure variability. Journal of Hypertension. 1988;6:525–535. doi: 10.1097/00004872-198807000-00003. [DOI] [PubMed] [Google Scholar]
- Franchini KG, Cestari IA, Krieger EM. Restoration of arterial blood oxygen tension increases arterial pressure in sinoaortic-denervated rats. American Journal of Physiology. 1994;266:H1055–1061. doi: 10.1152/ajpheart.1994.266.3.H1055. [DOI] [PubMed] [Google Scholar]
- Franchini KG, Krieger EM. Carotid chemoreceptors influence arterial pressure in intact and aortic-denervated rats. American Journal of Physiology. 1992;262:R677–683. doi: 10.1152/ajpregu.1992.262.4.R677. [DOI] [PubMed] [Google Scholar]
- Franchini KG, Krieger EM. Cardiovascular responses of conscious rats to carotid body chemoreceptor stimulation by intravenous KCN. Journal of the Autonomic Nervous System. 1993;42:63–69. doi: 10.1016/0165-1838(93)90342-r. 10.1016/0165-1838(93)90342-R. [DOI] [PubMed] [Google Scholar]
- Frattola A, Parati G, Cuspidi C, Albini F, Mancia G. Prognostic value of 24 h blood pressure variability. Journal of Hypertension. 1993;11:1133–1137. doi: 10.1097/00004872-199310000-00019. [DOI] [PubMed] [Google Scholar]
- Haun CK, Alexander N. Pulmonary edema and death induced by sino-aortic denervation in fastigial nucleus-lesioned rats. Brain Research. 1985;343:89–94. doi: 10.1016/0006-8993(85)91161-8. 10.1016/0006-8993(85)91161-8. [DOI] [PubMed] [Google Scholar]
- Hayashi F, Yoshida A, Fukuda Y, Honda Y. The ventilatory response to hypoxia in the anesthetized rat. Pflügers Archiv. 1983;396:121–127. doi: 10.1007/BF00615516. [DOI] [PubMed] [Google Scholar]
- Hofer MA. Lethal respiratory disturbance in neonatal rats after arterial chemoreceptor denervation. Life Science. 1984;34:489–496. doi: 10.1016/0024-3205(84)90505-8. [DOI] [PubMed] [Google Scholar]
- Hofer MA. Sleep-wake state organization in infant rats with episodic respiratory disturbance following sinoaortic denervation. Sleep. 1985;8:40–48. doi: 10.1093/sleep/8.1.40. [DOI] [PubMed] [Google Scholar]
- Huckstorf C, Behm R, Habeck JO, Ruckborn K, Franz U. Blood pressure, heart rate and arterial blood gas reactions to acute hypoxia in carotid body denervated spontaneously hypertensive rats. Biomedica Biochimica Acta. 1987;46:925–931. [PubMed] [Google Scholar]
- Krieger EM. Neurogenic hypertension in the rat. Circulation Research. 1964;30:511–521. doi: 10.1161/01.res.15.6.511. [DOI] [PubMed] [Google Scholar]
- Lagneaux D, Lecomte J. Reflex and direct effects of sodium cyanide in anesthetized rats. Archives Internationales de Physiologie, de Biochimie, et de Biophysique. 1994;102:325–332. doi: 10.3109/13813459409007554. [DOI] [PubMed] [Google Scholar]
- McDonald DM. Morphology of the rat carotid sinus nerve. I. Course, connections, dimensions and ultrastructure. Journal of Neurocytology. 1983;12:345–372. doi: 10.1007/BF01159380. [DOI] [PubMed] [Google Scholar]
- Martin-Body RL, Robson GJ, Sinclair JD. Respiratory effects of sectioning the carotid sinus, glossopharyngeal, and abdominal vagus nerves in the awake rat. The Journal of Physiology. 1985;361:35–45. doi: 10.1113/jphysiol.1985.sp015631. [DOI] [PMC free article] [PubMed] [Google Scholar]
- Martin-Body RL, Robson GJ, Sinclair JD. Restoration of hypoxic respiratory responses in the awake rat after carotid body denervation. The Journal of Physiology. 1986;380:61–73. doi: 10.1113/jphysiol.1986.sp016272. [DOI] [PMC free article] [PubMed] [Google Scholar]
- Montani JP, Mizelle HL, van Vliet BN, Adair TH. Advantages of continuous measurement of cardiac output 24 hours a day. American Journal of Physiology. 1995;269:H696–703. doi: 10.1152/ajpheart.1995.269.2.H696. [DOI] [PubMed] [Google Scholar]
- Norman RA, Jr, Coleman TG, Dent AC. Continuous monitoring of arterial pressure indicates sinoaortic denervated rats are not hypertensive. Hypertension. 1981;3:119–125. doi: 10.1161/01.hyp.3.1.119. [DOI] [PubMed] [Google Scholar]
- Orfila C, Damase-Michel C, Lepert J, Montastruc J, Suc J, Montastruc P, Girolami J. Renal morphological changes after sinoaortic denervation in dogs. Hypertension. 1993;21:758–766. doi: 10.1161/01.hyp.21.6.758. [DOI] [PubMed] [Google Scholar]
- Osborn JW. Pathogenesis of hypertension in the sinoaortic denervated spontaneously hypertensive rat. Hypertension. 1991;18:475–482. doi: 10.1161/01.hyp.18.4.475. [DOI] [PubMed] [Google Scholar]
- Osborn JW, England SK. Normalization of arterial pressure after barodenervation: role of pressure natriuresis. American Journal of Physiology. 1990;259:R1172–1180. doi: 10.1152/ajpregu.1990.259.6.R1172. [DOI] [PubMed] [Google Scholar]
- Osborn JW, Provo BJ. Salt-dependent hypertension in the sinoaortic-denervated rat. Hypertension. 1992;19:658–662. doi: 10.1161/01.hyp.19.6.658. [DOI] [PubMed] [Google Scholar]
- Ostadal B, Urbanova D, Ressl J, Prochazka J, Pelouch V, Widimsky J. Changes of the right and left ventricles in rats exposed to intermittent high altitude hypoxia. Cor Vasa. 1981;23:111–120. [PubMed] [Google Scholar]
- Ou LC, Smith RP. Probable strain differences of rats in susceptibilities and cardiopulmonary responses to chronic hypoxia. Respiration Physiology. 1983;53:367–377. doi: 10.1016/0034-5687(83)90126-3. [DOI] [PubMed] [Google Scholar]
- Palatini P, Penzo M, Racioppa A, Zugno E, Guzzardi G, Anaclerio M, Pessina AC. Clinical relevance of night time blood pressure and of daytime blood pressure variability. Archives of Internal Medicine. 1992;152:1855–1860. [PubMed] [Google Scholar]
- Parati G, Pomidossi G, Albini F, Malaspina D, Mancia G. Relationship of 24-hour blood pressure mean and variability to severity of target organ damage in hypertension. Journal of Hypertension. 1987;5:93–98. doi: 10.1097/00004872-198702000-00013. [DOI] [PubMed] [Google Scholar]
- Pessina AC, Palatini P, Sperti G, Cordone L, Libardoni M, Mos L, Mormino P, Di Marco A, Palu CD. Evaluation of hypertension and related target organ damage by average day-time blood pressure. Clinical and Experimental Hypertension. 1985;A7:267–278. doi: 10.3109/10641968509073546. [DOI] [PubMed] [Google Scholar]
- Sapru HN, Krieger AJ. Carotid and aortic chemoreceptor function in the rat. Journal of Applied Physiology. 1977;42:344–348. doi: 10.1152/jappl.1977.42.3.344. [DOI] [PubMed] [Google Scholar]
- Shair HN, Myers MM. Effects of combined carotid sinus and aortic depressor nerve denervations in neonatal rat pups. Biology of the Neonate. 1997;71:251–264. doi: 10.1159/000244424. [DOI] [PubMed] [Google Scholar]
- Trisdale AS, Krieger EM. Long-term analysis of the hypertension produced by sinoaortic denervation in the rat. Brazilian Journal of Medical and Biological Research. 1984;17:209–217. [PubMed] [Google Scholar]
- Van Vliet BN, Hu L, Scott T, Chafe L, Montani JP. Cardiac hypertrophy and telemetered blood pressure 6 weeks after baroreceptor denervation in normotensive rats. American Journal of Physiology. 1996;271:R1759–1769. doi: 10.1152/ajpregu.1996.271.6.R1759. [DOI] [PubMed] [Google Scholar]