

Abstract
Forty-six single motor units in the common finger extensor, superficial finger flexor, and first dorsal interosseus muscles were recorded with intramuscular wire electrodes while subjects made voluntary flexion and extension finger movements at a single metacarpo-phalangeal joint.
Motor unit firing was analysed in relation to the 8-10 Hz discontinuities which previously have been shown to characterize these movements. Statistical time- and frequency-domain analyses of the activity of individual motor units in relation to the discontinuities showed that when the muscle was the agonist, all motor units in the common finger extensor muscle, and all units except one in the flexor muscles exhibited significant frequency modulation of their discharge in close temporal association with the joint acceleration. On the other hand, motor unit firing rate was not related to the frequency of the discontinuities. When the muscle recorded from was the antagonist, 21 of the 25 active units exhibited a similar frequency modulation.
When angular movement velocity was increased from 4 to 25 deg s−1, the strength of motor unit frequency modulation increased. Peak coherence between motor unit activity and acceleration increased by 74 %, on average, in the common finger extensor units.
The findings rule out a tentative mechanism attributing the discontinuities to newly recruited motor units firing at circa 8-10 Hz. Instead, a coherent 8-10 Hz input to the agonist and antagonist motoneurone pools is implied.
It has been demonstrated that slow finger movements in man are not smooth but discontinuous, with peaks in the velocity recurring with a frequency of about 8-10 Hz. Surface electromyography (EMG) recordings have revealed that the discontinuities are brought about by pulsatile modulations of agonist muscular activity, often with an alternating increase with antagonist muscle activity as well (Vallbo & Wessberg, 1993).
The underlying neuronal mechanisms for producing the pulsatile motor output remain to be elucidated. It has been demonstrated that the modulation of muscle activity is not dependent on peripheral feedback loops but is generated within the central nervous system (Wessberg & Vallbo, 1995, 1996). A number of central mechanisms can be considered. Recurrent inhibition has been suggested as a factor promoting the 8-12 Hz oscillations in physiological tremor during position holding (Elble & Randall, 1976). On the other hand, it has been suggested that the Renshaw system would tend to desynchronize motoneurone activity rather than sustain oscillations (Stein & Oguztöreli, 1984; Windhorst & Kokkoroyiannis, 1992). In addition, experimental observations in animals and humans indicate that recurrent inhibition is lacking in motoneurones innervating finger muscles (Person & Kozhina, 1978; Hörner et al. 1991; Katz et al. 1993).
Another potential central mechanism would be the intrinsic frequency-regulating properties of the motoneurones themselves. Newly recruited neurones have been demonstrated to fire at frequencies in the 6-10 Hz range (Freund et al. 1975), and modulation of motor output could result from the unfused contraction of the last recruited motor units. Such a mechanism has also been suggested for physiological tremor (Taylor, 1962; Allum et al. 1978), but experiments involving recording of single motor unit activity during position holding have revealed that motor units firing at higher rates are frequency modulated at the rate of tremor (Elble & Randall, 1976; Logigian et al. 1988; Conway et al. 1995a). This suggests that a coherent synaptic input to the motoneurone pool is providing the observed modulation of motor output. However, it is not clear if or to what extent physiological tremor and the 8-10 Hz EMG modulations observed during finger movement are related phenomena. While the frequencies of the oscillations are similar, the EMG variations during movements are usually of much larger amplitude than is commonly assumed for physiological tremor. Moreover, the kinematic patterns are subtly different, with an asymmetry between the phases of acceleration and deceleration during movements (Vallbo & Wessberg, 1993).
The aim of the present study was to test directly the hypothesis that 8-10 Hz discontinuities during slow finger movements are caused by individual motor units firing at these rates. An alternative hypothesis is that the activity of motoneurones firing at higher rates are frequency modulated at 8-10 Hz, and that coherent modulations of motoneurone activity cause the observed variations in motor output. The experimental approach was to record the activity of single motor units in the finger extensor and flexor muscles, and to analyse the coupling between motor unit activity and kinematics quantitatively with a series of statistical signal analysis tools. It was found that all recorded motor units in the extensor muscles and the majority of the motor units in flexor muscles exhibited frequency modulation of discharge. No support could be found for the hypothesis that the movement discontinuities are caused by motor units firing at 8-10 Hz. A preliminary report of some of this work has been published previously in poster format (Kakuda & Wessberg, 1995).
METHODS
The experiments were performed on 24 healthy volunteers, 10 female and 14 male, aged 18-34. Informed consent was obtained according to the Declaration of Helsinki (British Medical Journal 1964, vol. 2, p. 177), and the study was approved by the Ethical Committee of the Medical Faculty of Göteborg University.
General procedures and equipment
The subject was comfortably seated in a reclining chair with the left arm resting on a supporting platform. The hand was held with a clamp which permitted free finger movements but prevented movements of the wrist, which was held lightly flexed at a joint angle of 165-175 deg. Care was taken to position the hand in a manner the subject felt was natural for fine manipulatory hand movements.
One finger was strapped to a splint which permitted movements only at the metacarpo-phalangeal (MCP) joint. The splint was attached to an actuator device by means of a low mass hinged bar. The actuator has been described previously (Al-Falahe & Vallbo, 1988). Transducers on the actuator provided continuous recording of metacarpo-phalangeal joint angle, velocity and torque. An integral servo motor compensated for friction and inertia; thus the actuator device normally presented zero load to the moving finger. The actuator could also produce a constant torque load, and loads up to 0.2 N m were used during some of the recordings in order to ensure activation of some of the higher threshold motor units (see Results).
An oscilloscope in front of the subject was used for visual tracking of either joint angle or torque. One beam was swept vertically and split into two halves, the top half displaying the desired target, and the bottom half the actual joint angle or torque. A microcomputer was programmed to control the actuator, the tracking oscilloscope, and other equipment.
Surface electromyography (EMG) was recorded with pairs of 6 mm diameter silver-silver chloride electrodes taped to the skin over either the common finger extensor or superficial finger flexor muscles. The skin was cleansed with abrasive pads, and electrode impedance was measured with an impedance meter (Checktrode 1089, UFI, Morro Bay, CA, USA). Only values below 2.5 kΩ per electrode were accepted.
Recorded signals were sampled on a separate microcomputer. Surface EMG was sampled at 1600 Hz and the kinematic parameters at 400 Hz. Acceleration was derived off-line by digital low-pass filtering (-3 dB at 52 Hz) and differentiation of the velocity signals.
Intramuscular electromyographic recordings
Intramuscular EMG electrodes were prepared by inserting a pair of flexible polyurethane-coated 80 μm diameter wires (Molecu-Wire Corporation, Wall Township, NJ, USA) into a 0.4 mm diameter injection needle. The wires were cut at straight angles with a sharp wire cutter, and the distal 2 mm tips of the wires were bent over the tip of the injection needle. The muscle to be recorded from was impaled, and the injection needle was withdrawn completely. The pair of wires were then withdrawn in small steps by hand until the activity of a single motor unit could be recorded while the subject made voluntary muscle contractions. Usually, a bipolar differential recording between the two wires was used, but occasionally a unipolar recording between one of the wires and a common ground electrode provided better discrimination of the single motor unit being recorded. The portion of the muscle actually impaled was identified by asking the subject to extend or flex each finger in sequence against a resistance, and the finger which elicited the best response from the recorded unit was connected to the actuator as described above. A muscle was impaled only once in each subject, and subjects reported no pain or discomfort once the flexible wires were in place.
During pilot experiments, concentric needle electrodes were tried. As expected, these provided excellent signals and discrimination of single motor units, but subjects reported significant pain or discomfort when making movements. Results from experiments using needle electrodes have not been included in the present study.
Intramuscular EMG was sampled at 6400 Hz. Discrimination of single motor units was achieved on-line with a digital time-frequency window algorithm originally developed for the discrimination of single unit nerve discharges in microneurographic recordings (Edin et al. 1988). The procedure was also repeated off-line using the ZOOM/SC software system (Department of Physiology, Umeå University, Sweden). Each recorded motor unit discharge was inspected on an expanded time scale and records where the single-unit nature of the recordings were in any way in doubt were discarded. Only these validated single unit records were used for subsequent motor unit identification and data analysis. The intramuscular EMG signal was also played through a speaker for auditory feedback to the subject.
Motor unit characterization
The recruitment threshold for a single motor unit was measured during voluntary isometric contractions with the torque rising steadily from zero by 0.1 N m s−1, acquired by visual tracking. The threshold was defined as the highest torque at which the motor unit started firing steadily in two or more repeated trials. The single unit twitch torque was assessed by spike-triggered averages of records of isometric contractions. Several 30 s periods were recorded during which the subjects were given auditory feedback of the intramuscular EMG, and were requested to keep the motor unit firing steadily at the lowest frequency possible. Spikes for which either the preceding or following interspike interval was less than 100 ms were discarded, and any linear trend in the average torque record was removed (defined as the linear regression fitted from -250 to 250 ms). The average twitch torque was defined as the amplitude from the torque at the spike to the subsequent peak in the average torque record.
Experimental procedures
The main experimental protocol comprised a visual tracking task, each trial consisting of five phases: position holding, an extension movement of 20 deg, an inter-movement position-holding phase, a flexion movement back to the initial position, and finally position-holding again at the starting position. Auditory cues prompted the subjects to begin to move, the movement of the target starting 0.3 s after the cue. During the movements, the target moved with a constant speed of either 4, 10, or 25 deg s−1. Movements were made around a neutral flexion angle of 140-145 deg angle in the MCP joint.
For all units, at least eight trials with 10 deg s−1 movements were recorded first, followed by blocks of 4-10 trials with alternating movement speeds for as long as the unit could be reliably recorded. Motor units which could not be recorded for the duration of at least eight movements with the 10 deg s−1 speed were not included in the sample. Altogether 2473 extension-flexion movement trials from 46 motor units were analysed, the number per unit ranging from 8 to 192.
Data analysis
For each movement, three firing rate indices were calculated. The overall firing rate was assessed by calculation of the reciprocal of the median interspike interval over the period of the movement phase where the motor unit was active. Initial and final firing rates were defined as the reciprocal of the medians of the first and last four interspike intervals in the movements.
The signals were further analysed using a number of time- and frequency-domain methods. Estimated auto- and cross-spectra were computed and analysed statistically using standard methods; the spike trains of the single motor units were treated as stochastic point processes, whereas acceleration or surface EMG were treated as realizations of continuous processes (Bendat & Piersol, 1986; Rosenberg et al. 1989; Halliday et al. 1995). The data segment length for Fourier transformation was 1 s, giving a spectral resolution of 1.0 Hz. The estimated cross-spectra between two processes were normalized as the coherence spectra, which describe the linear correlation squared between two signals as a function of frequency on a scale from zero to one. Estimated phase spectra were also derived from the cross-spectra, showing the average phase between the two processes as a function of frequency. Confidence limits for all estimates were calculated according to Rosenberg et al. (1989).
The average time delay between single unit activity and acceleration was estimated by two different methods. First, a time domain estimate was obtained by finding the lag time at the largest peak in the cross-correlation function. Second, a frequency-domain-based estimate of time delay was obtained. Where a fixed time delay exists between two processes the phase spectrum will show a sloping line over a range of frequencies where coherence is significant. Accurate estimates of delay were obtained with a method involving weighted least-square linear regression over this part of the phase spectrum (Halliday et al. 1995).
All calculations were made on a PC-type computer, using software written in Borland Pascal and MATLAB (Mathworks Inc., Natick, MA, USA) by the authors.
RESULTS
The purpose of the present study was to investigate the patterns of single motor unit activity in the finger extensor and flexor muscles during slow finger movements, in relation to the previously reported 8-10 Hz modulation of agonist and antagonist surface EMG (Vallbo & Wessberg 1993; Wessberg & Vallbo, 1996). The test procedure comprised a visual tracking task with the target moving at a constant speed of 4, 10, or 25 deg s−1.
Sample of single motor units
The activity of 46 single motor units was recorded with flexible wire electrodes in 24 subjects, 31 units in the common long finger extensor muscle (m. extensor digitorum communis, EDC) and 10 units in the deep long finger flexor (m. flexor digitorum superficialis, FDS). In addition, five units were obtained from the first dorsal interosseus muscle (1DI) (see below). A reasonable number of movements was required for statistical analysis, and only units for which at least eight flexion-extension movement pairs could be recorded were included in the present study.
Recruitment threshold was measured in repeated isometric contractions with slowly rising torque. Single unit twitch force was assessed by spike-triggered averaging of the torque records during repeated 30 s periods of weak isometric contraction, where the subject's task was to keep the unit active at the lowest possible rate. The range of recruitment thresholds for the EDC units was 1-82 mN m, corresponding to 0.1-6.8 % of maximum voluntary contraction (MVC), for FDS, 13.5-166 mN m (0.4-4.7 % of MVC), and for 1DI, 24.4-143.5 mN m (0.7-3.4 % of MVC). The corresponding twitch forces varied between 0.06-0.86 mN m for EDC, and 0.24-0.62 mN m for the flexor muscles. There was a significant (P < 0.01) linear correlation between recruitment threshold and twitch force for all muscles (r = 0.81 for EDC, r = 0.75 for FDS and 1DI).
The slightly higher recruitment thresholds for most FDS units compared with EDC units conformed with the general impression during the experiments that it was easy to find and record low threshold motor units which were active during movements in the EDC, whereas this was usually not the case for the FDS. This finding is in agreement with a previous study, where it was found that extrinsic flexor surface EMG could more often be recorded with external loading or with an instruction to the subject to co-contract during the movements (Vallbo & Wessberg, 1993). Hence six of the FDS units could only be kept active during the movements when the flexor muscles were loaded either by application of a constant extending torque of 10-200 mN m, corresponding to 0.25-6.5 % of maximum voluntary contraction. Another approach was to shift the range of the movements to a more flexed joint angle by 5-20 deg, so that the flexor muscles had to work against a larger passive elastic load from the soft tissues around the metacarpo-phalangeal joint. These procedures were also used for three of the EDC units with higher recruitment thresholds.
The anatomical arrangement of the tendons around the metacarpo-phalangeal joints makes the EDC the only extensor at this joint. Intrinsic hand muscles produce flexion as well as abduction or adduction at this joint, and extension at the inter-phalangeal joints. Activation of the dorsal interossei has previously been noted during finger extension as well as flexion (Bremner et al. 1991). In the present study, a smaller sample of motor units from the first dorsal interosseus muscle was included in the present study in order to test the hypothesis that these muscles are active in the employed finger movement task. All recorded units in the first dorsal interosseus exhibited firing patterns which were in all respects similar to those of the extrinsic flexor motor units. Because the finger was fixed to a splint limiting the movements to the metacarpo-phalangeal joints, it is likely that the subjects did not activate the first dorsal interosseus to actively extend the fingers at the distal joints. Surface EMG from intrinsic hand muscles was not included in the study originally describing 8-10 Hz periodic motor output (Vallbo & Wessberg, 1993).
General characteristics of motor unit activity
A sample movement trial comprising an extension and a flexion movement is shown in Fig. 1. The target used for visual tracking moved with a constant speed of 10 deg s−1, which was the principal movement speed used in the study.
Figure 1. Recording of a single motor unit during finger movement.
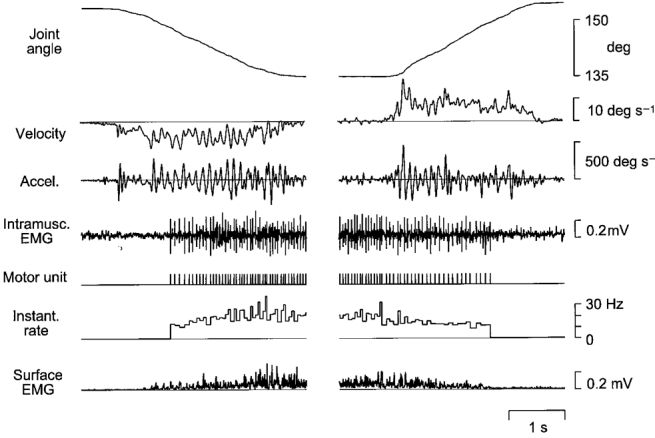
A sample extension-flexion movement trial. The target used for visual tracking moved at a fixed rate of 10 deg s−1. Records show, from above: angle at the metacarpo-phalangeal joint; angular velocity; acceleration; intramuscular EMG; a symbolic representation of the motor unit discharge train; instantaneous frequency of motor unit discharge; and the surface EMG. EMG signals were obtained from the common finger extensor muscle (m. extensor digitorum communis, EDC).
A sample EDC motor unit is depicted in Fig. 1, exhibiting a pattern of activity typical for the whole sample. This unit was recruited shortly after onset of the concentric contraction, in this case finger extension. For the 10 deg s−1 movements, the median firing rate of the EDC units was 16.6 Hz (range 11.0-22.1 Hz). The units remained active throughout position holding, but at the onset of flexion movements 16/31 EDC units fell silent. The remaining units fired with a median rate of 11.1 Hz (range 8.7-14.4 Hz) until de-recruited at some point during the flexion movement. Corresponding data for FDS motor units are 13.2 Hz (range 9.5-18.2 Hz) for flexion (muscle shortening), and 9.0 Hz for extension (range 7.1-14.8 Hz, 1/10 unit silent). For 1DI units median rates were 13.4 Hz during flexion and 9.3 Hz during extension (no unit silent).
An increase in motor unit firing rate was usually evident over the first few discharges after recruitment. This was analysed by comparing the median firing rate over the first four interspike intervals after recruitment with overall firing rate. For EDC, the rate at recruitment was, on average, 22 % lower, and for FDS and 1DI it was 15 % lower. This is significant both for EDC units and the pooled flexor motor units (Wilcoxon ranked sum test, P < 0.05). On the other hand, no consistent changes in firing rate were evident after the first few interspike intervals. A similar comparison between the last four interspike intervals during the movement phase and overall rate showed small (average 1-2 %) and altogether non-significant changes in firing rate.
Hence, although all units could be kept voluntarily activated at below 10 Hz during isometric contractions for unit identification (cf. above), most units fired with higher rates during movements. Apparently, subjects used a low level of co-contraction during movements, as expected during a precision movement task (Smith, 1981).
Statistical signal analysis
Figure 1 highlights the pulsatile nature of the movements, with prominent 8-10 Hz components evident in the velocity and acceleration records. A number of statistical signal analysis tools were used in order to analyse any coupling between the velocity variations and the activity of each motor unit. For each unit, available data for movements made in a single direction with the same overall velocity were pooled for each analysis; conversely, data for different movement directions or speeds were never pooled.
Figure 2 shows the results for one EDC motor unit for 48 extension movements recorded with a tracking target velocity of 10 deg s−1. The power spectrum of acceleration shows a strong peak around 8 Hz, confirming that such oscillations were a consistent and prominent feature throughout the movements. As shown previously, such peaks are an ubiquitous feature of slow finger movements in man (Vallbo & Wessberg, 1993). In the present study, these peaks were seen in the 7-10 Hz range for all subjects and movement directions.
Figure 2. Frequency- and time-domain signal analysis.
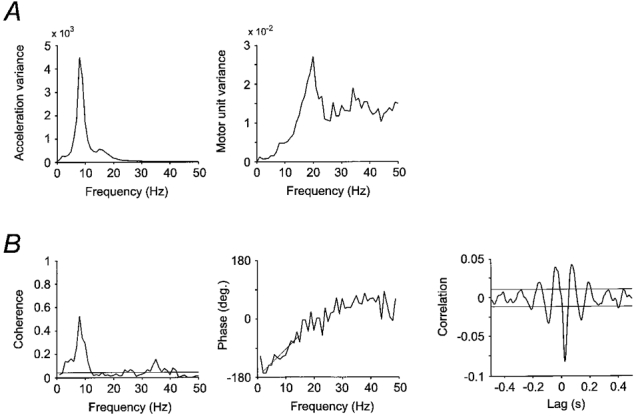
Results for 48 extension movements at 10 deg s−1 overall speed for a sample EDC motor unit. A, power spectrum for acceleration and for single motor unit activity. The peak in the motor unit power spectrum close to 20 Hz represents the overall firing rate of this motor unit during movements. B, analysis of the coupling between acceleration and motor unit activity. There is a prominent peak at 8 Hz corresponding to the main peak in the acceleration spectrum. Weighted linear regression over part of the phase spectrum is shown with a straight line. The slope of this line as well as the main downward peak in the cross-correlation graph indicates that the motor unit is leading the acceleration in the muscle shortening direction by 20 ms. Horizontal lines in the coherence and cross-correlation plots indicate approximate 99 % confidence limits.
Whereas acceleration was treated statistically as a time series, motor unit activity was treated as a point process, and the statistics of the power spectrum in the two cases are subtly different. For a point process, the variance will tend towards the average variance with increasing frequency, as may be seen in the motor unit power spectrum in Fig. 2. The broad peak around 20 Hz indicates the approximate overall firing rate of the unit, as confirmed by the finding that the location of this peak showed significant correlation with the median firing rate of all motor units (Spearman's r = 0.77 for movements in the muscle shortening direction for all units, P < 0.01).
Coupling between acceleration and motor unit activity was analysed in the frequency domain (Halliday et al. 1995). The first step consisted of calculation of the cross-spectrum, which contains information regarding both degree of coupling and the average phase between the two processes. The absolute cross-spectrum can be normalized as coherence, which shows coupling as a function of frequency on a scale from zero to one. Figure 2 shows a significant coherence between acceleration and motor unit activity for the 1-12 Hz range, with a strong peak at 8 Hz. There is also significant coherence at slightly lower levels in the 24-42 Hz range.
Significant (P < 0.01) coherence between acceleration and motor unit activity was observed for all units except for one FDS unit. This unit did not exhibit any coherence with acceleration even though 64 movement trials were recorded for this unit. A possible explanation was that this exceptional unit was located outside the FDS, for example in a wrist flexor, but the unit appeared unremarkable throughout the identification procedures, and was recruited and de-recruited during movements in a manner similar to all other flexor units.
Figure 2 also illustrates the statistical analysis of mean time delay between motor unit activity and acceleration. Time delay was assessed in two different ways. First, a constant time delay between two processes will show up as a sloping line in the phase spectrum. Time delay can be measured accurately by linear regression, where phase estimates are weighted by the corresponding coherence at each frequency (Halliday et al. 1995). In addition, time delay was estimated by finding the time lag for the major deflection in the cross-correlation graph. This deflection is negative in Fig. 2 because acceleration in the direction of muscle shortening was negative for the EDC, and hence change in EDC muscle activity and the corresponding finger acceleration had opposite signs. Time delays determined from the phase spectrum were similar for all muscles and movement directions, with an average of 21 ms (range 10-29 ms) delay from motor unit to acceleration. These values are identical to those previously been reported for surface EMG (Wessberg & Vallbo, 1996). The values were confirmed by delay estimates based on the cross-correlation (range 12.5-30 ms, mean 23 ms), the two methods showing a strong linear correlation for all muscles and movement directions (Spearman's r = 0.85, P < 0.001). The close coupling, with only a short time delay, between motor unit activity and acceleration at the frequencies where coherence was strongly significant (i.e. for the peak around 8 Hz in Fig. 2) is evidence that frequency modulation of motor units contributed significantly to the 7-10 Hz discontinuities. In no units was there any indication of a time delay in the other direction, i.e. from muscle stretch to motor unit activity, again confirming previous surface EMG observations which have been advanced as supporting evidence for the notion that stretch reflexes do not constitute a major mechanism for producing the observed discontinuities during movements (Wessberg & Vallbo, 1996).
The relationship between motor unit firing rate and acceleration and coherence between the two is summarized in Fig. 3. The histograms show median motor unit firing rates as black bars, and frequencies for the corresponding peaks in the coherence spectra as open bars for extensor and flexor muscles, and for extension and flexion movements. To enable direct comparison between different units, all observations have been normalized by dividing by the frequency of the peak in the corresponding acceleration spectrum. The two histograms for movements with muscle shortening (i.e. extension in EDC, flexion in the flexor muscles) show that the motor units fired at a wide range of frequencies during movements. There was no indication that a proportion of the motor units in the sample fired at the same rate as the variations in acceleration, i.e. at unity in the normalized scale in the histogram. Neither did they preferentially fire at any fixed integer multiple of the rate of the acceleration.
Figure 3. Summary of motor unit firing rates and coherence vs. acceleration.
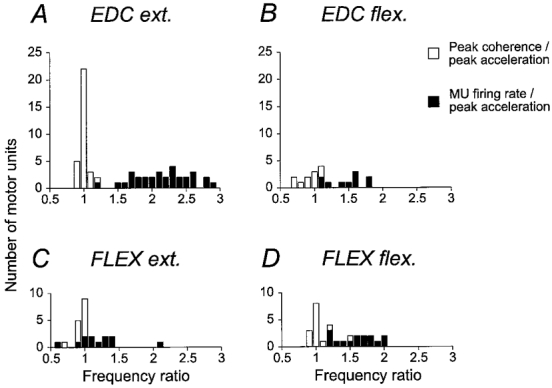
Histograms for motor unit firing rates (▪), and the frequency of peak coherence between motor unit activity and acceleration (□) for all 10 deg s−1 movements. Observations are normalized by the frequency at the main peak in the corresponding acceleration power spectrum. A, EDC muscle, extension movements. B, EDC muscle, flexion movements. C, finger flexor muscles, extension movements. D, finger flexors, flexion movements. The number of observations are fewer in B and C because some units fell silent during muscle shortening.
Instead, for movements with muscle shortening, a peak in coherence located near the same frequency as the peak in the acceleration spectrum was a consistent finding with all units. For all units except for one unit in both EDC and the flexor muscles the coherence peak was within 1 Hz of the peak in the acceleration spectrum, which was the spectral resolution limit of these analyses. The consistency of this observation over recorded motor units and muscles is notable, and provides important evidence that the relevant mechanism producing the discontinuous kinematic pattern was a coherent frequency modulation of the active agonist motor units.
For movements with muscle lengthening, when the muscle recorded from was the antagonist (i.e. flexion in EDC, extension in flexors), peak frequency of the coherence was somewhat more variable. For 7/10 active EDC units and 14/15 flexor units the coherence peak was within 1 Hz of the peak in the acceleration spectrum. Remaining units showed peak coherence at frequencies lower than the peak in the acceleration spectrum, which was also lower than the motor unit firing rate. Hence, it can be concluded that a sizeable proportion of the EDC, FDS and 1DI motor units which remain active during muscle lengthening do contribute to the production of the observed 7-10 Hz discontinuities, again confirming earlier observations based on surface EMG (Vallbo & Wessberg, 1993).
A different type of analysis of significant coherence between motor unit activity and acceleration is shown in Fig. 4. The histograms show the percentage of all units exhibiting coherence at the P < 0.01 significance level for movements with muscle shortening (extension in EDC in A, flexion in flexors in B). In both cases, there is a broad peak around 7-10 Hz. It should be emphasized that the proportion of units which were significant at the P < 0.01 level as shown in Fig. 4, was strongly dependent on the number of movements on which each coherence calculation was based. If the database for the EDC was split in two groups depending on the number of movements recorded with each motor unit, the group with the larger number of movements showed 100 % significance at 8-9 Hz for both movement directions. This is not unexpected given the relationship between significance level of a coherence estimate and the amount of available data (Rosenberg et al. 1989). It should also be noted that the lack of a 100 % coherence at any frequency in Fig. 4 is consistent with the observation that all units except one FDS unit showed significant coherence at the corresponding peak in the acceleration spectrum, because these peaks occurred at different frequencies in the 7-10 Hz range.
Figure 4. Summary of proportion of significant coherence.
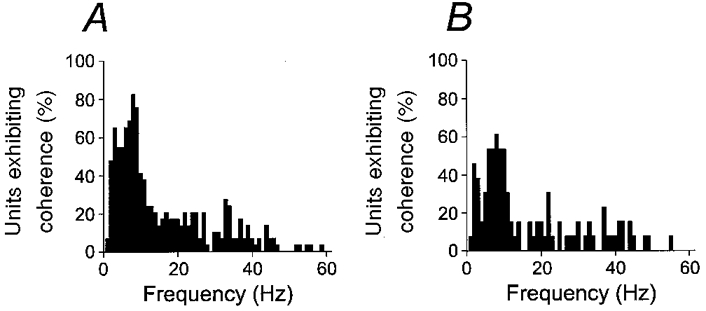
Proportion of units exhibiting significant coherence with acceleration at the P < 0.01 level for 10 deg s−1 movement. A, EDC muscle, extension movements. B, flexor muscles (FDS and 1DI), flexion movements.
The sample motor unit in Fig. 2 exhibited significant coherence with acceleration around 35 Hz. Figure 4 shows that in the total sample, a smaller proportion of the units showed significant coherence over a broad range of frequencies over 1-60 Hz, although there is a possible peak near 30-35 Hz for the EDC. Motor unit synchronization at these frequencies has previously been described as a prominent feature of human hand muscle contractions (Farmer et al. 1993). The coherence between motor units and acceleration at higher frequency in the present study probably indicates that such synchronization occur also during slow finger movements, albeit at a low level, in addition to the prominent 7-10 Hz component.
Significance of movement speed
The motor unit firing patterns were further analysed for movements with different overall velocity, as shown in Fig. 5. The figure shows recordings from one motor unit during extension movements made while the target moved with a constant velocity of 4, 10 and 25 deg s−1. The instantaneous rate records reveal that the rate is not constant but is frequency modulated, and the depth of modulation, i.e. the variations in instantaneous rate above and under the mean rate, increase with increasing movement speed. For the faster movements, modulation is conspicuous for some of the peaks in the velocity and acceleration records, where frequency modulation can be observed in the motor unit discharge records as groupings of two or three discharges, apparently in a fixed phase relationship with the oscillations of acceleration.
Figure 5. Single motor unit activity during finger movements with different speeds.
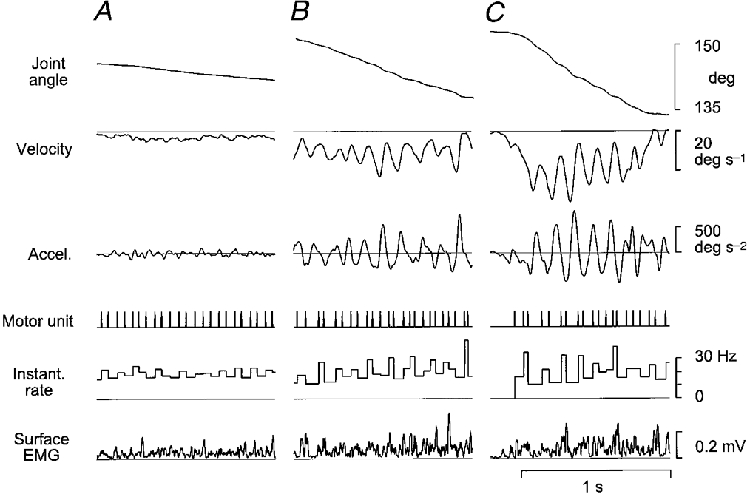
Records show parts of visual tracking movements acquired with the target moving at different overall speeds: 4 deg s−1 in A, 10 deg s−1 in B, and 25 deg s−1 in C. The motor unit and surface EMG were recorded from the common finger extensor. Records show, from above: angle in the metacarpo-phalangeal joint; angular velocity; acceleration, a symbolic representation the motor unit discharge train; instantaneous rate; and surface EMG. An increasing circa 8 Hz modulation of motor unit activity with increasing movement speed may be discerned in the instantaneous rate traces.
The frequency-domain analysis for all movements recorded for the same motor unit is shown in Fig. 6. In the acceleration power spectra there is a peak at 8 Hz, which increases in amplitude with increasing movement speed. Motor unit power spectra show a peak near 20 Hz, with little change with increasing movement velocity. Coherence in all three cases shows a dominant peak at 8 Hz, but with an increase in amplitude, confirming that the apparent increase in modulation in the sample records in Fig. 5 was a constant finding for the larger sample of movements. On a neuronal level, this implies that the input providing the 8 Hz modulation of motor unit activity had a stronger effect on motor unit firing during faster movements. This was true in spite of the motor unit firing rate staying approximately constant. In conclusion, the 8 Hz signal reaching the motoneurones apparently increased in amplitude with increasing movement velocity.
Figure 6. Signal analysis of movements of different speed.
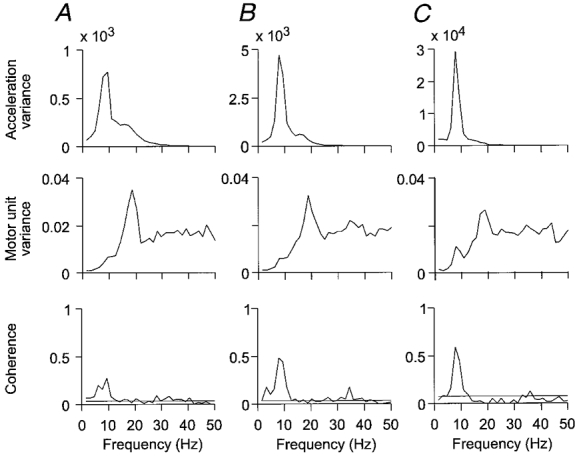
Frequency-domain signal analysis of 20 movements at 4 deg s−1 overall speed in A, 48 movements at 10 deg s−1 in B, and 50 movements at 25 deg s−1 in C. Graphs show, from above: acceleration power spectrum; motor unit spectrum; and coherence between motor unit activity and acceleration. Horizontal lines in the coherence plots indicate approximate 99 % confidence limits. There is a significant increase in peak coherence with increasing movement speed.
Units which exhibited significant coherence with acceleration in the 10 deg s−1 movements always did so for the other movement velocities tested, and the single exceptional FDS unit remained non-coherent. During extension movements, a significant (P < 0.05) increase in peak coherence from the slowest to the fastest movements was seen in 12 of the 27 EDC units for which data from movements made at different speed were available. The average increase in peak coherence from slowest to fastest speed was 74 %. One unit showed a significant decrease, and the remaining showed non-significant increases. However, it must be noted that the statistical test employed requires a large number of movements for smaller differences in coherence to reach significance (Halliday et al. 1995). Because a fair number of movements at the 10 deg s−1 speed were made first for all units, in most units only a limited number of movements were available for the other speeds. This was particularly the case for the flexor motor units, and only 1 out of 9 flexor units for which data were available showed a significant increase in coherence (P < 0.001 in this unit), all other units showing a non-significant increase. Pooling of data from different flexor motor units to further analyse this trend of increasing peak coherence with increasing movement speed was not attempted.
The firing patterns of the population of motor units were further analysed qualitatively by visual inspection of the discharge records. In all units, except for the single FDS unit, a tendency for a change in firing pattern with increasing movements similar to Fig. 5 was observed. Hence, as movements became faster, there were groupings of motor unit discharges in groups of two or three discharges for every peak in the acceleration record. This qualitative observation was true also for the flexor motor units, which showed a statistically non-significant increase in coherence. This observation supports the frequency-domain statistical results provided above, indicating that frequency modulation for single motor units became larger as movement velocity increased. The change in firing pattern parallels previous observations made by Elble & Randall (1976) for enhanced physiological tremor, where similar changes were observed when the amplitude in tremor oscillations became larger.
DISCUSSION
The main finding in the present study was a frequency modulation of the discharges of motor units during finger movements which was coherent with the circa8-10 Hz discontinuities, in spite of the overall firing rate of the motor units being higher. This was true for all 46 motor units except one, indicating that the discontinuities during finger movements are caused by variations in an input which is common to a large proportion of the active motoneurones.
Frequencies of the discontinuities
Previously, the frequencies reported for discontinuities during slow finger movements in man have been 8-10 Hz. This was with reference to the location of the maximum of the highest peak in the power spectrum of acceleration for a large number of subjects, and for different contextual factors such as movement direction or speed (Vallbo & Wessberg, 1993). However, it is important to note that the peak in the spectrum is always quite wide, including frequencies well outside the 8-10 Hz range. Hence, the ‘8-10 Hz’ designation must be taken as a label rather than a complete description. In the present study, the peak in the acceleration power spectrum and motor unit-to-acceleration coherence occurred at 7 Hz in some subjects. Based on observation of a large number of movements in these subjects, we have no reason to believe that these discontinuities were in any way different in character from what has previously been described for the ‘8-10 Hz’ pattern. Because a slightly higher frequency resolution was used in the previous analyses, 0.78 Hz versus 1.0 Hz in the present study, it is possible that some peaks in the spectrum occurring just below 8 Hz may be rounded to different frequencies. This idea was also supported when previous data were analysed again using the lower resolution. For the present study, we believe we keep the discussion consistent with previously reported results by using a ‘circa8-10 Hz’ label for the phenomenon.
Motor unit recordings
The overriding goal during the experiments was to ensure a stable single-unit discrimination over a sizeable number of movements, rather than to obtain a large sample. The spike detection algorithm and subsequent inspection of all discharges off-line was adopted from the methods used for the usually considerably more difficult problem of recording the activity of single afferents using the microneurographic technique, with which we have great experience. Hence, we are confident in the single-unit nature of the reported sample of motor units. However, the sample is limited to units with fairly low recruitment thresholds. Attempts were made to record units with higher thresholds, which required voluntary co-contraction or external loading to become active. Although a few units with slightly higher thresholds are included in the present study, it was usually difficult to discriminate such units due to the high level of electromyographic noise. Anyway, the reported sample should be representative for the motor units normally active in unloaded movements made with normal levels of co-contraction.
With the technique of using cut flexible wires, signal-to-noise ratio was lower than for comparable recordings using needle electrodes, and motor unit discharges often varied in amplitude or shape during the movements, usually in a systematic fashion with the changing joint angle. This was true particularly for the long flexor muscles, where several experiments failed to provide any recordings. Nevertheless, the thin wire approach was preferred over needle electrodes, which would probably have resulted in a better experimental yield. As noted in the Methods section, such electrodes were tried, but subjects commonly reported significant pain and discomfort during movements. Because we wanted to explore possible mechanisms underlying the circa8-10 Hz discontinuities, we preferred to avoid the risk that such pain could even subtly upset or affect the patterns of motor output.
Mechanisms for circa8-10 Hz discontinuities during slow finger movements
The possibilities regarding the mechanisms which might contribute to the discontinuities have been discussed in a previous study (Wessberg & Vallbo, 1996). In summary, it was concluded that the observed tight coupling between muscle activity and acceleration seems to rule out purely passive mechanical factors such as mechanical resonance. Second, it was concluded that discontinuities cannot be caused entirely by a mechanism involving feedback from the periphery. This was based both on direct observation of stretch reflexes elicited during movements, which were found to be too delayed and too weak to possibly generate the observed patterns, as well as analysis of coupling between EMG and acceleration in both time and frequency domains. These findings have been further corroborated in a concurrent study involving briefly arresting ongoing movements, or weak rhythmic torque pulse perturbations.
As outlined in the Introduction, a remaining important possibility was that the discontinuities were a reflection of the intrinsic frequency-regulating properties of the motoneurones. It has been reported that newly recruited units discharge at 6-10 Hz (Freund et al. 1975). Force produced by these motor units could strongly influence total muscle force, since contractions are unfused at these frequencies, and since the last recruited motor units are the strongest. Hence, according to this hypothesis, at all levels of contraction 8-10 Hz discontinuities would be produced by unfused contractions by a small proportion of the active motor units, without any specific mechanism being required to synchronize the discharges of different motor units with different recruitment thresholds.
Considering the results of the present study, it now seems that this idea can be refuted as well. During the 10 deg s−1 movements no units were observed which exhibited a sustained 8-10 Hz firing pattern, and units consistently fired at higher rates after at most a few discharges after recruitment. Instead, motor unit activity was frequency modulated at circa 8-10 Hz, and was coherent with the discontinuities in 45 of 46 randomly collected motor units, implying that a common modulatory input reached a large proportion of the active motoneurones. This view is further corroborated by the demonstration of a close temporal coupling, so that motor units were leading acceleration by 10-30 ms. Since this was based on both time- and frequency-domain analyses, we know that this time temporal relationship is true for the 8-10 Hz frequency range. Hence, it may be concluded that a coherent modulation of motor unit activity caused the observed discontinuities. As noted in the Introduction, a similar explanation has previously been put forward for the related problem of 8-12 Hz physiological finger tremor during position holding (Elble & Randall, 1976; Conway et al. 1995a).
When the muscle was the antagonist, a major proportion of the motor units were similarly modulated, but some were not. Hence, it is possible that the involvement of the antagonist in the production of circa8-10 Hz discontinuities is variable between subjects or over time.
With increasing movement speed, a prominent increase in frequency modulation of the discharges of single motor units was observed. This was determined by visual inspection of the discharge records of the recorded units, where modulation was commonly evident for the fastest movements, and it was confirmed that coherence between motor unit activity and acceleration at around 8-10 Hz increased significantly in several units for which the statistical test could be made. Hence, it can be concluded that one mechanism which contributed to the large increases seen in the 8-10 Hz velocity peaks was an increase in the 8-10 Hz modulation of discharges of the active motor units.
However, it must be emphasized that the firing patterns of units which may have been specifically recruited during the faster movements were not assessed in the present study. As discussed above, we did record only a few units with higher recruitment threshold, and the experimental protocol used means that only motor units which were already active during 10 deg s−1 movement were included. It is possible that newly recruited units may have fired in a different pattern during fast movements, possibly contributing with a single synchronized discharge during each velocity cycle. This cannot at present be ruled out, and the relative contribution to the 8-10 Hz velocity variations by units specifically active during the faster movements cannot be determined.
Common modulation at different frequencies
In the total sample, a proportion of the units also showed significant coherence with acceleration at higher frequencies, up to about 60 Hz. Previous work has established 16-32 Hz common modulation of motor units during steady contractions of human hand muscles, caused by a coherent temporal pattern (Farmer et al. 1993) in the activity in shared cortico-spinal inputs to the motoneurones (Datta et al. 1991). In the present study, coherence between a proportion of single motor units and acceleration was observed at similar frequencies as well, as discussed in relation to Fig. 4. This can be taken to indicate that higher-frequency common modulation is present during finger movements, although at a low level. Such modulation would then co-exist with the circa 8-10 Hz modulation. It can hence be suggested that in addition to the common modulation described for steady contractions, there is an 8-10 Hz component which appears or is enhanced in task-dependent fashion specifically during movements. It should be noted that during steady contractions, common modulation over a broad range from 1-12 Hz is usually present as well, but coherence peaks at 8-10 Hz appear to be notably absent (Farmer et al. 1993).
However, the direct analysis of the complete spectrum of common modulation, for example to determine any task-dependent change in relative strength of the different frequency components suggested above, or analyses of the character of the temporal synchronization of different motor units, must rely on the simultaneous recordings of more than one motor unit. Such recordings are currently under way for precision hand movements at the wrist, and results which provide support for the notion that there is an 8 Hz component of the common modulation which is specific for movements has been reported in poster format (Kakuda & Nagaoka, 1996).
Theoretical reasons for an intermittent control mode for finger movements
In relation to the conclusions reached above it is of interest to examine the theoretical advantages of a pulsatile organization of motor output during finger movements.
The low inertia of the fingers means that there is less mechanical filtering than for, say, the forearm, and the kinematics will therefore more directly reflect the muscular activity. This feature of finger movements can be addressed from different points of view. Do the low-inertia fingers require a specialized mode of control during precision movements? Or, on the other hand, is it possible that pulsatile or intermittent control signals are a general feature of the human motor systems but fail to emerge in the kinematics due to the large inertia in many joints, whereas they are more easily detected in the fingers?
A discontinuous motor pattern may entail advantages at several levels. Some of these advantages are related to the very kinematics of the movements, others are related to a rhythmic modulation at the level of the motor command. First, as suggested above, there is a biomechanical level. It has previously been argued that a more optimal control of the thumb could be achieved by a system which produces rapid movements, the reason being related to the low limb inertia in combination with the relatively high viscosity of the muscles (Bizzi et al. 1984). Hence, a better control would be obtained if a slow movement is made as a series of rapid movement pulses. This conclusion has also been put forward in relation to the finding that slow grasp movements typically are discontinuous (Darling et al. 1988).
Next, there may be advantages with a pulsatile motor pattern from an information theory standpoint. The reliability of transmission of information can in general be improved by use of some kind of digital rather than analogue modulation (Haykin, 1988). The observed 8-10 Hz patterns would most closely resemble a so-called pulse-amplitude modulation. By using a modulation, the transmission of a neural signal could in theory be made more distinct in relation to a ‘noisy’ background, or less susceptible to interference. This would apply for the descending motor command as well as for the control exerted by the motoneurones over the kinematics of the moving limb. Alternatively, but in similar fashion, the pulsatile modulation of the afferent activity resulting from the discontinuous kinematics could be advantageous for the sensory systems involved in producing the movements. The pulsatile nature of muscle spindle activity during these movements has been confirmed in a previous study (Wessberg & Vallbo, 1995). In conclusion, a pulsatile pattern might have arisen to comply with the high precision demands in some finger movements. The drawback would be a limitation in the temporal resolution, i.e. the position of the fingers can only be updated about 8-10 times s−1.
The origin of the 8-10 Hz modulation
Finally, it is of interest to consider information processing at the level of the controlling motor circuits. It has been proposed that motor co-ordination can be achieved by spontaneous phase and frequency synchronization that is characteristic of some types of non-linear oscillatory circuits (Kelso et al. 1981; Schöner, 1990; Kelso & DeGuzman, 1992). These theories resemble the theories proposed for, in particular, the sensory cortices, where it has been suggested that co-ordinated information processing by widely separated neuronal circuits can be achieved by synchronized oscillations (reviewed in Singer, 1993), although the proposed oscillations occur at higher frequencies than 10 Hz.
While any connection to the 8-10 Hz processes presently described for finger movements must remain conjectural, it is interesting to note that hypotheses involving a 10 Hz modulation have previously been advanced. First, the computations required for producing a precision movement could be aided by the relevant information being assembled at fixed intervals in time. Because of variable conduction delays, the assembly of relevant visual, proprioceptive and tactile information may be difficult to achieve continuously. It was suggested by Bernstein (1967, pp. 137-142) that there exists a fundamental ‘time interval’ (Δt) for the co-ordination of both sensory and motor activities. On the basis of unpublished observations from foot and hand movements, Bernstein suggested that Δt in man is about 100 ms.
Related to this idea is the hypothesis regarding the function of the inferior olive proposed by Llinás and co-workers. The cells of the inferior olive have intrinsic membrane properties promoting 10 Hz oscillations, and, furthermore, they are coupled by electrical synapses. It has been proposed that a synchronization of climbing fibre input to the cerebellum provides a mechanism for motor co-ordination (Llinás & Volkind, 1973; Llinás, 1991; Welsh et al. 1995; Welsh & Llinás, 1997).
At present, it cannot be said whether the mechanism producing circa 8-10 Hz discontinuities is spinal or supraspinal. The demonstration of intermittent left-right synchronization in a bimanual task suggests a significant degree of supraspinal control (Wessberg, 1996). Recordings of sensorimotor cortical activity from humans or behaving primates have so far, in general, been focused on the important problem of cortical control during steady maintenance of force, establishing the existence of a circa 16-32 Hz modulation of cortical activity in this situation (Conway et al. 1995b; Baker et al. 1997; Salenius et al. 1997). In addition, several rhythmic phenomena related to movements, but which are generally suppressed during execution of movements of relatively short duration have been described, such as the 10 Hz sensorimotor cortex rhythm in man (Salmelin & Hari, 1994), or a 13-18 Hz oscillation in cerebellar cortex in behaving primates (Pellerin & Lamarre, 1997). Whether 8-10 Hz oscillations are present in the motor cortex specifically during execution of slower precision movements remains an open question.
Acknowledgments
This study was supported by the Swedish Medical Research Council (grant 14X-3548), the Swedish Society of Medicine, the Royal Swedish Academy of Sciences, and the foundation of Magnus Bergvall. We would like to thank Sven-Öjvind Swahn for excellent technical support.
References
- Al-Falahe NA, Vallbo AB. Role of the human fusimotor system in a motor adaptation task. The Journal of Physiology. 1988;401:77–95. doi: 10.1113/jphysiol.1988.sp017152. [DOI] [PMC free article] [PubMed] [Google Scholar]
- Allum JHJ, Dietz V, Freund H-J. Neuronal mechanisms underlying physiological tremor. Journal of Neurophysiology. 1978;41:77–95. doi: 10.1152/jn.1978.41.3.557. [DOI] [PubMed] [Google Scholar]
- Baker SN, Olivier E, Lemon RN. Coherent oscillations in monkey motor cortex and hand muscle EMG show task-dependent modulation. The Journal of Physiology. 1997;501:225–241. doi: 10.1111/j.1469-7793.1997.225bo.x. [DOI] [PMC free article] [PubMed] [Google Scholar]
- Bendat JS, Piersol AG. Random Data. New York: John Wiley & Sons; 1986. [Google Scholar]
- Bernstein N. The Co-ordination and Regulation of Movements. Oxford: Pergamon Press; 1967. [Google Scholar]
- Bizzi E, Accornero N, Chapple W, Hogan N. Posture control and trajectory formation during arm movement. Journal of Neuroscience. 1984;4:2738–2744. doi: 10.1523/JNEUROSCI.04-11-02738.1984. [DOI] [PMC free article] [PubMed] [Google Scholar]
- Bremner FD, Baker JR, Stephens JA. Effect of task on the degree of synchronisation of intrinsic hand muscle motor units in man. Journal of Neurophysiology. 1991;66:2072–2083. doi: 10.1152/jn.1991.66.6.2072. [DOI] [PubMed] [Google Scholar]
- Conway BA, Farmer SF, Halliday DM, Rosenberg JR. On the relation between motor-unit discharge and physiological tremor. In: Taylor A, Gladden MH, Durbaba R, editors. Alpha and Gamma Motor Systems. New York: Plenum Press; 1995a. pp. 596–598. [Google Scholar]
- Conway BA, Halliday DM, Farmer SF, Shahani U, Maas P, Weir AI, Rosenberg JR. Synchronization between motor cortex and spinal motoneurone pool during the performance of a maintained motor task in man. The Journal of Physiology. 1995b;489:917–924. doi: 10.1113/jphysiol.1995.sp021104. [DOI] [PMC free article] [PubMed] [Google Scholar]
- Darling WG, Cole KJ, Abbs JH. Kinematic variability of grasp movements as a function of practice and movement speed. Experimental Brain Research. 1988;73:225–235. doi: 10.1007/BF00248215. [DOI] [PubMed] [Google Scholar]
- Datta AK, Farmer SF, Stephens JA. Central nervous pathways underlying synchronization of human motor unit firing studied during voluntary contractions. The Journal of Physiology. 1991;432:401–425. doi: 10.1113/jphysiol.1991.sp018391. [DOI] [PMC free article] [PubMed] [Google Scholar]
- Edin BB, Bäckström PA, Bäckström LO. Single-unit retrieval in microneurography: A microprocessor-based device controlled by an operator. Journal of Neuroscience Methods. 1988;24:137–144. doi: 10.1016/0165-0270(88)90057-x. 10.1016/0165-0270(88)90057-X. [DOI] [PubMed] [Google Scholar]
- Elble RJ, Randall JE. Motor-unit activity responsible for 8- to 12-Hz component of human physiological finger tremor. Journal of Neurophysiology. 1976;39:370–383. doi: 10.1152/jn.1976.39.2.370. [DOI] [PubMed] [Google Scholar]
- Farmer SF, Bremner FD, Halliday DM, Rosenberg JR, Stephens JA. The frequency content of common synaptic inputs to motoneurones during voluntary isometric contraction in man. The Journal of Physiology. 1993;470:127–155. doi: 10.1113/jphysiol.1993.sp019851. [DOI] [PMC free article] [PubMed] [Google Scholar]
- Freund H-J, Büdingen HJ, Dietz V. Activity of single motor units from human forearm muscle during voluntary isometric contractions. Journal of Neurophysiology. 1975;38:933–946. doi: 10.1152/jn.1975.38.4.933. [DOI] [PubMed] [Google Scholar]
- Halliday DM, Rosenberg JR, Amjad AM, Breeze P, Conway BA, Farmer SF. A framework for the analysis of mixed time series/point process data - Theory and application to the study of physiological tremor, single motor unit discharges and electromyograms. Progress in Biophysics and Molecular Biology. 1995;64:237–278. doi: 10.1016/s0079-6107(96)00009-0. 10.1016/S0079-6107(96)00009-0. [DOI] [PubMed] [Google Scholar]
- Haykin S. Digital Communications. New York: John Wiley & Sons; 1988. [Google Scholar]
- Hörner M, Illert M, Kümmel H. Absence of recurrent axon collaterals in motoneurones to the extrinsic digit extensor muscles of the cat forelimb. Neuroscience Letters. 1991;122:183–186. doi: 10.1016/0304-3940(91)90853-l. 10.1016/0304-3940(91)90853-L. [DOI] [PubMed] [Google Scholar]
- Kakuda N, Nagaoka M. The common modulation of motor units during slow wrist movement in man. Society for Neuroscience Abstracts. 1996;22:667. [Google Scholar]
- Kakuda N, Wessberg J. Modulation of the impulse trains of single motor units in 8 – 10 Hz discontinuities during slow finger movement in man. Abstracts of the Fourth IBRO World Congress of Neuroscience, July 1995, Kyoto, Japan. 1995:399. [Google Scholar]
- Katz R, Mazzocchio R, Pénicaud A, Rossi A. Distribution of recurrent inhibition in the human upper limb. Acta Physiologica Scandinavica. 1993;149:183–198. doi: 10.1111/j.1748-1716.1993.tb09611.x. [DOI] [PubMed] [Google Scholar]
- Kelso JAS, DeGuzman GC. The intermittent dynamics of co- ordination. In: Stelmach GE, Requin J, editors. Tutorials in Motor Behaviour II. Amsterdam: Elsevier Science Publishers; 1992. pp. 549–561. [Google Scholar]
- Kelso JAS, Holt KG, Kugler PN, Turvey MT. Patterns of human interlimb co-ordination emerge from the properties of non-linear, limit-cycle oscillatory processes: Theory and data. Journal of Motor Behavior. 1981;13:226–261. [PubMed] [Google Scholar]
- Llinás R, Volkind RA. The olivo-cerebellar system: Functional properties as revealed by harmaline-induced tremor. Experimental Brain Research. 1973;18:69–87. doi: 10.1007/BF00236557. [DOI] [PubMed] [Google Scholar]
- Llinás RR. The non-continuous nature of movement execution. In: Humphrey DR, Freund H-J, editors. Motor Control: Concepts and Issues. New York: John Wiley & Sons; 1991. pp. 223–242. [Google Scholar]
- Logigian EL, Wierzbicka MM, Bruyninckx F, Wiegner AW, Shahani BT, Young RR. Motor unit synchronisation in physiologic, enhanced physiologic and voluntary tremor in man. Annals of Neurology. 1988;23:242–250. doi: 10.1002/ana.410230306. [DOI] [PubMed] [Google Scholar]
- Pellerin J-P, Lamarre Y. Local field potential oscillations in primate cerebellar cortex during voluntary movement. Journal of Neurophysiology. 1997;78:3502–3507. doi: 10.1152/jn.1997.78.6.3502. [DOI] [PubMed] [Google Scholar]
- Person RS, Kozhina GV. Study of orthodromic and antidromic effects of nerve stimulation on single motoneurones of human hand muscles. Electromyography and Clinical Neurophysiology. 1978;18:437–456. [PubMed] [Google Scholar]
- Rosenberg JR, Amjad AM, Breeze P, Brillinger DR, Halliday DM. The Fourier approach to the identification of functional coupling between neuronal spike trains. Progress in Biophysics and Molecular Biology. 1989;53:1–31. doi: 10.1016/0079-6107(89)90004-7. 10.1016/0079-6107(89)90004-7. [DOI] [PubMed] [Google Scholar]
- Salenius S, Portin K, Kajola M, Salmelin R, Hari R. Cortical control of human motorneuron firing during isometric contraction. Journal of Neurophysiology. 1997;77:3401–3405. doi: 10.1152/jn.1997.77.6.3401. [DOI] [PubMed] [Google Scholar]
- Salmelin R, Hari R. Spatiotemporal characteristics of sensorimotor neuromagnetic rhythms related to thumb movement. Neuroscience. 1994;60:537–550. doi: 10.1016/0306-4522(94)90263-1. 10.1016/0306-4522(94)90263-1. [DOI] [PubMed] [Google Scholar]
- Schöner G. A dynamic theory of co-ordination of discrete movement. Biological Cybernetics. 1990;63:257–270. doi: 10.1007/BF00203449. [DOI] [PubMed] [Google Scholar]
- Singer W. Synchronisation of cortical activity and its putative role in information processing and learning. Annual Review of Physiology. 1993;55:349–374. doi: 10.1146/annurev.ph.55.030193.002025. 10.1146/annurev.ph.55.030193.002025. [DOI] [PubMed] [Google Scholar]
- Smith AM. The coactivation of antagonistic muscles. Canadian The Journal of Physiology and Pharmacology. 1981;59:733–747. doi: 10.1139/y81-110. [DOI] [PubMed] [Google Scholar]
- Stein RB, Oguztöreli MN. Tremor and other oscillations in neuromuscular systems. Biological Cybernetics. 1984;22:147–157. doi: 10.1007/BF00365525. [DOI] [PubMed] [Google Scholar]
- Taylor A. The significance of grouping of motor unit activity. The Journal of Physiology. 1962;162:259–269. doi: 10.1113/jphysiol.1962.sp006930. [DOI] [PMC free article] [PubMed] [Google Scholar]
- Vallbo ÅB, Wessberg J. Organization of motor output in slow finger movements in man. The Journal of Physiology. 1993;469:673–691. doi: 10.1113/jphysiol.1993.sp019837. [DOI] [PMC free article] [PubMed] [Google Scholar]
- Welsh JP, Lang EJ, Sugihara I, Llinás R. Dynamic organisation of motor control within the olivocerebellar system. Nature. 1995;374:453–457. doi: 10.1038/374453a0. 10.1038/374453a0. [DOI] [PubMed] [Google Scholar]
- Welsh JP, Llinás RR. Some organizing principles for the control of movement based on olivocerebellar physiology. Progress in Brain Research. 1997;114:469–481. doi: 10.1016/s0079-6123(08)63380-4. [DOI] [PubMed] [Google Scholar]
- Wessberg J. Significant left-right synchronisation of pulsatile motor output in a human bimanual finger movement task. Society for Neuroscience Abstracts. 1996;22:428. [Google Scholar]
- Wessberg J, Vallbo ÅB. Coding of pulsatile motor output by human muscle afferents during slow finger movements. The Journal of Physiology. 1995;485:271–282. doi: 10.1113/jphysiol.1995.sp020729. [DOI] [PMC free article] [PubMed] [Google Scholar]
- Wessberg J, Vallbo ÅB. Pulsatile motor output in human finger movements is not dependent on the stretch reflex. The Journal of Physiology. 1996;493:895–908. doi: 10.1113/jphysiol.1996.sp021432. [DOI] [PMC free article] [PubMed] [Google Scholar]
- Windhorst U, Kokkoroyiannis T. Dynamic behaviour of alpha-motoneurons subjected to recurrent inhibition and reflex feedback via muscle spindles. Neuroscience. 1992;47:897–907. doi: 10.1016/0306-4522(92)90038-4. 10.1016/0306-4522(92)90038-4. [DOI] [PubMed] [Google Scholar]