

Abstract
In premature fetal sheep (89-93 days gestation) we examined the fetal response to asphyxia induced by 30 min of complete umbilical cord occlusion. Fetuses were also studied during the first 3 days after asphyxia. We measured heart rate, blood pressure, carotid and femoral blood flows, vascular resistance, electroencephalographic activity and cerebral changes in haemoglobin concentration by near infrared spectroscopy (NIRS).
Fetuses tolerated 30 min of asphyxia and the cardiovascular response was characterized by three phases: initial redistribution of blood flow away from the periphery to maintain vital organ function, partial failure of this redistribution and near terminal cardiovascular collapse, with profound hypotension and cerebral and peripheral hypoperfusion.
Post-asphyxia carotid blood flow and NIRS data demonstrated that between 3-5 h there was a significant secondary reduction in cerebral blood flow, blood volume and oxygenation despite normal perfusion pressure and heart rate. There was also a secondary fall in femoral blood flow which persisted throughout recovery.
These data demonstrate that the immature fetus can survive a prolonged period of asphyxia, but paradoxically the capacity to survive exposes the fetus to profound hypotension and hypoperfusion. A secondary period of significant cerebral hypoperfusion and reduced oxygen delivery also occurred post-asphyxia. These cardiovascular and cerebrovascular responses may contribute to the patterns of cerebral injury seen in the human preterm fetus.
In recent years improvements in obstetric and paediatric management have resulted in increased survival of infants from 24 weeks of gestation. However, these infants have continued to have a significantly increased risk of cerebral palsy, neurological morbidity and mortality (Volpe, 1997). There is increasing evidence to show that the neurological sequelae in many of these infants are the consequence of asphyxia during fetal life (Nelson & Leviton, 1991). Further it has been strongly suggested that haemodynamic factors both during asphyxia and during the post-asphyxial reperfusion phase contribute considerably to the pathogenesis of neurological disorders in the preterm fetus (Volpe, 1997). Currently, however, our understanding of the cerebrovascular and cardiovascular response of the preterm fetus to asphyxia is very limited.
The cardiovascular and cerebrovascular responses of the near-term fetus to episodes of reduced oxygen supply have been well described (Jensen & Berger, 1991; Hanson, 1997; Volpe, 1997). These responses, particularly the redistribution of combined ventricular output (CVO) away from the periphery, contribute significantly to protecting essential organs such as the heart and brain. It has been suggested that immaturity of cardiovascular development may leave the preterm fetus more vulnerable to asphyxia (Jensen & Berger, 1991; Volpe, 1997). However, the current evidence regarding this hypothesis is both limited and contradictory. Several studies in the 0.6 gestation sheep fetus, an age broadly equivalent in neuronal development to a human fetus of 27-28 weeks gestation (McIntosh et al. 1979), have shown that unlike the near-term fetus redistribution of blood flow and bradycardia does not occur during hypoxia and that there is no rise in blood pressure (Boddy et al. 1974; Iwamoto et al. 1989). Similar observations were made during partial umbilical cord occlusion, although in this study there was evidence of redistribution of CVO (Iwamoto et al. 1991). Further, the ability of the fetal cerebrovasculature to vasodilate during hypoxia appears to be blunted and cerebral oxygen consumption is sustained in part by an increase in fractional oxygen extraction (Gleason et al. 1990). It has been suggested that these preterm fetal responses reflect relative immaturity of chemoreceptor function and neurohormonal modulators as well as an incomplete development of the autonomic nervous system (Walker et al. 1979; Iwamoto et al. 1991; Jensen & Berger, 1991).
In contrast to these studies others have demonstrated that the 0.6 gestation sheep fetus appears to have a qualitatively similar cardiovascular response to complete occlusion of the umbilical cord to that of the near-term fetus, with an initial significant rise in blood pressure and a pronounced bradycardia (Mallard et al. 1994; Keunen et al. 1997). However, neither study evaluated the redistribution of blood flow. The study by Keunen et al. demonstrated the capacity of the immature animal to survive at least 20 min of complete umbilical cord occlusion, compared with a terminal duration for survival in the near-term sheep fetus of 10-12 min (Mallard et al. 1992). This capacity of the preterm fetus to survive longer periods of reduced oxygen supply is well described by others and is due to such factors as greater glycogen stores, greater anaerobic capacity in many tissues and lower basal metabolic activity (Dawes et al. 1959; Duffy et al. 1975).
Speculatively, these data suggest that the very premature fetus may preferentially utilize this metabolic reserve during moderate hypoxia, and would only mount a full cardiovascular response to profound, near-terminal episodes of asphyxia. In pilot experiments we have determined that the preterm fetus is capable of surviving 30-33 min of complete umbilical cord occlusion. The cardiovascular response of the preterm fetus to such a near-terminal duration of asphyxia and the degree of haemodynamic compromise, including hypotension and cerebral hypoperfusion, that may occur is unknown.
Furthermore the effects of such a profound insult on the post-asphyxial cardiovascular and cerebrovascular recovery of the preterm fetus have not been evaluated. There is considerable data from the more mature brain to suggest that the early post-asphyxial period is an important time during which further cerebral injury may occur. Ischaemia-reperfusion is associated with vascular dysfunction leading to post-insult impairment of blood flow and its regulation in many organs (Conger & Weil, 1995). A delayed, secondary fall in cerebral blood flow has been reported in both adult and neonatal preparations following asphyxia or ischaemia and is suggested to contribute to further injury (Rosenberg, 1988; Rosenberg et al. 1989; Gunn et al. 1997; Pourcyrous et al. 1997; Dorrepaal et al. 1997). Therapeutic intervention during this phase can significantly improve recovery of cerebral function (Gunn et al. 1997).
It was the purpose of this study, therefore, to examine the cardiovascular, cerebrovascular and electroencephalographic (EEG) response of the 0.6 gestation fetal sheep to 30 min of asphyxia induced by complete umbilical cord occlusion and to evaluate the haemodynamic changes during the first 3 days after asphyxia.
METHODS
Animal preparation
All procedures were approved by the Animal Ethics Committee of The University of Auckland, New Zealand. Twenty Romney/Suffolk fetal sheep were instrumented at 86-89 days of gestation (term = 147 days) under general anaesthesia (2 % halothane in O2) using sterile techniques (Mallard et al. 1992; Gunn et al. 1997). Ewes were given 5 ml of Streptopen intramuscularly for prophylaxis. Catheters were placed in the left femoral artery and vein, the right axillary artery and the amniotic sac. Ultrasound blood flow probes (2S, Transonic Systems Inc., Ithaca, NY, USA) were placed around the right femoral artery and the left carotid artery for the measurement of femoral blood flow (FBF) and carotid blood flow (CaBF) (Van Bel et al. 1994; Gunn et al. 1997). The vertebral-occipital anastamoses were ligated bilaterally to restrict vertebral blood supply to the carotid arteries; the lingual arteries were also ligated to restrict non-cerebral blood flow (Gunn et al. 1997). Two pairs of EEG electrodes (AS633-5SSF, Cooner wire Co., Chatsworth, CA, USA) were placed on the dura over the parasagittal parietal cortex (5 mm and 10 mm anterior to bregma and 5 mm lateral), with a reference electrode sewn over the occiput. Electrocardiogram (ECG) electrodes (AS633-3SSF) were sewn across the chest to record the fetal ECG.
In five of the ten control and five of the ten experimental fetuses two small flexible fibre optic probes, used for the near infrared recordings, were placed biparietally on the skull 3.0 cm apart, 1.5 cm anterior to bregma, and secured using rapid setting dental cement (Rocket Red, Dental Adventures of America, Inc., Anaheim, CA, USA). An inflatable silicone occluder was placed around the umbilical cord of all fetuses (In Vivo Metric, Healdsburg, CA, USA). All leads were exteriorized through the maternal flank. Gentamicin was administered into the amniotic sac prior to closure. A maternal tarsal vein was catheterized.
After surgery sheep were housed together in separate metabolic cages with access to water and food ad libitum. They were kept in a temperature-controlled room (16 ± 1°C, humidity 50 ± 10 %), in a 12 h light-dark cycle. A period of 3-5 days post-operative recovery was allowed during which time antibiotics were administered intravenously (i.v.) daily to the ewe (600 mg Crystapen and 80 mg Gentamicin, i.v. daily for 4 days). Fetal catheters were maintained patent by continuous infusion of heparinized saline (10 u ml−1 at 0.15 ml h−1).
Recordings
Fetal arterial and venous blood pressure, corrected for amniotic fluid pressure (Novatrans II, MX860, Medex Inc, Ohio), fetal heart rate (FHR), ECG, CaBF and FBF (T208 Ultrasonic Flowmeter, Transonic Systems Inc.), and EEG activity were recorded continuously from 12 h before the experiment until 72 h afterwards. Data was collected and stored to disk using custom software (Labview for Windows, National Instruments Ltd, Austin, TX, USA).
Near infrared spectroscopy (NIRS) measurements
Concentration changes in fetal cerebral deoxyhaemoglobin ([Hb]) and oxyhaemoglobin ([HbO2]), from which total hemoglobin ([THb]) was calculated, were measured using the NIR 500 spectrophotometer (Hamamatsu Photonics KK, Hamamatsu City, Japan) and data recorded by computer for off-line analysis. Data were collected with a temporal resolution of 30 s. The principles of NIRS have been described previously (Reynolds et al. 1988; Wyatt et al. 1990) and employed in the chronically instrumented fetal sheep preparation to determine changes in cerebral blood volume (CBV) both during and following hypoxia, asphyxia and cerebral ischaemia (Marks et al. 1996a,b; Bennet et al. 1998).
Briefly near infrared light, at three different wavelengths between 775 and 908 nm, was carried to the fetal head through a fibre optic bundle. Emerging light was collected by the second optode and transmitted to the spectrophotometer. Changes in the cerebral [HbO2] and [Hb] were calculated from the modified Lambert-Beer law using a previously established algorithm which describes optical absorption in a highly scattering medium (Wray et al. 1988; Reynolds et al. 1988). Changes in [THb] were obtained as the sum of changes in [HbO2] and [Hb] and are related to CBV (in ml (100 g brain)−1) by the cerebral haematocrit: CBV = [THb]/(HR) where H is the arterial Hb and R the cerebral-to-large vessel hematocrit ratio, assumed to be 0.69 (Wyatt et al. 1990). The absorption coefficients of HbO2 and Hb are known and therefore changes in the intracerebral concentration of the chromophores can be calculated from changes in optical absorption (Wray et al. 1988). The NIRS measures obtained are relative changes from zero not absolute changes. CBV was not quantitatively measured, but [THb] may be used as an index of CBV given a stable blood haemoglobin and haematocrit (Van Bel et al. 1993). Standardization of the optical path length used and fixation of the optodes to the surface of the skull by dental cement served to reduce signal variability within and between subjects in this study.
Experimental procedures
Experiments were conducted at 89-92 days gestation. Fetuses were randomly assigned to either the sham occlusion group (n = 10) or the occlusion group (n = 10). Fetal asphyxia was induced in the occlusion group by rapid inflation of the umbilical occluder for 30 min with sterile saline of a defined volume known to completely inflate the occluder. The success of occlusion was confirmed by observation of an immediate sharp rise in mean arterial blood pressure (MAP) and a rapid fall in FHR. In both groups fetal arterial blood samples were taken from the axillary artery catheter at 15 min prior to asphyxia, 5 and 25 min during asphyxia and 1, 6, 24, 48 and 72 h after asphyxia for pH, blood gas, haematocrit (Hct) and haemoglobin (Hb) determination (Ciba-Corning Diagnostics 845 blood gas analyser and co-oximeter, Medfield, MA, USA) and for glucose and lactate measurements (YSI model 2300, Yellow Springs, OH, USA). Fetuses were studied for 3 days post-asphyxia and on completion of the experiment the ewes and fetuses were killed by an i.v. barbiturate overdose to the ewe.
Data analysis
Data are presented as means ± s.e.m. Off-line analysis was performed using an analysis program written using Labview for Windows (National Instruments Ltd, Austin, TX, USA). For the analysis of the occlusion and 1 h post-occlusion, data were compared with the mean of the hour prior to occlusion (baseline). For the analysis of the long term recovery data (1-72 h post-occlusion) the baseline period was taken as the mean of the 12 h before occlusion. For within-group comparisons over time, data were analysed by one-way analysis of variance for repeated measures. Where statistical changes over time were found, Dunnett's post hoc test was used to determine any significant differences between individual values and the baseline values. For between group comparisons two-way analysis of variance for repeated measures was performed. When statistical significance was found between groups or between group and time, analysis of covariance (ANCOVA) was used to compare selected time points, using the baseline control periods prior to occlusion as a covariate.
Carotid and femoral vascular resistance (CaVR and FVR) were calculated using the formula (mean arterial pressure - mean venous pressure)/blood flow (mmHg min ml−1). The data from left and right EEG electrodes were averaged to give mean total EEG activity. The total EEG intensity was log transformed (dB, 20 × log(intensity)), as this transformation gives a better approximation of the normal distribution (Williams et al. 1992). Statistical significance was accepted when P < 0.05.
RESULTS
Blood composition measurements
Values and statistical comparisons for arterial pH (pHa), blood gases and glucose and lactate for the control and asphyxia groups are presented in Table 1. In the occlusion group oxygen content fell to 0.2 ± 0.0 mM at 5 min (vs. 3.4 ± 0.0 mM in the control group, P < 0.001) and was 0.4 ± 0.0 mM at 25 min (vs. 3.7 ± 0.1 mM in the control group, P < 0.001). Oxygen content was significantly elevated compared with the control group at 6 h (3.9 ± 0.0 vs. 3.2 ± 0.1 mM, P < 0.005) and at 24 h (3.9 ± 0.0 vs. 3.3 ± 0.1 mM in the control group, P < 0.005). There were no significant changes in arterial Hb and Hct values between the control and occlusion groups during asphyxia. The Hct was slightly elevated in the occlusion group at 24 h post-asphyxia (25.5 ± 0.8 % vs. 23.6 ± 0.7 % in the control group, P < 0.05).
Table 1.
Fetal arterial pH, blood gases, glucose and lactate values 15 min before (control), during (5 and 15 min) and after either 30 min of sham (control group, C) or complete umbilical cord occlusion (occlusion group, O)
| Control | 5 min | 25 min | 1 h post | 6 h post | 24 h post | 48 h post | 72 h post | ||
|---|---|---|---|---|---|---|---|---|---|
| pHa | C | 7.382 ± 0.0 | 7.380 ± 0.0 | 7.416 ± 0.0 | 7.380 ± 0.0 | 7.387 ± 0.0 | 7.374 ± 0.0 | 7.372 ± 0.0 | 7.359 ± 0.0 |
| O | 7.378 ± 0 | 0 7.054 ± 0.0 † | 6.749 ± 0.0 † | 7.335 ± 0.0 † | 7.338 ± 0.0 | 7.376 ± 0.0 | 7.349 ± 0.0 * | 7.356 ± 0.0 | |
| Pa,CO2 (mmHg) | C | 45.3 ± 1.1 | 44.0 ± 0.8 | 46.2 ± 0.7 | 46.0 ± 0.8 | 46.5 ± 1.0 | 46.1 ± 1.6 | 47.5 ± 0.9 | 47.2 ± 0.8 |
| O | 46.7 ± 0.9 | 92.0 ± 2.6 † | 153.2 ± 6.0 † | 44.2 ± 1.0 | 45.0 ± 0.5 | 47.5 ± 0.9 | 46.3 ± 1.3 | 46.5 ± 0.9 | |
| Pa,O2 (mmHg) | C | 23.1 ± 0.7 | 23.6 ± 0.7 | 23.5 ± 0.8 | 23.5 ± 0.6 | 22.8 ± 0.5 | 23.2 ± 0.7 | 23.6 ± 0.7 | 23.9 ± 1.1 |
| O | 24.4 ± 0.9 | 5.2 ± 0.7 † | 9.1 ± 0.9 † | 25.2 ± 1.3 | 25.8 ± 0.9 | 25.6 ± 0.7 * | 25.8 ± 0.6 * | 25.3 ± 0.6 | |
| [Glucose] (mm) | C | 1.02 ± 0.1 | 1.00 ± 0.1 | 1.05 ± 0.1 | 1.11 ± 0.1 | 1.08 ± 0.1 | 1.09 ± 0.1 | 1.11 ± 0.1 | 1.04 ± 0.1 |
| O | 1.20 ± 0.1 | 0.51 ± 0.1 † | 0.53 ± 0.2 † | 1.38 ± 0.1 * | 1.25 ± 0.1 | 1.27 ± 0.1 | 1.08 ± 0.1 | 1.20 ± 0.1 | |
| [Lactate] (mm) | C | 0.96 ± 0.1 | 1.06 ± 0.1 | 1.02 ± 0.1 | 1.07 ± 0.1 | 1.10 ± 0.1 | 1.02 ± 0.1 | 0.88 ± 0.1 | 0.91 ± 0.0 |
| O | 0.84 ± 0.1 | 3.79 ± 0.2 † | 7.81 ± 0.2 † | 3.13 ± 0.2 † | 1.09 ± 0.1 | 0.84 ± 0.1 | 1.14 ± 0.2 | 1.12 ± 0.4 | |
| Base excess (mM) | C | 1.35 ± 0.5 | 0.53 ± 1.7 | 0.36 ± 0.1 | 1.45 ± 0.5 | 2.75 ± 0.5 | 1.59 ± 1.1 | 1.68 ± 0.5 | 0.49 ± 0.6 |
| O | 1.60 ± 0.5 | −5.9 ± 0.6 † | −15.2 ± 0.8 † | −2.79 ± 0.7 † | 1.54 ± 0.8 | 1.84 ± 0.8 | −0.74 ± 0.8 * | −0.25 ± 0.6 |
Data are means ± s.e.m.
P < 0.05
P < 0.001 (between group comparisons by ANCOVA, n = 10 in each group).
EEG data
There was no significant difference in EEG activity between the control and occlusion groups during the baseline period or in the control group during or after the sham occlusion period compared with baseline. In the occlusion group the fetal EEG rapidly fell at the onset of occlusion and remained significantly depressed compared with control group during occlusion and during the hour post-occlusion (P < 0.005, Fig. 1) and for the 3 days post-occlusion (P < 0.001, Fig. 4).
Figure 1. The effect of 30 min of asphyxia induced by complete umbilical cord occlusion on fetal electroencephalographic (EEG) activity, mean arterial blood pressure (MAP) and heart rate (FHR).
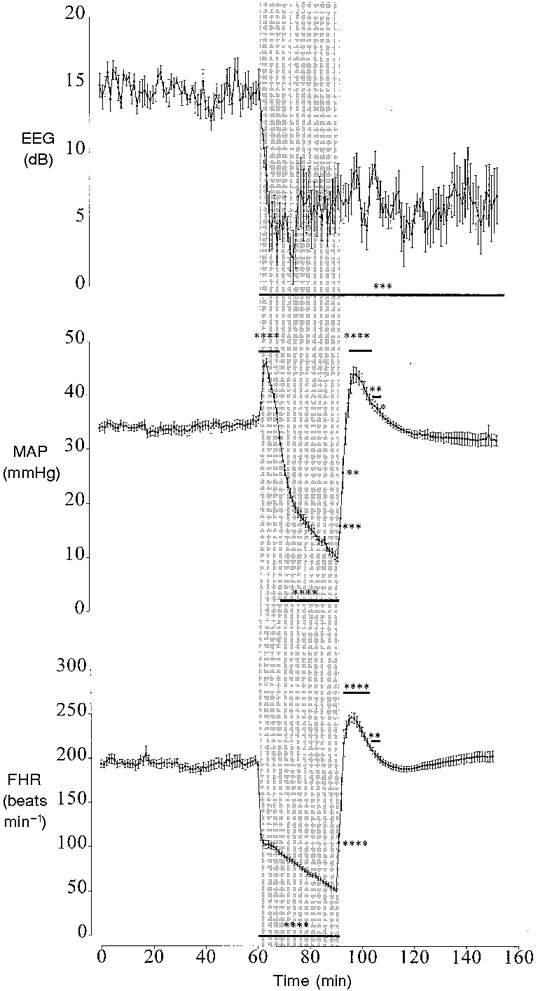
Data from the asphyxia group only shown. The shaded region denotes the period of asphyxia. Values are 1 min averages, means ± s.e.m. * P < 0.05, ** P < 0.01, *** P < 0.005, **** P < 0.001, asphyxia group vs. control group (ANCOVA, n = 10 in each group). The horizontal bars show the time periods over which data had the same significance.
Figure 4. The changes in electroencephalographic activity (EEG), mean arterial pressure (MAP) and fetal heart rate (FHR) before and after asphyxia.
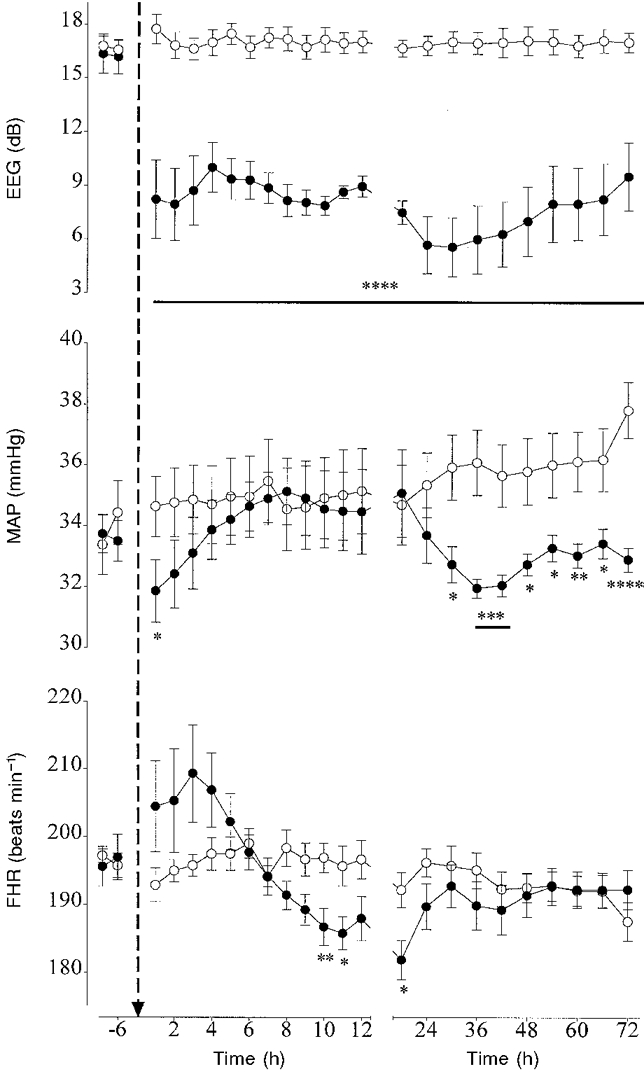
Data are means ± s.e.m. Data from the control group (○, n = 10) and the occlusion group (•, n = 10) are averaged over 6 h periods before asphyxia, hourly during the first 12 h after asphyxia and over 6 h periods thereafter. The arrow denotes when asphyxia occurred. * P < 0.05, ** P < 0.01, *** P < 0.005, **** P < 0.001, asphyxia group vs. control group by ANCOVA. The horizontal bars show the time periods over which data had the same significance.
Cardiovascular data during occlusion and 1 h post-occlusion
Blood pressure and heart rate
There were no significant differences in MAP, mean venous pressure (MVP) or FHR between the control and occlusion groups during the baseline period and in the control group during or after sham occlusion compared with baseline. In the occlusion group during asphyxia there was an initial rapid rise in MAP which peaked by 3 min. MAP then progressively fell to 10.1 ± 0.8 mmHg by 30 min of occlusion (vs. 34.3 ± 1.0 mmHg in the control group, P < 0.001). Post-occlusion there was a brief significant rebound hypertension between 5 and 16 min with MAP peaking at 7 min (P < 0.001, Fig 1). MVP initially rose at the onset of occlusion to 2.9 ± 0.5 mmHg by 4 min (vs. 0.9 ± 0.4 mmHg in the control group, P < 0.05) and returned to control values by 6 min. Immediately post-occlusion MVP transiently increased during the first 7 min, peaking in the first minute (3.0 ± 0.6 vs. 1.3 ± 0.2 mmHg in the control group, P < 0.05) and thereafter returned to control. FHR fell rapidly at the start of occlusion and reached 51.6 ± 2.2 beats min−1 by 30 min occlusion (vs. 193.3 ± 1.9 beats min−1 in the control group, P < 0.001, Fig. 1). Post-occlusion there was a brief period of rebound tachycardia peaking by 6 min at 246.9 ± 5.6 beats min−1 (P < 0.001, Fig. 1).
Carotid and femoral blood flow and vascular resistance
There were no significant differences in CaBF, CaVR, FBF and FVR between the control and occlusion groups during the baseline period or in the control group during or after sham occlusion compared with baseline. In the occlusion group there was a tendency for CaBF to rise during the first minute, but this was not significant. CaBF remained around baseline values until 9 min of occlusion then progressively fell to 5.0 ± 0.9 ml min−1 by 30 min (vs. 16.4 ± 1.8 ml min−1 in the control group, P < 0.001, Fig. 2). Post occlusion there was a brief period of hyperperfusion between 3 and 10 min (P < 0.001), and between 27 and 48 min (P < 0.05). During occlusion CaVR was significantly elevated between 2 and 8 min, peaking at 4 min (P < 0.005, Fig. 2). CaVR then fell and was significantly lower than baseline between 11 and 16 min of occlusion (P < 0.05). Thereafter there was a tendency for CaVR to increase until the end of occlusion, but this was not significant. Post-occlusion CaVR fell and was significantly lower than baseline between 2 and 3 min and 27 and 46 min (P < 0.05).
Figure 2. The effect of 30 min of asphyxia induced by complete umbilical cord occlusion on fetal carotid and femoral blood flow (CaBF and FBF) and vascular resistance (CaVR and FVR).
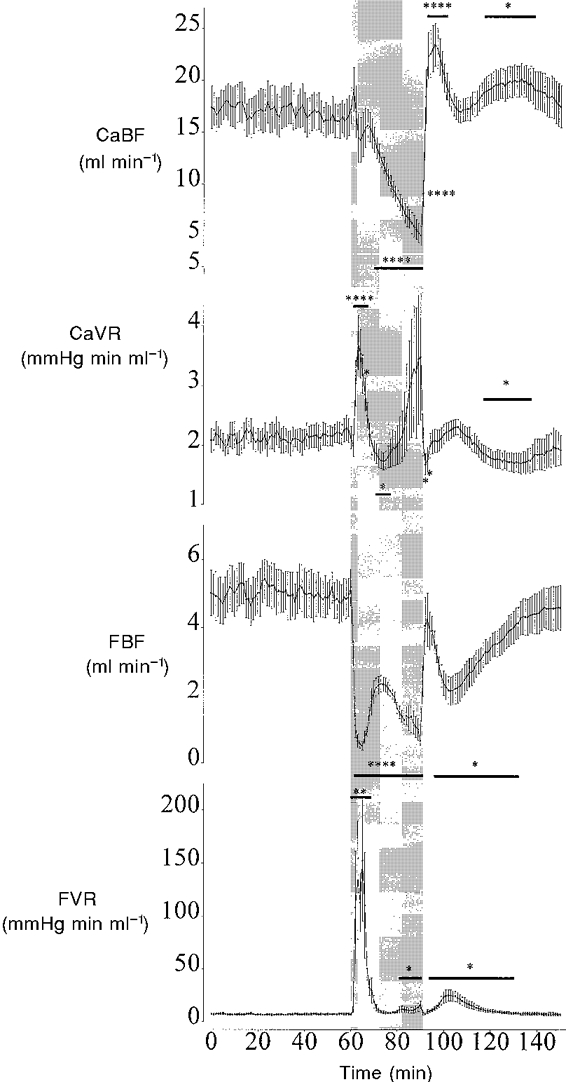
Data from the asphyxia group only shown. The shaded region denotes the period of asphyxia. Values are 1 min averages, means ± s.e.m. * P < 0.05, ** P < 0.01, **** P < 0.001, asphyxia group vs. control group by ANCOVA, n = 10 in each group. The horizontal bars show the time periods over which data had the same significance.
At the onset of occlusion FBF rapidly fell and was significantly lower than baseline for the entire occlusion period (P < 0.001, Fig. 2). FBF initially fell reaching a nadir by 5 min (0.5 ± 0.1 vs. 5.3 ± 0.5 ml min−1 in the control group, P < 0.001, Fig. 2). This fall was not sustained and FBF transiently rose between 5 and 13 min before falling again to 0.3 ± 0.7 ml min−1 by 30 min of occlusion (P < 0.001). Post-occlusion FBF briefly returned to baseline values between 2 and 5 min, before falling again between 6 and 37 min (P < 0.05). At the onset of occlusion FVR was significantly elevated during the first 12 min of occlusion peaking by 5 min (Fig. 2). FVR then returned to baseline until 21 min of occlusion when FVR significantly increased again (P < 0.05). Post-occlusion FVR was significantly elevated compared with baseline between 4 and 33 min (P < 0.05).
NIRS data
There were no significant differences in [THb], [Hb] and [HbO2] values between the control and occlusion groups during the baseline period or in the control group during or after sham occlusion compared with baseline. In the occlusion group there was no significant change in [THb] during the first 5 min of asphyxia and while there was a tendency for [THb] to be elevated between 5 and 13 min of occlusion this was not significant (Fig. 3). From 15 min of occlusion there was a significant fall in [THb] (P < 0.05). [Hb] was significantly elevated compared with baseline between 2 and 30 min of occlusion (P < 0.05, Fig. 3). The peak rise in [Hb] was seen at 9 min of occlusion and thereafter [Hb] gradually fell. [HbO2] fell significantly between 2 and 30 min of occlusion (P < 0.05, Fig. 3). Post-occlusion [THb] remained significantly lower than baseline until 12 min post-occlusion (P < 0.05). [Hb] initially remained elevated during the first 2 min post-occlusion (P < 0.05), then fell and was significantly lower than baseline between 10-18 min (P < 0.05). [HbO2] returned to control by 10 min post-occlusion.
Figure 3. The effect of 30 min of asphyxia induced by complete umbilical cord occlusion on total cerebral oxyhaemoglobin (THb, •), deoxyhaemoglobin (Hb, ○) and oxyhaemoglobin (HbO2, □) measured by near infrared spectroscopy.
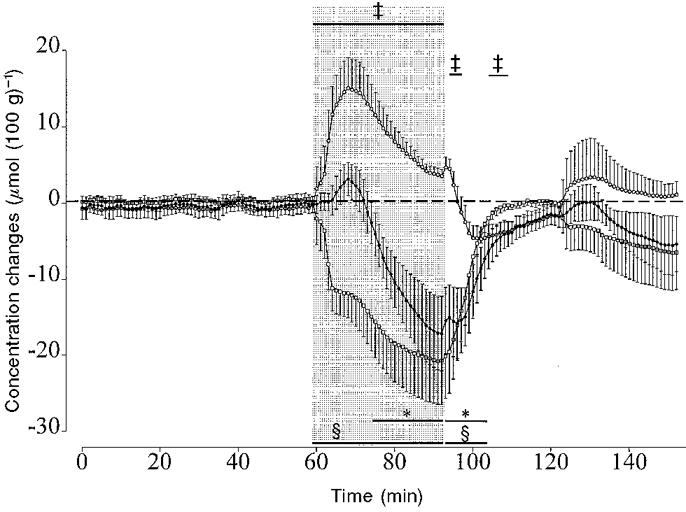
Data from the asphyxia group only are shown. Data are 1 min averages, means ± s.e.m. The shaded region denotes the period of asphyxia. The horizontal bars show the time periods over which the data are significantly different from the control group by ANCOVA, n = 5 in each group. * P < 0.05 (THb), ³ P < 0.05 (HbO2), ² P < 0.05 (Hb).
Long term recovery from asphyxia (1-72 h post-occlusion)
Blood pressure and heart rate
In the control group MAP rose over the course of the study and was significantly greater than baseline by 72 h (P < 0.01). In the occlusion group MAP was significantly lower than the control group at 1 h post-occlusion (P < 0.05, Fig. 4) and again from 30 h (P < 0.005, ANOVA). There was no significant difference in MVP between the occlusion and control groups post-occlusion. In the control group FHR progressively fell over the course of the study and was significantly lower than baseline at 72 h (P < 0.05). In the occlusion group FHR was slightly elevated during the first 4 h post-occlusion, but this was not significant (Fig. 4). FHR was significantly lower than the control group between 10 and 11 h and again at 18 h (P < 0.01, ANOVA, Fig. 4).
Carotid and femoral blood flow and vascular resistance
In the control group there was a significant increase in CaBF compared with baseline after 48 h (P < 0.05). There was no significant change in CaVR in the control group over time. In the occlusion group there was a significant fall in CaBF between 3 and 12 h compared the control group (P < 0.05, ANOVA). The nadir occurred at 4 h post-occlusion (10.6 ± 0.7 vs. 17.7 ± 2.1 ml min−1 in the control group, P < 0.005, Fig. 5). CaVR was significantly elevated between 4 and 8 h compared with the control group (P < 0.001, ANOVA).
Figure 5. The changes in carotid and femoral blood flow (CaBF and FBF) and vascular resistance (CaVR and FVR) before and after asphyxia.
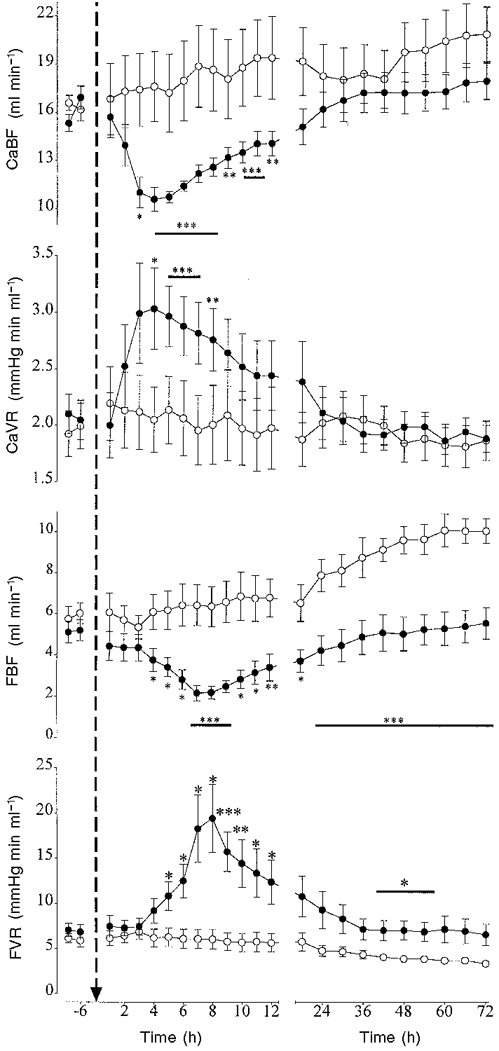
Data are means ± s.e.m. Data from the control group (○, n = 10) and the occlusion group (•, n = 10) are averaged over 6 h periods before asphyxia, hourly during the first 12 h after asphyxia and over 6 h periods thereafter. The arrow denotes when asphyxia occurred. * P < 0.05, ** P < 0.01, *** P < 0.005, **** P < 0.001, asphyxia group vs. control group by ANCOVA. The horizontal bars show the time periods over which data had the same significance.
In the control group there was a significant rise in FBF from 24 h (P < 0.01) and a fall in FVR from 30 h compared with baseline (P < 0.05). In the occlusion group there was a significant secondary fall in FBF with the nadir occurring at 8 h (2.2 ± 0.4 vs. 5.1 ± 0.5 ml min−1 in the control group, P < 0.001, Fig. 5). FBF then progressively rose, but remained significantly depressed compared with the control group for the remainder of the experiment (P < 0.001, ANOVA, Fig. 5). In the occlusion group FVR was significantly elevated between 5 and 12 h (P < 0.01, ANOVA) and between 42 and 54 h post-occlusion compared with the control group (P < 0.05, ANOVA, Fig. 5).
NIRS data
In the control group there were no significant differences in [Hb] and [THb] over time, although there was a tendency for [THb] to increase from 36 h (Fig. 6A). [HbO2] was significantly greater than baseline from 54 h (P < 0.05). In the occlusion group there was a significant fall in [THb] between 2 and 8 h post-occlusion compared with the control group (P < 0.05, ANOVA, Fig. 6B), the nadir occurring at 5 h (P < 0.005, Fig. 6B). [THb] fell again between 30 and 54 h and again at 72 h post-occlusion (P < 0.05, ANOVA, Fig. 6B). The second nadir occurred at 48 h (P < 0.01). There was a significant fall in [Hb] between 5 and 12 h compared with the control group (P < 0.005, ANOVA, Fig. 6B), the nadir occurring around 7 h (P < 0.001). [Hb] progressively fell between 42 and 72 h (P < 0.05, ANOVA). There was a significant fall in [HbO2] between 2 and 5 h compared with the control group, (P < 0.05, ANOVA, Fig. 6B), the nadir occurring at 3 h post-occlusion.
Figure 6. The changes in total cerebral oxyhaemoglobin (THb, •), deoxyhaemoglobin (Hb, ○) and oxyhaemoglobin (HbO2, □) before and after asphyxia as measured by near infrared spectroscopy.
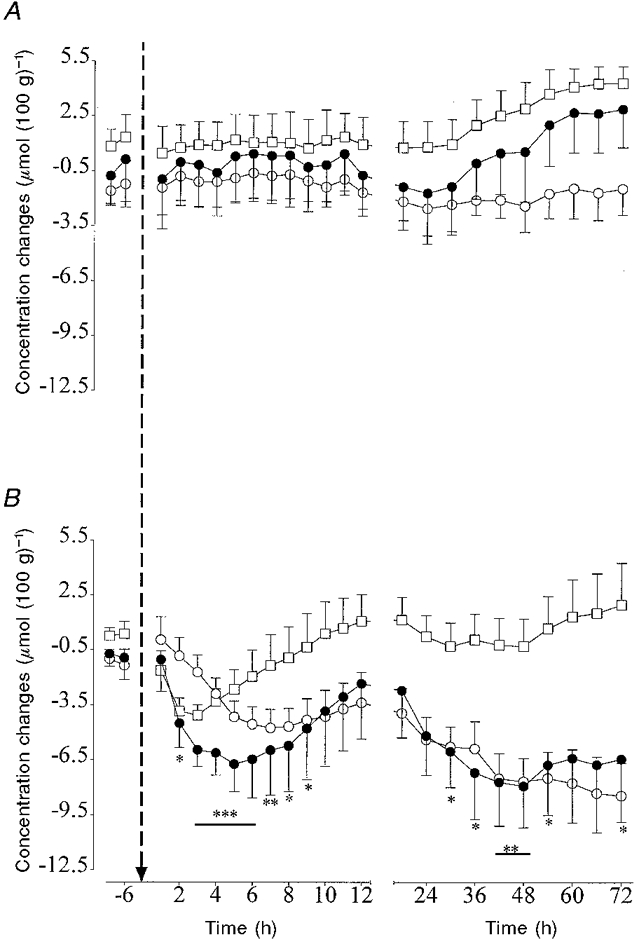
Data are means ± s.e.m. Data are averaged over 6 h periods before asphyxia, hourly during the first 12 h after asphyxia and over 6 h periods thereafter. The arrow denotes when asphyxia occurred. A, control group (n = 5); B, the occlusion group (n = 5). * P < 0.05, ** P < 0.01, *** P < 0.005, asphyxia group vs. control group by ANCOVA. The horizontal bars show the time periods over which data had the same significance. For clarity only the statistical changes for [THb] are shown.
DISCUSSION
This study examined the cardiovascular, cerebrovascular and EEG response of the preterm sheep fetus both during and after a near terminal period of acute severe asphyxia. We report several key observations which contribute to understanding the cardiovascular and cerebrovascular factors which mediate the ability of the preterm fetus to tolerate prolonged asphyxia, as well as those factors which may underlie cerebral injury.
The response of the premature fetus to asphyxia
During asphyxia the fetal cardiovascular and cerebrovascular response was characterized by three phases: initial redistribution of blood flow away from the periphery to maintain vital organ function, partial failure of this redistribution and near terminal cardiovascular collapse. In the first phase the fetus appears capable of mounting an initial cardiovascular defence to asphyxia that was qualitatively similar to that seen in the near-term fetus, including redistribution of CVO, hypertension and bradycardia (Ball et al. 1994; Mallard et al. 1994; Jensen & Hanson, 1995; Bennet et al. 1998). The rapid and sustained reduction in EEG activity during asphyxia in the premature fetus is similar to that observed in the near-term fetus (Mallard et al. 1994; de Haan et al. 1997). Speculatively this immediate fall in EEG may be a neuroprotective mechanism to reduce energy expenditure before the onset of final ATP depletion and neuronal depolarization (Duffy et al. 1972).
Several reviews of the literature have suggested that the sheep fetus before 90-100 days is not capable of mounting a cardiovascular response to asphyxia similar to that of the near-term fetus. It is further suggested that this may be due to the relative immaturity of several components of the reflex/endocrine response to acute hypoxia (Jensen & Berger, 1991; Hanson, 1997). These conclusions are based on several studies of hypoxia induced by reduction of maternal fractional inspired oxygen (Fi,O2) in the 0.6 gestation sheep fetus which have shown that in contrast to the near-term fetus bradycardia does not occur, blood pressure does not rise and redistribution of CVO is not apparent (Boddy et al. 1974; Iwamoto et al. 1989). Similarly during graded umbilical cord occlusion at this age the fetal cardiovascular response was characterized by a rise in FHR and no change in MAP (Iwamoto et al. 1991). This study did demonstrate, however, that the immature fetus has some capacity to redistribute CVO. The differences between these studies and the current study are likely to relate to such factors as the severity of the insult and the speed of onset of the insult. The current study employed a severe asphyxial insult of rapid onset and the data are consistent with two previous studies in the preterm sheep fetus using a similar insult in which hypertension and bradycardia were observed (Mallard et al. 1994; Keunen et al. 1997).
While blood flow was redistributed away from the periphery, the CaBF and NIRS data suggest that there was no increase in blood flow to the brain, but that initially blood flow was maintained around baseline values. We speculate that this does not relate to an immaturity of the mechanisms mediating CBF or cerebrovasculature immaturity. Instead we hypothesize that this is the normal fetal cerebrovascular response to a severe acute asphyxial insult of rapid onset. There are a number of studies in the near-term fetus which demonstrate that in response to this type of insult total CBF does not increase despite significant initial hypertension, but instead is either maintained at around baseline or may fall (Yaffe et al. 1987; Jensen et al. 1987; Field et al. 1990; Bennet et al. 1998). The failure of CBF to increase has been shown to be mediated by a significant increase in cerebral vascular resistance (CVR) and may be related to a rapid fall in oxygen content. In the term fetus the oxygen content threshold at which cerebral oxygen delivery and oxygen consumption are impaired is around 1.5 mM (Peeters et al. 1979). A similar threshold also applies in the immature fetus (Gleason et al. 1990). In the current study oxygen content was 0.2 ± 0.0 mM at 5 min. We have used carotid blood flow as an index of CBF because it has been shown to correlate well with CBF in the near-term fetus (Van Bel et al. 1994) and it can be used as a continuous measure of flow and to monitor initial rapid changes in flow. However the microsphere technique remains the only direct measure of CBF and clearly further studies are required to examine in greater detail the observations made in this paper and to determine how CBF is redistributed within the brain.
The second phase was characterized by a partial failure of the redistribution of blood flow. In particular there was a 50 % increase in FBF, which was associated with a fall in femoral vascular resistance. CaBF and blood pressure fell at this time and it is in this phase that the fall in blood pressure was steepest. It is likely that the failure of the redistribution of blood flow at this time hastened the onset of profound hypotension. We speculate that the intense initial peripheral vasoconstriction, which reduced peripheral blood flow to almost zero, may have resulted in exacerbated local tissue hypoxia and acidosis which in turn led to rebound vasodilatation at this time.
The final phase marked the onset of circulatory collapse as demonstrated by profound hypotension and hypoperfusion in both peripheral and central vascular beds despite an increase in vascular resistance. From the NIRS data there is evidence of a significant fall in total cerebral blood volume. The marked reciprocal changes in [Hb] and [HbO2], with a fall in [HbO2] and a rise in [Hb], which occur during the first phase, represent a fall in arterial saturation and can occur with or without changes in [THb] (Peebles et al. 1994; Nomura et al. 1996). The mechanisms underlying the different changes in [THb] are debated in the literature (Hamilton et al. 1996), but we have recently demonstrated that [THb] significantly increased during moderate isocapnic hypoxia in the near-term fetal sheep consistent with the observations that CBF also increases during this type of hypoxic insult (Peeters et al. 1979; Bennet et al. 1998). Conversely, during asphyxia induced by 10 min of umbilical cord occlusion, there was no increase in [THb], indicating that global CBV did not increase in response to asphyxia and these observations are consistent with the studies of CBF during asphyxia described above (Yaffe et al. 1987; Jensen et al. 1987; Field et al. 1990; Bennet et al. 1998).
While [THb] did not increase during asphyxia in the near-term fetus it never fell, suggesting that despite significant cerebral desaturation total CBV was held constant. The critical observation from the NIRS measurements in the current study is that in the preterm fetus during the latter half of asphyxia there was a profound fall in [THb] which was mediated by a fall in both [Hb] and [HbO2]. These data strongly suggest that total CBV was not held constant during the latter stages of asphyxia, but instead fell significantly. This loss of volume is likely to be a function of the failure of cerebral perfusion to be sustained with normal venous outflow as seen by the CaBF and MVP data. We propose that this occurs as a function of near circulatory collapse occurring towards the end of occlusion. To our knowledge this is the first time such a phenomenon has been documented during fetal asphyxia. It would suggest that any protective mechanisms such as redistribution of blood flow within the brain towards brainstem areas, as seen in the near-term fetus, are likely to fail at this time (Jensen et al. 1987). This may be one factor contributing to the greater occurrence of damage in such areas as the brainstem in premature human fetuses compared with the term fetus (Barkovich & Sargent, 1995).
Recovery from asphyxia
Following the end of occlusion, blood pressure, heart rate and carotid blood flow recovered rapidly and there was a brief period of hypertension, tachycardia and cerebral hyperperfusion. This is consistent with other fetal, neonatal and adult data on immediate haemodynamic changes post-asphyxia (Rosenberg, 1988; Mallard et al. 1994; Pourcyrous et al. 1997; Hossman, 1997). There was, however, no rapid rebound increase in [THb] suggesting that total CBV took some time to be restored. Similarly there was no rebound hyperperfusion in the periphery. This may not have occurred in order to continue to redirect blood flow to central areas or it may reflect significant compromise of the vasodilatory capacity of peripheral beds.
The most striking features of the post-asphyxial period were the secondary periods of hypoperfusion seen in both CaBF and FBF and the long term changes in [THb]. During the first 24 h post-asphyxia there was a transient fall of both flows over distinct time courses. These blood flow changes were not a function of a fall in blood pressure, but instead appear to be due to an actively mediated increase in vascular resistance. This argues against the fall in CBF being mediated by a loss of cerebral autoregulation (Volpe, 1997). The most critical period for the fetal brain during the hypoperfusion phase would appear to be between 3 and 5 h where the NIRS data suggest that there was a significant secondary reduction in both total cerebral blood volume and oxygenation despite normal perfusion pressure. These data are consistent with observations made in the human term newborn using NIRS which demonstrated that severely asphyxiated neonates, who subsequently developed neurological abnormalities, were prone to a profound decrease in CBV during the first 12 h after birth (Van Bel et al. 1993). They proposed that the relationship between decreasing CBV and adverse outcome suggests that cerebral hypoperfusion exacerbates neuronal injury.
The occurrence of a secondary phase of cerebral hypoperfusion occurring during the first few hours post-insult is well documented in the adult animal literature and has been documented in the newborn (Rosenberg, 1988; Conger & Weil, 1995; Pourcyrous et al. 1997; Dorrepaal et al. 1997; Hossman, 1997). We have previously demonstrated in the near-term sheep fetus, that a secondary period of hypoperfusion occurs several hours after severe ischaemia induced by bilateral carotid artery occlusion and is associated with a fall in oxygen extraction (Gunn et al. 1997). To our knowledge this is the first time this phenomenon has been reported in the mid-gestation fetus following asphyxia. It remains speculative as to whether this secondary period of cerebral hypoperfusion contributes to delayed neuronal injury (Hossman, 1997). In the present study the significant reduction in [HbO2] during the first few hours after the end of asphyxia suggests that cerebral oxygen delivery is limited relative to requirement and this may contribute to neural injury.
For the remainder of the study, while CaBF returned to normal total CBV was reduced as a consequence of a significantly decreased [Hb]. [HbO2] returned to normal suggesting that oxygen delivery was restored to baseline values. These blood flow and NIRS changes suggest that despite adequate perfusion and oxygen delivery there was delayed sustained failure of cerebral oxidative metabolism. The paradoxical failure of [THb] to return to control values at a time when CaBF had returned to normal might reflect cerebral cell damage. This concept is further supported by the continued profound suppression of the EEG. The final recovery of EEG activity following ischaemia has been shown to relate to the severity of neuronal injury (Gunn et al. 1992; Williams et al. 1992). Additionally these data are consistent with reports in the human term infant using magnetic resonance imaging demonstrating delayed derangement of oxidative metabolism following asphyxia which is associated with adverse neuronal outcome (Roth et al. 1997).
The secondary fall in FBF occurred later than the fall in CaBF. While FBF had returned to pre-occlusion baseline values by 24 h, the normal maturational increase in FBF seen in the control group was significantly attenuated. To our knowledge this is the first time prolonged peripheral hypoperfusion has been reported in the fetus following asphyxia. These data show that sustained reduction in FBF was mediated by an active increase in femoral vascular resistance rather than as a consequence of changes in blood pressure. In the adult local ischaemia-reperfusion injury is generally accompanied by significant changes in basal and reactive vascular function in most organs, particularly during the first 24-48 h, the basis of which is unknown, but which includes changes in the endothelial control of blood flow (Conger & Weil, 1995). The mechanisms mediating the changes in blood flow in the fetus and the time course and consequences of those changes remain to be determined.
In conclusion this study has demonstrated that the 0.6 gestation sheep fetus can survive 30 min of asphyxia induced by complete cord occlusion. Several distinct different phases of cardiovascular and cerebrovascular adaptation during and after this duration of asphyxia were seen. Initially the premature fetus shows marked cardiovascular centralization similarly to previous reports in the late gestation sheep fetus. As asphyxia continues centralization partially fails, followed by a remarkably prolonged period of near cardiovascular collapse, exposing the preterm fetus to very severe hypoxia and cerebral hypoperfusion. Following initial recovery from this asphyxial event there is delayed evolution of cerebral hypoperfusion with reduced cerebral oxygenation. Despite subsequent resolution of this phase, there is evidence of persistent impairment of cerebral oxidative metabolism. Further studies will be required to elucidate whether these responses contribute to the patterns of cerebral injury seen clinically at this stage of fetal maturation.
Acknowledgments
We acknowledge the support of the Health Research Council of New Zealand, The National Institutes of Health, USA (RO1-HD32752), Auckland Medical Research Foundation and Lottery Grants Board of New Zealand.
References
- Ball RH, Parer JT, Caldwell LE, Johnson J. Regional blood flow and metabolism in ovine fetuses during severe cord occlusion. American Journal of Obstetrics and Gynecology. 1994;171:1549–1555. doi: 10.1016/0002-9378(94)90400-6. [DOI] [PubMed] [Google Scholar]
- Barkovich AJ, Sargent SK. Profound asphyxia in the premature infant: Imaging findings. American Journal of Neuroradiology. 1995;16:1837–1846. [PMC free article] [PubMed] [Google Scholar]
- Bennet L, Peebles DM, Edwards AD, Rios A, Hanson MA. The cerebral hemodynamic response to asphyxia and hypoxia in the near term fetal sheep as measured by near-infrared spectroscopy. Pediatric Research. 1998;44:951–957. doi: 10.1203/00006450-199812000-00022. [DOI] [PubMed] [Google Scholar]
- Boddy K, Dawes GS, Fisher R, Pinter S, Robinson JS. Foetal respiratory movements, electrocortical and cardiovascular responses to hypoxaemia and hypercapnia in sheep. The Journal of Physiology. 1974;243:599–618. doi: 10.1113/jphysiol.1974.sp010768. [DOI] [PMC free article] [PubMed] [Google Scholar]
- Conger JD, Weil JV. Abnormal vascular function following ischemia-reperfusion injury. Journal of Investigative Medicine. 1995;43:431–442. [PubMed] [Google Scholar]
- Dawes GS, Mott JC, Shelley HJ. The importance of cardiac glycogen for the maintenance of life in foetal lambs and new-born animals during anoxia. The Journal of Physiology. 1959;146:516–538. doi: 10.1113/jphysiol.1959.sp006208. [DOI] [PMC free article] [PubMed] [Google Scholar]
- De Haan HH, Gunn AJ, Williams CE, Heymann MA, Gluckman PD. Magnesium sulfate therapy during asphyxia in near-term fetal lambs does not compromise the fetus but does not reduce cerebral injury. American Journal of Obstetrics and Gynecology. 1997;176:18–27. doi: 10.1016/s0002-9378(97)80005-1. [DOI] [PubMed] [Google Scholar]
- Dorrepaal CA, Shadid M, Steendijk P, Vandervelde ET, Van de Bor M, Baan J, Van Bel F. Effect of post-hypoxic-ischemic inhibition of nitric oxide synthesis on cerebral blood flow, metabolism and electrocortical brain activity in newborn lambs. Biology of the Neonate. 1997;72:216–226. doi: 10.1159/000244487. [DOI] [PubMed] [Google Scholar]
- Duffy TE, Kohle SJ, Vannucci RC. Carbohydrate and energy metabolism in perinatal rat brain: relation to survival in anoxia. Journal of Neurochemistry. 1975;24:271–276. doi: 10.1111/j.1471-4159.1975.tb11875.x. [DOI] [PubMed] [Google Scholar]
- Duffy TE, Nelson SR, Lowry OH. Cerebral carbohydrate metabolism during acute hypoxia and recovery. Journal of Neurochemistry. 1972;19:959–977. doi: 10.1111/j.1471-4159.1972.tb01417.x. [DOI] [PubMed] [Google Scholar]
- Field DR, Parer JT, Auslender RA, Cheek DB, Baker W, Johnson J. Cerebral oxygen consumption during asphyxia in fetal sheep. Journal of Developmental Physiology. 1990;14:131–137. [PubMed] [Google Scholar]
- Gleason CA, Hamm C, Jones MD., Jr Effect of acute hypoxemia on brain blood flow and oxygen metabolism in immature fetal sheep. American Journal of Physiology. 1990;258:H1064–1069. doi: 10.1152/ajpheart.1990.258.4.H1064. [DOI] [PubMed] [Google Scholar]
- Gunn AJ, Gunn TR, de Haan HH, Williams CE, Gluckman PD. Dramatic neuronal rescue with prolonged selective head cooling after ischemia in fetal sheep. Journal of Clinical Investigation. 1997;99:248–256. doi: 10.1172/JCI119153. [DOI] [PMC free article] [PubMed] [Google Scholar]
- Gunn AJ, Parer JT, Mallard EC, Williams CE, Gluckman PD. Cerebral histological and electrophysiological changes after asphyxia in fetal sheep. Pediatric Research. 1992;31:486–491. doi: 10.1203/00006450-199205000-00016. [DOI] [PubMed] [Google Scholar]
- Hamilton RJ, Hodgett SG, O'Brien PMS. Near infrared spectroscopy applied to intrapartum fetal monitoring. Baillieres Clinical Obstetrics and Gynaecology. 1996;10:307–324. doi: 10.1016/s0950-3552(96)80040-x. [DOI] [PubMed] [Google Scholar]
- Hanson MA. Do we now understand the control of the fetal circulation? European Journal of Obstetrics, Gynecology and Reproductive Biology. 1997;75:55–61. doi: 10.1016/s0301-2115(97)00203-0. 10.1016/S0301-2115(97)00203-0. [DOI] [PubMed] [Google Scholar]
- Hossman KA. Reperfusion of the brain after global ischemia: hemodynamic disturbances. Shock. 1997;8:95–101. doi: 10.1097/00024382-199708000-00004. [DOI] [PubMed] [Google Scholar]
- Iwamoto HS, Kaufman T, Keil LC, Rudolph AM. Responses to acute hypoxemia in fetal sheep at 0.6–0.7 gestation. American Journal of Physiology. 1989;256:H613–620. doi: 10.1152/ajpheart.1989.256.3.H613. [DOI] [PubMed] [Google Scholar]
- Iwamoto HS, Stucky E, Roman CM. Effect of graded umbilical cord compression in fetal sheep at 0.6–0.7 gestation. American Journal of Physiology. 1991;261:H1268–1274. doi: 10.1152/ajpheart.1991.261.4.H1268. [DOI] [PubMed] [Google Scholar]
- Jensen A, Berger R. Fetal circulatory responses to oxygen lack. Journal of Developmental Physiology. 1991;16:181–207. [PubMed] [Google Scholar]
- Jensen A, Hanson MA. Circulatory responses to acute asphyxia in intact and chemodenervated fetal sheep near term. Reproduction, Fertility and Development. 1995;7:1351–1359. doi: 10.1071/rd9951351. [DOI] [PubMed] [Google Scholar]
- Jensen A, Hohmann M, Kunzel W. Dynamic changes in organ blood flow and oxygen consumption during acute asphyxia in fetal sheep. Journal of Developmental Physiology. 1987;9:543–559. [PubMed] [Google Scholar]
- Keunen H, Blanco CE, Van Reempts JL, Hasaart TH. Absence of neuronal damage after umbilical cord occlusion of 10, 15, and 20 min in midgestation fetal sheep. American Journal of Obstetrics and Gynecology. 1997;176:515–520. doi: 10.1016/s0002-9378(97)70539-8. [DOI] [PubMed] [Google Scholar]
- McIntosh GH, Baghurst KI, Potter BJ, Hetzel BS. Foetal brain development in the sheep. Neuropathology and Applied Neurobiology. 1979;5:103–114. doi: 10.1111/j.1365-2990.1979.tb00664.x. [DOI] [PubMed] [Google Scholar]
- Mallard EC, Gunn AJ, Williams CE, Johnston BM, Gluckman PD. Transient umbilical cord occlusion causes hippocampal damage in the fetal sheep. American Journal of Obstetrics and Gynecology. 1992;167:1423–1430. doi: 10.1016/s0002-9378(11)91728-1. [DOI] [PubMed] [Google Scholar]
- Mallard EC, Williams CE, Johnston BM, Gluckman PD. Increased vulnerability to neuronal damage following umbilical cord occlusion in the fetal sheep with advancing gestation. American Journal of Obstetrics and Gynecology. 1994;170:206–214. doi: 10.1016/s0002-9378(94)70409-0. [DOI] [PubMed] [Google Scholar]
- Marks KA, Mallard EC, Roberts I, Williams CE, Gluckman PD, Edwards AD. Nitric oxide synthase inhibition attenuates delayed vasodilation and increases injury following cerebral ischemia in fetal sheep. Pediatric Research. 1996a;40:185–191. doi: 10.1203/00006450-199608000-00002. [DOI] [PubMed] [Google Scholar]
- Marks KA, Mallard EC, Roberts I, Williams CE, Sirimanne ES, Johnston BM, Gluckman PD, Edwards AD. Delayed vasodilation and altered oxygenation following cerebral ischemia in fetal sheep. Pediatric Research. 1996b;39:48–54. doi: 10.1203/00006450-199601000-00007. [DOI] [PubMed] [Google Scholar]
- Nelson KB, Leviton A. How much of neonatal encephalopathy is due to birth asphyxia? American Journal of Diseases of Children. 1991;145:1325–1331. doi: 10.1001/archpedi.1991.02160110117034. [DOI] [PubMed] [Google Scholar]
- Nomura F, Naruse H, Duplessis A, Hiramatsu T, Forbess J, Holtzman D, Volpe JJ, Jonas R, Tsuji M. Cerebral oxygenation measured by near infrared spectroscopy during cardiopulmonary bypass and deep hypothermic circulatory arrest in piglets. Pediatric Research. 1996;40:790–796. doi: 10.1203/00006450-199612000-00003. [DOI] [PubMed] [Google Scholar]
- Peebles DM, Spencer JA, Edwards AD, Wyatt JS, Reynolds EO, Cope M, Delpy DT. Relation between frequency of uterine contractions and human fetal cerebral oxygen saturation studied during labour by near infrared spectroscopy. British Journal of Obstetrics and Gynaecology. 1994;101:44–48. doi: 10.1111/j.1471-0528.1994.tb13008.x. [DOI] [PubMed] [Google Scholar]
- Peeters LL, Sheldon RE, Jones MDJ, Makowski EL, Meschia G. Blood flow to fetal organs as a function of arterial oxygen content. American Journal of Obstetrics and Gynecology. 1979;135:637–646. doi: 10.1016/s0002-9378(16)32989-1. [DOI] [PubMed] [Google Scholar]
- Pourcyrous M, Parfenova H, Bada HS, Korones SB, Leffler CW. Changes in cerebral cyclic nucleotides and cerebral blood flow during prolonged asphyxia and recovery in newborn pigs. Pediatric Research. 1997;41:617–623. doi: 10.1203/00006450-199705000-00003. [DOI] [PubMed] [Google Scholar]
- Reynolds EO, Wyatt JS, Azzopardi D, Delpy DT, Cady EB, Cope M, Wray S. New non-invasive methods for assessing brain oxygenation and haemodynamics. British Medical Bulletin. 1988;44:1052–1075. doi: 10.1093/oxfordjournals.bmb.a072289. [DOI] [PubMed] [Google Scholar]
- Rosenberg AA. Regulation of cerebral blood flow after asphyxia in neonatal lambs. Stroke. 1988;19:239–244. doi: 10.1161/01.str.19.2.239. [DOI] [PubMed] [Google Scholar]
- Rosenberg AA, Murdaugh E, White CW. The role of oxygen free radicals in postasphyxia cerebral hypoperfusion in newborn lambs. Pediatric Research. 1989;26:215–219. doi: 10.1203/00006450-198909000-00012. [DOI] [PubMed] [Google Scholar]
- Roth SC, Baudin J, Cady E, Johal K, Townsend JP, Wyatt JS, Reynolds EOR, Stewart AL. Relation of deranged neonatal cerebral oxidative metabolism with neurodevelopmental outcome and head circumference at 4 years. Developmental Medicine and Child Neurology. 1997;39:718–725. doi: 10.1111/j.1469-8749.1997.tb07372.x. [DOI] [PubMed] [Google Scholar]
- Van Bel F, Dorrepaal CA, Benders MJ, Zeeuwe PE, Van de Bor M, Berger HM. Changes in cerebral hemodynamics and oxygenation in the first 24 h after birth asphyxia. Pediatrics. 1993;92:365–372. [PubMed] [Google Scholar]
- Van Bel F, Roman C, Klautz RJM, Teitel DF, Rudolph AM. Relationship between brain blood flow and carotid arterial flow in the sheep fetus. Pediatric Research. 1994;35:329–333. doi: 10.1203/00006450-199403000-00011. [DOI] [PubMed] [Google Scholar]
- Volpe JJ. Brain injury in the premature infant - neuropathology, clinical aspects and pathogenesis. Clinics in Perinatology. 1997;24:567–587. [PubMed] [Google Scholar]
- Walker AM, Cannata JP, Dowling MH, Ritchie BC, Maloney JE. Age-dependent pattern of autonomic heart rate control during hypoxia in fetal and newborn lambs. Biology of the Neonate. 1979;35:198–208. doi: 10.1159/000241173. [DOI] [PubMed] [Google Scholar]
- Williams CE, Gunn AJ, Mallard EC, Gluckman PD. Outcome after ischemia in the developing sheep brain: An electroencephalographic and histological study. Annals of Neurology. 1992;31:14–21. doi: 10.1002/ana.410310104. [DOI] [PubMed] [Google Scholar]
- Wray S, Cope M, Delpy DT, Wyatt JS, Reynolds EOR. Characterisation of the near infrared absorption spectra of cytochrome aa3 and haemoglobin for the non-invasive monitoring of cerebral oxygenation. Biochimica et Biophysica Acta. 1988;933:184–192. doi: 10.1016/0005-2728(88)90069-2. [DOI] [PubMed] [Google Scholar]
- Wyatt JS, Cope M, Delpy DT, Richardson CE, Edwards AD, Wray S, Reynolds EO. Quantitation of cerebral blood volume in human infants by near-infrared spectroscopy. Journal of Applied Physiology. 1990;68:1086–1091. doi: 10.1152/jappl.1990.68.3.1086. [DOI] [PubMed] [Google Scholar]
- Yaffe H, Parer JT, Block BS, Llanos AJ. Cardiorespiratory responses to graded reductions of uterine blood flow in the sheep fetus. Journal of Developmental Physiology. 1987;9:325–336. [PubMed] [Google Scholar]