

Abstract
Using laser scanning confocal microscopy to image [Ca2+]i within intact murine islets of Langerhans, we analysed the [Ca2+]i signals generated by glucose in immunocytochemically identified α-, β- and δ-cells.
Glucagon-containing α-cells exhibited [Ca2+]i oscillations in the absence of glucose, which petered out when islets were exposed to high glucose concentrations.
Somatostatin-containing δ-cells were silent in the absence of glucose but concentrations of glucose as low as 3 mM elicited oscillations.
In pancreatic β-cells, a characteristic oscillatory calcium pattern was evoked when glucose levels were raised from 3 to 11 mM and this was synchronized throughout the β-cell population. Remarkably, [Ca2+]i oscillations in non-β-cells were completely asynchronous, both with respect to each other and to β-cells.
These results demonstrate that the islet of Langerhans behaves as a functional syncytium only in terms of β-cells, implying a pulsatile secretion of insulin. However, the lack of a co-ordinated calcium signal in α- and δ-cells implies that each cell acts as an independent functional unit and the concerted activity of these units results in a smoothly graded secretion of glucagon and somatostatin. Understanding the calcium signals underlying glucagon and somatostatin secretion may be of importance in the treatment of non-insulin-dependent diabetes mellitus since both glucagon and somatostatin appear to regulate insulin release in a paracrine fashion.
The maintenance of glucose concentration in blood within the appropriate range is mainly controlled by secretion of islet hormones, principally insulin from the islet of Langerhans. A diminished glucose-dependent insulin secretion from pancreatic β-cells results in non-insulin-dependent diabetes mellitus (NIDDM), responsible for 75 % of diabetic syndromes.
Pancreatic islets of Langerhans are formed by a heterogeneous population of cells: insulin-releasing β-cells (65-90 %), glucagon-releasing α-cells (15-20 %), somato-statin-producing δ-cells (3-10 %) and pancreatic polypeptide-producing PP-cells (1 %). Amongst this population β-cells have been by far the most studied in terms of stimulus- secretion coupling. In β-cells the stimulus-secretion coupling process involves the closure of KATP channels as a result of glucose metabolism, membrane depolarization and activation of voltage-dependent calcium channels (Prentki & Matchinsky, 1987; Valdeolmillos et al. 1992; Ripoll et al. 1996).
Using conventional Ca2+ imaging of the whole islet of Langerhans it has been demonstrated that stimulatory glucose concentrations induce a synchronous and homogeneous [Ca2+]i oscillatory pattern as a consequence of the bursting pattern of electrical activity characteristic of pancreatic β-cells (Valdeolmillos et al. 1989, 1993; Santos et al. 1991). As a result, pulsatile insulin secretion is triggered (Rosario et al. 1986; Martin et al. 1995; Barbosa et al. 1996). On the other hand, less is known about stimulus- secretion coupling in non-β-cells of the islet of Langerhans. Glucagon-secreting α-cells produce action potentials in the absence of glucose (Rorsman & Hellman, 1988), inducing calcium influx and exocytosis (Gromada et al. 1997), whilst the nature of the Ca2+ signal in α-cells is more controversial: some workers have reported [Ca2+]i oscillations in cultured α- and δ-cells in the presence of 3 mM glucose (Berts et al. 1995, 1996a,b), whereas a lack of [Ca2+]i oscillations was observed in α-cells within cultured intact islets (Asada et al. 1998). In the present study we have demonstrated the existence of oscillations in low glucose and its modulation by the sugar in α- and δ-cells. The [Ca2+]i oscillatory pattern is asynchronous in non-β-cells. Synchronicity between β-cells is nonetheless widespread, inducing islets to work as a syncytium in terms of insulin secretion but not in terms of glucagon and somatostatin secretion.
METHODS
Calcium signals
Swiss albino OF1 mice 8-10 weeks old were killed by cervical dislocation in accordance with national guidelines. Pancreatic islets of Langerhans were isolated from the mice using collagenase as previously described (Nadal et al. 1994). After isolation, islets were loaded by incubation in 5 μM fluo-3 AM (Molecular Probes) for at least 1 h at room temperature before imaging of the intracellular calcium. Calcium records in individual cells were obtained by imaging intracellular calcium under a Zeiss LSM 510 laser scanning confocal microscope using a Zeiss × 40 oil-immersion lens, numerical aperture 1.3. Images were collected at 2 s intervals and fluorescence signals from individual cells measured as a function of time using the Zeiss LSM software package. Experiments were performed at 36°C. Generally, cells at the centre of the islet loaded poorly so that most of the fluorescence was derived from cells at the periphery of the islet. As a general rule, poor loading of cells at the centre is observed when measuring [Ca2+]i in large preparations as, for instance, brain slices (Nadal et al. 1998) and is mainly due to problems with dye penetration. In the particular case of the islet of Langerhans this handicap is offset by the particular distribution of all cell types that form the islet: all the different types of cell are represented at the periphery, indeed α- and δ-cells are localized mainly in the periphery. However given the fact that β-cells are found in the islet centre, we are probably underestimating the true percentage of β-cells with our experimental conditions. Results were plotted using commercially available software (Sigmaplot, Jandel Scientific) as the change in fluorescence intensity (ΔF) expressed as a percentage of the basal fluorescence intensity (F0) observed in the absence of stimulus.
Immunocytochemistry
Once [Ca2+]i changes had been recorded, islets were washed for 10 min with phosphate-buffered saline (PBS) and fixed using 4 % (w/v) paraformaldehyde for 10 min, permeabilized with 1 % Triton X-100 for 10 min. To reduce non-specific antibody binding, cells were first pre-incubated with blocking buffer (2 % goat serum (Sigma) in PBS for 15 min at room temperature) before primary antibodies were applied in the same buffer. Anti-glucagon monoclonal antibody (1: 1000 dilution; Sigma) or rabbit anti-somatostatin antiserum (1: 800 dilution, generously provided by Dr A. Fairen, Miguel Hernández University) were applied for 3 h. After washing, fluorescein isothiocyanate (FITC)-conjugated secondary antibodies were applied for 1 h to visualize staining: goat anti-mouse antibody (1: 40 dilution) for glucagon and goat anti-rabbit antibody (1: 40 dilution) (both from Sigma) for somatostatin. Fluorescence was visualized using the same system as above.
Data analysis
Cross-correlation analyses were performed by computing the cross-correlation function to determine the degree of synchrony and to measure the time lags between the [Ca2+]i oscillations as described in Menéndez de la Prida et al. (1998).
The proportion of coupling between two signals at any time is obtained by taken one of the signals as a reference and displacing the other signal in time. Maximum coupling will be when one of the signals is displaced an interval of time equal to the delay between them.
In mathematical terms the Fourier transform H(f) of a function h(t) is given by the equation:
 |
where f is frequency and t is time. The Fourier transform of a signal is a function of frequency. The cross-correlation function between two signals g(t) and h(t) is a function of time, defined as:
where τ is step time. The cross-correlation functions of the calcium signals were computed by fast Fourier transform (FFT) using a well-known programmable routine (Press et al. 1992; computer program performed by Dr L. Menéndez de la Prida). All measurements are expressed as means ± s.e.m., where the number of cells and islets used are indicated in the figure legends.
RESULTS
To investigate calcium signals in individual cells and the relationships between the different cell types of the islet of Langerhans, acutely isolated islets were loaded with the fluorescent calcium-sensitive dye fluo-3 and fluorescence changes were imaged using laser scanning confocal microscopy. In all islets tested only the periphery was well loaded with the fluorescent indicator, as illustrated in Fig. 1A. It was clear that the Ca2+ signals showed considerable cell-to-cell heterogeneity and Fig. 1B shows three traces corresponding to the cells indicated in Fig. 1A, all within the same islet of Langerhans. Trace 1 shows a record typical of a pancreatic β-cell, where [Ca2+]i remains silent at low glucose concentrations (3 mM) until glucose stimulation (11 mM) elicits a transient increase of intracellular calcium and a subsequent train of oscillations (frequency of 1.93 ± 0.06 min−1; Fig. 1C). These [Ca2+]i signals reminiscent of β-cells were recorded in 44 % of the cells analysed (115 of 261 cells from 15 different islets). In contrast, trace 2 is a record of a cell which displays low-frequency oscillations in low glucose, which in turn are abolished by high glucose (Fig. 1C). This behaviour was observed in 19 % of the cells (49 of 261 cells from 15 different islets). These cells were identified as α-cells by immunostaining (see below). Trace 3 is characteristic of cells which also oscillated in low glucose, but at a higher frequency (Fig. 1C); unlike trace 2, 11 mM glucose evoked no change in the oscillatory frequency and was typical of 17 % of cells (44 of 261 cells from 15 different islets). These cells were identified as δ-cells (see below). A few cells (4 %) existed which oscillated in 3 mM glucose and responded to higher glucose concentrations as a typical β-cell (trace 5 in Fig. 4; 10 of 261 cells from 15 different islets) and 17 % did not respond to either 3 or 11 mM glucose and were therefore unresponsive cells. They may have been cells damaged by the isolation procedure or could belong to a heterogeneous group of β-cells that may respond at higher glucose concentration (Pipeleers, 1992).
Figure 1. Fluorescence changes measured from individual cells within intact islets of Langerhans.
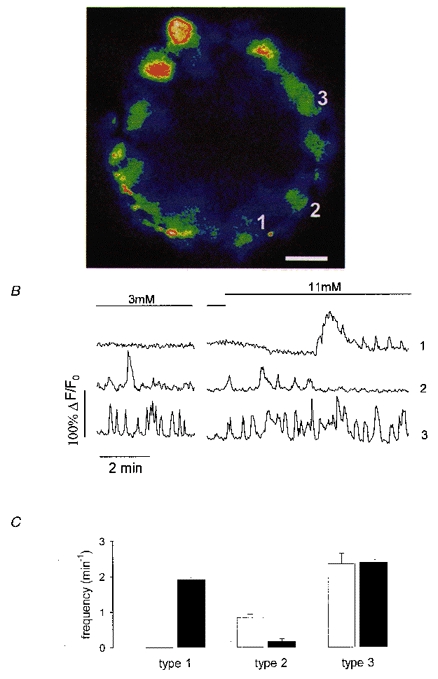
A, colour image of a fluo-3 loaded islet exposed to 3 mM glucose. Blue corresponds to low and red to high fluorescence intensity. The scale bar at the bottom right represents 15 μm. B, records of fluorescence intensity versus time from the islet in A. The boundaries of each cell were clearly visible from the low fluorescence at the cell edge. Islets exposed to 3 mM glucose were switched to 11 mM glucose as indicated by the bars on the record. Traces 1, 2 and 3 correspond to the cells labelled in A. The time break was 10 min. C, frequency of [Ca2+]i oscillations for cells with the same [Ca2+]i pattern as cell 1 (type 1), cell 2 (type 2) and cell 3 (type 3) in 3 mM glucose (□) and 11 mM glucose (▪). Results are pooled from 261 cells in 15 different islets and are expressed as means ± s.e.m.
Figure 4. Asynchronicity between δ-cells and between δ- and β-cells.
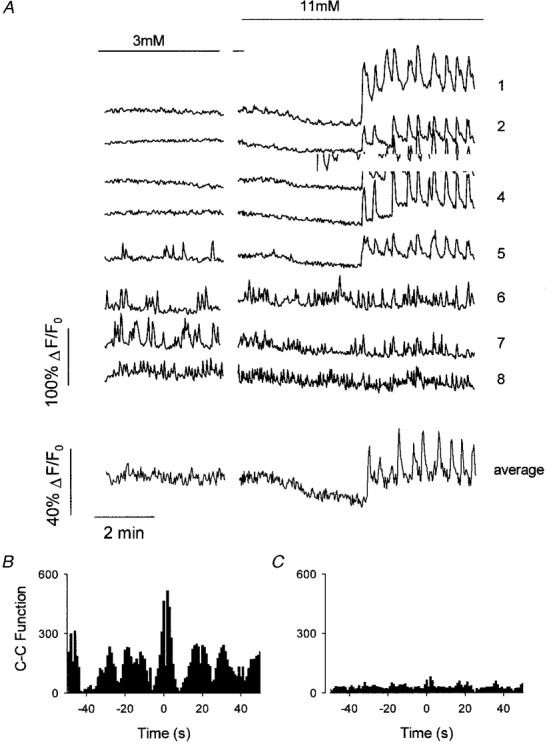
A, fluorescence records in response to a change from 3 to 11 mM glucose in 8 cells of an islet of Langerhans. Note that the stimulating glucose concentration (11 mM) induces synchronous oscillations in traces 1-5. Traces 6-8 represent cells with an oscillatory behaviour in the presence of 3 mM glucose. These cells were completely asynchronized and independent of glucose concentration. B, the cross-correlation (C-C) function from cells 3 and 4 clearly shows an oscillatory behaviour and a central peak, confirming the presence of highly correlated oscillatory events. Cell 3 was the reference cell. A cross-correlation function with any of the other cells (1-5) gave the same result. C, the cross-correlation function from cells 6 and 7 shows the absence of correlated events, confirming the total asynchronicity of δ-cells. Cell 6 was the reference cell. The cross-correlation function from cell 6 and cells 1-4 confirmed the absence of correlated events between δ-cells and β-cells.
Opposite effects of glucose on [Ca2+]i patterns in α- and δ-cells
Glucagon-secreting α-cells and somatostatin-secreting δ-cells in culture behave differently in the absence of glucose in terms of [Ca2+]i signalling: whilst α-cells display [Ca2+]i oscillations in the absence of glucose, δ-cells remain silent (Berts et al. 1995). Figure 2A shows traces from two cells in the same islet that responded differently to changes in glucose concentration. For the cell depicted in trace 1 there was an inverse relationship between the frequency of [Ca2+]i oscillations, the time that [Ca2+]i was elevated and the external glucose concentration (Fig. 2B and C; •). In 3 mM glucose the oscillatory frequency was 0.81 ± 0.09 min−1, which was not significantly different from that in 0.5 mM glucose (Fig. 2B). These oscillations were either abolished (in 70 % of cells) or further reduced in frequency (in 30 % of the cells) when glucose was increased to 11 mM. Indeed, 11 mM glucose significantly reduced the time that [Ca2+] remained elevated (percentage of time elevated: 26.9 ± 4.9 % in 3 mM glucose, 4.7 ± 2.4 % in 11 mM glucose). Cells displaying the [Ca2+]i pattern typical of trace 1 were, in most cases, subsequently identified immunologically as glucagon-containing α-cells (Fig. 3B). However, because of the overall alteration of cell morphology after the fixation and permeabilization procedure, only a few of the cells in the recording field (approx. 20 %) were unambiguously identified. Nonetheless, cells unequivocally identified as glucagon-containing cells always presented a [Ca2+]i pattern in response to glucose as described in Fig. 2A, trace 1. Moreover, these cells did not respond to 40 μM tolbutamide and were not affected by 100 μM diazoxide, as is the case in cultured cells (Berts et al. 1996b). Trace 2 in Fig. 2A, on the other hand, represents a cell where the elevation in [Ca2+]i was directly proportional to the glucose concentration. In 0.5 mM glucose, [Ca2+]i either remained at basal levels or displayed very low-frequency oscillations (0.11 ± 0.05 min−1). However, stimulation with 3 mM glucose increased the frequency of [Ca2+]i oscillations in 88 % of the cells (1.64 ± 0.44 min−1), and although there was islet-to-islet heterogeneity, this value lay between 1 and 7 min−1. Increasing glucose to 11 mM further increased the frequency of oscillations (Fig. 2B; 1) or, in 25 % of the cells, even produced a sustained elevation of [Ca2+]i. Again, this was reflected in the alteration of the percentage time during which [Ca2+]i was elevated (23.2 ± 6.3 % in 3 mM glucose; 43.28 ± 13.25 % in 11 mM glucose; Fig. 2C; 1). These cells were subsequently identified as somatostatin-containing δ-cells by immunostaining (Fig. 3D). All the cells identified as δ-cells were silent in 0.5 mM glucose and showed an oscillatory pattern in 3 mM glucose, which was a maximally effective dose in the majority of cases. Taken together, we conclude that (a) α-cells oscillate at a lower frequency than β- and δ-cells, and (b) extracellular glucose has the opposite effect on Ca2+ signals from α-cells compared with those from β- and δ-cells.
Figure 2. Glucose induces different fluorescence signals in individual cells.

A, changes in fluorescence induced by decreasing glucose concentrations in cells 1 and 2. The bars above the traces indicate the periods of application of different glucose concentrations. B, frequency of [Ca2+]i oscillations (ν) vs. glucose concentration for cells with the [Ca2+]i pattern of cell 1 (•), cell 2 (○) and cells with typical β-cell synchronous [Ca2+]i oscillations (▴). Points are the mean of 16 cells from 5 different islets. C, percentage of time that [Ca2+]i remained elevated vs. glucose concentration in the same cells as B; same symbols.
Figure 3. Identification of glucagon- and somatostatin-containing cells.

A, fluorescence changes due to a change from 3 to 11 mM glucose from cells depicted in the left panel of B. Note that [Ca2+]i oscillations are abolished due to the presence of high glucose levels. B, left panel: picture of the two cells described in A loaded with the calcium indicator fluo-3. Blue indicates low and red high fluorescence levels. Right panel: identification of cells 1 and 2 as glucagon-containing α-cells by immunofluorescence, shown in green. The result is representative of 5 glucose-responsive cells unambiguously identified from 3 islets. Scale bar represents 15 μm. C, fluorescence signals due to a change from 3 to 11 mM glucose in the cell depicted in the left panel of D. No appreciable change in the frequency of [Ca2+]i oscillations was observed. D, left panel: pseudo-colour picture of the cell described in C within an islet of Langerhans. Right panel, identification of this cell as a somatostatin-containing δ-cell, labelled in green (4 glucose-responsive cells from 2 islets were unambiguously identified). Scale bar represents 15 μm.
Absence of [Ca2+]i synchronization
Data obtained in a variety of studies have demonstrated the existence of dye coupling between the same types of cell within the islet (homologous coupling) and between different types of cell (heterologous coupling) (Michaels & Sheridan, 1981; Meda et al. 1982). It is well known that in terms of calcium signals the whole islet of Langerhans functions as a syncytium in response to stimulatory glucose concentrations. The experiment in Fig. 4 showed that individual cells with a typical β-cell [Ca2+]i pattern exhibited a highly synchronous oscillatory [Ca2+]i behaviour (Fig. 4, traces 1-4) even when different focal planes were studied in the same islet (not shown). Synchronous oscillatory responses manifested themselves as an oscillatory cross-correlation function with a central peak (Fig. 4B). On the other hand, δ-cell [Ca2+]i oscillations, either in 3 or 11 mM glucose, were totally asynchronous between δ-cells and between δ- and β-cells (Fig. 4A, traces 6-8 and C). As a consequence, when averaging the signal from cells of the same islet, the derived [Ca2+]i signal resembled that obtained with a conventional imaging system (Fig. 4A, average trace).
Asynchrony was also observed amongst the α-cell population (Fig. 5A, traces 1-4 and B) and between α-cells and the other cell types (Figs 1B and 2). The average of the records of cells 1-4 (Fig. 5A, average trace) resulted in a non-oscillatory Ca2+ signal. It follows therefore that the average signal derived from both β- and δ-cells would also be a non-oscillatory signal when islets were exposed to low glucose. These experiments illustrate that the islet of Langerhans behaves as a syncytium in terms of calcium signals in β-cells, yet has a heterogeneous response in non-β-cells.
Figure 5. Asynchrony amongst α-cells.

A, [Ca2+]i oscillations in response to 3 mM glucose in α-cells, identified by the decrease in the frequency of [Ca2+]i oscillations in 11 mM glucose. Oscillations are asynchronous, as manifested by the cross-correlation function plotted in B. The average trace is the arithmetic mean of traces 1-4. The cross-correlation function from cells 2 and 3 (B) demonstrates the absence of correlated events. Essentially the same result was obtained when comparing cell 2 with the other cells. Cell 2 was the reference cell.
DISCUSSION
Low glucose concentrations generated asynchronized [Ca2+]i oscillations in a population of cells within the intact islets of Langerhans studied by laser scanning confocal calcium imaging. Cells that oscillated in low glucose were identified as non-β-cells, which in turn could be subdivided into two groups. One of the groups oscillated in low glucose but was rendered silent in the presence of high glucose concentrations (11 mM); this cell group was identified as glucagon-producing α-cells by immunocytochemistry. The second group was defined as cells that were silent in the absence of glucose but which oscillated in higher glucose concentrations (where 3 mM gave a maximal effect). The latter population of cells were identified as somatostatin-producing δ-cells. The proportion of α- and δ-cells described was well within the range expected for the periphery of the islets where most of the α- and δ-cells are grouped. Indeed, the [Ca2+]i patterns described in the present work broadly resembled those already shown in isolated cells. Nonetheless, we have observed different ranges of oscillation frequency compared with other workers: 0.81 min−1 compared with 0.1-0.3 min−1 for α-cells and 1.64 min−1 compared with 0.1-0.4 min−1 for δ-cells (Berts et al. 1995, 1996a,b). Also, we occasionally observed very high frequency oscillations reaching up to 7.0 min−1. Presumably, such differences arose from using fresh intact islets rather that isolated cells in culture, with only the former allowing normal paracrine communication between different cell types. In contrast to our results, others have failed to observe [Ca2+]i oscillations in α-cells from intact islets exposed to 3 mM glucose (Asada et al. 1998). However, their studies were conducted after more prolonged periods of culture of islets, conditions which may markedly alter [Ca2+]i responses (Gilon et al. 1995).
The oscillations we observed in our intact preparation were synchronous, indicative of a highly co-ordinated islet functioning as a syncytium in terms of [Ca2+]i signals and insulin secretion (Santos et al. 1991; Valdeolmillos et al. 1993; Martin et al. 1995). Moreover, we confirmed that this was primarily due to the β-cells functioning in a co-ordinated manner and producing synchronous [Ca2+]i oscillations. Remarkably, the situation for α- and δ-cells was rather different. It was clear that asynchronous [Ca2+]i oscillations predominated, in spite of the existence of homologous and heterologous coupling between adjacent β- and non-β-cells (Michaels & Sheridan, 1981; Meda et al. 1982). Nonetheless, a third [Ca2+]i pattern observed in our study indicates the possibility of coupling; 3.8 % of the cells which oscillated in low glucose were able to behave as a β-cell in the presence of 11 mM glucose (see Fig. 4, trace 5). This pattern was recorded in a minority of cases and we have not been able to identify the type of cell by immunocytochemistry. A second possibility is that the signal was derived from PP-cells, which are present at a low percentage (1 %) in the islet. A more speculative possibility would be the existence of β-cells which oscillate in low glucose but remain sensitive to high glucose, and which would be responsible for basal insulin secretion.
A clear physiological role has been established for synchronous [Ca2+]i responses in β-cells. Such a co-ordinated signal would overcome problems arising from the heterogeneity of glucose-induced insulin secretion in individual cells (Salomon & Meda, 1986; Pipeleers, 1992), thereby resulting in a more vigorous insulin secretion. Indeed, a co-ordinated [Ca2+]i response has been suggested as driving pulsatile insulin secretion (Martin et al. 1995; Barbosa et al. 1996). Similarly, glucagon secretion has also been described as calcium dependent in isolated cells (Gromada et al. 1997). We have demonstrated that in α-cells within the intact islet, decreasing the glucose concentration triggers [Ca2+]i oscillations, indicating a graded response of individual α-cells to decreasing glucose concentrations. The antagonistic [Ca2+]i signals of α- and β-cells would preclude the co-release of glucagon and insulin at extreme glucose concentrations. However, glucagon and insulin would be co-released at intermediate glucose concentrations.
The lack of synchronicity of [Ca2+]i oscillations between α-cells is consistent with the idea that these cells function individually within the islet to secrete glucagon rather than acting as a co-ordinated unit. Oscillations of glucagon secretion recorded in vivo have been detected (Jaspan et al. 1986; Lefebvre et al. 1987). However, the lack of co-ordination between α-cells in terms of [Ca2+]i suggests that pulsatile glucagon secretion is not driven exclusively by [Ca2+]i movements (Berts et al. 1996a,b). It could be argued that under more physiological circumstances the present findings could change, but we feel this is unlikely since the [Ca2+]i oscillations in β-cells that we recorded are almost identical to those obtained when measuring electrical activity in vivo (Sánchez-Andrés et al. 1995).
We have also demonstrated that δ-cell [Ca2+]i oscillations are exquisitely sensitive to glucose, being triggered within the 0-3 mM glucose range (higher glucose concentrations were without effect on the [Ca2+]i pattern in most of the cells). A possible role of coupling between δ- and β-cells in exchanging [Ca2+]i signals is ruled out by the lack of synchronicity of their [Ca2+]i oscillations. Given that somatostatin secretion is calcium dependent (Hermansen, 1980), the present results suggest a continuous release of somatostatin under physiological conditions (the resting glucose concentration in mice is about 7.5 mM; Sánchez-Andrés et al. (1995)). As a result, insulin and glucagon release might be continuously repressed because somatostatin inhibits the secretion of both hormones (Hellman & Lenmark, 1969; Schuitz et al. 1989). In a physiological context, the net release of glucagon, somatostatin and insulin would be a trade-off between the various activities of the differentially glucose-regulated cell types within the islets of Langerhans.
Acknowledgments
The authors thank E. Perez Garcia, R. García Velasco and Alfonso Perez for technical assistance, Dr Ana Gomis for her help with references, Drs Anthony Morgan, Miguel Valdeolmillos and Cristina Ripoll for critical reading of the manuscript and help with several aspects of the project and Dr Liset Menéndez de la Prida for help with the analysis. I. Q. is a recipient of a research studentship from the Ministerio de Educación y Cultura. This work was supported by grants from FISss and Generalitat Valenciana.
References
- Asada N, Shibuya I, Iwanaga T, Niwa K, Kanno T. Identification of α- and β-cells in intact isolated islets of Langerhans by their characteristic cytoplasmic Ca2+ concentration dynamics and immunocytochemical staining. Diabetes. 1998;47:751–757. doi: 10.2337/diabetes.47.5.751. [DOI] [PubMed] [Google Scholar]
- Barbosa RM, Silva AM, Tome AR, Stamford JA, Santos RM, Rosario LM. Real time electrochemical detection of 5-HT/insulin secretion from single pancreatic islets: effect of glucose and K+ depolarisation. Biochemical and Biophysical Research Communications. 1996;228:100–104. doi: 10.1006/bbrc.1996.1622. [DOI] [PubMed] [Google Scholar]
- Berts A, Ball A, Dryselius S, Gylfe E, Hellman B. Glucose stimulation of somatostatin-producing islet cells involves oscillatory Ca2+ signaling. Endocrinology. 1996a;137:693–697. doi: 10.1210/endo.137.2.8593819. [DOI] [PubMed] [Google Scholar]
- Berts A, Ball A, Gylfe E, Hellman B. Suppression of Ca2+ oscillations in glucagon-producing α2-cells by insulin/glucose and amino acids. Biochimica et Biophysica Acta. 1996b;1310:212–216. doi: 10.1016/0167-4889(95)00173-5. [DOI] [PubMed] [Google Scholar]
- Berts A, Gylfe E, Hellman B. Ca2+ oscillations in pancreatic islet cells secreting glucagon and somatostatin. Biochemical and Biophysical Research Communications. 1995;208:644–649. doi: 10.1006/bbrc.1995.1387. [DOI] [PubMed] [Google Scholar]
- Gilon P, Jonas JC, Henquin JC. Culture duration and conditions affect the oscillations of cytoplasmic calcium concentration induced by glucose in mouse pancreatic islets. Diabetologia. 1995;38:876–879. doi: 10.1007/BF00400464. [DOI] [PubMed] [Google Scholar]
- Gromada J, Bokvist K, Ding WG, Borg S, Buschard K, Renstroem E, Rorsman P. Adrenaline stimulates glucagon secretion in pancreatic α cells by increasing the Ca2+ current and the number of granules close to the L-type Ca2+ channels. Journal of General Physiology. 1997;110:217–228. doi: 10.1085/jgp.110.3.217. 10.1085/jgp.110.3.217. [DOI] [PMC free article] [PubMed] [Google Scholar]
- Hellman B, Lenmark A. Inhibition of the in vivo secretion of insulin by an extract of pancreatic α1-cells. Endocrinology. 1969;84:1484–1499. doi: 10.1210/endo-84-6-1484. [DOI] [PubMed] [Google Scholar]
- Hermansen K. Secretion of somatostatin from the normal and diabetic pancreas. Studies in vitro. Diabetologia. 1980;19:492–504. doi: 10.1007/BF00253175. [DOI] [PubMed] [Google Scholar]
- Jaspan JB, Lever E, Polonsky KS, Van Cauter E. In vivo pulsatile of pancreatic islet peptides. American Journal of Physiology. 1986;251:E215–226. doi: 10.1152/ajpendo.1986.251.2.E215. [DOI] [PubMed] [Google Scholar]
- Lefebvre PJ, Paolisso G, Scheen AJ, Henquin JC. Pulsatility of insulin and glucagon release: physiological significance and pharmacological implications. Diabetologia. 1987;30:443–452. doi: 10.1007/BF00279610. [DOI] [PubMed] [Google Scholar]
- Martin F, Sánchez-Andrés JV, Soria B. Slow [Ca2+]i oscillations induced by ketoisocaproate in single mouse pancreatic islets. Diabetes. 1995;44:300–305. doi: 10.2337/diab.44.3.300. [DOI] [PubMed] [Google Scholar]
- Meda P, Kohen E, Kohen C, Rabinovitch A, Orci L. Direct communication of homologous and heterologous endocrine islet cells in culture. Journal of Cell Biology. 1982;92:221–226. doi: 10.1083/jcb.92.1.221. 10.1083/jcb.92.1.221. [DOI] [PMC free article] [PubMed] [Google Scholar]
- Menéndez de la Prida L, Bolea S, Sánchez-Andrés JV. Origin of the synchronized network activity in the rabbit developing hippocampus. European Journal of Neuroscience. 1998;10:899–906. doi: 10.1046/j.1460-9568.1998.00097.x. 10.1046/j.1460-9568.1998.00097.x. [DOI] [PubMed] [Google Scholar]
- Michaels RL, Sheridan JD. Islets of Langerhans: dye coupling among immunocytochemically distinct cell types. Science. 1981;214:801–803. doi: 10.1126/science.6117129. [DOI] [PubMed] [Google Scholar]
- Nadal A, Sul JY, Valdeolmillos M, McNaughton PA. Albumin elicits calcium signals from astrocytes in brain slices from neonatal rat cortex. The Journal of Physiology. 1998;509:711–716. doi: 10.1111/j.1469-7793.1998.711bm.x. [DOI] [PMC free article] [PubMed] [Google Scholar]
- Nadal A, Valdeolmillos M, Soria B. Metabolic regulation of intracellular calcium concentration in mouse pancreatic islets of Langerhans. American Journal of Physiology. 1994;267:E769–774. doi: 10.1152/ajpendo.1994.267.5.E769. [DOI] [PubMed] [Google Scholar]
- Pipeleers DG. Heterogeneity in pancreatic β-cells population. Diabetes. 1992;41:777–781. doi: 10.2337/diab.41.7.777. [DOI] [PubMed] [Google Scholar]
- Prentki M, Matchinsky FM. [Ca2+]i, cAMP, and phospholipids-derived messengers in coupling mechanism of insulin secretion. Physiological Reviews. 1987;67:1185–1248. doi: 10.1152/physrev.1987.67.4.1185. [DOI] [PubMed] [Google Scholar]
- Press WH, Teukolsky SA, Vetterling WT, Flauvery BP. Numerical Recipes in C: the Art of Scientific Computing. 2. Cambridge University Press; 1992. [Google Scholar]
- Ripoll C, Martin F, Rovira JM, Pintor J, Miras-Portugal MT, Soria B. Diadenosine polyphosphates. A novel class of glucose-induced intracellular messengers in the pancreatic β-cell. Diabetes. 1996;45:1431–1434. doi: 10.2337/diab.45.10.1431. [DOI] [PubMed] [Google Scholar]
- Rorsman P, Hellman B. Voltage-activated currents in guinea pig pancreatic α2 cells. Journal of General Physiology. 1988;91:223–242. doi: 10.1085/jgp.91.2.223. 10.1085/jgp.91.2.223. [DOI] [PMC free article] [PubMed] [Google Scholar]
- Rosario LM, Atwater I, Scott AM. Pulsatile insulin release and electrical activity from single ob/ob mouse islets of Langerhans. Advances in Experimental and Medical Biology. 1986;211:413–425. doi: 10.1007/978-1-4684-5314-0_40. [DOI] [PubMed] [Google Scholar]
- Salomon D, Meda P. Heterogeneity and contact-dependent regulation of hormone secretion by individual β-cells. Experimental Cell Research. 1986;162:507–520. doi: 10.1016/0014-4827(86)90354-x. [DOI] [PubMed] [Google Scholar]
- Sánchez-Andrés JV, Gomis A, Valdeolmillos M. The electrical activity of pancreatic β-cells recorded in vivo shows glucose-dependent oscillations. The Journal of Physiology. 1995;486:223–228. doi: 10.1113/jphysiol.1995.sp020804. [DOI] [PMC free article] [PubMed] [Google Scholar]
- Santos RM, Rosario LM, Nadal A, Garcia-Sancho J, Soria B, Valdeolmillos M. Widespread synchronous [Ca2+]i oscillations due to bursting electrical activity in single pancreatic islets. Pflügers Archiv. 1991;418:417–422. doi: 10.1007/BF00550880. [DOI] [PubMed] [Google Scholar]
- Schuitz FC, Dende MP, Pipeleers DG. Sensitivity of rat pancreatic A and B cells to somatostatin. Diabetologia. 1989;32:207–212. doi: 10.1007/BF00265096. [DOI] [PubMed] [Google Scholar]
- Valdeolmillos M, Nadal A, Contreras D, Soria B. The relationship between glucose-induced KATP channel closure and the rise in [Ca2+]i in single mouse pancreatic β-cells. The Journal of Physiology. 1992;455:173–186. doi: 10.1113/jphysiol.1992.sp019295. [DOI] [PMC free article] [PubMed] [Google Scholar]
- Valdeolmillos M, Nadal A, Soria B, Garcia-Sancho J. Fluorescence digital image analysis of glucose-induced [Ca2+]i oscillations in mouse pancreatic islets of Langerhans. Diabetes. 1993;42:1210–1214. doi: 10.2337/diab.42.8.1210. [DOI] [PubMed] [Google Scholar]
- Valdeolmillos M, Santos RM, Contreras D, Soria B, Rosario LM. Glucose-induced oscillations of intracellular Ca2+ concentration resembling bursting electrical activity in single mouse islets of Langerhans. FEBS Letters. 1989;259:19–23. doi: 10.1016/0014-5793(89)81484-x. [DOI] [PubMed] [Google Scholar]