

Abstract
We have combined patch clamp recording with simultaneous [Ca2+]i measurements in single LNCaP cells (a human prostate cancer cell line), to study the activation of Ca2+-permeable channels by two different inducers of apoptosis, ionomycin and serum deprivation.
In perforated patch recording, LNCaP cells had a membrane potential of -40 mV and a resting [Ca2+]i of 90 nM. Application of ionomycin at levels that induced apoptosis in these cells (10 μM) produced a biphasic increase in [Ca2+]i. The first rise in [Ca2+]i was due to release of Ca2+ from internal stores and it was associated with a membrane hyperpolarization to -77 mV. The latter was probably due to the activation of high conductance, Ca2+- and voltage-dependent K+ channels (maxi-K). Conversely, the second rise in [Ca2+]i was always preceded by and strictly associated with membrane depolarization and required external Ca2+. Serum deprivation, another inducer of apoptosis, unmasked a voltage-independent Ca2+ permeability as well.
A lower concentration of ionomycin (1 μM) did not induce apoptosis, and neither depolarized LNCaP cells nor produced the biphasic increase in [Ca2+]i. However, the first increment in [Ca2+]i due to release from internal Ca2+ stores was evident at this concentration of ionomycin.
Simultaneous recordings of [Ca2+]i and ion channel activity in the cell attached configuration of patch clamp revealed a Ca2+-permeable, Ca2+-independent, non-selective cation channel of 23 pS conductance. This channel was activated only during the second increment in [Ca2+]i induced by ionomycin. The absence of serum activated the 23 pS channel as well, albeit at a lower frequency than with ionomycin.
Thus, the 23 pS channel can be activated by two unrelated inducers of apoptosis and it could be another Ca2+ influx mechanism in programmed cell death of LNCaP cells.
Apoptosis, the most common expression of programmed cell death (PCD), is a physiological process that balances cell division in shaping and generating multicellular organisms (Steller, 1995; Thompson, 1995). Both in thymocytes and prostate cells (reviewed by Dowd, 1995), different inducers of apoptosis have been associated with a sustained elevation of intracelullar calcium concentration ([Ca2+]i). Presumably, such an increment in [Ca2+]i activates different types of Ca2+-dependent effectors via calcium-binding proteins like calmodulin (Dowd et al. 1991) or ALG-2 (Vito et al. 1996).
However, the nature and regulation of Ca2+-permeable channels in apoptosis remain to be elucidated. Inducers of apoptosis like ionomycin (Martikainen et al. 1991), thapsigargin (Furuya et al. 1994; Lam et al. 1994), H2O2 (Distelhorst et al. 1996), dexamethasone (Lam et al. 1993), and withdrawal of interleukin-3 (Baffy et al. 1993) produce partial or complete depletion of internal Ca2+ stores. It has been assumed that apoptosis-associated Ca2+ influx occurs through the activation of store-operated Ca2+ channels (SOC; reviewed by Berridge, 1995) resulting in a sustained elevation in [Ca2+]i and cell death. In this regard ionomycin, an electroneutral Ca2+ ionophore (Erdahl et al. 1995), induces an electrophoretic Ca2+ influx presumably mediated by the activation of SOC channels (Mason & Grinstein, 1993; Morgan & Jacob, 1994). On the other hand, Ca2+-permeable channels not operated by stores have also been associated with apoptosis including NMDA receptors (Ankarcrona et al. 1995) and the type 3 InsP3 receptor (Khan et al. 1996). In agreement with the importance of Ca2+ influx in some cases of cell death, inhibiting the expression of the type 3 InsP3 receptor in the plasma membrane of lymphocytes blocked dexamethasone-induced apoptosis. Furthermore, Antonsson et al. (1997) have shown that Bax, an inducer of apoptosis of the Bcl-2 family of proteins, was able to increase plasma membrane permeability in different types of cells, probably by forming non-selective ion channels. This effect was readily blocked by Bcl-2, a typical inhibitor of apoptosis. Thus, a link between pore-forming activity and the induction of apoptosis has been suggested.
Nevertheless, electrophysiological characterization of ion channels associated with apoptosis, particularly Ca2+-permeable channels, has not been addressed before. To study this type of channel, we have combined [Ca2+]i measurements with patch clamp recordings in a human prostatic cancer cell line (LNCaP). A Ca2+-permeable, non-selective cation channel of 23 pS conductance, unrelated to SOC channels, was activated by two different conditions that trigger apoptosis in these cells. The channel herein described seems to be a good candidate for mediating Ca2+ influx in prostatic cells undergoing apoptosis (Furuya et al. 1994). A preliminary account of these data has been presented elsewhere (Gutiérrez et al. 1997).
METHODS
Cell culture
The human prostate cancer cell line, LNCaP, was obtained from the American Type Culture Collection (ATCC) and used between passages 27 and 32. Cells were cultured in RPMI 1640 medium supplemented with 10 % fetal bovine serum (FBS), 2 mM L-glutamine, and 1 % penicillin-streptomycin. All tissue culture reagents were from Gibco BRL (Gaithersburg, MD, USA). Electrophysiological and [Ca2+]i measurements were made with cells bathed in a Hepes-buffered saline (HBS) solution containing (mM): 130 NaCl, 4 KCl, 2 NaHCO3, 1 MgSO4, 2 CaCl2, 10 glucose, 10 Hepes; adjusted to pH 7.4 with NaOH. Ionomycin (Sigma) and thapsigargin (RBI) were prepared as 5 mM and 100 μM stock solutions in dimethyl sulphoxide (Hybri-Max, Sigma), respectively.
Cell viability assay
Cells were trypsinized and resuspended in RPMI 1640 supplemented with FBS (10 %) to a final density of 2 × 10⁵ cells ml−1. This suspension (50 μl) was plated in 96 multi-well dishes and allowed to recover for 18 h. Afterwards, cells were either kept in supplemented RPMI or in Hepes-buffered saline (HBS) solution with or without ionomycin. Cell viability was measured using a modified MTT assay (3-(4,5-dimethylthiazol-2-yl)-2,5-diphenyl-tetrazoliumbromide), as previously described (Harris et al. 1994) after an incubation period of 24 h.
DNA fragmentation assay
LNCaP cells (1.5 × 10⁷ cells) were washed and lysed in 0.5 ml of lysis buffer (140 mM NaCl, 1.5 mM MgCl2, 0.5 % NP40 detergent, 10 mM Tris-HCl, pH 7.4) for 30 min at 4°C after an incubation of 14 h in apoptotic conditions. Nuclei were pelleted at 10 000 g for 10 min at 4°C and resuspended in hypertonic solution (mM: 350 NaCl, 1.5 MgCl2, 1 DTT, 10 Tris-HCl, pH 7.4) for 30 min at 4°C. Fragmented DNA was separated by centrifugation at 4000 g for 10 min at 4°C and extracted twice from the supernatant. After that, it was separated by electrophoresis in 2 % agarose gels and revealed with ethidium bromide.
Simultaneous patch clamp and [Ca2+]i measurements in single cells
LNCaP cells (106 cells) were trypsinized and loaded either with 0.5 μM fura-2 AM (Molecular Probes) or with fura-2 AM plus 18 μM BAPTA AM in 1 ml of supplemented RPMI medium. After 1 h incubation at room temperature, cells were washed and resuspended in HBS solution and used within a 6 h period. The 340 nm/380 nm fluorescence ratio of LNCaP cells in HBS solution (unless otherwise indicated) was recorded from single cells every 50 ms with a dual wavelength microfluorometer, model RF-F3010 (Photon Technology International, South Brunswick, NJ, USA) mounted on a Nikon TMD microscope. Local application of ionomycin was carried out with a pneumatic picopump PV830 (World Precision Instruments, Sarasota, FL, USA) operated at 4 p.s.i. and using micropipettes of < 4 MΩ resistance (when filled with HBS solution) and placed next to the cell. Microscope calibration and [Ca2+]i were obtained as described elsewhere (Guerrero et al. 1994a) with a KD of 200 nM. Under our recording conditions the parameters of the Grynkiewicz equation were Rmax = 4.078 ± 0.477, Rmin = 0.204 ± 0.023 and β = 8.014 ± 0.117 for 41 calibrations (Grynkiewicz et al. 1985), where Rmax is the fluorescence ratio in the presence of saturating Ca2+ and Rmin is the fluorescence ratio in the absence of Ca2+. Analysis of the data was based on [Ca2+]i but the fluorescence ratio was chosen to illustrate the data in most of the figures. Current- and voltage clamp experiments were carried out in the perforated patch configuration simultaneously with [Ca2+]i measurements of LNCaP cells in HBS at room temperature (Rae et al. 1991; Guerrero et al. 1994b). Borosilicate patch pipettes (WPI) of 4-5 MΩ resistance were used, filled with the following solution (mM): 60 K2SO4, 11 NaCl, 30 KCl, 1 MgSO4, 0.1 EGTA, 10 Hepes-NaOH, pH 7.2, for recording membrane potential. A caesium-based pipette solution (mM): 60 Cs2SO4, 30 CsCl, 11 NaCl, 1 MgSO4, 0.1 EGTA, 10 Hepes-NaOH, pH 7.2, was used to reduce K+ conductance in current clamp and for all voltage clamp experiments. Series resistances below 30 MΩ were obtained by using 150 μg ml−1 of amphotericin B and 30 μg ml−1 of Pluronic F-127 in these pipette solutions (0.3 % DMSO). Single channel recordings in the cell attached configuration of the patch clamp technique (Hamill et al. 1981) were carried out simultaneously with [Ca2+]i measurements. Plasma membrane potential was zeroed using a high potassium solution (mM): 8 NaCl, 130 KCl, 2 NaHCO3, 2 CaCl2, 1 MgCl2, 10 glucose, 10 Hepes-NaOH, pH 7.4. Unitary currents were filtered at 200 Hz (4-pole low-pass Bessel filter) and digitized by Digidata 1200 running Axotape (Axon Instruments) at 1 kHz. For recording ionomycin-induced single channel activity, the pipette Na+-Ca2+ solution contained (mM): 140 NaCl, 2 CaCl2, 20 Hepes- NaOH, pH 7.4, and patch potential was held at -100 mV unless otherwise indicated. Ca2+ permeability was assessed by having 110 mM of CaCl2 or calcium glutamate as the only permeant ion in the pipette solution. In general, multiple channels were present in the membrane patch so the open probability (Po) multiplied by the number of channels (N) was obtained by: NPo = Σ(it - ib)Δt/Tiu, where it is the single channel recorded ion current, ib is baseline current, Δt is sampling time, T is total time (8 s) and iu is the unitary current calculated from all-points amplitude histograms (Logothetis et al. 1987). Results are expressed as means ± s.e.m.; Student's t test was employed for all statistical analysis.
RESULTS
Ionomycin and serum removal induce apoptosis in LNCaP cells
It has previously been demonstrated that a sustained increase in [Ca2+]i due to Ca2+ influx through the plasma membrane is associated with apoptosis of prostate cancer cells (Martikainen et al. 1991; Furuya et al. 1994). Using DNA ladder fragmentation and MTT assay indicated that ionomycin, a calcium ionophore, and the absence of serum, both induced time-dependent apoptosis. In agreement with previous reports of prostatic cancer cells (Martikainen et al. 1991), LNCaP cells required high concentrations of ionomycin (10 μM) to undergo apoptosis (Fig. 1). Lower concentrations (1 μM) could not increase the rate of cell death significantly, either with or without serum. Therefore, comparing the effects of 1 and 10 μM ionomycin should highlight those events associated with apoptosis. Furthermore, cell incubation in the absence of serum triggered apoptosis as well. This condition potentiated the effect of lethal doses of ionomycin (Fig. 1). This is in agreement with the protective role of serum in apoptosis (Shibasaki & McKeon, 1995). Thus, 10 μM ionomycin and the absence of serum induced death by apoptosis of LNCaP cells.
Figure 1. Induction of apoptosis in LNCaP cells by ionomycin or serum removal.
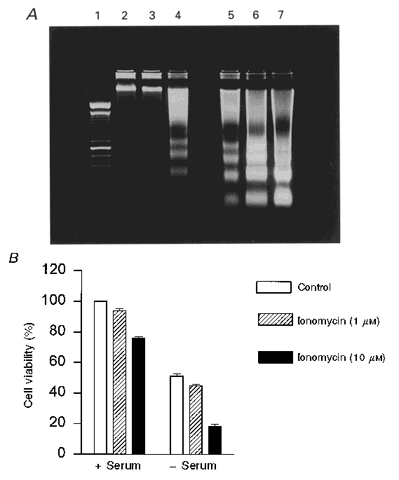
A, 2 % agarose gel showing DNA degradation in the ladder pattern characteristic of apoptosis. Lane 1, size standards (100 bp ladder). DNA from LNCaP cells in serum-supplemented RPMI medium (lanes 2-4) or HBS (lanes 5-7). Cells were challenged with 0 (lanes 2 and 5), 1 μM (3 and 6) or 10 μM (4 and 7) ionomycin for 14 h prior to the analysis of DNA fragmentation. B, MTT assay for cell viability. Cells in the presence (+) or the absence (-) of serum were incubated with ionomycin at the indicated concentrations for 24 h. Cell survival was calculated as the percentage of cells that convert MTT into formazan salts normalized by cells grown in serum and without ionomycin (n = 6).
Changes in [Ca2+]i and membrane potential of LNCaP cells by lethal doses of ionomycin
To study activation of Ca2+-permeable channels during apoptosis of LNCaP cells, we have combined patch clamp recording with simultaneous [Ca2+]i measurements at the single cell level. LNCaP cells presented a resting [Ca2+]i of 91.5 ± 7.0 nM (n = 27), a stable membrane potential of -39.5 ± 2 mV with an input resistance always greater than 1 GΩ (n = 27), and a membrane capacitance of 18.4 ± 1.2 pF (n = 27).
Application of 10 μM ionomycin by pressure ejection from a micropipette for 90 s produced a biphasic increase in [Ca2+]i (Fig. 2A). The first rise in [Ca2+]i was observed almost without delay, reaching 724.4 ± 38.2 nM (n = 24) at 12.5 s after the application of ionomycin. This first increase in [Ca2+]i was associated with membrane hyperpolarization to -77.6 ± 3.4 mV (n = 18) which is very close to the equilibrium potential for K+ (Fig. 2B).
Figure 2. [Ca2+]i and membrane potential changes induced by lethal doses of ionomycin (10 μM).
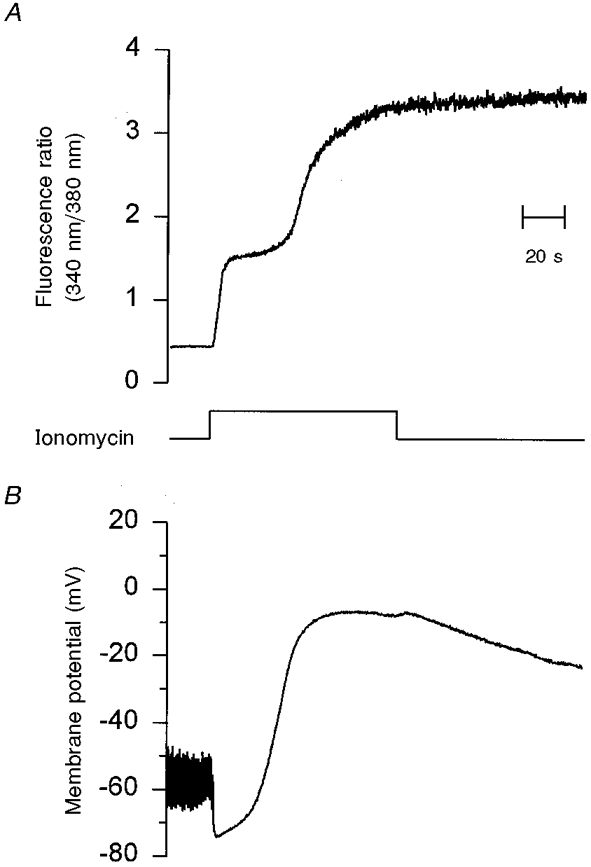
A shows the time course of the changes in [Ca2+]i (340 nm/380 nm fluorescence ratio) elicited by pressure ejection of 10 μM ionomycin from a micropipette for the indicated time (bottom trace). B shows the changes in plasma membrane potential and input resistance recorded simultaneously with [Ca2+]i for the same cell. Input resistance was monitored by applying a 10 pA hyperpolarizing current pulse with a frequency of 1 Hz. Initially, membrane potential and membrane resistance were -50 mV and 1.5 GΩ, respectively. The application of ionomycin produced the first rise in [Ca2+]i which in turn increased membrane conductance and transiently hyperpolarized the cell to about -75 mV. Later, membrane potential went close to -10 mV in association with the second increment in [Ca2+]i. HBS solution in the bath and K2SO4-based solution in the pipette (see Methods). Time scale applies to all traces.
Conceivably, this hyperpolarization was due to the opening of Ca2+- and voltage-dependent, high conductance potassium (maxi-K) channels, present in these cells (Fig. 3). In the cell attached configuration at 0 mV and resting [Ca2+]i, maxi-K channel activity was 0.25 (Fig. 3A). This implies a very high level of Ca2+ sensitivity for these channels (Carl et al. 1996) and, in agreement with that, a steep voltage dependence was obtained (Fig. 3C). Furthermore, transient increments in [Ca2+]i induced by low concentrations of ionomycin resulted in the complete and reversible activation of this channel (Fig. 3D). This is expected for high Ca2+-sensitive maxi-K channels, characteristic of secretory cells.
Figure 3. Characterization of a voltage- and Ca2+-dependent, high conductance K+ channel (maxi-K) of LNCaP cells.
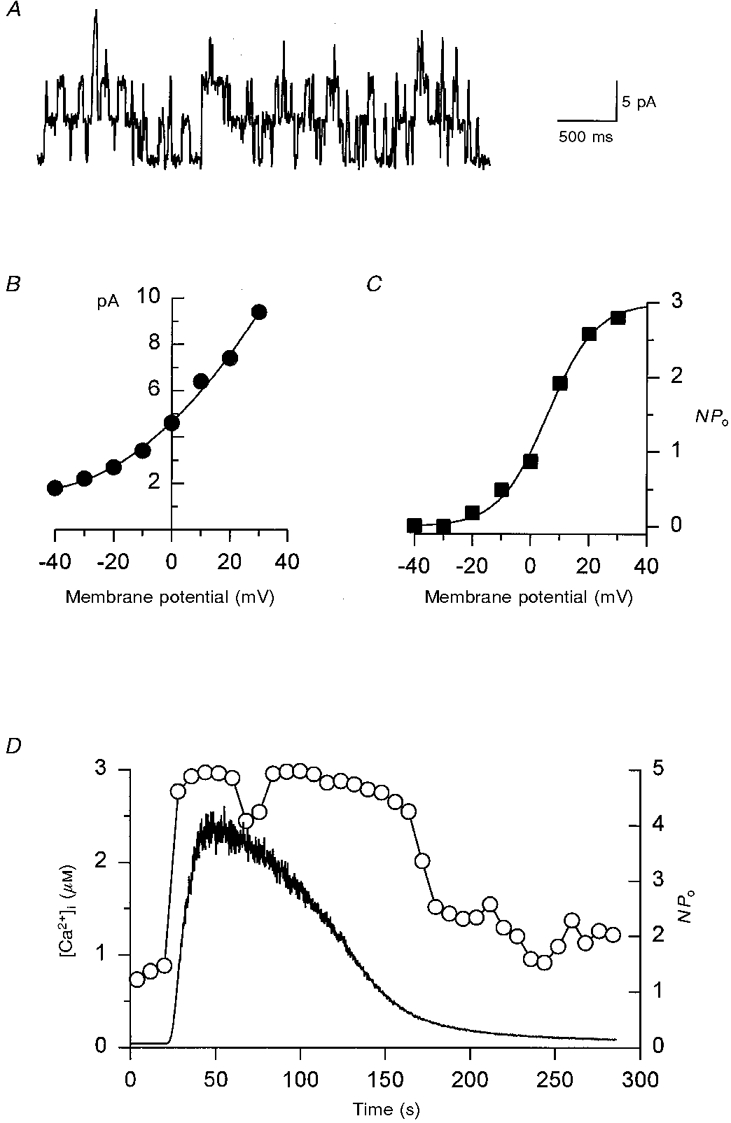
A, single channel recording obtained in the cell attached configuration with high K+ solution in the bath and Na+-Ca2+ solution in the pipette (see Methods) at a holding potential of 0 mV and resting [Ca2+]i. Openings are in the upward direction. B and C, current-voltage curves of single channel current (B) and steady-state voltage dependency (C) for ion channels depicted in A. Boltzmann equation fitting is shown as a continuous line with a V½ of 5.8 mV and a slope factor, k of 8.3 mV. D, simultaneous recording of maxi-K channel activity in the cell attached configuration (NPo, right axis, ○) and the change in [Ca2+]i (left axis, continuous line), induced by the application of 1 μM ionomycin for 30 s (beginning at 20 s).
The second increment in [Ca2+]i occurred 52.7 ± 4.1 s (n = 24) after the application of 10 μM ionomycin (Fig. 2A). At this time, [Ca2+]i reached 2.5 μM, and represents the inflection point for the second increment in [Ca2+]i. This second rise eventually produced the virtual saturation of fura-2 by reaching a 340 nm/380 nm ratio of 3.4 ± 0.05 (n = 22), very close to our Rmax of 4. This ratio represents a [Ca2+]i of 9.9 ± 0.9 μM (n = 22) which is clearly beyond the resolution of fura-2.
Membrane depolarization preceded the second phase of the ionomycin-induced increase in [Ca2+]i by 16.6 ± 3.1 s (n = 6). A correlation was observed, where smaller membrane depolarizations were followed by lower [Ca2+]i. This suggests that the occurrence of the second increment in [Ca2+]i depends on the activation of the depolarizing conductance.
To study such depolarizing conductance, we reduced the contribution of K+ channels by using Cs+ in the pipette solution of perforated patch recording (Fig. 4). Resting membrane potential changed to -25.7 ± 2.2 mV (n = 15) and the 10 μM ionomycin-induced depolarization was more evident; however, this was still close to 0 mV (Fig. 4B). With Cs+ inside the cell, depolarization peaked slightly above 0 mV, which could be due to a higher permeability for Na+ than Cs+; however, this was not tested any further. Nevertheless, the biphasic increase in [Ca2+]i induced by 10 μM ionomycin was not importantly changed by internal dialysis with Cs+ in the recording pipette solution (Fig. 4A). Thus, the depolarizing conductance was similar with either K+ or Cs+ inside the cell, suggesting this was a non-selective conductance and large enough to surpass the hyperpolarizing effect of maxi-K channels.
Figure 4. Changes in [Ca2+]i and membrane potential induced by 10 μM ionomycin in Cs+-loaded LNCaP cells.
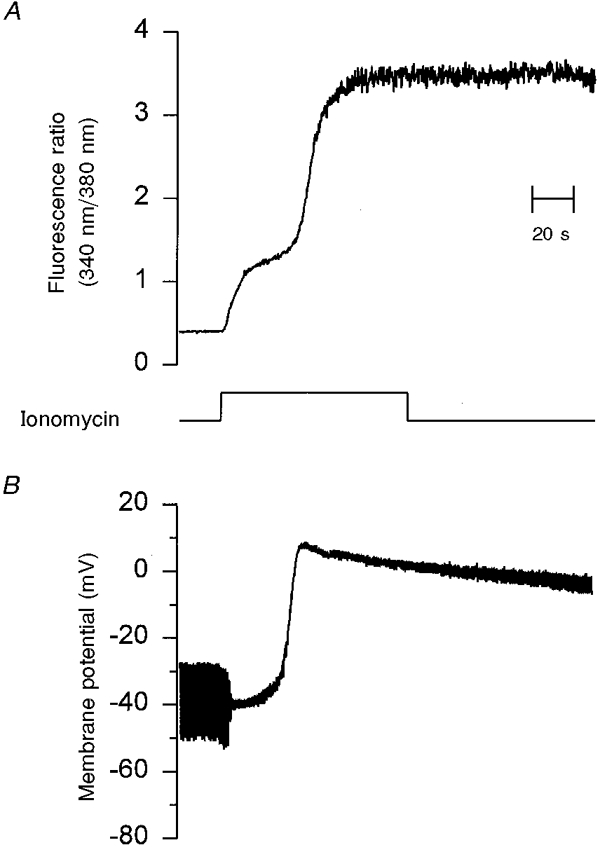
Similar conditions to the experiment shown in Fig. 2, except that Cs2SO4 solution was used in the recording pipette (see Methods). A shows the ionomycin-induced increase in [Ca2+]i indicated by the fura-2 fluorescence ratio (340 nm/380 nm). B is the simultaneous recording of plasma membrane potential and input resistance of the same cell. Resting membrane potential and input resistance were -30 mV and 2 GΩ, respectively. The application of 10 μM ionomycin produced a slight hyperpolarization to -40 mV and also an increase in membrane conductance followed by a transient depolarization to +5 mV. A gradual reduction in the membrane conductance is evident by the end of the trace. This suggests that the non-selective cation channel opens only transiently. Time scale is the same for all traces.
Conversely, the application of 1 μM ionomycin induced only the first increment in [Ca2+]i in LNCaP cells (Fig. 5A). [Ca2+]i was elevated from 93.2 ± 11 to 508.4 ± 37.3 nM in 45.9 ± 8.6 s (n = 12). This increment was significantly smaller and took longer to peak in comparison to the one produced by 10 μM ionomycin in the application pipette. Besides, no significant activation of a depolarizing conductance was observed when cells were exposed to 1 μM ionomycin, even when K+ channels were blocked by Cs+ to facilitate observation of any change in membrane conductance (Fig. 5A). The latter implies that this concentration of ionomycin did not induce any significant activation of an electrophoretic Ca2+ influx. To test further the role of Ca2+ influx via plasma membrane ion channels, plasma membrane potential was held at +70 mV (n = 6), to reduce the driving force for Ca2+ influx. In these conditions, 1 μM ionomycin produced a similar change in [Ca2+]i to that in unclamped cells (Fig. 5B). This change in [Ca2+]i was also similar when 1 μM ionomycin was applied to cells held at -70 mV (not shown). Thus, non-lethal doses of ionomycin did not activate Ca2+-permeable channels. Moreover, these results indicate that the second rise in [Ca2+]i was strictly associated with the appearance of a non-selective conductance, which was activated by ionomycin, but only at concentrations that induce apoptosis of LNCaP cells.
Figure 5. A non-lethal dose of ionomycin (1 μM) cannot increase electrophoretic Ca2+ influx.
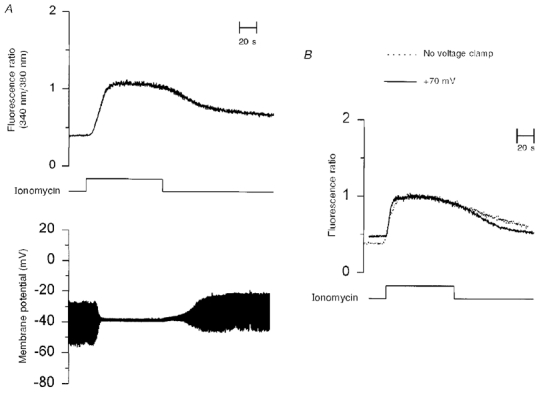
Caesium-loaded LNCaP cells in HBS solution under current clamp (A) or voltage clamp (B, continuous line) were exposed to 1 μM ionomycin for the time indicated. Input resistance was measured by applying 10 pA hyperpolarizing pulses at a frequency of 1 Hz. In B, changes in [Ca2+]i induced by ionomycin (1 μM) of a cell held at +70 mV throughout recording (continuous line) are compared with those from a non-voltage clamped cell (dotted line). Membrane potential was close to -80 mV as long as [Ca2+]i was elevated (not shown).
Different sources of Ca2+ are involved in the ionomycin-induced increment in [Ca2+]i
To provide evidence for calcium release from internal stores being the source of Ca2+ for the first rise in [Ca2+]i, 10 μM ionomycin was applied to cells in the absence of external Ca2+ (Fig. 6A). The initial rise in [Ca2+]i was not affected (n = 6). However, the second increment was completely abolished. Internal Ca2+ stores were also depleted by incubating cells with 100 nM thapsigargin for 30 min. The treatment with thapsigargin elevated basal [Ca2+]i to 275.9 ± 42.4 nM (n = 10; Fig. 6A), probably by the activation of capacitative Ca2+ influx. In these thapsigargin-treated cells, 10 μM ionomycin increased [Ca2+]i by only 215.3 ± 64.8 nM in the first phase (n = 4), whereas [Ca2+]i rose by 633 ± 38.6 nM (n = 24) in cells not exposed to thapsigargin. In thapsigargin-treated cells the second increment in [Ca2+]i reached 7.9 ± 0.9 μM (n = 4) and was observed at 52.2 ± 8.2 s (Fig. 6A). The second increment in [Ca2+]i was therefore not significantly affected by depleting internal stores in comparison to non-treated cells.
Figure 6. Sources of Ca2+ utilized by ionomycin to increase [Ca2+]i in LNCaP cells.
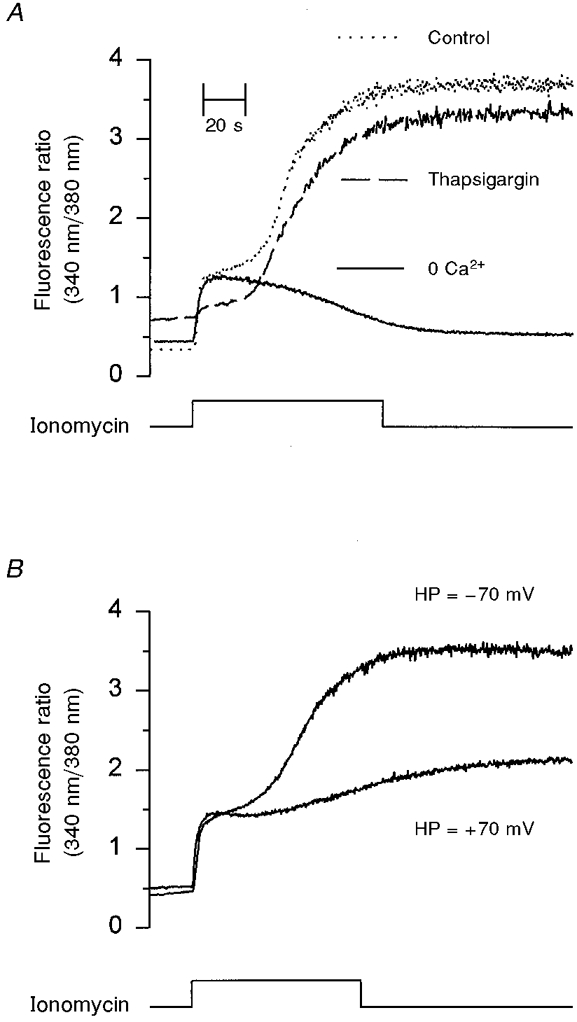
A, changes in [Ca2+]i in response to 10 μM ionomycin in control cells (dotted line), in the absence of extracellular Ca2+ using a calcium-free HBS solution supplemented with 0.5 mM EGTA (continuous line) and in cells treated with thapsigargin (100 nM) to deplete internal Ca2+ stores (dashed line) are compared in this panel. The first increment in [Ca2+]i was not affected by the absence of external Ca2+; however, it was virtually abolished by treating cells with thapsigargin. The second increment in [Ca2+]i required external Ca2+ and it was not significantly reduced by thapsigargin. B, LNCaP cells under voltage clamp at the indicated holding membrane potential (HP) were exposed to 10 μM ionomycin for the time indicated. In agreement with A, reducing the driving force for Ca2+ influx greatly attenuated the second increment in [Ca2+]i without affecting the first rise in [Ca2+]i. All traces are representative of at least three experiments (see text). The time scale applies to all traces.
As expected, the second rise in [Ca2+]i induced by ionomycin was the only phase sensitive to changes in plasma membrane potential to alter the driving force for Ca2+ influx (Fig. 6B). At +70 mV, the first increase in [Ca2+]i (710.6 ± 38.2 nM, n = 8) was not affected; however, the second increment in [Ca2+]i (1.5 ± 0.3 μM, n = 8) was substantially smaller. Conversely, when the membrane potential was held at -70 mV (n = 6), the ionomycin-induced changes in [Ca2+]i were similar to those observed in current clamp conditions (Fig. 6B). These results suggest that the first rise in [Ca2+]i induced by ionomycin has an important component due to Ca2+ release from thapsigargin-sensitive internal Ca2+ stores. This would explain why the first increment in [Ca2+]i was not affected by changing the plasma membrane potential. The second increase in [Ca2+]i required external calcium, was reduced by holding the membrane potential at +70 mV (which strongly lowers the driving force for Ca2+ influx) and finally, was not affected by previously depleting internal Ca2+ stores with thapsigargin. Consequently, the second rise in [Ca2+]i was probably due to the activation of a Ca2+-permeable ion channel at the plasma membrane.
Accordingly, 1 μM ionomycin could not increase [Ca2+]i (-6.5 ± 25.8 nM, n = 4) if internal stores had previously been depleted with 100 nM thapsigargin (not shown). The latter and the data shown in Fig. 5 indicate that non-lethal concentrations of ionomycin increase [Ca2+]i, almost exclusively, by mobilizing internal Ca2+ stores since no evidence was found for the activation of an electrophoretic Ca2+ influx mechanism at the plasma membrane.
Thus, the capability of ionomycin to induce apoptosis appears to correlate with the activation of Ca2+ influx through the plasma membrane, most probably by inducing an endogenous non-selective, voltage-independent, Ca2+-permeable cation channel.
Serum removal increases Ca2+ permeability in LNCaP cells
LNCaP cells die by apoptosis in the absence of serum (Fig. 1). The effect of membrane potential on [Ca2+]i was studied to assess the Ca2+ permeability of serum-deprived cells (Fig. 7). Approximately two-thirds of cells maintained in the absence of serum for 8 h had resting [Ca2+]i higher than 300 nM. Although this suggests an increased Ca2+ permeability, this was difficult to verify because unreliable perforated patch recordings were obtained in these cells due to bad seals or extremely high leak current. Therefore, only serum-deprived cells with basal [Ca2+]i near 100 nM could be studied (Fig. 7B). In the latter cells, cycling of the membrane potential between -70 and +70 mV unmasked an increased Ca2+ permeability (n = 10). This was evident as membrane hyperpolarization elevated the initial rate of rise in [Ca2+]i, while membrane depolarization was associated with a reduction in [Ca2+]i. The gradual increment in the rate of rise of [Ca2+]i was apparent when Ca2+ transients were fitted by single exponentials; the kinetic constant of the fourth Ca2+ transient was 86 % faster compared with the second one (Fig. 7B). Nevertheless, the same type of analysis applied to the falling phase showed that the rate of Ca2+ extrusion was very similar among the different Ca2+ transients (Fig. 7B). It is not clear how oscillations of membrane potential promote the appearance of this Ca2+ permeability. However, they do not seem to be necessary because this Ca2+ conductance could also be activated when membrane potential was held constant at negative values (not shown). Conversely, this increased Ca2+ permeability of serum-deprived cells was never observed in those cells kept in serum (Fig. 7A). Thus, the absence of serum induces a Ca2+-permeable ionic conductance in LNCaP cells.
Figure 7. Serum removal increases Ca2+ permeability in LNCaP cells.
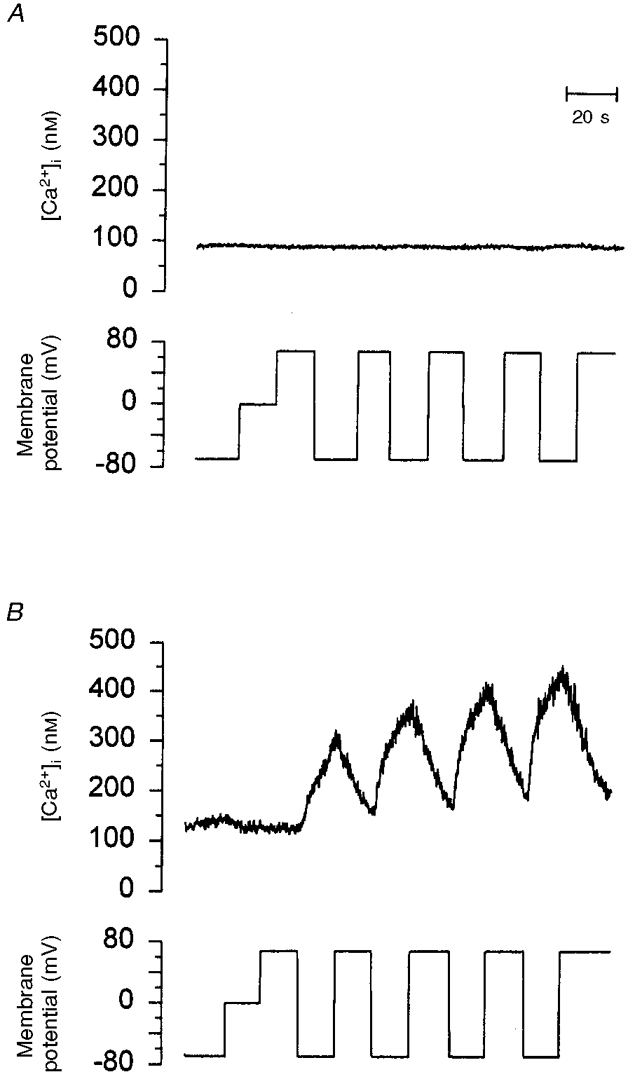
A, Ca2+ permeability of LNCaP cells cultured in the presence of serum was studied by recording the effect on [Ca2+]i of the indicated changes in membrane potential. B, LNCaP cells deprived of serum for 8 h were loaded with fura-2 and voltage clamped similarly to those cells in A, to assess the effect of membrane potential variations on [Ca2+]i. Note that [Ca2+]i increases only during hyperpolarization.
Characterization of Ca2+-permeable channels activated by inducers of apoptosis
To identify the channel responsible for the second rise in [Ca2+]i, single channel recordings in the cell attached configuration were carried out during the application of 10 μM ionomycin. High external K+ concentration was used to avoid interference by changes in the plasma membrane potential. Resting [Ca2+]i was higher (171.7 ± 19.8 nM, n = 16) than in control cells. However, the effect of 10 μM ionomycin on [Ca2+]i was similar to those cells kept in HBS (first rise, 664.8 ± 53.7 nM; second rise, 10 ± 2.1 μM; n = 16). Interestingly, the second rise in [Ca2+]i in the presence of high K+ was significantly delayed (87.5 ± 8.3 s, n = 14; P < 0.001) with respect to that obtained in HBS (see inset in Fig. 10).
Figure 10. Time course of activation of non-selective cation channels (NPo) compared with ionomycin-induced rise in [Ca2+]i.
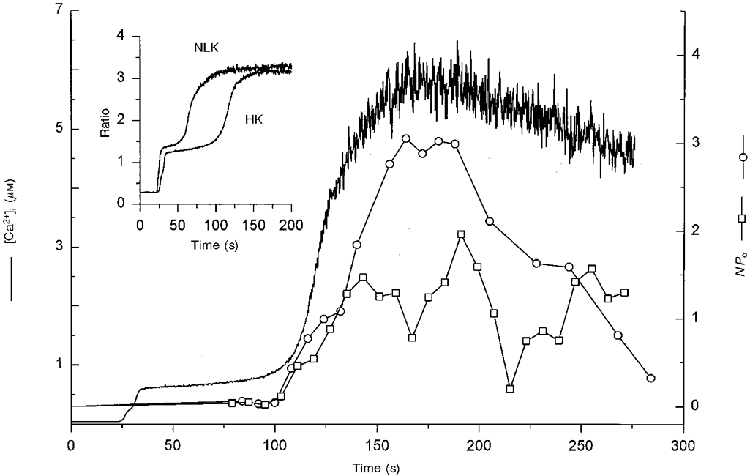
Ion channel activities of a 23 pS channel (○ and □, right axis) from two different cells recorded in the cell attached configuration (-100 mV patch potential and in high K+ external solution) are compared with a typical [Ca2+]i response to the application of 10 μM ionomycin for 90 s (beginning at 20 s). [Ca2+]i trace and the 23 pS channel activity (□) are from the same cell. Note that the channel is not open at rest or during the initial rise in [Ca2+]i (indicated by horizontal lines); 23 pS channels in the membrane patch opened just before the second rise in [Ca2+]i. Inset compares the time course of 10 μM ionomycin-induced increase in [Ca2+]i for cells bathed in HBS (NLK) or in high K+ solution (HK). The main difference was the time taken by the second increment in [Ca2+]i to occur in high K+ solution.
Ionomycin (10 μM) induced the activation of a non-selective cation channel (Fig. 8A andB) recorded in the cell-atttached configuration of patch clamp. With 140 mM NaCl and 2 mM CaCl2 in the pipette solution, the slope conductance of this channel was 23.5 ± 2 pS (n = 4) and the extrapolated reversal potential was 0.03 ± 2 mV, (Fig. 8C). An inward single channel current was also activated by 10 μM ionomycin if Ca2+ was the only permeant cation in the pipette solution (Fig. 8B); however, the slope conductance was reduced to 12 ± 1 pS in this case (n = 3). This implies a small but finite Ca2+ permeability for this channel. Membrane depolarization slightly increased the steady-state activity of the 23 pS channel (Fig. 8D). However, it is unlikely that this channel is directly gated by voltage because important activation can be induced by ionomycin even at -100 mV membrane potential (Fig. 10).
Figure 8. Characterization of ion channels associated with the second rise in [Ca2+]i.
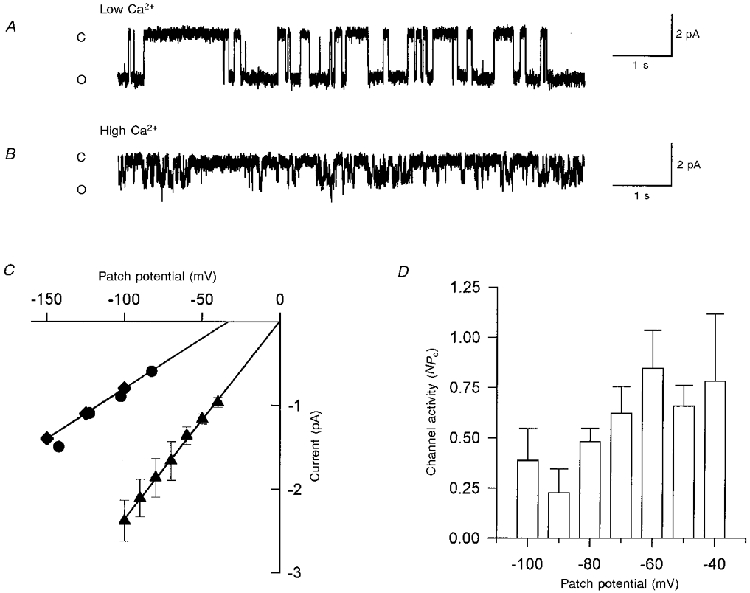
A, single channel current records in the cell attached configuration with a patch potential of -100 mV and Na+-Ca2+ solution (see Methods). B, single channel recordings with 110 mM CaCl2 in the pipette solution and at -100 mV patch potential. Closed (C) and open (O) state levels are indicated on the left side of the record. C, current-voltage curves obtained in Na+-Ca2+ solution (▴), 110 mM CaCl2 (♦) or 110 mM calcium glutamate (•) as charge carriers. The extrapolated reversal potential is indicated assuming no rectification occurred. D, mean ± standard deviation of the steady-state activity of the 23 pS channel is shown at the indicated membrane potentials (n = 4).
Three different approaches were carried out to test whether the 23 pS channel was Ca2+ dependent. One was to load cells heavily with BAPTA, a Ca2+ chelator, by incubating them with 18 μM BAPTA AM (Fig. 9). In these cells, ionomycin could not produce the initial increment in [Ca2+]i (Fig. 9A); however, the steady-state activity of the 23 pS channel was similar (compare 0.388 in Fig. 8D with 0.342 in Fig. 9B). Additionally, the activity of the 23 pS channel was not increased by exposing excised membrane patches to 2 mM Ca2+ in the bath solution (n = 5). Finally, excised membrane patches in 2 mM Ca2+ bathing solution from cells that had not been exposed to ionomycin did not show any 23 pS channel activity (n = 15). All these data argue against the 23 pS channel being directly activated by an increment in [Ca2+]i.
Figure 9. Heavy loading of LNCaP cells with a Ca2+ chelator (BAPTA) does not inhibit the activation of the 23 pS channel by ionomycin.
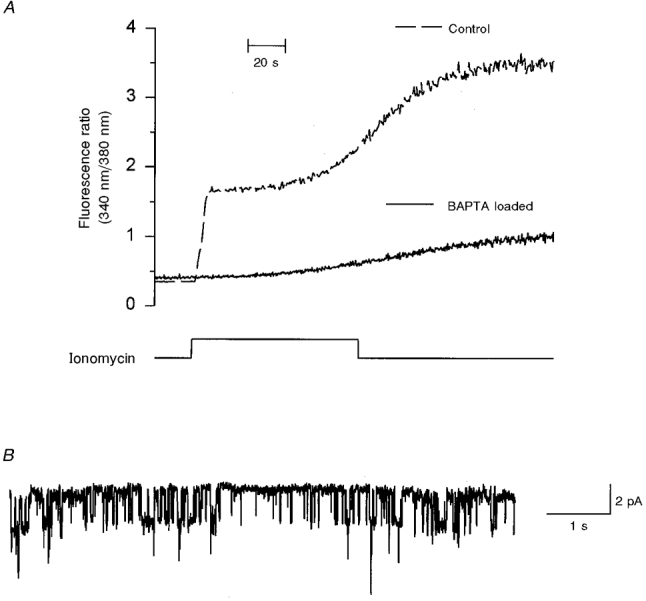
A, LNCaP cells, incubated either with 0.5 μM fura-2 AM alone (dashed line) or together with 18 μM BAPTA AM (continuous line) were exposed to 10 μM ionomycin for the time indicated. B, single channel current record from a BAPTA-loaded cell showing a 23 pS channel with a steady-state activity (0.342 at -100 mV) similar to the activity shown in Fig. 8D. Two more cells loaded with BAPTA gave similar results.
The 23 pS channel was not open at the resting [Ca2+]i nor during the ionomycin-induced first increment in [Ca2+]i (n = 24, Fig. 10). The application of 1 μM ionomcyin did not activate the channel either (n = 5, not shown). However, the activation of a 23 pS channel was evident during the second rise in [Ca2+]i (Fig. 10). This was true in 18 out of 24 cells studied, where at least one channel was activated in the patch. It is possible that in the remaining 6 cells we had just patched plasma membrane regions devoid of the 23 pS channel. Current clamp experiments showed that input resistance was transiently reduced by lethal doses of ionomycin (Fig. 4). This suggests that the non-selective ion channel does not activate permanently. Accordingly, the 23 pS channel was also transiently activated as shown in the two examples of Fig. 10.
A 23 pS channel was activated in 9 out of 15 cells that were held in the absence of serum for at least 8 h. However, in this case the ion channel activity was lower than that induced by 10 μM ionomycin. This could be the explanation for the smaller Ca2+ transients obtained in serum-deprived cells (Fig. 7).
Thapsigargin, another inducer of apoptosis in prostate cells (Furuya et al. 1994), induced the same 23 pS channel, although at a very low level of activity and in only 5 out of 14 cells that were exposed to 1 μM thapsigargin for at least 2 h. Thapsigargin (100 nM), which still induces apoptosis in LNCaP cells (not shown), failed to activate the 23 pS channel. Whether this is due to our recording conditions (i.e. high K+ solution delays the activation of Ca2+ influx by ionomycin, Fig. 10) or that the 23 pS channel does not play a role in thapsigargin-induced cell death, needs further studies. Nevertheless, the latter possibility is in agreement with recent evidence that Ca2+ influx does not seem to be important for thapsigargin-induced apoptosis (Bian et al. 1997).
Thus, the 23 pS ion channel activated by ionomycin and serum removal is a Ca2+-permeable, Ca2+-independent, non-selective cation channel, which does not require membrane depolarization to open. This channel could participate as a Ca2+ influx mechanism in apoptosis and is not controlled by depletion of internal Ca2+ stores.
DISCUSSION
This study demonstrates the activation of a Ca2+-permeable, non-selective cation channel of 23 pS conductance in prostatic cancer cells (LNCaP) by two different inducers of apoptosis, ionomycin and serum removal. This channel appears to be activated by a novel, but still undefined, mechanism.
Membrane depolarization preceded and was strictly associated with the second rise in [Ca2+]i induced by lethal doses of ionomycin. This could imply that a membrane depolarization is needed for the 23 pS channel to open. The latter does not seem to be the case, since Ca2+ influx triggered by 10 μM ionomycin was not inhibited by holding membrane potential at -70 mV and the 23 pS channel could be activated at -100 mV and showed only a slight increase in NPo with membrane depolarization. It seems then, that the 23 pS channel is not directly gated by membrane depolarization. However, it could be that membrane potential modulates the appearance of the 23 pS channel. Membrane depolarization by bathing cells in a high K+ solution greatly delayed the second increment in [Ca2+]i, that associated with apoptosis. Moreover, membrane hyperpolarization manifested the activation of Ca2+ permeability in serum-deprived cells. Interestingly, it has been shown that high K+ solutions improve the survival of cells (Isenberg & Klockner, 1982) and that membrane depolarization might reduce the assembly of Bax channels (Antonsson et al. 1997). Whether there is a connection between these observations and how membrane depolarization delays the activation of the 23 pS channel remain to be demonstrated.
Activation by intracellular Ca2+ is a common feature among non-selective cation channels (reviewed in Siemen, 1993). The following evidence indicates that the 23 pS channel is not directly activated by an increment in [Ca2+]i, as opposed to a high conductance K+ channel, present in LNCaP cells, which can be reversibly activated by elevating [Ca2+]i with ionomycin. The exposure of excised patches to 2 mM Ca2+ neither activated the 23 pS channel when patches came from control cells nor changed the NPo in previously ionomycin-activated channels in the cell attached configuration. Further, the 23 pS channel activation, despite the ionomycin-induced increment in [Ca2+]i, was strongly curtailed by BAPTA. Nevertheless, it can still be argued that local increments in [Ca2+]i at the plasma membrane could be indirectly promoting the appearance of the 23 pS channel. This may not be the case with ionomycin since it produces slow and homogeneous increments in [Ca2+]i (Williams et al. 1985; Badminton et al. 1996; Muñoz et al. 1998).
The third possible mechanism for activation of non-selective channels is depletion of internal Ca2+ stores, as has been proposed recently as a mechanism of activation for this type of channel (e.g. Krause et al. 1996). In this respect, it has been suggested that ionomycin increases Ca2+ influx by activation of store-operated Ca2+-permeable channels (Mason & Grinstein, 1993; Morgan & Jacob, 1994). However, it does not seem that the 23 pS channel is a store-operated channel. Both 1 and 10 μM ionomycin in the application pipette produced the initial rise in [Ca2+]i. This came from internal Ca2+ stores, based on the following evidence: (1) the absence of extracellular calcium did not abrogate the first rise in [Ca2+]i induced by 10 μM ionomycin; (2) this rise in [Ca2+]i was not modified by changing plasma membrane potential and (3) this first increment in [Ca2+]i was virtually abolished by depleting internal Ca2+ stores with thapsigargin. These data imply that both ionomycin concentrations were able to empty internal Ca2+ stores, while only 10 μM ionomycin produced an important Ca2+ influx through the plasma membrane when external calcium was present. Additionally, ionomycin still activated Ca2+ influx in cells where store-operated Ca2+ entry was present (based on the elevated resting [Ca2+]i in the presence of thapsigargin, dashed line in Fig. 6A). Altogether, these data indicate that the 23 pS channel is not operated by depletion of internal Ca2+ stores.
Free radicals can increase [Ca2+]i in association with apoptosis (Fernandez et al. 1995) and recently, it has been demonstrated that oxidative stress activates a Ca2+-permeable, non-selective cation channel of 30 pS conductance in endothelial cells (Koliwad et al. 1996). Further, there are studies suggesting a role for oxidative stress in apoptosis induced by either ionomycin (Hatanaka et al. 1996) or serum removal (Atabay et al. 1996). Whether reactive oxygen species are involved in the activation of the 23 pS in these cells remains to be demonstrated.
A positive correlation was evident between membrane depolarization and the rate of rise of [Ca2+]i during the current clamp and Ca2+ measurement experiments. These data suggested the activation of a Ca2+-permeable non-selective cation channel to increase [Ca2+]i. The evidence for the 23 pS channel being such a Ca2+ entry mechanism in apoptosis can be summarized as follows: (1) this channel was not active at all in resting, healthy cells, nor in those exposed to non-lethal doses of ionomycin; (2) the activation of the 23 pS channel correlated with the rise in [Ca2+]i due to Ca2+ influx through the plasma membrane; (3) culturing cells in the absence of serum produced both an increased Ca2+ permeability and the apperance of a 23 pS channel. In conclusion, the 23 pS channel is a good candidate for a Ca2+ entry pathway that could be involved in apoptotic cell death of LNCaP cells. Indeed, Ca2+ influx has previously been shown to be essential for apoptosis of prostatic cancer cells (Martikainen et al. 1991; Furuya et al. 1994). However, this study does not rule out the participation of store-operated Ca2+ channels in apoptosis as well. Moreover, the nature of the Ca2+-permeable channel does not seem to be as critical for triggering apoptotic cell death as calcium influx itself. In this regard, increased activity of voltage-gated L type Ca2+ channels has been associated with ageing of mammalian hippocampal neurons (Thibault & Landfield, 1996). Likewise, neuronal cell death can be induced by activation of NMDA receptors (Choi, 1992) or the presence of β amyloid (Arispe et al. 1994). Apparently, all these proteins induce cell death due to an increased Ca2+ entry. Thus Ca2+ influx seems to be the key event in the activation of different Ca2+-dependent effectors of apoptosis for instance, tissue transglutaminase and some endonucleases (reviewed in Guerrero & Arias, 1998). Recently, Bax, the typical inducer of apoptosis of the Bcl-2 family of proteins, has been shown to present a pore-forming activity which can be linked to apoptosis of neuronal cells. Bcl-2 blocked the Bax-induced increase in membrane permeability and it also inhibited apoptosis in these cells (Antonsson et al. 1997). Thus, the 23 pS channel is a Ca2+-permeable channel that could provide another Ca2+ entry mechanism during cell death of LNCaP cells. Nevertheless, a selective inhibitor or a molecular identification of this channel will be required to establish its role in the induction and progression of apoptosis.
Acknowledgments
This research was supported by National Council for Science and Technology, CONACYT grants 0347P-N9506 and 5079-M9406, UNAM-PUIS grant 72217/94 and Fundación Miguel Alemán AC. We thank Gabriel Cota and Robert M. Drummond for critical reading of the manuscript.
References
- Ankarcrona M, Dypbukt JM, Bonfoco E, Zhivotovsky B, Orrenius S, Lipton SA, Nicotera P. Glutamate-induced neuronal death: a succession of necrosis and apoptosis depending on mitochondrial function. Neuron. 1995;15:961–973. doi: 10.1016/0896-6273(95)90186-8. 10.1016/0896-6273(95)90186-8. [DOI] [PubMed] [Google Scholar]
- Antonsson B, Conti F, Ciavatta AM, Montessuit S, Lewis S, Martinou Y, Bernasconi L, Bernard A, Mermord JJ, Mazzei G, Maundrell K, Gambale F, Sadoul R, Martinou JC. Inhibition of Bax channel-forming activity by Bcl-2. Science. 1997;277:370–372. doi: 10.1126/science.277.5324.370. 10.1126/science.277.5324.370. [DOI] [PubMed] [Google Scholar]
- Arispe N, Pollard HB, Rojas E. β amyloid Ca2+-channel hypothesis for neuronal death in Alzheimer disease. Molecular and Cellular Biochemistry. 1994;140:119–125. doi: 10.1007/BF00926750. [DOI] [PubMed] [Google Scholar]
- Atabay C, Cagnoli CM, Kharlamov E, Ikonomovic MD, Manev H. Removal of serum from primary cultures of cerebellar granule neurons induces oxidative stress and DNA fragmentation: protection with antioxidants and glutamate receptor antagonists. Journal of Neuroscience Research. 1996;43:465–475. doi: 10.1002/(SICI)1097-4547(19960215)43:4<465::AID-JNR7>3.0.CO;2-D. 10.1002/(SICI)1097-4547(19960215)43:4<465::AID-JNR7>3.3.CO;2-J. [DOI] [PubMed] [Google Scholar]
- Badminton MN, Campbell AK, Rembold CM. Differential regulation of nuclear cytosolic Ca2+ in HeLa cells. Journal of Biological Chemistry. 1996;27:31210–31214. doi: 10.1074/jbc.271.49.31210. [DOI] [PubMed] [Google Scholar]
- Baffy G, Miyashita T, Williamson JR, Reed JC. Apoptosis induced by withdrawal of interleukin-3 (IL-3) from an IL-3-dependent hematopoietic cell line is associated with repartitioning of intracellular calcium and is blocked by enforced Bcl-2 oncoprotein production. Journal of Biological Chemistry. 1993;268:6511–6519. [PubMed] [Google Scholar]
- Berridge MJ. Capacitative calcium entry. Biochemical Journal. 1995;312:1–11. doi: 10.1042/bj3120001. [DOI] [PMC free article] [PubMed] [Google Scholar]
- Bian X, Hughes FM, Huang Y, Cidlowski JA, Putney JW. Roles of cytoplasmic Ca2+ and intracellular Ca2+ stores in induction and suppression of apoptosis in S49 cells. American Journal of Physiology. 1997;272:C1241–1249. doi: 10.1152/ajpcell.1997.272.4.C1241. [DOI] [PubMed] [Google Scholar]
- Carl A, Lee HK, Sanders KM. Regulation of ion channels in smooth muscle by calcium. American Journal of Physiology. 1996;271:C9–34. doi: 10.1152/ajpcell.1996.271.1.C9. [DOI] [PubMed] [Google Scholar]
- Choi DW. Excitotoxic cell death. Journal of Neurobiology. 1992;23:1261–1276. doi: 10.1002/neu.480230915. [DOI] [PubMed] [Google Scholar]
- Distelhorst CW, Lam M, McCormick TS. Bcl-2 inhibits hydrogen peroxide-induced ER Ca2+ pool depletion. Oncogene. 1996;12:2051–2055. [PubMed] [Google Scholar]
- Dowd DR. Calcium regulation of apoptosis. In: Means AR, editor. Advances in Second Messenger and Phosphoprotein Research. Vol. 30. New York, USA: Raven Press; 1995. pp. 255–280. [DOI] [PubMed] [Google Scholar]
- Dowd DR, MacDonald PN, Komm BS, Haussler MR, Miesfeld R. Evidence for early induction of calmodulin gene expression in lymphocytes undergoing glucocorticoid-mediated apoptosis. Journal of Biological Chemistry. 1991;266:18423–18426. [PubMed] [Google Scholar]
- Erdahl WL, Chapman CJ, Taylor RW, Pfeiffer DR. Effects of pH conditions on Ca2+ transport catalyzed by ionophores A23187, 4-BrA23187, and ionomycin suggest problems with common applications of these compounds in biological systems. Biophysical Journal. 1995;69:2350–2363. doi: 10.1016/S0006-3495(95)80104-9. [DOI] [PMC free article] [PubMed] [Google Scholar]
- Fernandez A, Kiefer J, Fosdick L, McConkey DJ. Oxygen radical production and thiol depletion are required for Ca2+-mediated endogenous endonuclease activation in apoptotic thymocytes. Journal of Immunology. 1995;155:5133–5139. [PubMed] [Google Scholar]
- Furuya Y, Lundmo P, Short AD, Gill DL, Isaacs JT. The role of calcium, pH, and cell proliferation in the programmed (apoptotic) death of androgen-independent prostatic cancer cells induced by thapsigargin. Cancer Research. 1994;54:6167–6175. [PubMed] [Google Scholar]
- Grynkiewicz G, Poenie M, Tsien RY. A new generation of Ca2+ indicators with greatly improved fluorescence properties. Journal of Biological Chemistry. 1985;245:84–95. [PubMed] [Google Scholar]
- Guerrero A, Arias JM. Apoptosis. In: Sperelakis N, editor. Cell Physiology Source Book. 2. San Diego, USA: Academic Press; 1998. pp. 1031–1043. [Google Scholar]
- Guerrero A, Fay S, Singer JJ. Caffeine activates a Ca2+-permeable, nonselective cation channel in smooth muscle cells. Journal of General Physiology. 1994a;104:375–394. doi: 10.1085/jgp.104.2.375. 10.1085/jgp.104.2.375. [DOI] [PMC free article] [PubMed] [Google Scholar]
- Guerrero A, Singer JJ, Fay S. Simultaneous measurement of Ca2+ release and influx into smooth muscle cells in response to caffeine. A novel approach for calculating the fraction of current carried by calcium. Journal of General Physiology. 1994b;104:395–422. doi: 10.1085/jgp.104.2.395. 10.1085/jgp.104.2.395. [DOI] [PMC free article] [PubMed] [Google Scholar]
- Gutiérrez A, García L, Mas-Oliva J, Guerrero A. Ca2+-permeable channels activated during apoptosis of a prostatic cancer cell line. Biophysical Journal. 1997;72:A271. [Google Scholar]
- Hamill OP, Marty A, Neher E, Sakmann B, Sigworth FJ. Improved patch-clamp techniques for high-resolution current recording from cells and cell-free membrane patches. Pflügers Archiv. 1981;391:85–100. doi: 10.1007/BF00656997. [DOI] [PubMed] [Google Scholar]
- Harris JD, Gutiérrez AA, Hurst HC, Sikora K, Lemoine NR. Gene therapy for cancer using tumor-specific prodrug activation. Gene Therapy. 1994;1:170–175. [PubMed] [Google Scholar]
- Hatanaka Y, Suzuki K, Kawasaki Y, Endo Y, Taniguchi N, Takei N. A role of peroxides in Ca2+ ionophore-induced apoptosis in cultured rat cortical neurons. Biochemical and Biophysical Research Communications. 1996;227:513–518. doi: 10.1006/bbrc.1996.1538. [DOI] [PubMed] [Google Scholar]
- Isenberg G, Klockner V. Calcium tolerant ventricular myocytes prepared by preincubation in a ‘KB medium’. Pflügers Archiv. 1982;395:6–18. doi: 10.1007/BF00584963. [DOI] [PubMed] [Google Scholar]
- Khan AA, Soloski MJ, Sharp AH, Schilling G, Sabatini DM, Li SH, Ross CA, Snyder SH. Lymphocyte apoptosis: mediation by increased type 3 inositol 1,4,5,-trisphosphate receptor. Science. 1996;273:503–507. doi: 10.1126/science.273.5274.503. [DOI] [PubMed] [Google Scholar]
- Koliwad SK, Kunze DL, Elliot SJ. Oxidant stress activates a non-selective cation channel responsible for membrane depolarization in calf vascular endothelial cells. The Journal of Physiology. 1996;491:1–12. doi: 10.1113/jphysiol.1996.sp021191. [DOI] [PMC free article] [PubMed] [Google Scholar]
- Krause E, Pfeiffer F, Schmid A, Schulz I. Depletion of intracellular calcium stores activates a calcium conducting nonselective cation current in mouse pancreatic acinar cells. Journal of Biological Chemistry. 1996;271:32523–32528. doi: 10.1074/jbc.271.51.32523. [DOI] [PubMed] [Google Scholar]
- Lam M, Dubyak G, Chen L, Nuñez G, Miesfeld RL, Distelhorst CW. Evidence that Bcl-2 represses apoptosis by regulating endoplasmic reticulum-associated Ca2+ fluxes. Proceedings of the National Academy of Sciences of the USA. 1994;91:6569–6573. doi: 10.1073/pnas.91.14.6569. [DOI] [PMC free article] [PubMed] [Google Scholar]
- Lam M, Dubyak G, Distelhorst CW. Effect of glucocorticosteroid treatment on intracellular calcium homeostasis in mouse lymphoma cells. Molecular Endocrinology. 1993;7:686–693. doi: 10.1210/mend.7.5.8316252. [DOI] [PubMed] [Google Scholar]
- Logothetis DE, Kurachi Y, Galper J, Neer EJ, Clapham DE. The βγ subunits of GTP-binding proteins activate the muscarinic channel in heart. Nature. 1987;325:321–326. doi: 10.1038/325321a0. [DOI] [PubMed] [Google Scholar]
- Martikainen P, Kyprianou N, Tucker RW, Isaacs JT. Programmed death of nonproliferating androgen-independent prostatic cancer cells. Cancer Research. 1991;51:4693–4700. [PubMed] [Google Scholar]
- Mason MJ, Grinstein S. Ionomycin activates electrogenic Ca2+ influx in rat thymic lymphocytes. Biochemical Journal. 1993;296:33–39. doi: 10.1042/bj2960033. [DOI] [PMC free article] [PubMed] [Google Scholar]
- Morgan AJ, Jacob R. Ionomycin enhances Ca2+ influx by stimulating store-regulated cation entry and not by a direct action at the plasma membrane. Biochemical Journal. 1994;300:665–672. doi: 10.1042/bj3000665. [DOI] [PMC free article] [PubMed] [Google Scholar]
- Muñoz A, García L, Guerrero-Hernández A. In situ characterization of the Ca2+ sensitivity of large conductance Ca2+-activated K+ channels: Implications for their use as near-membrane Ca2+ indicators in smooth muscle cells. Biophysical Journal. 1998;75:1774–1782. doi: 10.1016/S0006-3495(98)77619-2. [DOI] [PMC free article] [PubMed] [Google Scholar]
- Rae J, Cooper K, Gates P, Watsky M. Low access resistance perforated patch recording using amphotericin B. Journal of Neuroscience Methods. 1991;37:15–26. doi: 10.1016/0165-0270(91)90017-t. [DOI] [PubMed] [Google Scholar]
- Shibasaki F, McKeon F. Calcineurin functions in Ca2+-activated cell death in mammalian cells. Journal of Cellular Biology. 1995;131:735–743. doi: 10.1083/jcb.131.3.735. [DOI] [PMC free article] [PubMed] [Google Scholar]
- Siemen D. Nonselective cation channels. In: Siemen D, Hescheler J, editors. Nonselective Cation Channels. Pharmacology, Physiology and Biophysics. Basel, Switzerland: Birkhaüser Verlag; 1993. pp. 3–25. [Google Scholar]
- Steller H. Mechanisms and genes of cellular suicide. Science. 1995;267:1445–1449. doi: 10.1126/science.7878463. [DOI] [PubMed] [Google Scholar]
- Thibault O, Landfield PW. Increase in single L-type calcium channels in hippocampal neurons during aging. Science. 1996;272:1017–1020. doi: 10.1126/science.272.5264.1017. [DOI] [PubMed] [Google Scholar]
- Thompson CB. Apoptosis in the pathogenesis and treatment of disease. Science. 1995;267:1456–1462. doi: 10.1126/science.7878464. [DOI] [PubMed] [Google Scholar]
- Vito P, Lacaná E, D'Adamio L. Interfering with apoptosis: Ca2+-binding protein ALG-2 and Alzheimer's disease gene ALG-3. Science. 1996;271:521–525. doi: 10.1126/science.271.5248.521. [DOI] [PubMed] [Google Scholar]
- Williams DA, Fogarty KKE, Tsien RY, Fay FS. Calcium gradients in single smooth muscles revealed by digital imaging microscope using Fura-2. Nature. 1985;318:558–561. doi: 10.1038/318558a0. [DOI] [PubMed] [Google Scholar]