

Abstract
Intracellular pH was recorded fluorimetrically by using carboxy-SNARF-1, AM-loaded into superfused ventricular myocytes isolated from guinea-pig heart. Intracellular acid and base loads were induced experimentally and the changes of pHi used to estimate intracellular buffering power (β). The rate of pHi recovery from acid or base loads was used, in conjunction with the measurements of β, to estimate sarcolemmal transporter fluxes of acid equivalents. A combination of ion substitution and pharmacological inhibitors was used to dissect acid effluxes carried on Na+-H+ exchange (NHE) and Na+-HCO3− cotransport (NBC), and acid influxes carried on Cl−-HCO3− exchange (AE) and Cl−-OH− exchange (CHE).
The intracellular intrinsic buffering power (βi), estimated under CO2/HCO3−-free conditions, varied inversely with pHi in a manner consistent with two principal intracellular buffers of differing concentration and pK. In CO2/HCO3−-buffered conditions, intracellular buffering was roughly doubled. The size of the CO2-dependent component (βCO2) was consistent with buffering in a cell fully open to CO2. Because the full value of βCO2 develops slowly (2·5 min), it had to be measured under equilibrium conditions. The value of βCO2 increased monotonically with pHi.
In 5 % CO2/HCO3−-buffered conditions (pHo 7·40), acid extrusion on NHE and NBC increased as pHi was reduced, with the greater increase occurring through NHE at pHi < 6·90. Acid influx on AE and CHE increased as pHi was raised, with the greater increase occurring through AE at pHi > 7·15. At resting pHi (7·04-7·07), all four carriers were activated equally, albeit at a low rate (about 0·15 mM min−1).
The pHi dependence of flux through the transporters, in combination with the pHi and time dependence of intracellular buffering (βi+βCO2), was used to predict mathematically the recovery of pHi following an intracellular acid or base load. Under several conditions the mathematical predictions compared well with experimental recordings, suggesting that the model of dual acid influx and acid efflux transporters is sufficient to account for pHi regulation in the cardiac cell. Key properties of the pHi control system are discussed.
Intracellular pH in mammalian myocardial cells is governed by the balance among four sarcolemmal acid-equivalent ion transporters (Sun et al. 1996). Two of these, Na+-H+ exchange (NHE) and Na+-HCO3− cotransport (NBC), mediate acid-equivalent efflux (acid extrusion; Dart & Vaughan-Jones, 1992; Lagadic-Gossmann et al. 1992a) while the other two, Cl−-HCO3− exchange (anion exchange; AE) and Cl−-OH− exchange (CHE) mediate acid-equivalent influx (acid loading; Vaughan-Jones, 1979; Sun et al. 1996; Leem & Vaughan-Jones, 1998b). Activity of the transporters is modulated by pH. In the present work, we attempt to characterize the overall kinetics of cardiac pHi regulation in terms of the activity of these acid/base transporters. In order to do this, we have determined experimentally the pHi sensitivity of acid-equivalent flux through each type of transporter. Provided that all relevant transporters have been identified it should then be possible, by summing their fluxes, to reconstruct the time course of pHi regulation following acute, intracellular acid or base loads. By inspecting the pHi sensitivity of the four transporters, it should also be possible to deduce the relative importance of each to the control of intracellular pH, and to the maintenance of resting pHi.
In order to investigate the kinetic properties of a transporter, we have used recordings of pHi in isolated ventricular myocytes to estimate sarcolemmal fluxes of acid equivalents. Fluxes are calculated as the product of dpHi/dt (the rate of change of pHi), caused by a transporter's activity, and βtot, which represents total intracellular buffering power. The value assumed for βtot therefore affects the estimate of acid/base flux. Buffering comprises two components that can be summed algebraically (Roos & Boron, 1981). These are intrinsic, non-CO2-dependent buffering (βi) and CO2-dependent buffering (βCO2). The values of intrinsic and CO2-dependent buffering power vary differently as pHi varies. Two further points are relevant. (i) In some cell types, such as smooth muscle myocytes (Baro et al. 1989; Aickin, 1994) and CNS neurones (Amos et al. 1996), βCO2 is reported to be essentially zero, even in the presence of physiological concentrations of CO2, although the reason for this is far from clear and such reports remain controversial. To date, systematic measurements of βCO2 have not been made in the cardiac ventricular cell, although clear effects of CO2-dependent buffering on pHi are evident (Leem & Vaughan-Jones, 1998a). (ii) In the cardiac cell, intracellular CO2-dependent buffering equilibrates slowly, most notably following acute intracellular alkali loads (Leem & Vaughan-Jones, 1998a). This is in contrast to intracellular intrinsic buffering which, on the time scale of the experiments shown in the present work, equilibrates essentially instantaneously (Leem & Vaughan-Jones, 1998a). The slow equilibration of CO2-dependent buffering produces pHi transients that may be mistaken for acid transport. Estimates of transporter flux from recordings of pHi must therefore be made when the intracellular CO2/HCO3− buffer system is at equilibrium. In view of the complexities and uncertainties concerning intracellular buffering in cardiac cells, we have designed experiments to measure both βi and βCO2.
By using data from the experiments outlined above, we have formulated a mathematical model of pHi regulation that takes into account not only pHi-controlled acid efflux and influx through multiple types of transporter, but also intrinsic buffering and slow, intracellular CO2-dependent buffering.
A preliminary account of some of this work has been published (Leem & Vaughan-Jones, 1996).
METHODS
Isolation of guinea-pig ventricular myocytes
The composition of solutions used for cell isolation and the details of the procedure have been described previously (Lagadic-Gossmann et al. 1992a). Briefly, single ventricular myocytes were isolated from 350-450 g albino guinea-pigs (killed by cervical dislocation) using a combination of enzymatic and mechanical dispersion (0.7 mg ml−1 collagenase, Boehringer Mannheim, and 0.04 mg ml−1 protease, Sigma). The cells were finally suspended in Hepes-buffered Dulbecco's modified Eagle medium and left at room temperature until use. Only myocytes displaying a rod shape and calcium tolerance were used in the study.
Measurement of intracellular pH
SNARF loading and calibration
The pHi was measured by using acetoxymethyl ester (AM)-loaded carboxy-SNARF-1, a dual-emission, pH-sensitive fluorophore. Full details of dye loading plus pHi measurement and dye signal calibration have been given previously (e.g. Buckler & Vaughan-Jones, 1990; Sun et al. 1996). Briefly, isolated cells were loaded for 7 min at room temperature with 10 μM carboxy-SNARF-1 AM. SNARF fluorescence from individual cells was excited at 540 ± 12 nm and measured simultaneously at 590 ± 5 and 640 ± 5 nm, with an inverted microscope (Nikon Diaphot) converted for epifluorescence. The signals were digitized at 0.25 kHz (CED 1401 plus) and then averaged over 0.5 s intervals. The emission ratio was calculated and converted to a pH value using the pH ratiometric fluorescence equation (Buckler & Vaughan-Jones, 1990; Sun et al. 1996). This calculation requires knowledge of ‘default’ pH calibration data for intracellular SNARF, obtained in situ for individual ventricular myocytes and averaged for > 10 cells from at least three animals. These default data were obtained with the nigericin (10 μM) calibration technique (see Sun et al. 1996, for details of calibration solutions). The default values were determined routinely once a month. The terms determined were maximum emission ratio at pH 5.5, minimum ratio at pH 9.5 and 9.5/5.5 pH fluorescence ratio measured at 640 nm. Typical values were 1.556, 0.129 and 2.049, respectively. These predict a pKa for intracellular SNARF of 7.365. Default data were used in place of performing a nigericin calibration after every experiment, in order to reduce potential contamination of the cell superfusion system with nigericin. The accuracy of the in situ calibration was cross-checked regularly during experiments, by using the weak acid/base (propionate/trimethylamine) null point technique (Eisner et al. 1989; see Buckler & Vaughan-Jones (1990) for details of experimental procedure). An acceptable cross-check was one where pHi of a myocyte determined by the null point and default data methods agreed to within 0.1 pH unit (more usually, agreement was within 0.05 pH unit).
Cleaning the superfusion apparatus
Care was taken to clean the superfusion apparatus thoroughly after a nigericin calibration (see Sun et al. 1996). The superfusion lines were replaced. The superfusion chamber and solution switcher were dismantled and soaked in ethanol for several hours, followed by a soak for at least 12 h in a 20 % solution of the detergent Decon 75 (Decon Laboratories Ltd, Hove, Sussex, UK), followed by simmering in deionized water for several hours.
Solutions
Hepes-buffered Tyrode solution contained (mM): 135 NaCl, 4.5 KCl, 1 MgCl2, 2 CaCl2, 11 glucose and 20 Hepes (pKa= 7.5). For Na+-free Tyrode solution, Na+ was replaced by 145 mM N-methyl-D-glucamine (NMDG). Cl−-free Tyrode solution contained (mM): 140 sodium gluconate, 4.5 potassium gluconate, 4 calcium gluconate, 2 magnesium gluconate, 11 glucose and 20 Hepes. The pH of all solutions was adjusted to 7.4 at 37°C using 4 M NaOH, except for Na+-free Tyrode solution, which was adjusted with 5 M HCl, and Cl−-free, Na+-free Tyrode solution, which was adjusted using glucuronic acid. CO2/HCO3−-buffered Tyrode solutions were saturated with 5 % CO2-95 % air and contained (mM): 120 NaCl, 4.5 KCl, 1 MgCl2, 2 CaCl2, 11 glucose and 22 NaHCO3. For Na+-free Tyrode, NaCl and NaHCO3 were replaced isosmotically by NMDG and the pH of the CO2-saturated solution adjusted to 7.4 at 37°C with HCl.
When acetate was added either to Hepes- or HCO3−-buffered solutions, an equimolar amount of anion (either Cl− or gluconate) was omitted.
Drugs and chemicals
Carboxy-SNARF-1 AM was bought from Molecular Probes. Hoe 694 was kindly provided by Drs W. Scholz and H. Lang of Hoechst Aktiengesellschaft (Germany). Dimethyl amiloride (DMA) was bought from Research Biochemicals International. All other general chemicals were from Merck or Sigma.
Calculation of sarcolemmal acid flux (JH)
Following activation of a transporter, the product of dpHi/dt and intracellular buffering power (β) gives the net rate of intracellular acid or base loading. The value selected for β depends on intrinsic (non-CO2) buffering (βi) and (where appropriate) CO2-dependent buffering (βCO2). The former value was calculated from eqn (1) in Results, and the latter value was estimated as:
(Roos & Boron, 1981). It is important to realize that this latter equation assumes CO2/HCO3− buffer equilibrium and therefore will not be applicable to out-of-equilibrium periods such as those that occur for 2-3 min following the imposition of an intracellular alkali load induced by the acetate prepulse technique (Leem & Vaughan-Jones, 1998a). The equation also assumes equality of pKa for CO2/HCO3− and equality of CO2 solubility and CO2 concentration on both sides of the sarcolemma. When [HCO3−]o is calculated from the Henderson-Hasselbalch equation, the effect of saturated water vapour pressure on the pKa of CO2/HCO3− must be taken into account. Under these conditions, pKa for CO2/HCO3− becomes 6.15 at 37°C (Leem & Vaughan-Jones, 1998a).
Rates of change of pHi (dpHi/dt) from an intracellular acid or alkali load were obtained by computer from the first time differential of the best fit polynomial equation (SigmaPlot III) to the experimental data points sampled at 0.5 s intervals. A 4th order polynomial fit was used and was confirmed by a P value > 0.99, obtained from Student's paired t test (Leem & Vaughan-Jones, 1998a;r2 usually > 0.98). All statistical data are expressed as means ±s.e.m.
RESULTS
Intracellular buffering
Intrinsic buffering
In previous work with guinea-pig ventricular myocytes, βi was estimated in the pHi range 7.3-6.8 (Lagadic-Gossmann et al. 1992a). For the present experiments, we computed acid flux over a considerably wider pHi range (6.2-7.7). Intrinsic buffering was determined in cells superfused with Hepes-buffered Tyrode solution, i.e. nominally free of CO2/HCO3−. The protocol consisted of acid loading a cell by using the ammonium prepulse technique, and then recording the resulting fall of pHi (Roos & Boron, 1981). The experiments were performed in Cl−-free (gluconate substituted) solution to inhibit CHE (Leem & Vaughan-Jones, 1998b). Thirty micromolar Hoe 694 was included in all superfusates to inhibit NHE (Loh et al. 1996). In order to estimate βi over a sufficiently wide range of pHi values, the extracellular ammonium concentration during the prepulse was reduced in 5 mM steps from 30 mM to zero (cf. the protocol in Fig. 9 of Lagadic-Gossmann et al. 1992a). One such experiment is illustrated in Fig. 1A. Because solutions were Cl− free, (NH4)2SO4 was superfused rather than NH4Cl. Ba2+ (2 mM) was also present throughout the experiment to reduce transmembrane NH4+ movement through K+ channels. The successive decreases in pHi produced by stepping down the extracellular ammonium concentration were used to estimate βi (mM) as βi=Δ[NH4+]i/ΔpHi, where [NH4+]i=[NH4+]o× 10(pHo-pHi), assuming that the pK of ammonium dissociation is the same in the extracellular and intracellular compartment (Roos & Boron, 1981; Lagadic-Gossmann et al. 1992a). The increase of intracellular acid equivalents produced by extracellular ammonium reduction was assumed to equal the calculated reduction of intracellular [NH4+]. The value of βi was assigned to the mid-point of each step decrease in pHi.
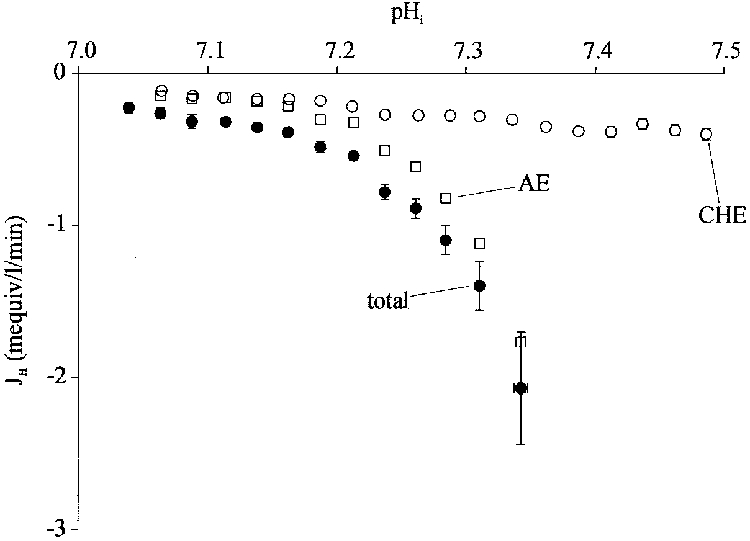
Figure 9. Integrated plot of intracellular pH regulation.
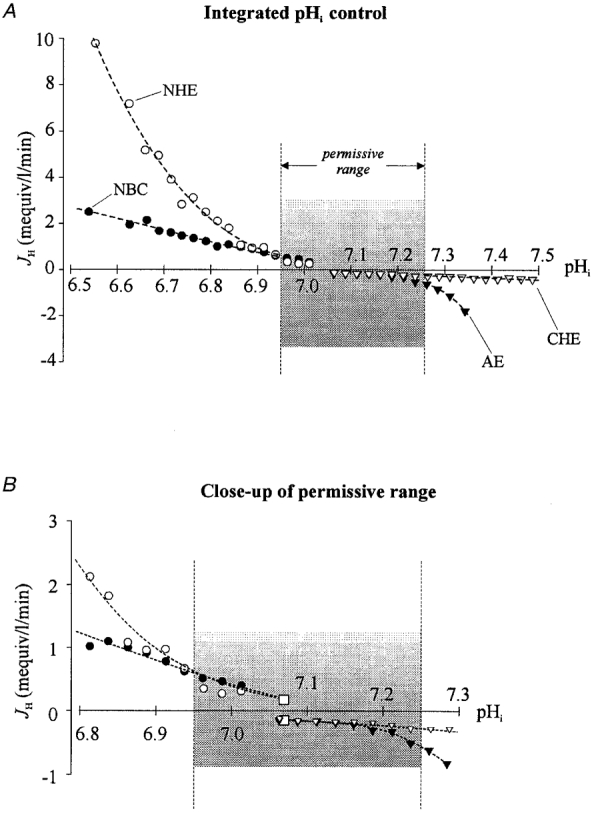
A, the plots are taken from Fig. 4 for Cl−-HCO3− exchange (AE,▾) and Cl−-OH− exchange (CHE, ▿) and from Fig. 6 for Na+-H+ exchange (NHE, ○) and Na+-HCO3− cotransport (NBC, •). For simplicity, the standard error bars have not been re-plotted. The vertical dotted lines that enclose the shaded area delineate the ‘permissive range’ of pHi control. This is the range (defined arbitrarily) where flux magnitude through all the transporters is notably low (see Discussion for further details). B, close-up view of permissive range. Data taken from A with the additional inclusion of NHE and NBC flux activity at the mean resting pHi of 7.07 (the single open square above the pHi axis defines the identical activity for each transporter). The flux activity for the AE and CHE transporters at this same pHi is also represented by the single open square plotted below the pHi axis. These additional data are derived from Fig. 8B.
Figure 1. Intracellular intrinsic buffering.

A, experimental protocol: stepwise, intracellular acid loads were induced sequentially by superfusing 15 mM (NH4)2SO4 and then reducing extracellular ammonium concentration in 5 mM steps (i.e. 2.5 mM step reductions of (NH4)2SO4) to zero. All solutions were Cl− free (gluconate substituted), contained in 30 μM Hoe 694 and were buffered (pHo 7.40) with 20 mM Hepes (nominally free of CO2/HCO3−). Each stepwise fall of pHi was used to calculate intracellular intrinsic buffering power (βi). The resulting value is listed for the mid-point of each step fall in pHi. B, •, βi averaged over successive 0.2 unit pHi bins, starting for the range 6.1-6.3, 6.3-6.5 and so on, where the number of determinations in each bin is n = 2, 5, 3, 4. From pHi 6.9 and above, data have been averaged over successive 0.1 pHi ranges, and n = 4, 7, 7, 7, 12, 22, 17, 17, 12. Data were taken from a total of 28 cells. The continuous line through the averaged data was calculated from eqn (1) in Results. This line represents the sum of two component buffers whose buffering powers (pK and concentration) vary with pHi in accordance with the two intersecting biphasic curves plotted in the lower part of the figure.
Figure 1B pools data obtained from several experiments. As in previous work (Vaughan-Jones & Wu, 1990a;Lagadic-Gossmann et al. 1992a), we find that βi declines as pHi rises. Furthermore, in the range 6.8 to 7.3 the βi values are very similar to those reported previously for this cell type (Lagadic-Gossmann et al. 1992a) and decline roughly linearly. Over a wider pHi range, however, it is apparent that the decline is non-linear. As shown in Fig. 1B, this can be conveniently described by assuming contributions from two principal buffer species (A and B):
 |
(1) |
where [TA] and [TB] are total concentration of buffer A and buffer B, respectively. By using SigmaPlot to fit the βivs. pHi curve, the following values were obtained: [TA]= 84.22 ± 5.37 mM, [TB]= 29.38 ± 1.32 mM, pKA= 6.03 ± 0.08 and pKB= 7.57 ± 0.08 (goodness of fit: r2= 0.78).
CO2-dependent buffering
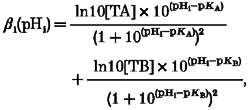
The experiment shown in Fig. 2A illustrates the effect of CO2/HCO3− on intracellular buffering power. All solutions were again made Cl− free in order to inhibit acid influx carriers (Leem & Vaughan-Jones, 1998b). For the first part of the trace, an intracellular alkali load was imposed in Hepes-buffered conditions, by using the acetate prepulse (20 mM) technique. Total intracellular buffering power (βtot) under these conditions (nominally free of CO2/HCO3−) equals non-CO2 intrinsic buffering power (βi). Buffering power was calculated as βtot=Δ[Acetate−]i/ΔpHi, where [Acetate−]i=[Acetate−]o× 10(pHi-pHo), assuming that the pKa of acetic acid is the same in both the extracellular and intracellular compartment. In Fig. 2A, βi determined from the rise of pHi following the first acetate removal was 21.2 mM, a value similar to that determined previously (Fig. 1) over a comparable pHi range (7.0-7.35). The superfusate was then switched to one buffered with 5 % CO2/HCO3− (same pHo of 7.40), and a second acetate pulse applied. This time a higher acetate concentration (40 mM) was used. Acetate removal again produced a rise of pHi. Two points should be noted. Firstly, the rise was followed by a rapid but only partial recovery of pHi. This recovery was not caused by sarcolemmal acid influx on the AE or CHE carriers since it was occurring in Cl−-free solution. It was caused by the slow equilibration of intracellular CO2-dependent buffering following the alkali loading procedure (Leem & Vaughan-Jones, 1998a), a process completed in about 2.5 min. Secondly, the rise in steady-state pHi upon acetate removal was about the same as that seen previously in Hepes buffer despite the fact that twice the concentration of acetate had been removed. This result indicates that total intracellular buffering power had been approximately doubled in the presence of CO2/HCO3−. A similar increase of intracellular buffering power in CO2/HCO3− was observed in four further experiments like that shown in Fig. 2A. The value of βtot calculated from the rise of pHi in CO2/HCO3− solution in Fig. 2A was 48.3 mM. This value (βtot) comprises the algebraic sum of βi and βCO2. Subtracting the buffering power determined initially in Hepes solution (21.2 mM) therefore delivers the value of βCO2. In Fig. 2A, this was 27.1 mM.
Figure 2. Intracellular CO2-dependent buffering.
A, intracellular buffering doubles on switching from Hepes to CO2/HCO3−-buffered conditions. The trace shows a ratiometric recording of pHi. Superfusates were Cl− free (gluconate substituted). An acetate prepulse (20 mM) was performed initially in Hepes, then (40 mM) in CO2/HCO3−-buffered solutions (same pHo= 7.40). B, total intracellular buffering power (βtot) in CO2/HCO3−-buffered conditions. Experimental protocol: a 40 mM acetate prepulse was executed in Cl−-free, 5 % CO2/HCO3−-buffered solution (pHo 7.40) and the subsequent steady-state rise of pHi used to calculate intracellular buffering power (βtot). This has been plotted versus pHi at the mid-point of the rise of intracellular HCO3− following acetate removal (see text for details). Data have been pooled from several cells and averaged for the following 0.1 pHi ranges (•) starting at pH 6.90, with sample sizes, n = 8, 9, 6, 19 and 20. Also plotted (lower continuous line) is the relationship between intrinsic buffering capacity (βi) and pHi over the same pHi range (6.90-7.38) calculated from eqn (1) in Results. C,βCO2 in the cardiac cell. At a given pHi, the difference between the mean experimental values of βtot (• in B) and the value of βi determined from eqn (1) (continuous curve in B) gives βCO2. This difference has been plotted versus pHi in C (○). The continuous line drawn through the data is the theoretical value of βCO2vs. pHi for a cell open to CO2, and has been calculated from eqn (2) in Results.
Figure 2B shows a plot of total intracellular buffering power (βtot; filled circles) as a function of intracellular pH, averaged for 62 buffer determinations from 31 cells bathed in CO2/HCO3−-buffered solution. Since total intracellular buffering power contains a large component attributable to βCO2, and since intracellular CO2-dependent buffering power theoretically increases exponentially with pHi (assuming the cell is open to CO2), we could not assign a calculated buffer value to the mid-point pHi value following acetate removal. Instead, we assigned it to the mid-point of the rise in [HCO3−]i calculated for the rise of steady-state pHi, on the grounds that full CO2-dependent buffering is linearly related to intracellular bicarbonate (Roos & Boron, 1981) in accordance with the equation:
| (2) |
The pHi value corresponding to the mid-point for the bicarbonate rise was obtained using the following equation:
| (3) |
where pHstart was the pHi value just before acetate removal and pHend was the steady-state pHi after acetate removal.
Figure 2B shows that, over the pHi range 6.9-7.4, total intracellular buffering power increases with a rise of pHi. The continuous line drawn in Fig. 2B plots the relationship between intrinsic buffering power (βi) and pHi, as determined previously (eqn (1)) in Hepes-buffered solutions. Over the same pHi range, βi falls rather than rises, and the relationship is roughly linear. The value of βi at any given pHi (calculated from eqn (1)) was then subtracted from the averaged values of βtot shown in Fig. 2B, thus giving βCO2. In Fig. 2C the derived values of βCO2 have been plotted as a function of pHi.
The value of βCO2 rises with increasing pHi. The continuous line fitted to the data in Fig. 2C shows the theoretical relationship calculated for a cell open to CO2, assuming CO2 buffering is at equilibrium. The theoretical value for βCO2 was calculated for a given pHi by using eqn (2) (see legend to Fig. 2C for further details). Note that the experimental and theoretical values for βCO2 are in reasonably close agreement. This indicates that intracellular CO2-dependent buffering is fully expressed in the cardiac cell.
In all subsequent work we have assumed that intracellular buffering power, βtot, equals the sum of βi and βCO2, where βi conforms to eqn (1) and βCO2 conforms to eqn (2).
Sarcolemmal acid transport
Protocols for activating acid extruders and acid loaders
Hepes buffer
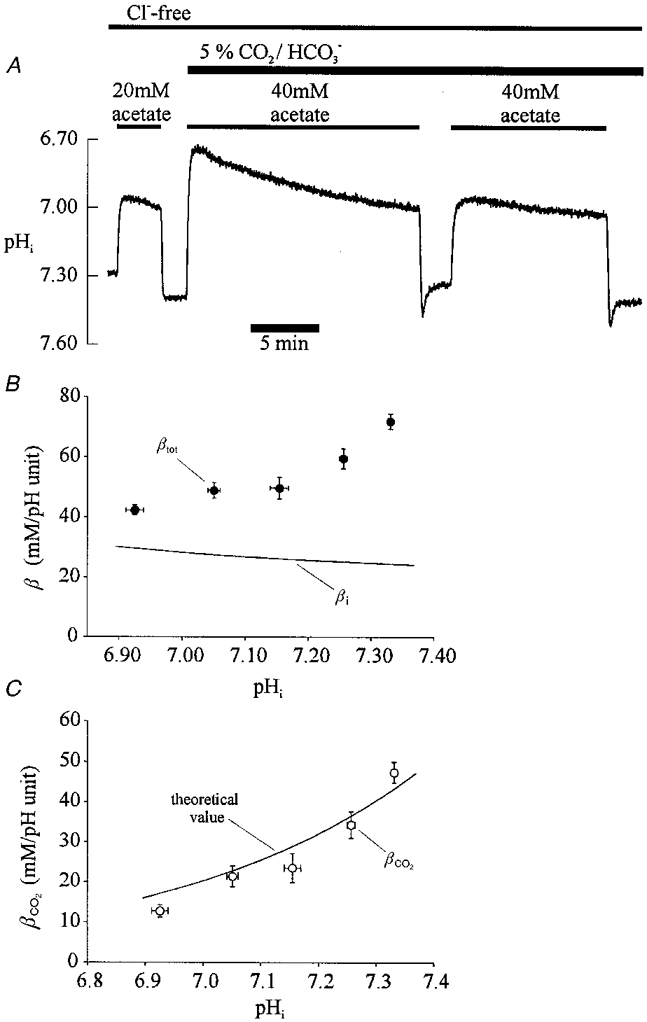
The trace shown in Fig. 3A, one of eight similar experiments, demonstrates the activation of acid-equivalent efflux and influx in the presence of a Hepes-buffered superfusate (nominally free of CO2/HCO3−). The first part of the trace shows pHi recovery from an acid load (loading induced by ammonium prepulse). The recovery is known (Lagadic-Gossmann et al. 1992a) to be mediated by acid extrusion on Na+-H+ exchange (NHE). The second part of the trace shows pHi recovery from an alkali load (loading induced by acetate prepulse). We have recently proposed (Leem & Vaughan-Jones, 1998b) that this latter recovery is mediated by acid-equivalent influx on a Cl−-OH− exchanger (CHE), or alternatively by influx on an H+-Cl− cotransporter (note that these alternative modes of transport cannot readily be distinguished). Consistent with this hypothesis, pHi recovery from alkalosis is inhibited in Hepes-buffered, Cl−-free solution (note, for example, the lack of recovery from alkalosis following an acetate prepulse in the first part of the trace in Fig. 2A; see also Leem & Vaughan-Jones, 1998b). In Fig. 3A, the alkali recovery phase occurred in the presence of Hoe 694 (30 μM), a high affinity NHE-1 inhibitor, confirming that the acid influx is independent of NHE activity. Note also that this recovery continued to pHi levels lower than control but that on removal of the NHE inhibitor the fall was terminated, pHi rising again towards control levels. The same result was seen in seven other experiments. The result suggests that, at normal resting pHi, both acid extrusion and acid loading fluxes must be active. We return to this point later in the Results section.
Figure 3. Activating sarcolemmal acid efflux and influx.
A, Hepes-buffered solution (pHo 7.40). Ratiometric recording of pHi. A 10 mM ammonium prepulse was succeeded by a 40 mM acetate prepulse. Hoe 694 (30 μM) was added, as indicated by bar, to inhibit Na+-H+ exchange. B, 5 % CO2/HCO3−-buffered solution (pHo 7.40). The first bar above the pH trace indicates application of 10 mM ammonium chloride. The second bar indicates application of 80 mM acetate. Shortly before removal of the acetate, Na+o was withdrawn (replaced by NMDG), in order to inhibit acid extrusion on Na+-H+ exchange and Na+-HCO3− cotransport.
CO2/HCO3− buffer
Figure 3B illustrates an experiment similar to that shown in Fig. 3A, but performed in CO2/HCO3− buffer. Recovery of pHi from the acid load (induced by ammonium prepulse) was now mediated by a combination of NHE and Na+-HCO3− cotransport (NBC) (Dart & Vaughan-Jones, 1992; Lagadic-Gossmann et al. 1992a), while recovery >2.5 min after inducing an alkali load (acetate prepulse) was caused (Leem & Vaughan-Jones, 1998b) by acid equivalent influx on a combination of CHE plus Cl−-HCO3− exchange (AE). In this latter case, the recovery from alkalosis was observed in Na+-free solution (NMDG substituted) in order to ensure that it was independent of the activity of NHE or NBC (both of which are Na+ dependent). The pHi recovery again continued to levels lower than control. Re-adding Na+ to the external superfusate, and thus restoring NHE and NBC activity, terminated this fall of pHi, which promptly returned to control levels. The same result was seen in seven other experiments.
Characterization of acid loaders
The pHi dependence of CHE and AE
Because the recoveries from intracellular alkalosis illustrated in Fig. 3A and B were recorded in the absence of acid extruder activity, they were used to characterize the pHi sensitivity of acid influx. Figure 4 pools data derived from several such experiments. Acid equivalent influx was computed >2.5 min after acetate removal in order to ensure complete CO2/HCO3− buffer equilibration following the alkali load (Leem & Vaughan-Jones, 1998a).
Figure 4. pHi dependence of dual acid influx.
•, total acid influx (dpHi/dt×βtot), measured from pHi recovery rate from intracellular alkalosis (acetate prepulse) in CO2/HCO3−-buffered conditions (Na+-free conditions; Na+o replaced by NMDG). ○, acid influx measured in Hepes buffered conditions (i.e. influx through Cl−-OH− exchange; dpHi/dt×βi; 30 μM Hoe 694 or 30 μM DMA was present to inhibit acid extrusion through NHE). □, total influx - CHE flux therefore plots the CO2/HCO3−-dependent acid influx (caused by AE activity). Flux values in CO2/HCO3− (•) have been averaged over successive 0.025 pHi ranges starting (left to right) with 7.025-7.05; n = 114, 108, 94, 109, 122, 130, 110, 96, 63, 41, 17, 9, 5. Flux values in Hepes (○) have been averaged over successive 0.025 pHi ranges starting with 7.05-7.075; n = 126, 128, 113, 109, 113, 113, 83, 75, 76, 71, 68, 50, 42, 32, 23, 22, 18, 17. Data taken from a total of 8 cells.
Inspection of Fig. 4 shows that in Hepes (open circles) acid influx is low at pHi 7.06 and doubles as pHi increases by about 0.3 units (from pHi 7.06 to 7.35). This must represent the pHi sensitivity of CHE-mediated acid influx. In CO2/HCO3− buffer (filled circles), influx is again low at pHi 7.06 and increases steeply with rising pHi. These latter measurements must represent the pHi sensitivity of acid influx occurring via a combination of AE and CHE activity. Subtracting the CHE curve (open circles) from the combination curve (CHE + AE; filled circles) provides an estimate of the pHi sensitivity of AE alone (open squares). Inspection of this latter curve reveals that acid influx through AE is much more pHi sensitive than that through CHE, increasing nearly tenfold in response to a 0.3 unit rise in pHi.
Characterization of acid extruders
The pHi dependence of NHE and NBC
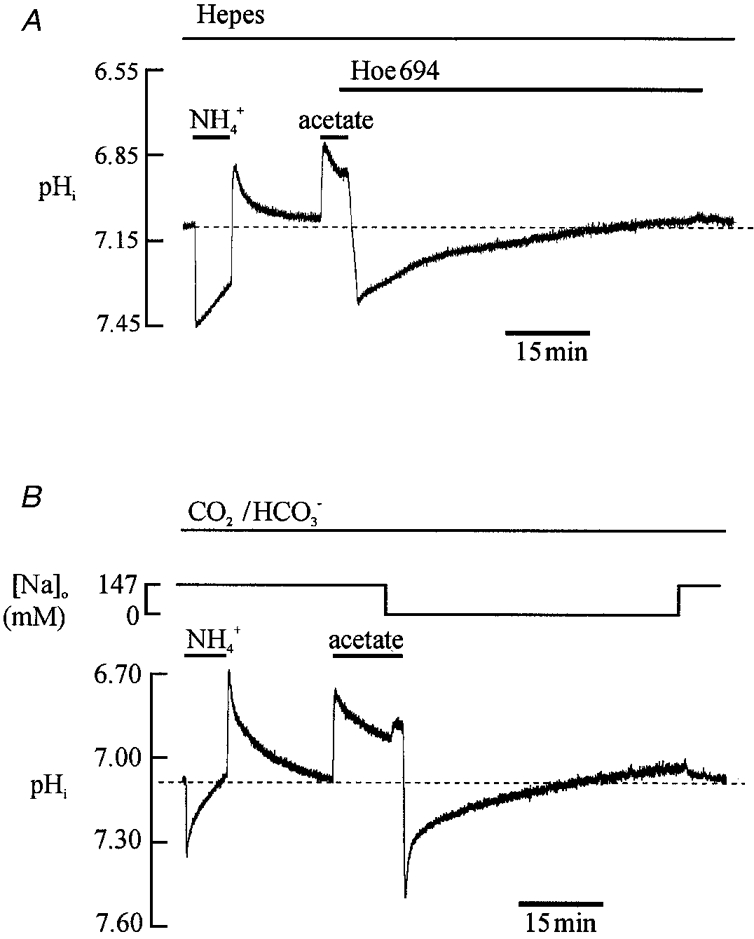
Although a preliminary description of this has been presented for the guinea-pig ventricular myocyte (Lagadic-Gossmann et al. 1992a), a full analysis averaged for several cells has so far not been undertaken. The experiments shown in Fig. 5 illustrate the two components of acid extrusion in the myocardial cell (NHE and NBC). In the first part of Fig. 5A, acid extrusion in Hepes buffer is revealed as an amiloride-inhibitable pHi recovery from intracellular acidosis (loading induced by ammonium prepulse). This confirms the functional expression of NHE activity. The later part of the trace shows activation of an amiloride-insensitive pHi recovery following replacement of the superfusate's Hepes buffer by CO2/HCO3− buffer. The amiloride-insensitive recovery has been ascribed to the NBC carrier (Dart & Vaughan-Jones, 1992; Lagadic-Gossmann et al. 1992a).
Figure 5. Dual acid efflux.
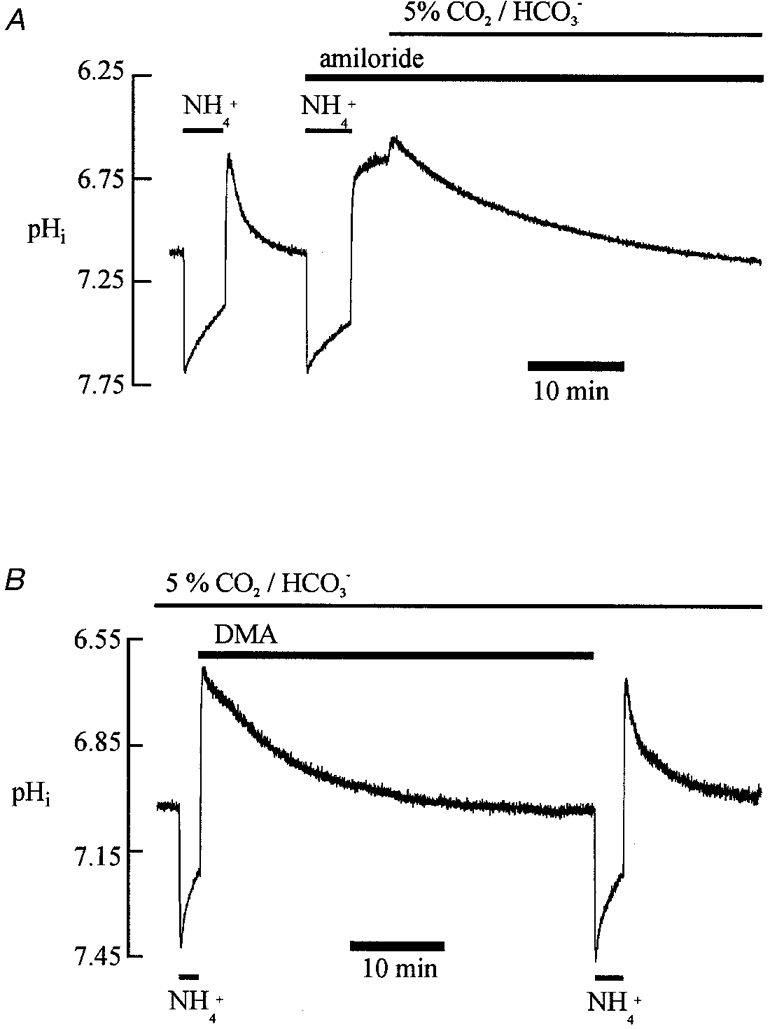
A, the first part of the experiment was performed in Hepes-buffered solutions. The second part, as indicated, was performed in 5 % CO2/HCO3−. The pHo was 7.40 throughout. Note the amiloride-resistant pHi recovery from an intracellular acid load (15 mM ammonium withdrawal) in CO2/HCO3− buffer. B, CO2/HCO3− -buffered solutions throughout (pHo 7.40). Note that pHi recovery from an intracellular acid load (15 mM ammonium withdrawal) was slowed by DMA.
Figure 5B dissects out the dual extrusion system in a different way. Here, in CO2/HCO3− buffer, pHi recovery from an acid load (loading by ammonium prepulse) was observed first in the presence of the high affinity NHE inhibitor dimethyl amiloride (DMA) and then in its absence. Recovery was much faster in the absence of DMA, confirming that NHE contributes significantly but not exclusively to pHi recovery. Note that following acute intracellular acid loading, intracellular CO2-dependent buffering should re-equilibrate reasonably rapidly (10-20 s) unlike following acute intracellular base loading where equilibration is much slower (a few minutes; Leem & Vaughan-Jones, 1998a). Slow CO2-dependent buffering will not therefore significantly distort estimates of transporter flux derived from pHi recovery from acid loads.
Figure 6 pools data obtained from several experiments like those shown in Fig. 5B. Acid extrusion (dpHi/dt×βtot) has been plotted versus pHi for results in CO2/HCO3− buffer containing 30 μM DMA (open circles). This therefore describes the pHi dependence of acid efflux through NBC. Also plotted in Fig. 6 is acid extrusion in CO2/HCO3− buffer in the absence of DMA (filled circles). This latter graph provides the pHi dependence of acid extrusion through a combination of NHE plus NBC. The difference between the two curves (filled circles minus open circles) therefore provides a description (open squares) of the pHi sensitivity of extrusion through NHE alone, determined in the presence of a CO2/HCO3− buffer system. Inspection of the flux data in Fig. 6 indicates that, in the pHi range 7.0-6.5, NHE activity increases much more steeply than that of NBC.
Figure 6. pHi dependence of dual acid efflux.
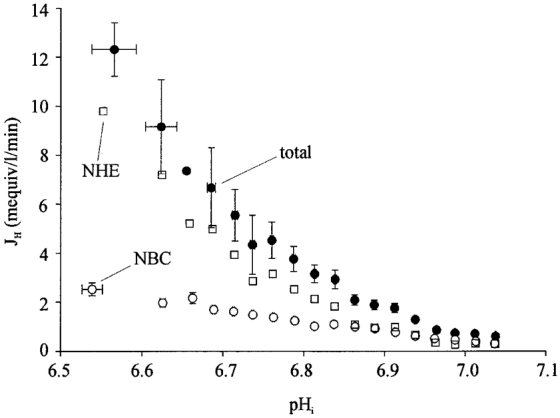
Data derived from 22 cells exposed to experimental protocols like that shown in Fig. 4B.•, total acid efflux derived from pHi recovery from an intracellular acid load. ○, acid efflux through Na+-HCO3− cotransport (NBC), derived from pHi recovery from an acid load in the presence of 30 μM DMA. □, acid efflux through Na+-H+ exchange (NHE), derived from the difference between the recovery rate with and without DMA. Data derived from experiments like that shown in Fig. 5B.•, fluxes averaged over successive 0.05 pHi ranges, starting with 6.55-6.60, n = 2, 2; and averaged over successive 0.025 pHi-ranges, starting with 6.65-6.70, n = 2, 3, 6, 7, 13, 16, 22, 29, 36, 49, 40, 66, 92, 108, 94, 115. ○, fluxes averaged over 0.05 pHi bins starting with 6.55-6.60, n = 14, 16; and averaged over successive 0.025 pHi ranges starting with 6.65-6.75, n = 16, 6, 31, 43, 49, 60, 82, 72, 83, 87, 100, 140, 108, 112, 156, 146.
Note that the ordinate in Fig. 6 refers to net acid efflux, i.e. the fluxes ascribed to NHE and NBC activity have not been corrected for possible simultaneous acid influx activity. This is considered below, in the section on ‘flux overlap’.
The pHi dependence of acid extrusion was further derived in a separate set of experiments that employed a different protocol. Net extrusion was computed from the rate of pHi recovery after an ammonium prepulse performed first in Hepes (for NHE) and then in CO2/HCO3− buffer (for NHE plus NBC). A sample ammonium prepulse and subsequent pHi recovery in the two conditions is shown in Fig. 7A. Note that recovery was faster in CO2/HCO3− despite the fact that total intracellular buffering power is greater than in Hepes. Data averaged from several such experiments have been plotted in Fig. 7B. Acid extrusion in CO2/HCO3− buffer (open circles; total extrusion) is consistently larger than that estimated in Hepes buffer (filled circles; NHE). The difference between these two plots gives an estimate of the pHi dependency of NBC flux. This is plotted (open squares) along with the NHE data (filled circles) in the inset to Fig. 7B. The pHi sensitivity of NHE and NBC derived in this way is very similar to that seen in Fig. 6, again consistent with NBC activity complementing that of NHE in CO2/HCO3− buffer. The results in Fig. 7 therefore support the results of the pharmacological dissection (with DMA) illustrated in Fig. 6.
Figure 7. pHi dependence of acid efflux determined without pharmacological dissection.
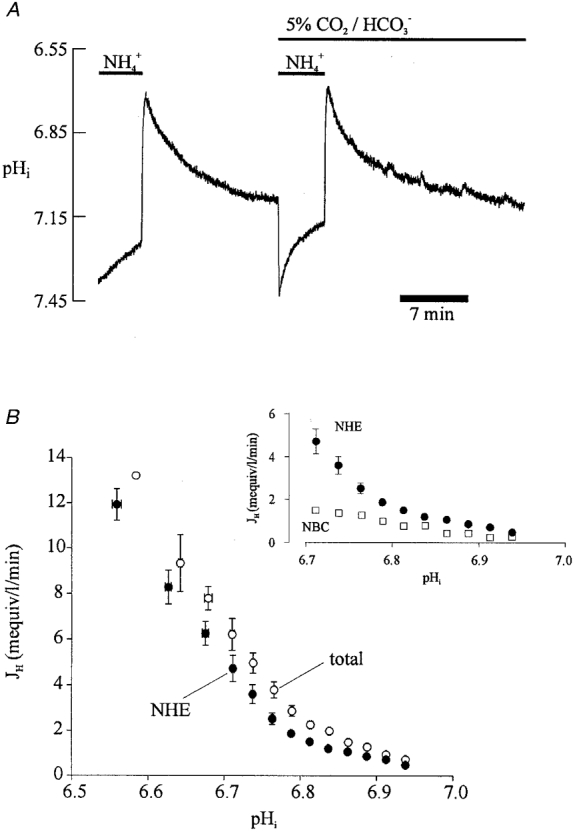
A, recovery of pHi from an intracellular acid load (15 mM ammonium prepulse) in Hepes- and CO2/HCO3−-buffered conditions. B, plot of acid efflux versus pHi derived from pHi recoveries like those shown in A, for Hepes-buffered (•, NHE activity) and CO2/HCO3− -buffered conditions (○, combined activities of NHE and NBC). Data derived from a total of 7 cells. •, buffer values averaged over successive 0.05 pHi ranges, starting with 6.55-6.60, n = 1, 3, and then averaged over successive 0.025 pHi ranges starting with 6.65-6.675, n = 11, 8, 17, 18, 24, 33, 34, 48, 58, 77, 100, 153, 203, 163, 25. ○, buffer values averaged over successive 0.05 pHi ranges starting with 6.55-6.6; n = 5, 9; and successive 0.025 pHi ranges starting with 6.65-6.675, n = 17, 11, 16, 24, 39, 52, 71, 68, 72, 88, 124, 97, 89, 98, 28. Inset to B plots as a function of pHi (□) the difference between the values for total efflux and NHE-mediated efflux (data taken, at common pHi values, from the main graph of B). This gives the pHi dependence of NBC. For comparison, the data for NHE activity are also re-plotted (•, data taken from main graph of B).
The setting of steady-state pHi: overlap between acid extrusion and loading
Resting (steady-state) pHi of the ventricular myocyte was virtually identical in Hepes and CO2/HCO3− buffer. It was 7.07 ± 0.01, n = 134 in Hepes; and 7.04 ± 0.01, n = 78 in CO2/HCO3−. Although the difference between the values is statistically significant (P < 0.05; unpaired t test), it amounts to only 0.03 pH units. The analysis of acid influx shown in Fig. 4 suggests that, at these resting pHi values, there will be a small but significant activation of CHE and also (in CO2/HCO3− buffer) of AE. This implies that there must also be a simultaneous low level of acid extrusion, or pHi would not be in a steady state. The simultaneous activity of loading and extrusion transporters at resting pHi is consistent with the previous observation (Fig. 3A and B) that, in the absence of extrusion, the acid loaders drive pHi below its resting value.
We have examined further the nature of the background acid loading that operates at the resting pHi. In Hepes buffer, background loading can be revealed by inhibiting Na+-H+ exchange, as illustrated by the experiment shown in Fig. 8A. Dimethyl amiloride (DMA) was added to block NHE, producing a slow fall of resting pHi that was reversed upon DMA washout. The middle and right-hand columns in Fig. 8B compare this acid loading (hatched column) with that measured during pHi recovery from an intracellular alkali load (open column; data gathered in the presence of the NHE inhibitor Hoe 694, 30 μM). At a pHi of 7.07 (equivalent to normal, resting pHi) the two values are identical. Since pHi recovery from an intracellular alkali load is, in Hepes, mediated by CHE (recovery is abolished almost entirely in Cl−-free solution; Leem & Vaughan-Jones, 1998b), the above result indicates that background acid loading revealed by adding DMA to a resting cell is also CHE mediated.
Figure 8. Background acid loading.

A, background acid loading (i.e. fall of pHi) revealed in Hepes-buffered solutions by adding DMA to inhibit NHE activity. B, open column, acid influx measured at pHi 7.07 in Hepes-buffered solution, estimated from pHi recovery rate from an intracellular alkali load (40 mM acetate prepulse; cf. Fig. 3A) imposed in the presence of Hoe 694 (30 μM). Hatched column, background acid loading at pHi 7.07 in Hepes-buffer, measured from the rate of fall of pHi upon addition of 30 μM DMA to resting cells (as in A). Filled column, acid influx at pHi 7.07 in CO2/HCO3−-buffered solution, measured from pHi recovery rate from an intracellular alkali load (80 mM acetate prepulse; cf. Fig. 3B) imposed in Na+-free solution (NMDG-substituted, to inhibit acid extruders). ** Significant difference, P < 0.01; N.S., not significant, P > 0.05.
The left-hand column in Fig. 8B (filled column) shows that background acid loading measured at pHi 7.07 in Na+-free, CO2/HCO3− buffer was twice that seen in Hepes. Data were taken from experiments like that shown in Fig. 3B. The Na+o was replaced by NMDG about 30 min before taking measurements so that Na+i would also have been negligible (Ellis, 1977). The absence of Na+ inhibits acid extrusion on both NHE and NBC. Since background acid loading in the isolated ventricular myocyte requires the presence of extracellular Cl− (Leem & Vaughan-Jones, 1998b), the increased rate of acid loading on adding extracellular HCO3− must have been caused by activation of the AE transporter. Thus at resting pHi in CO2/HCO3− buffer, CHE and AE must mediate background acid loading about equally. Since resting pHi in Hepes and CO2/HCO3− is essentially the same (differing by no more than 0.03), the above result implies that, in CO2/HCO3−, NHE and NBC carriers must also mediate acid extrusion about equally, in order to maintain a constant pHi. Thus, at steady-state pHi, all four acid equivalent carriers are equally active, each operating at a rate of about 0.15 mM min−1.
Plotting pHi regulation
The pHi dependence of acid flux through all four transporters has been combined on a common pHi axis in Fig. 9A (upper panel). Figure 9B (lower panel) shows the central pHi region of the plots on an expanded scale. In both panels, the points are taken from Figs 4 and 6 but, for clarity, the standard error bars have been omitted. Acid efflux (open circles, NHE; filled circles, NBC) has not been corrected for possible simultaneous acid influx activity (but see below for consideration of this). In contrast, acid influx (open triangles, CHE; filled triangles, AE) needs no correction since it was estimated in the absence of extruder activity. In the present work, acid influx was not measured at pHi values less than 7.03, but activity of CHE and AE is low at this pHi, being 0.15 mM min−1 and presumably declining to zero as pHi decreases to about 6.70, which is the estimated equilibrium pHi for both carriers (Sun et al. 1996). Indeed in past work, background acid loading at pHi 6.95 has been shown to be negligible in these cells in Hepes or CO2/HCO3− buffer (Lagadic-Gossmann et al. 1992b). At pHi < 7.03, background loading is therefore sufficiently small to have little effect on measurements of acid efflux, and so was ignored. For acid extrusion at pHi > 7.03, however, simultaneous acid influx is increasingly likely to contaminate significantly the efflux measurements. In this pHi range, acid efflux is regulated down to low levels while influx increases. The acid efflux through NHE and NBC at the resting pHi of 7.07 (0.15 mM min−1 through each carrier) has therefore been included in Fig. 9B (for convenience represented by the single open square above the pHi axis). Similarly the influx through CHE and AE at this pHi (0.15 mM min−1 through each carrier) has also been included as the single open square plotted below the pHi axis. The data shown in Fig. 9B therefore emphasize the region of overlap between efflux and influx at pHi levels close to the steady-state value.
A final point to note in Fig. 9 is that unidirectional acid extrusion at pHi > 7.2, although not plotted, must be close to zero because in this range pHi recovery rate from an alkali load is unaffected by the presence or absence of Na+ (Leem & Vaughan-Jones, 1998b).
Reconstructing pHi regulation
The pHi activation of acid loading and extrusion fluxes shown in Fig. 9 provides sufficient detail to permit a full reconstruction of pHi regulation in the ventricular myocyte. Such reconstruction is an important means of testing the accuracy of our proposed four-transporter scheme for pHi control. Some parts of the model, notably those for intracellular CO2-dependent buffering and for the kinetics of acetate prepulsing, have been published already (Leem & Vaughan-Jones, 1998a). In the present work we have selected best-fit polynomial expressions for the pHi activation of NHE, NBC, CHE and AE, derived from the data shown in Figs 4 and 6 (see dashed lines fitted to data in Fig. 9A and B). By combining these polynomial expressions with our previous computations for intracellular CO2-dependent H+ buffering, we have arrived at an integrated model of pHi regulation in the guinea-pig myocyte. In the computations, we have used the presently derived equation for intrinsic intracellular buffering (eqn (1) and Fig. 1), and we have extended the model to include details of the ammonium prepulse technique. These additions to the 1998 Leem & Vaughan-Jones model are given in the Appendix.
Figure 10A illustrates a simulation of an intracellular acidosis that activates the acid extruders. It shows, firstly, an ammonium prepulse and the subsequent NHE-mediated pHi recovery from acidosis in Hepes buffer. This is followed by a second ammonium prepulse, but in this case NHE in the model has been switched off (equivalent, experimentally, to acid loading in the presence of an NHE inhibitor such as amiloride). Note the lack of pHi recovery from the acid load. There is then a switch in the model to CO2/HCO3− buffer in order to activate NBC. This leads to the onset of a pHi recovery from acidosis that is independent of NHE. The simulation in Fig. 10A should be compared with the original experimental trace shown in Fig. 10B.
Figure 10. Modelling intracellular pH regulation: dual acid extrusion.
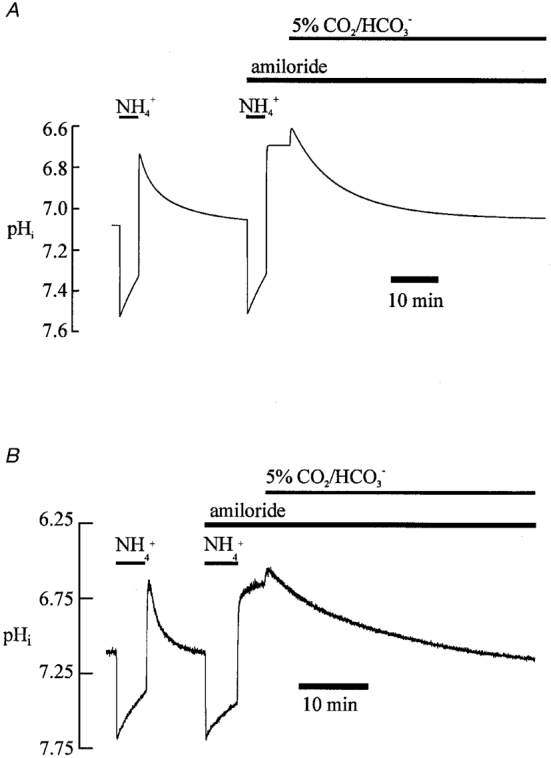
A, results of the modelling. Initially NBC and AE fluxes are switched off in the model while βtot is set to equal βi (simulating CO2-free conditions). Following the second (15 mM) ammonium prepulse, NHE activity in the model is switched off, thus simulating the addition of amiloride. In the final part of the simulation, CO2/HCO3− buffer conditions are initiated in the model, thus mimicking the addition of 5 % CO2. Intracellular buffering is now assumed to include contributions from the time-dependent CO2/HCO3− buffer system. The NBC and AE transporters are also switched on in the model. B, specimen record; this shows, for comparison, the experimental trace (taken from Fig. 5A) that has a protocol similar to that in the modelling shown in A.
Figure 11A shows a simulation of an intracellular alkalosis that activates the acid loading transporters. The first part of the trace simulates an acetate prepulse in CO2/HCO3− buffer. This is followed by a rapid recovery from alkalosis. The recovery is attributable firstly to slow CO2-dependent intracellular buffering and secondly to acid influx activity on CHE and AE. The simulated addition of DIDS (which inhibits AE and NBC activity; these carriers are thus switched off in the model) reduces the rate of acidification observed during the slow phase of recovery from the alkali load. Finally, a switch from CO2/HCO3− to Hepes buffer is simulated. This produces initially a large intracellular alkalosis caused through the loss of intracellular CO2, followed by a pHi recovery from alkalosis due to stimulation of acid influx (base efflux) on the CHE transporter. The simulation in Fig. 11A should be compared with the specimen experimental trace shown in Fig. 11B.
Figure 11. Modelling intracellular pH regulation: dual acid loading.
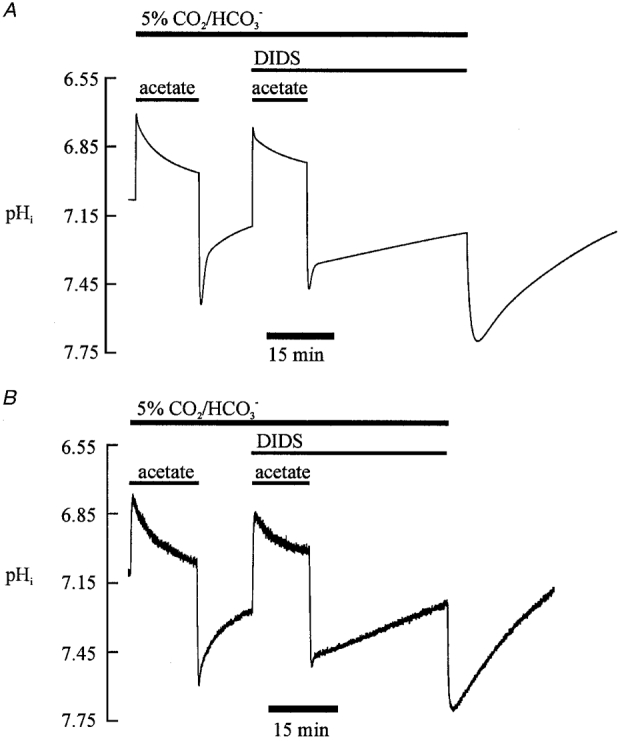
A, results of the modelling. The first part of the trace is modelled for 5 % CO2/HCO3−-buffered conditions (pHo 7.40), showing the addition and subsequent removal of (80 mM) extracellular acetate. A second acetate prepulse (80 mM) was modelled while simultaneously switching off AE and NBC activity (equivalent to adding the drug DIDS). Finally, withdrawal of 5 % CO2/HCO3− buffer (constant pHo of 7.40) is simulated by setting PCO2 to zero in the model and switching off AE and NBC activity. B, for comparison, a specimen experimental recording of pHi is shown with a protocol similar to that modelled in A. The dose of DIDS applied was 0.1 mM. The acetate applications were made at a concentration of 80 mM.
DISCUSSION
The present work characterizes the pHi dependence of acid-equivalent flux through the four sarcolemmal transporters responsible for pHi regulation in the cardiac cell. While pHi dependence for NHE has been characterized for various cardiac preparations (e.g. Lazdunski et al. 1985; Vaughan-Jones & Wu, 1990b), full kinetic analyses for guinea-pig ventricular NHE, NBC, AE and CHE have not so far been presented. All four pHi activation curves have now been determined experimentally and, in combination with new data on intrinsic and CO2-dependent buffering power, have been integrated into a computational model of intracellular pH regulation. This is the first full model of pHi regulation in heart although results of an earlier and simpler version have recently been presented, based on experimental data culled from the present work (Ch'en et al. 1998). A quantitative model of pHi control was first formulated over 20 years ago for another cell type, the squid giant axon, by Boron & de Weer (1976). Their model incorporated a single acid-equivalent transporter (an acid extruder), but while the issue of slow CO2-dependent buffering was alluded to, it was not specifically addressed. The present scheme is therefore the first to incorporate multiple efflux-influx transporters plus time-dependent buffering. By using this approach we are able to predict with reasonable accuracy the pHi transients following intracellular acid and alkali loads, both in the presence and absence of CO2/HCO3− buffer.
Acid influx transporters
AE and CHE
The two transporters display very different sensitivities to intracellular pH. The AE carrier (Cl−-HCO3− exchange) shows a modest increase in activity in the pHi range up to 7.15, but above this value it activates steeply with pHi. In contrast, the CHE carrier (Cl−-OH− exchange) displays a modest, near-linear increase in activity over the whole pHi range tested, from 7.05 to 7.50. These considerable differences in pHi activation of AE and CHE reinforce previous evidence for the existence of a dual acid loading system in the cardiomyocyte.
AE activation
The steep activation of AE at pHi > 7.15 (Fig. 4) is comparable to that reported recently by Xu & Spitzer (1994) for the ventricular myocyte. In the latter work the activation was fitted most simply by a linear function whereas the present pHi dependence is clearly curvilinear. Saturation of AE activity at high pHi has not yet been seen but Leem & Vaughan-Jones (1998a,b) have pointed out the danger of analysing acid fluxes at high pHi immediately following a weak acid prepulse (when CO2/HCO3− buffering is out of equilibrium for 2-3 min). In the present work this has limited our assessment of AE activity to a maximum pHi of 7.35 (Fig. 4). We therefore do not exclude flux saturation at higher pHi values.
The cause of the steep activation of cardiac AE by pHi is not known but it is unlikely to be due simply to increased binding of bicarbonate to the internal transport site. At constant PCO2 (5 %), raising pHi from 7.05 to 7.35 (at CO2/HCO3− equilibrium) increases intracellular HCO3− concentration by about twofold (from 9.3 to 19.6 mM). Assuming an AE transport stoichiometry of 1 HCO3− : 1 Cl− this would, at most, double bicarbonate efflux, provided there were non-saturating, first-order kinetics at the HCO3− binding site. In reality, net efflux of HCO3− through AE increases by twelvefold in this pHi range (see Fig. 4). The simplest explanation for this is that HCO3− efflux is regulated allosterically by pHi or even by intracellular HCO3− (in addition to HCO3− binding to the transport site). In this case, AE activation would be triggered by deprotonation and/or by binding of bicarbonate to an intracellular modifier site. Evidence for a deprotonation model has emerged recently from site-directed mutagenesis of cDNA of AE-1 and AE-2 isoforms (Sekler et al. 1995; Zhang et al. 1996).
Physiological roles for AE and CHE
Both carriers assist pHi regulation during intracellular alkalosis (Leem & Vaughan-Jones, 1998b) and both contribute significantly to the sensitivity of pHi to a fall of pHo (Sun et al. 1996). Moreover, as discussed below, both are activated equally at the resting pHi. Nevertheless, the steeper pHi sensitivity of AE indicates that it is the major system for protecting pHi from alkali overload.
An additional physiological role for cardiac anion exchangers is in the control of intracellular Cl− (Vaughan-Jones, 1979, 1986). Both the AE and CHE transporters will mediate Cl− uptake. It is notable that a DIDS-insensitive, Na+-independent Cl− uptake system has been described recently in both cardiac and smooth muscle (Chipperfield et al. 1997), in addition to uptake via Cl−-HCO3− exchange and the Na+-K+-2Cl− cotransporter. A candidate for this novel Cl− transporter may therefore be CHE.
Molecular identity of acid loading
We have previously suggested (Sun et al. 1996) that CHE may be an AE-related protein. A similar suggestion has been made for a CHE-like transporter in intestinal epithelial tissue (Alvarado & Vasseur, 1996) although in this latter case the carrier is described as a H+-Cl− cotransporter rather than a Cl−-OH− exchanger. Whichever ion species is involved (H+ or OH−), an AE protein that reproduced wild-type CHE activity in the cardiac cell would have to fulfil the conditions of transporting OH− (or H+) in preference to bicarbonate, and of being relatively insensitive to DIDS (Leem & Vaughan-Jones, 1998b), combined properties that have yet to be demonstrated for any AE isoform. As for the AE isoform responsible for functional Cl−-HCO3− exchange in heart, a strong candidate must be AE-3b or 3c (Yannoukakos et al. 1994) although Puceat et al. (1995) have suggested that, in the adult rat ventricular myocyte, it is AE-1 and that AE-3 may serve a structural rather than a pHi regulatory role.
Acid efflux transporters
NHE and NBC
Both transporters are active at resting pHi and are activated further by a fall of pHi. It is clear, however, that the greater activation occurs on NHE once pHi has fallen below 6.90. Over the pHi range tested (7.03-6.55, a fall of about 0.5 units) NHE activity increases 30-fold. Such steep activation is consistent with previous work on this carrier, which displays positive allosteric stimulation by intracellular H+ once pHi dips below typical resting values (Aronson, 1985; Vaughan-Jones & Wu, 1990b). In contrast, activity of NBC activates roughly linearly with decreasing pHi. Whether allosteric stimulation is involved here is not known.
It is notable that for relatively modest acid loads (i.e. to pHi 6.90), both NHE and NBC are stimulated about equally (Fig. 6). Thus, at pHi values within the normal physiological range, both carriers are equally important for mediating acid extrusion.
Molecular identity of acid extrusion
While the functional NHE isoform in heart is known to be NHE-1 (Scholz et al. 1995; Fliegel & Dyck, 1995; Loh et al. 1996), the molecular identity of the cardiac NBC carrier is not known. A renal Na+-HCO3− cotransport (labelled NBC-1) has recently been cloned and expressed from salamander, rat and human (Romero et al. 1997, 1998; Burnham et al. 1997, 1998). It is possible that mammalian cardiac NBC is related to this, especially since mRNA fragments of renal NBC-1 have been provisionally identified in cardiac tissue. The functional properties of renal and cardiac NBC seem very different since the former is an acid loader and the latter an acid extruder. This need not, however, imply greatly different molecular structures. Functional differences could result from differences in Na:HCO3− transport stoichiometry influencing the equilibrium pHi of the carrier and hence its direction of operation across the surface membrane. For example, renal NBC-1 has a (probable) equivalent stoichiometry (n) of 3 HCO3−:1 Na+ (i.e. n = 3; Romero et al. 1997) and thus a low equilibrium pHi (about 6.0), biasing it in favour of acid loading under physiological conditions. In contrast, cardiac NBC was originally suggested to have a stoichiometry ranging between n = 1 and n = 2 (Lagadic-Gossmann et al. 1992a) and thus a higher equilibrium pHi which, under most conditions, would favour acid extrusion (i.e. HCO3− ion influx). A stoichiometry of n = 2 has been proposed recently for cardiac NBC in cat papillary muscle and the rat ventricular myocyte (Camilion de Hurtado et al. 1995; Aiello et al. 1998), where it is suggested that NBC activity is both electrogenic and voltage dependent. It should be noted that the assumption of an electrogenic (n = 2) or electroneutral (n = 1) NBC stoichiometry would not alter the pHi dependence of acid efflux through NBC reported in the present work (Fig. 6) as this was determined simply from changes in pHi recovery rate.
The setting of steady-state pHi
When pHi is in a steady state, all four acid transporters are activated to the same extent. This implies that physiological changes in resting pHi may be achieved by modulation of the activity of any or all of the carriers. Sarcolemmal receptor-activated modulation has been reported variously for NHE, NBC and AE in cardiac cells (e.g. Lagadic-Gossmann et al. 1992b;Desilets et al. 1994; Matsui et al. 1995), but it is not known if CHE is also receptor coupled.
‘Permissive range’ of pHi control
The activity of the four transporters (Fig. 9A) is regulated down to low levels in the pHi range 6.95-7.25. Outside these limits, net acid-equivalent flux activates steeply, thus safeguarding the cell from extreme acidosis or alkalosis. In the central pHi region (6.95 to 7.25), however, the low transporter fluxes mean that small acid/base loads or small shifts in the pHi sensitivity of an individual acid/base transporter will relatively easily produce displacements of pHi. The central region (Fig. 9A and B) may therefore represent a permissive range within which small pHi displacements are tolerated, at least transiently. Such an arrangement could provide a control system that permits some forms of pHi signalling in the cardiac cell while still, in the longer term, overseeing pHi regulation. It is notable, for example, that a number of cardioactive hormones and neurotransmitters, such as catecholamines (Lagadic-Gossmann et al. 1992b;Desilets et al. 1994), angiotensin (Matsui, et al. 1995) and endothelin (Wu & Tseng, 1993) trigger changes of pHi within the permissive range that may be of functional importance.
Intracellular buffering
The present work provides a comprehensive examination of intracellular buffering power in the ventricular myocyte. A convenient fit to the pHi dependence of intrinsic buffering (Fig. 1B) could be achieved by assuming two main intracellular buffers of differing concentration and pKa (pK values of 6.03 and 7.57). The identity of the two putative buffers is not known, although intracellular histidine residues may contribute to the higher pK, while intracellular ATP and inorganic phosphate may contribute to the lower pK. The possibility remains that the results actually represent the effects of several rather than just two intracellular buffer moieties with a whole range of overlapping pK values. Whatever the mechanism of intrinsic buffering, its high power at low extremes of pHi presents powerful protection against acute intracellular acid overload, a feature also complemented by the steep activation of NHE in this pHi range.
An important finding in the present work is that CO2-dependent intracellular buffering is readily demonstrable in the ventricular myocyte. Moreover, this component of buffering conforms quantitatively to that expected for a cell fully open to CO2. Although such buffering has now been observed in several cell types (Thomas, 1976; Zhao et al. 1995; Leem & Vaughan-Jones, 1998a), there are some notable and puzzling reports of little or no CO2-dependent buffering in other cells such as those of vascular smooth muscle (Baro et al. 1989; Aickin, 1994) and mammalian CNS neurones (Amos et al. 1996). Possible causes of the lack of detection of CO2 buffering in these latter cell types have been discussed by Leem & Vaughan-Jones (1998a).
Model of intracellular pH regulation
The model (Figs 10 and 11) predicts the features of pHi regulation in the cardiac myocyte remarkably well including the presence of significant HCO3−-dependent and HCO3−-independent mechanisms for recovery of pHi from acid and alkali loads. The model also predicts the presence of fast and slow phases of pHi recovery from an alkali load although in some experiments (e.g. Fig. 11B) the fast phase (largely due to CO2-dependent buffering, Leem & Vaughan-Jones, 1998a) is less pronounced than in the model (Fig. 11A). In other experiments, however, clear ‘fast phase’ followed by ‘slow phase’ recoveries are evident (see e.g. Fig. 3B of present paper, and see Figs 2, 5 and 7 of Leem & Vaughan-Jones, 1998b). Some differences between experiment and simulation can be seen in the time course of pHi recovery from an acid as well as an alkali load (Fig. 10). These temporal discrepancies most likely occur because averaged data have been used in the model so that an exact match with any individual experiment cannot be expected. What is encouraging, however, is that the principal features of cardiac pHi control are reproduced so well and that the overall predicted time course of control is reasonable.
Another important feature of both the model and the experimental results is that the pHi dependency of the four types of transporter is the key factor in determining steady-state pHi. It might have been argued, for example, that other mechanisms contribute to the ‘background acid loading’ of the cell and therefore to the setting of resting pHi. Such mechanisms could be the metabolic production of acid within the cell (cf. Bountra et al. 1988) or an influx of acid on other carriers such as sarcolemmal Ca2+-H+-ATPase (Naderali et al. 1997). These possibilities are unlikely to have played a significant role since pHi recovery from intracellular alkalosis is virtually absent in Cl−-free solution, i.e. background loading is Cl−o dependent (Leem & Vaughan-Jones, 1998b), consistent with contributions from CHE and AE.
Similar model for all mammalian cardiac cells?
It seems probable that the four-transporter model will account for pHi regulation in cardiac cells from mammalian species other than guinea-pig, as well as in non-ventricular types of cardiac cell, such as atrial and Purkinje cells, although the levels of functional expression of each transporter may be expected to vary regionally and developmentally. NHE has been identified in all cardiac cells examined to date. NBC has been positively identified in guinea-pig (Lagadic-Gossmann et al. 1992a), rat (Le Prigent et al. 1997) and cat (Camilion de Hurtado et al. 1995) as well as, originally, in the sheep Purkinje fibre (Dart & Vaughan-Jones, 1992). AE activity was first described in the sheep Purkinje fibre (Vaughan-Jones, 1979, 1986) and has since been identified in ventricular cells of guinea-pig and rat (Lagadic-Gossmann et al. 1992a;Xu & Spitzer, 1994). CHE activity has so far been investigated only in ventricular cells of guinea-pig and rat (e.g. Sun et al. 1996; Leem & Vaughan-Jones, 1998b).
Future refinements to the model
Important features that are currently absent from the present model and which must be incorporated once suitable experimental data become available are the overall sensitivity of the integrated pHi control system to extracellular pH, and its sensitivity to extracellular agonists such as hormones and neurotransmitters. A preliminary coupling of pHi control to other cardiac cellular models of excitation and contraction has already been undertaken (Ch'en et al. 1998), and is providing insight into the role of acid-equivalent transporters in generating inotropic and arrhythmogenic patterns of behaviour in the myocardium.
Acknowledgments
We thank Anna Clark for her excellent technical assistance and for helping to prepare the illustrations. This work was funded by a grant to R. D. V.-J. from the British Heart Foundation and in part by a grant to CHL from the Ministry of Science and Technology, Korea
APPENDIX
Modelling pHi regulation
Results of the modelling are shown in Figs 10 and 11. The model includes the ammonium- and acetate-prepulse techniques, used for inducing intracellular acid and base loads, respectively. These techniques have been modelled using a general approach similar to that adopted by Boron & de Weer (1976). The present model also contains formulations for intracellular intrinsic and CO2-dependent buffering and for the pHi dependence of transporter activity (NHE, NBC, AE and CHE). Our modelling of the acetate prepulse and of CO2-dependent buffering has been presented previously (Leem & Vaughan-Jones, 1998a) and so is reproduced here only briefly.
pHi recovery from an acid load
Ammonium prepulse technique
We make the following assumptions. (i) The stability constant for ammonium ions is the same inside and outside the myocyte. (ii) NH3 diffuses readily through the lipid sarcolemmal phase (in accordance with Fick's Law; eqn (1)) whereas, for NH4+, there is a low constant field channel conductance (eqn (2)). (iii) The apparent intracellular pKa for CO2/HCO3− is the same as in extracellular Tyrode solution (i.e. 6.12; see Table 1). (iv) Except for the CO2 hydration reaction, all other reactions are instantaneous. (v) There is no membrane conductance for H+, OH− or HCO3− (note that pHi in cardiomyocytes is voltage independent, arguing for low conductances for these ions; Lagadic-Gossmann et al. 1992a,b;Sun et al. 1996).
Table 1.
Parameters used in the simulations
| Parameter | Value | Reference |
|---|---|---|
| Myocyte volume | 28 148 × 10−12 cm3 | Campbell et al. 1987 |
| Myocyte surface-area/volume ratio | 2017 cm−1 | Leem & Vaughan-Jones, 1998a |
| Non-ionized acetate permeability (PHA) | 1.44 × 10⁻³ cm s−1 | Klocke et al. 1972 |
| Ionized acetate permeability (PA−) * | 6.77 × 10⁻⁹ cm s−1 | — |
| NH3 permeability (PNH3) | 1.08 × 10⁻² cm s−1 | Klocke et al. 1972 |
| NH4+ permeability (PNH4+) † | 1.408 × 10⁻² cm s−1 | — |
| CO2 permeability | 0.58 cm s−1 | Forster, 1969 |
| Ionization constant of acetate | 10−4.528 | Harned & Hickey, 1937 |
| Ionization constant of ammonium | 10−9.03 | Klocke et al. 1972 |
| Equilibrium constant of CO2 | reaction 10−6.12 | Leem & Vaughan-Jones, 1998a |
| CO2 hydration rate constant | 0.365 | Leem & Vaughan-Jones, 1998a |
We calculated this value from the constant field equation, on the arbitrary assumption that acetate ion current is 5 pA at a resting membrane potential of −80 mV and [A−]i and [A−]o are 0.03 mol and 0.08 mol, respectively. This anion current is lower than that assumed in earlier modelling (50 pA, Leem & Vaughan-Jones, 1998a) but is still within an acceptable range for cardiac cells.
We calculated this value from the constant field equation, on the arbitrary assumption that the ammonium ion current is 20 pA at a resting membrane potential of −80 mV with 0 mm [NH4+]i and 5 mm [NH4+]o. This is a reasonable assumption since ammonium can act as a Congener for K+ channels.
Upon adding an extracellular ammonium salt, the influx of NH3 (MNH3) is given by:
| (A1) |
The influx of NH4+ ions (MNH4+) is given by:
| (A2) |
where PNH3 and PNH4+ are permeability coefficients for each form; Vm is the membrane potential; ε represents exp(-VmF/RT); and F, R, and T have their usual meanings. Upon withdrawal of the extracellular ammonium salt, NH3 efflux will acidify the cell. Note that any simultaneous efflux of NH4+ (MNH4+) will blunt this acidification. The net rate of intracellular proton addition (dQH+/dt) due to the combined effluxes MNH3 and MNH4+ is given by:
| (A3) |
where α=[H+]i/([H+]i+K), ρ is the area/volume ratio of the cell, and K is the dissociation constant of NH4+.
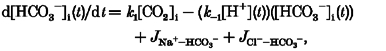
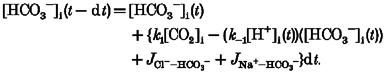
In the presence of a constant PCO2, rapid changes of pHi caused by ammonium prepulsing may transiently drive the intracellular CO2/HCO3− buffer system out of equilibrium. Re-equilibration of this buffer leads to a change of intracellular H+ and HCO3−. This is given by (see Leem & Vaughan-Jones, 1998a):
| (A4) |
where k1 and k-1 are the combined forward and backward rate constants, respectively, for the hydration of CO2 to HCO3− and H+.
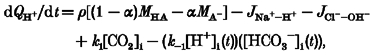
Intracellular changes of [H+] will also occur due to the activity of sarcolemmal carriers. The net intracellular proton addition during ammonium withdrawal in the presence of transporter activity is given by:
| (A5) |
 |
(A6) |
where JNa+-H+, JNa+-HCO3−, JCl−-OH− and JCl−-HCO3− are, respectively, the acid-equivalent fluxes through the four sarcolemmal transporters at a given level of pHi. Complete formulations for the pHi dependence of transporter flux are given below. Note that the AE and NBC transporters produce bicarbonate rather than H+ or OH− fluxes. These fluxes are taken from the pHi activation of acid-equivalent flux plotted in Figs 4 (for AE) and 6 (for NBC), determined when intracellular CO2/HCO3− buffer was at equilibrium, assuming that bicarbonate flux = acid-equivalent flux.
Combining eqns (A4) and (A5) gives the rate of recovery of pHi from an intracellular acid load:
| (A7) |
where βi is the intracellular intrinsic buffering power, given by (see Results):
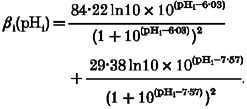 |
(A8) |
Since differential eqn (A7) cannot be solved for pHi, numerical methods are used. We calculate the time course of pHi changes as:
| (A9) |
where:
| (A10) |
and where:
 |
(A11) |
CO2 addition and removal
In the case where PCO2 is changed, the following relationships are valid:
| (A12) |
where PCO2 is the membrane permeability coefficient for CO2 and:
| (A13) |
The procedure for determining the time course of pHi change caused by CO2 removal is the same as that used in the ammonium prepulse simulations (eqns (A9), (A10), (A11)), except that dQH+ (the change in intracellular proton equivalents) is given by:
| (A14) |
When simulating pHi regulation in Hepes-buffered (CO2-free) conditions, the flux components JNa+-HCO3− and JCl−-HCO3− are set to zero. When simulating the addition of a specific transport inhibitor drug, the relevant transporter flux is set to zero.
pHi recovery from an alkali load
Acetate prepulse technique
Here, the basic assumptions are the same as for simulating the ammonium prepulse technique. (i) The stability constant for acetate ions is the same inside and outside the myocyte. (ii) Non-ionized acetic acid diffuses readily through the lipid sarcolemmal phase (in accordance with Fick's Law, eqn (A15)) whereas, for the acetate anion, there is a low constant field channel conductance (eqn (A16)).
Upon adding extracellular acetate, the influx of undissociated acetate (HA) is given by:
| (A15) |
The influx of acetate ions (A−) is given by:
| (A16) |
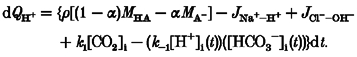
where MHA and MA− represent the net inward fluxes of each form; PHA and PA− are permeability coefficients for each form. The net rate of intracellular proton depletion (-dQH+/dt) due to the combined influxes MA− and MHA is:
| (A17) |
where α=[H+]i/([H+]i+ K) and K is the dissociation constant of acetic acid.
In addition to any weak acid transport, the intracellular proton change due to sarcolemmal transporter activity is as follows:
 |
(A18) |
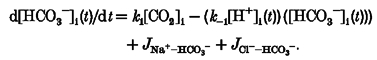 |
(A19) |
The procedure for calculating the time course of pHi change induced by the acetate prepulse technique is the same as that used in the ammonium prepulse simulation (eqns (A9), (A10), (A11)) except that the change of intracellular proton equivalents (dQH+) is given by:
 |
(A20) |
Flux equations for the sarcolemmal transporters
We fitted the flux data plotted for each sarcolemmal transporter in Figs 4 and 6 by using polynomial equations. The fits to the data are illustrated by the dashed lines in Fig. 9. The best fit flux equations are as follows:
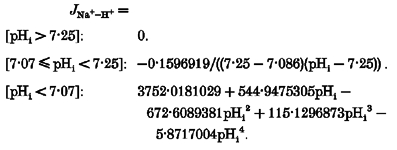 |
 |
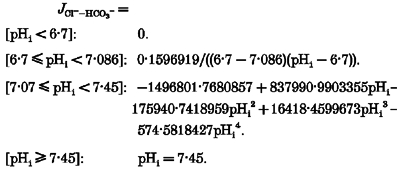 |
 |
All acid-equivalent influx (i.e. on AE and CHE) is assumed to be zero at pHi 6.70 (this is the estimated equilibrium pHi for these transporters; Sun et al. 1996) and assumed to remain zero at lower pHi values. All acid-equivalent efflux (i.e. on NHE and NBC) is assumed to be zero at pHi values higher than 7.25 (Leem & Vaughan-Jones, 1998b). For convenience, it is assumed that acid-equivalent influx on AE and on CHE declines linearly from pHi 7.07 (the value of resting pHi), to zero at pHi 6.70, while acid-equivalent efflux on NHE and on NBC is assumed to decline linearly from pHi 7.07 to zero at pHi 7.25. Finally, in the absence of any experimental data for AE and CHE activity at very high pHi we have, for convenience, assumed saturation of AE flux at pHi > 7.45 and of CHE flux at pHi > 7.55.
References
- Aickin CC. Regulation of intracellular pH in smooth muscle of guinea-pig ureter: bicarbonate dependence. The Journal of Physiology. 1994;479:301–316. doi: 10.1113/jphysiol.1994.sp020297. [DOI] [PMC free article] [PubMed] [Google Scholar]
- Aiello EA, Vila Petrof MG, Mattiazzi AR, Cingolani HE. Evidence for electrogenic Na+-HCO3− symport in rat cardiac myocytes. The Journal of Physiology. 1998;512:137–148. doi: 10.1111/j.1469-7793.1998.137bf.x. [DOI] [PMC free article] [PubMed] [Google Scholar]
- Alvarado F, Vasseur M. Theoretical and experimental discrimination between Cl−-H+ symporters and Cl−/OH− antiporters. American Journal of Physiology. 1996;271:C1612–1628. doi: 10.1152/ajpcell.1996.271.5.C1612. [DOI] [PubMed] [Google Scholar]
- Amos BJ, Pocock G, Richards CD. On the role of bicarbonate as a hydrogen ion buffer in rat CNS neurones. Experimental Physiology. 1996;81:623–632. doi: 10.1113/expphysiol.1996.sp003963. [DOI] [PubMed] [Google Scholar]
- Aronson PS. Kinetic properties of the plasma membrane Na+-H+ exchanger. Annual Review of Physiology. 1985;47:545–560. doi: 10.1146/annurev.ph.47.030185.002553. [DOI] [PubMed] [Google Scholar]
- Baro I, Eisner DA, Raimbach SJ, Wray S. Intracellular pH regulation and buffering power in single, isolated vascular and intestinal smooth muscle cells. The Journal of Physiology. 1989;417:161. P. [Google Scholar]
- Boron WF, de Weer P. Intracellular pH transients in squid giant axons caused by CO2, NH3 and metabolic inhibitors. Journal of General Physiology. 1976;67:91–112. doi: 10.1085/jgp.67.1.91. [DOI] [PMC free article] [PubMed] [Google Scholar]
- Bountra C, Kaila K, Vaughan-Jones RD. Mechanism of rate dependent pH changes in the sheep cardiac Purkinje fibre. The Journal of Physiology. 1988;406:483–501. doi: 10.1113/jphysiol.1988.sp017392. [DOI] [PMC free article] [PubMed] [Google Scholar]
- Buckler KJ, Vaughan-Jones RD. Application of a new pH-sensitive fluoroprobe (carboxy SNARF-1) for intracellular pH-measurement in small isolated cells. Pflügers Archiv. 1990;417:234–239. doi: 10.1007/BF00370705. [DOI] [PubMed] [Google Scholar]
- Burnham CE, Amlal H, Wang Z, Shull GE, Soleimani M. Cloning and functional expression of a human kidney Na+-HCO3− cotransporter. Journal of Biological Chemistry. 1997;272:19111–19114. doi: 10.1074/jbc.272.31.19111. [DOI] [PubMed] [Google Scholar]
- Burnham CE, Flagella M, Wang Z, Amlal H, Shull G, Soleimani M. Cloning, renal distribution, and regulation of the rat Na+-HCO3− cotransporter. American Journal of Physiology. 1998;274:F1119–1126. doi: 10.1152/ajprenal.1998.274.6.F1119. [DOI] [PubMed] [Google Scholar]
- Camilion de Hurtado MC, Perez NG, Cingolani HE. An electrogenic sodium-bicarbonate cotransport in the regulation of myocardial intracellular pH. Journal of Molecular and Cellular Cardiology. 1995;27:231–242. [PubMed] [Google Scholar]
- Campbell SE, Cerdes AM, Smith TD. Comparison of regional differences in cardiac myocyte dimensions in rats, hamsters, and guinea-pig. Anatomical Record. 1987;219:53–59. doi: 10.1002/ar.1092190110. [DOI] [PubMed] [Google Scholar]
- Ch'en FF-T, Vaughan-Jones RD, Clarke K, Noble D. Modelling myocardial ischaemia and reperfusion. Progress in Biophysics and Molecular Biology. 1998;69:515–537. doi: 10.1016/s0079-6107(98)00023-6. [DOI] [PubMed] [Google Scholar]
- Chipperfield AR, Davis JP, Harper AA. Sodium-independent inward chloride pumping in rat cardiac ventricular cells. American Journal of Physiology. 1997;272:H735–739. doi: 10.1152/ajpheart.1997.272.2.H735. [DOI] [PubMed] [Google Scholar]
- Dart C, Vaughan-Jones RD. Na+-HCO3− cotransport in the sheep cardiac Purkinje fibre. The Journal of Physiology. 1992;451:365–385. doi: 10.1113/jphysiol.1992.sp019169. [DOI] [PMC free article] [PubMed] [Google Scholar]
- Desilets M, Puceat M, Vassort G. Chloride dependence of pH modulation by β-adrenergic agonist in rat cardiomyocytes. Circulation Research. 1994;75:862–86. doi: 10.1161/01.res.75.5.862. [DOI] [PubMed] [Google Scholar]
- Eisner DA, Kenning NA, O'Neill SC, Pocock G, Richards CD, Valdeolmillos M. A novel method for absolute calibration of intracellular pH indicators. Pflügers Archiv. 1989;413:553–558. doi: 10.1007/BF00594188. [DOI] [PubMed] [Google Scholar]
- Ellis D. The effects of external cations and ouabain on the intracellular sodium activity of sheep heart Purkinje fibres. The Journal of Physiology. 1977;273:211–240. doi: 10.1113/jphysiol.1977.sp012090. [DOI] [PMC free article] [PubMed] [Google Scholar]
- Fliegel L, Dyck JR. Molecular biology of the cardiac sodium/hydrogen exchanger. Cardiovascular Research. 1995;29:155–159. [PubMed] [Google Scholar]
- Forster RE. The rate of CO2 equilibration between red cells and plasma. In: Forster RE, Edsall JT, Otis AB, Roughton FJW, editors. CO2: Chemical, Biochemical and Physiological Aspects. Washington, DC: NASA; 1969. pp. 275–286. SP-188. [Google Scholar]
- Harned HS, Hickey FC. The ionisation of acetic acid in aqueous sodium chloride solutions from 0 to 40 °. Journal of the American Chemical Society. 1937;59:1284–1288. [Google Scholar]
- Klocke RA, Anderson KK, Rotman HH, Forster RE. Permeability of human erythrocytes to ammonia and weak acids. American Journal of Physiology. 1972;222:1004–1013. doi: 10.1152/ajplegacy.1972.222.4.1004. [DOI] [PubMed] [Google Scholar]
- Lagadic-Gossmann D, Buckler KJ, Vaughan-Jones RD. Role of bicarbonate in pH recovery from intracellular acidosis in the guinea-pig ventricular myocyte. The Journal of Physiology. 1992a;458:361–384. doi: 10.1113/jphysiol.1992.sp019422. [DOI] [PMC free article] [PubMed] [Google Scholar]
- Lagadic-Gossmann D, Vaughan-Jones RD, Buckler KJ. Adrenaline and extracellular ATP switch between two modes of acid extrusion in the guinea-pig ventricular myocyte. The Journal of Physiology. 1992b;458:385–407. doi: 10.1113/jphysiol.1992.sp019423. [DOI] [PMC free article] [PubMed] [Google Scholar]
- Lazdunski M, Frelin C, Vigne P. The sodium/hydrogen exchange system in cardiac cells: its biochemical and pharmacological properties and its role in regulating internal concentrations of sodium and internal pH. Journal of Molecular and Cellular Cardiology. 1985;17:1029–42. doi: 10.1016/s0022-2828(85)80119-x. [DOI] [PubMed] [Google Scholar]
- Leem C-H, Vaughan-Jones RD. The setting of steady-state pHi in the guinea-pig ventricular myocyte. The Journal of Physiology. 1996;497.P:49–50P. [Google Scholar]
- Leem C-H, Vaughan-Jones RD. Out-of-equilibrium pH transients in the guinea-pig ventricular myocyte. The Journal of Physiology. 1998a;509:471–485. doi: 10.1111/j.1469-7793.1998.471bn.x. [DOI] [PMC free article] [PubMed] [Google Scholar]
- Leem C-H, Vaughan-Jones RD. Sarcolemmal mechanisms for pHi-recovery from alkalosis in the guinea-pig ventricular myocyte. The Journal of Physiology. 1998b;509:487–496. doi: 10.1111/j.1469-7793.1998.487bn.x. [DOI] [PMC free article] [PubMed] [Google Scholar]
- Le Prigent K, Lagadic-Gossmann D, Mongodin E, Feuvray D. HCO3−-dependent alkalinizing transporter in adult rat ventricular myocytes: characterization and modulation. American Journal of Physiology. 1997;273:H2596–2603. doi: 10.1152/ajpheart.1997.273.6.H2596. [DOI] [PubMed] [Google Scholar]
- Loh S-H, Sun B, Vaughan-Jones RD. Effect of Hoe 694, a novel Na+-H+exchange inhibitor, on intracellular pH regulation in the guinea-pig ventricular myocyte. British Journal of Pharmacology. 1996;118:1905–1912. doi: 10.1111/j.1476-5381.1996.tb15623.x. [DOI] [PMC free article] [PubMed] [Google Scholar]
- Matsui H, Barry WH, Livsey C, Spitzer KW. Angiotensin II stimulates sodium-hydrogen exchange in adult rabbit ventricular myocytes. Cardiovascular Research. 1995;29:215–221. [PubMed] [Google Scholar]
- Naderali EK, Buttell N, Taggart MJ, Bullock AJ, Eisner DA, Wray S. The role of the sarcolemmal Ca2+-ATPase in the pH transients associated with contraction in rat smooth muscle. The Journal of Physiology. 1997;505:329–336. doi: 10.1111/j.1469-7793.1997.329bb.x. [DOI] [PMC free article] [PubMed] [Google Scholar]
- Puceat M, Korichneva I, Cassoly R, Vassort G. Identification of band 3-like proteins and Cl−/HCO3− exchange in isolated cardiomyocytes. Journal of Biological Chemistry. 1995;270:1315–1322. doi: 10.1074/jbc.270.3.1315. [DOI] [PubMed] [Google Scholar]
- Romero MF, Fong P, Berger UV, Hediger MA, Boron WF. Cloning and functional expression of rNBC, an electrogenic Na+-HCO3− cotransporter from rat kidney. American Journal of Physiology. 1998;274:F425–432. doi: 10.1152/ajprenal.1998.274.2.F425. [DOI] [PubMed] [Google Scholar]
- Romero MF, Hediger MA, Boulpaep EL, Boron WF. Expression cloning and characterisation of a renal electrogenic Na+/HCO3− cotransporter. Nature. 1997;387:409–413. doi: 10.1038/387409a0. [DOI] [PubMed] [Google Scholar]
- Roos A, Boron WF. Intracellular pH. Physiological Reviews. 1981;61:296–434. doi: 10.1152/physrev.1981.61.2.296. [DOI] [PubMed] [Google Scholar]
- Scholz W, Albus U, Lang HJ, Martorana PA, Englert HC, Scholkens BA. Hoe 694, a new Na+/H+ exchange inhibitor and its effects in cardiac ischaemia. British Journal of Pharmacology. 1993;109:562–568. doi: 10.1111/j.1476-5381.1993.tb13607.x. [DOI] [PMC free article] [PubMed] [Google Scholar]
- Sekler I, Lo RS, Kopito RR. A conserved glutamate is responsible for ion selectivity and pH dependence of the mammalian anion exchangers AE1 and AE2. Journal of Biological Chemistry. 1995;270:28751–28758. doi: 10.1074/jbc.270.48.28751. [DOI] [PubMed] [Google Scholar]
- Sun B, Leem CH, Vaughan-Jones RD. Novel chloride-dependent acid loader in the guinea-pig ventricular myocyte: part of a dual acid-loading mechanism. The Journal of Physiology. 1996;495:65–82. doi: 10.1113/jphysiol.1996.sp021574. [DOI] [PMC free article] [PubMed] [Google Scholar]
- Thomas RC. The effect of carbon dioxide on the intracellular pH and buffering power of snail neurones. The Journal of Physiology. 1976;255:715–735. doi: 10.1113/jphysiol.1976.sp011305. [DOI] [PMC free article] [PubMed] [Google Scholar]
- Vaughan-Jones RD. Regulation of chloride in quiescent sheep-heart Purkinje fibres studied using intracellular chloride and pH-sensitive microelectrodes. The Journal of Physiology. 1979;295:111–137. doi: 10.1113/jphysiol.1979.sp012957. [DOI] [PMC free article] [PubMed] [Google Scholar]
- Vaughan-Jones RD. An investigation of chloride- bicarbonate exchange in the sheep cardiac Purkinje fibre. The Journal of Physiology. 1986;379:377–40. doi: 10.1113/jphysiol.1986.sp016259. [DOI] [PMC free article] [PubMed] [Google Scholar]
- Vaughan-Jones RD, Wu ML. pH dependence of intrinsic H+ buffering power in the sheep cardiac Purkinje fibre. The Journal of Physiology. 1990a;425:429–448. doi: 10.1113/jphysiol.1990.sp018112. [DOI] [PMC free article] [PubMed] [Google Scholar]
- Vaughan-Jones RD, Wu ML. Extracellular H+ inactivation of Na+-H+ exchange in the sheep cardiac Purkinje fibre. The Journal of Physiology. 1990b;428:441–466. doi: 10.1113/jphysiol.1990.sp018221. [DOI] [PMC free article] [PubMed] [Google Scholar]
- Wu ML, Tseng YZ. The modulatory effects of endothelin-1, carbachol and isoprenaline upon Na+-H+ exchange in dog cardiac Purkinje fibres. The Journal of Physiology. 1993;471:583–597. doi: 10.1113/jphysiol.1993.sp019917. [DOI] [PMC free article] [PubMed] [Google Scholar]
- Xu P, Spitzer KW. Na-independent Cl−-HCO3− exchange mediates recovery of pHi from alkalosis in guinea pig ventricular myocytes. American Journal of Physiology. 1994;267:H85–91. doi: 10.1152/ajpheart.1994.267.1.H85. [DOI] [PubMed] [Google Scholar]
- Yannoukakos D, Stuart-Tilley A, Fernandez HA, Fey P, Duyk G, Alper SL. Molecular cloning, expression, and chromosomal localization of two isoforms of the AE3 anion exchanger from human heart. Circulation Research. 1994;75:603–614. doi: 10.1161/01.res.75.4.603. [DOI] [PubMed] [Google Scholar]
- Zhang Y, Chernova MN, Stuart-Tilley AK, Jiang L, Alper SL. The cytoplasmic and transmembrane domains of AE2 both contribute to regulation of anion exchange by pH. Journal of Biological Chemistry. 1996;271:5741–5749. doi: 10.1074/jbc.271.10.5741. [DOI] [PubMed] [Google Scholar]
- Zhao J, Hogan EM, Bevensee MO, Boron WF. Out-of-equilibrium CO2/HCO3− solutions and their use in characterising a new K+/HCO3− cotransporter. Nature. 1995;374:636–639. doi: 10.1038/374636a0. [DOI] [PubMed] [Google Scholar]