

Abstract
Glycine and GABA can be co-released from the same presynaptic terminals and in lower vertebrates they can activate the same glycine receptors (GlyRs). Thus we examined the effects of these two inhibitory transmitters on the homomeric GlyRs formed by the αZ1 subunit, of the zebrafish using two expression systems: Xenopus oocytes and the human BOSC 23 cell line.
The apparent affinity (EC50) of αZ1 for these neurotransmitters was highly variable. In Xenopus oocytes the EC50 ranged from 37 to 360 μm (mean ± s.d. EC50 116 ± 75 μm, n = 83) for glycine and from 8 to 120 mM (mean EC50 40 ± 30 mM, n = 37) for GABA.
In BOSC cells the EC50 varied from 9 to 92 μm (mean EC50 33 ± 17 μm, n = 19) and from 0.7 to 19.1 mM (mean EC50 4.9 ± 4.7 mM, n = 29) for glycine and GABA, respectively.
GABA activated αZ1 GlyRs either as a weak or full agonist: its efficacy (defined as Imax, GABA/Imax, Gly) was related to EC50 by an exponential relationship. A linear relationship was observed between EC50 values for GABA and glycine.
In outside-out patches, GABA and glycine activated αZ1 with identical single-channel conductances (85-100 pS), but with different kinetics and marked effect of concentration on burst duration for glycine only.
In outside-out patches deactivation time constants were concentration dependent for glycine, but not for GABA.
Our data demonstrate that the kinetics of glycine and GABA interactions with αZ1 are different and that they determine the properties of these neurotransmitter actions on the GlyR.
The glycine receptor (GlyR) mediates fast inhibitory synaptic transmission in the spinal cord and brainstem of vertebrates (Rajendra et al. 1997). This pentameric Cl− selective channel is composed of two subunit types: the α subunit (48 kDa), which carries the agonist binding site, and the β subunit (58 kDa), which is linked to the cytoskeletal proteins (Kirsch & Betz, 1995). The α isoforms are able to form functional homomeric channels when expressed in Xenopus oocytes or in mammalian cell lines (Schmieden et al. 1992; Takahashi et al. 1992). Their expression is developmentally regulated (Akagi & Miledi, 1988; Béchade et al. 1994) and this determines the functional properties of the GlyR during ontogenesis (Takahashi et al. 1992; Morales et al. 1994).
Recently the first non-mammalian GlyR subunit, named αZ1, was cloned from the central nervous system of the adult zebrafish Danio rerio (David-Watine et al. 1999a). Our preliminary electrophysiological studies showed that this subunit forms functional homo-oligomeric receptors with several pharmacological properties different from those reported for mammalian α subunit GlyRs (Schmieden et al. 1992, 1993).
A peculiar feature of αZ1 is its ability to be activated by γ-aminobutyric acid (GABA) (Bregestovski et al. 1997; David-Watine et al. 1999a). This property is particularly interesting as both inhibitory neurotransmitters, GABA and glycine, have been found in presynaptic boutons in the goldfish (Triller et al. 1987a) and mammalian (Ottersen et al. 1987, 1988; Triller et al. 1987a; Todd & Sullivan, 1990; Bohlhalter et al. 1994) spinal cords, suggesting that they can act as co-transmitters (Todd et al. 1996). Moreover, a recent study by Jonas et al. (1998) has provided compelling evidence that GABA and glycine can be co-released from individual vesicles at interneuron-motoneuron synapses in rat spinal cord.
Our previous observations indicate that in cDNA-injected Xenopus oocytes, GABA acts on the αZ1 GlyR as a partial agonist. In transfected human cells, its apparent affinity is nearly 10-fold higher (David-Watine et al. 1999a) and its efficacy (defined as Imax, GABA/Imax, Gly) reaches 90%, i.e. the neurotransmitter acts as a high efficacy agonist of αZ1 GlyR. These results suggest that the same receptor-channel protein can exhibit remarkable variability of the agonist apparent affinities and efficacies.
The present study was undertaken to (i) study the relation between efficacy and affinity of GABA/glycine activation and (ii) determine how single-channel properties account for the different action on the αZ1 GlyR of these two inhibitory neurotransmitters.
We found that GABA activates αZ1 GlyRs either as a partial or full agonist depending on the apparent affinity. Its efficacy is linked to EC50 by an exponential relationship. Studies of single-channel properties indicate that the kinetics of αZ1 activation underlie the different macroscopic properties of these neurotransmitters.
Preliminary results of this study have appeared in abstract form (Bregestovski et al. 1997; Fucile et al. 1998).
METHODS
Recordings from Xenopus oocytes
Oocyte injections
Experimental procedures complied throughout with the guidelines of the Animal Care Committee of the Pasteur Institute. Stage V-VI oocytes were surgically removed from adult Xenopus laevis females anaesthetized by immersion in 0.03% benzocaine (Sigma, USA) for 10-15 min. The wound was then sutured and the frogs were kept for 5-6 h in a different tank to recover.
Oocytes were placed in a calcium-free Barth's solution and then incubated in a collagenase solution (20 mg ml−1, 10 min) to remove follicle cells. They were then washed (1 h) in a solution of protease inhibitors (10 μg ml−1 chymostatin, 10 μg ml−1 pepstatin A, 10 μg ml−1 leupeptin and 1 mg ml−1 trypsin inhibitor, all from Sigma) and returned to fresh calcium-free Barth's solution for 30 min. The residual follicle cells were then removed manually using a pair of forceps. Oocytes were kept in Barth's solution containing (mM): 88 NaCl, 1 KCl, 0.82 MgSO4, 0.33 Ca(NO3)2, 0.41 CaCl2, 2.4 NaHCO3 and 5 Tris-HCl; pH 7.4. Micropipettes for injections were silicon treated and had a tip diameter of 10-20 μm. In order to inject cDNA into the nucleus, oocytes were injected at the centre of the animal pole with 25-50 nl of a pMT3-αZ1 cDNA construct. Three concentrations were tested: 50 pg, 270 pg and 5 ng per oocyte. Injected oocytes were kept at 18°C in Barth's solution containing antibiotics (penicillin and streptomycin, 10 μg ml−1, Gibco, USA) and sodium pyruvate (1 mM, Gibco).
Voltage-clamp recording
Electrophysiological recordings were performed 3-7 days after the injection. The oocytes were placed in a small volume chamber (∼200 μl), which allowed high speed exchange of the bathing solution. The external solution contained (mM): 96 NaCl, 2 KCl, 1.8 CaCl2, 1 MgCl2 and 5 Hepes-NaCl; pH 7.4. Two microelectrode voltage-clamp recordings of ionic currents were performed using the GeneClamp amplifier (Axon Instruments, USA). Microelectrodes were back filled with 3 M KCl. Voltage-clamp recordings of agonist-evoked responses were obtained at 18-20°C and a holding potential of -70 mV. Drugs were dissolved in the external solution. Wash-out times between each application were 3-4 min. To test the possibility that osmolarity artifacts could result from the application of high concentrations of GABA (up to 300 mM) to the oocytes, two different sets of control experiments were performed: an external solution containing 300 mM GABA was applied to non-injected oocytes, and 300 mM mannitol was applied to αZ1-injected oocytes. In none of these cases was an artifactual electrical response observed.
Recordings from BOSC 23 human cells
The BOSC 23 cell line, which is derived from the Ad5-transformed HEK 293T cell line, was transiently transfected with pMT3-αZ1 vector. This construct contained the full coding sequence of the zebrafish GlyR αZ1 plus 103 bp of its 5′ non-coding region. Both were subcloned downstream of the CMV promoter of the pMT3 vector, at the ClaI site of the polylinker (David-Watine et al. 1999a).
The cells were cultured as previously described (Fucile et al. 1996). By using an optimized calcium phosphate transfection procedure, high levels of functional receptors were detected electrophysiologically 24-48 h after transfection. To facilitate the identification of GlyR expressing cells, a Green Fluorescent Protein (GFP) cDNA was cotransfected (200 ng of the pMT3-αZ1 and 500 ng of the pCMV-GFP-LpA per dish). The successful rate of detecting glycine-activated currents in GFP-positive cells was 100%. Glycine- and GABA-evoked currents were monitored at room temperature (∼25°C) from fluorescent cells in the whole-cell and outside-out patch-clamp configurations.
During the recording period, the cells were bathed in the following solution (mM): 140 NaCl, 2 CaCl2, 2.8 KCl, 2 MgCl2, 10 Hepes/NaOH and 10 glucose; pH 7.3. The patch pipettes were filled with a solution containing (mM): 140 CsCl, 2 MgATP, 10 Hepes/CsOH and 5 BAPTA; pH 7.3. Whole-cell capacitance and patch series resistance (5-15 MΩ) were estimated from slow transient compensations. A series resistance compensation of 85-90% was obtained in all cases. The cells were continuously perfused with a pressure-driven system using independent external square tubes for the control and agonist-containing solutions. These tubes were positioned 40-50 μm from the patched cell and connected to a fast exchanger system (SF 77A Perfusion Fast-Step, Warner, USA), which was also used for single-channel and deactivation experiments in the outside-out configuration, allowing a 10-90% solution exchange in 1-2 ms, as measured by open electrode controls (1/10 NaCl). GABA was purchased from Tocris (USA). All other chemicals were purchased from Sigma (USA).
Data analysis
Data were stored on a digital tape recorder DTR 1205 (Bio-Logic, France) and on a PC computer using pCLAMP6 software (Axon Instruments, USA). For quantitative estimations of agonist actions, dose-response relationships were fitted by the equation:
where I is the current amplitude induced by the agonist at concentration [C], Imax is the maximum response of the cell, nH is the Hill coefficient and EC50 is the concentration for which a half-maximum response is induced.
Single-channel currents were filtered at 2 kHz, sampled at 10 kHz and analysed by pCLAMP6 software (Axon Instruments). Opening and closing transitions were detected using a 50% threshold criterion. Kinetic parameters have to be considered as ‘apparent’ because of the effects of undetected shutting and opening (Colquhoun & Sigworth, 1995). The amplitude histograms of simple openings were fitted with the sum of one or two Gaussian functions, using the least-squares method. Single-channel slope conductances were calculated using only the amplitude values obtained at hyperpolarizing potentials. Bursts were defined as openings separated by closed intervals shorter than a critical value τc, which was determined from the closed time distribution using the method of equal percentage of misclassified bursts (Colquhoun & Sakmann, 1985). τc values ranged from 1.9 to 4.9 ms for glycine applications, and from 0.6 to 1.4 ms for GABA. When four exponents were used to fit the closed time distributions (2, 3 and 5 μm glycine), the first and the second closed time populations were considered within bursts. For three-exponential analysis (glycine 1 μm and all GABA concentrations), only the first closed time population was considered within bursts (see Tables 1B and 2B). Open time, closed time and burst duration distributions were fitted with the sum of three or four exponential functions using the least-squares method. The total open probability (NPo) was calculated as the total open time during a recording divided by its total time. Deactivation time constants were calculated by fitting the current decays with a single exponential function (PulseFit software, HEKA Elektronics, Germany).
Table 1.
Kinetic analysis of glycine-evoked single-channel currents
| A. Open time distribution parameters | ||||
|---|---|---|---|---|
| [Glycine] | τo1 (ms) Rel. wt (%) | τo2 (ms) Rel. wt (%) | τo3 (ms) Rel. wt (%) | Mean open time (ms) |
| 1 μm | 0.25 ± 0.49 | 1.44 ± 0.31 | 9.13 ± 0.81 | 2.41 ± 0.24 |
| 28.3 | 55.0 | 16.7 | ||
| 2 μm | 0.19 ± 0.23 | 1.59 ± 0.18 | 7.48 ± 0.27 | 3.63 ± 0.09 |
| 25.5 | 48.1 | 26.4 | ||
| 3 μm | 0.23 ± 0.38 | 1.82 ± 0.25 | 6.75 ± 0.36 | 3.51 ± 0.11 |
| 27.7 | 45.9 | 26.4 | ||
| 5 μm | 0.28 ± 0.32 | 1.47 ± 0.34 | 6.02 ± 0.28 | 3.41 ± 0.09 |
| 28.1 | 41.5 | 30.4 | ||
| B. Closed time distribution parameters | |||||
|---|---|---|---|---|---|
| Closed time components within bursts | Closed time components between bursts | ||||
| [Glycine] | τc1 (ms) Rel. wt (%) | τc2 (ms) Rel. wt (%) | τc3 (ms) Rel. wt (%) | τc4 (ms) Rel. wt (%) | |
| 1 μm | 0.32 ± 0.19 | — | 613 ± 20 | 3889 ± 91 | |
| 34.8 | 6.9 | 8.3 | |||
| 2 μm | 0.27 ± 0.27 | 1.65 ± 0.58 | 54.4 ± 0.8 | 298.2 ± 1.9 | |
| 53.4 | 22.9 | 16.9 | 6.8 | ||
| 3 μm | 0.18 ± 0.12 | 1.25 ± 0.29 | 29.8 ± 0.2 | 392.3 ± 2.3 | |
| 67.9 | 16.1 | 14.6 | 1.4 | ||
| 5 μm | 0.24 ± 0.37 | 1.12 ± 1.74 | 45.9 ± 4.1 | 169 ± 85 | |
| 73.6 | 13.8 | 7.0 | 5.6 | ||
| C. Burst distribution parameters | |||||||
|---|---|---|---|---|---|---|---|
| [Glycine] | τb1 (ms) Rel. wt (%) | τb2 (ms) Rel. wt (%) | τb3 (ms) Rel. wt (%) | τb4 (ms) Rel. wt (%) | Burst (ms) | Closing/burst | Po/burst (%) |
| 1 μm | 0.25* | 1.44* | 5.69 ± 2.21 | 30.4 ± 2.22 | 2.92 ± 0.73 | 1.40 ± 0.11 | 98.3 ± 0.5 |
| 35.5 | 50.0 | 8.1 | 6.4 | ||||
| 2 μm | 0.19* | 1.59* | 6.01 ± 0.41 | 46.3 ± 0.6 | 9.21 ± 1.0 | 2.64 ± 0.15 | 93.8 ± 0.4 |
| 33.8 | 32.3 | 22.5 | 11.4 | ||||
| 3 μm | 0.20 ± 0.40 | 1.78 ± 0.35 | 8.87 ± 0.43 | 68.2 ± 0.4 | 15.8 ± 1.4 | 3.29 ± 0.27 | 91.8 ± 0.6 |
| 21.6 | 32.7 | 28.9 | 16.8 | ||||
| 5 μm | 0.30 ± 0.27 | 1.87 ± 0.60 | 6.97 ± 0.82 | 65.5 ± 0.32 | 22.0 ± 2.0 | 5.14 ± 0.46 | 89.4 ± 0.8 |
| 37.4 | 23.5 | 16.8 | 22.3 | ||||
Values given are means ± s.e.m. for 5 outside-out patches, Vh = −50 mV. τo, exponential time constants for the apparent open time distributions; τc, exponential time constants for the apparent closed time distributions; τb, the exponential time constants for burst distributions; Rel. wt, relative weights of each constant; Burst, the mean burst duration; Closing/burst, mean number of closure during a burst; Po/burst, mean open probability during a burst. All values were derived from sets of at least 5000 single-channel events, except for the constant values obtained at 1 μm glycine.
Parameters indicated by were constrained during the fitting procedure.
Table 2.
Kinetic analysis of GABA-evoked single-channel currents
| A. Open time distribution parameters | ||||
|---|---|---|---|---|
| [GABA] | τo1 (ms) Rel. wt (%) | τo2 (ms) Rel. wt (%) | τo3 (ms) Rel. wt (%) | Mean open time (ms) |
| 100 μm | 0.25 ± 0.15 | 1.78 ± 0.20 | 8.00 ± 0.98 | 2.07 ± 0.14 |
| 44.2 | 48.7 | 7.1 | ||
| 200 μm | 0.18 ± 0.18 | 1.61 ± 0.22 | 6.54 ± 0.64 | 2.32 ± 0.07 |
| 38.7 | 48.9 | 12.4 | ||
| 300 μm | 0.17 ± 0.19 | 1.27 ± 0.22 | 4.80 ± 0.37 | 2.25 ± 0.07 |
| 34.6 | 43.9 | 21.5 | ||
| 500 μm | 0.28 ± 0.20 | 1.79 ± 0.24 | 7.62 ± 0.59 | 2.65 ± 0.09 |
| 37.6 | 48.7 | 13.7 | ||
| B. Closed time distribution parameters | ||||
|---|---|---|---|---|
| Closed time components within bursts | Closed time components between bursts | |||
| [GABA] | τc1 (ms) Rel. wt (%) | τc2 (ms) Rel. wt (%) | τc3 (ms) Rel. wt (%) | |
| 100 μm | 0.28 ± 0.21 | 6.16 ± 0.62 | 89.8 ± 0.1 | |
| 20.0 | 6.5 | 73.5 | ||
| 200 μm | 0.30 ± 0.26 | 18.0 ± 0.1 | 66.0 ± 0.3 | |
| 13.0 | 60.7 | 26.3 | ||
| 300 μm | 0.28 ± 0.28 | 13.4 ± 0.3 | 34.2 ± 0.3 | |
| 13.5 | 43.4 | 43.1 | ||
| 500 μm | 0.20 ± 0.25 | 9.61 ± 0.21 | 42.4 ± 0.1 | |
| 17.2 | 33.8 | 49.0 | ||
| C. Burst distribution parameters | ||||||
|---|---|---|---|---|---|---|
| [GABA] | τb1 (ms) Rel. wt (%) | τb2 (ms) Rel. wt (%) | τb3 (ms) Rel. wt (%) | Burst (ms) | Closing/burst | Po/burst (%) |
| 100 μm | 0.27 ± 0.15 | 2.09 ± 0.17 | 11.9 ± 0.9 | 2.59 ± 0.26 | 1.24 ± 0.03 | 97.3 ± 0.3 |
| 44.3 | 49.1 | 6.6 | ||||
| 200 μm | 0.18 ± 0.22 | 1.84 ± 0.22 | 7.58 ± 0.81 | 2.76 ± 0.11 | 1.20 ± 0.02 | 96.4 ± 0.3 |
| 38.6 | 47.3 | 14.1 | ||||
| 300 μm | 0.15 ± 0.20 | 1.39 ± 0.21 | 5.56 ± 0.40 | 3.22 ± 0.15 | 1.30 ± 0.02 | 96.7 ± 0.2 |
| 34.4 | 37.6 | 28.0 | ||||
| 500 μm | 0.27 ± 0.18 | 2.14 ± 0.19 | 9.33 ± 0.47 | 3.43 ± 0.19 | 1.27 ± 0.01 | 97.2 ± 0.2 |
| 36.9 | 47.0 | 16.1 | ||||
RESULTS
Homomeric αZ1 GlyR exhibits a high variability of GABA/glycine efficacies and sensitivities
Injections of Xenopus oocytes with αZ1 cDNA led to a strong expression of functional homomeric GlyR, as demonstrated by voltage-clamp recordings (holding potential, Vh= -70 mV). We first analysed the concentration dependency of GlyR responses to glycine and GABA. The apparent affinities of these agonists (estimated as half-maximal effective concentrations, EC50) and relative efficacies of GABA/glycine (estimated as Imax, GABA/Imax, Gly) were extremely diverse.
Figure 1A illustrates responses from two oocytes with similar levels of αZ1 GlyR expression (Imax, Gly amplitudes between 6 and 8 μA) but with different sensitivities to the tested agonists. In the higher affinity oocyte Imax, GABA was about 50% of that for glycine, whereas in the lower sensitivity oocyte, GABA nearly failed to activate the receptor.
Figure 1. Homomeric αZ1-GlyRs exhibit a high degree of variability in glycine/GABA apparent affinities and efficacies.
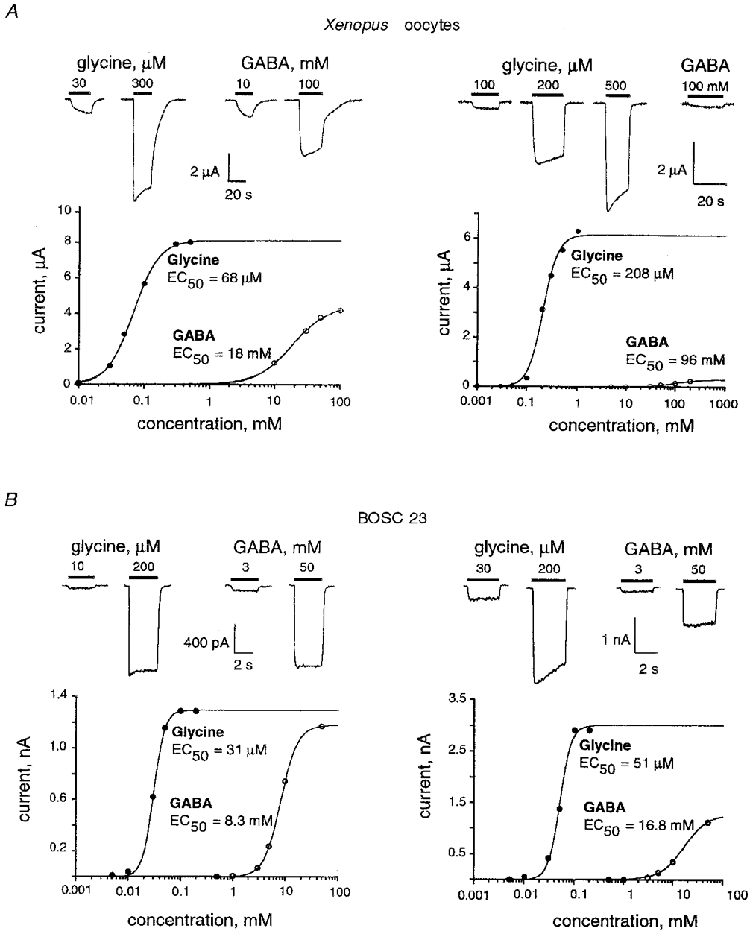
A, traces of currents recorded at the indicated agonist concentrations (above) and dose-response relationships (below) obtained from voltage-clamped Xenopus oocytes, injected with 50 pg of αZ1 cDNA. Typical oocytes displaying high GABA efficacy (left, Imax, Gly= 8 μA and Imax, GABA= 5.2 μA) and low GABA efficacy (right, Imax, Gly= 5.9 μA and Imax, GABA= 0.23 μA) are shown. Holding potential, Vh= -70 mV. B, whole-cell currents recorded at the indicated agonist concentrations (above) and dose-response relationships (below) obtained from BOSC 23 cells transiently transfected with αZ1 cDNA. Typical cells displaying high GABA efficacy (left, Imax, Gly= 1.39 nA and Imax, GABA= 1.18 nA, Vh= -70 mV) and low GABA efficacy (right, Imax, Gly= 3 nA and Imax, GABA= 1.26 nA, Vh= -60 mV) are shown. Note that in lower sensitivity cells, GABA acts as a lower efficacy partial agonist (relatively smaller Imax).
The Imax elicited by saturating concentrations of glycine was between 0.1 and 17.5 μA, with a mean of 8.6 ± 4.4 μA (mean ±s.d., n = 83). In the same experimental conditions, the Imax for GABA was 0-13 μA, with a mean of 4.8 ± 3.1 μA (n = 40). When saturating concentrations of both agonists were applied to the same oocyte, GABA always acted as a partial agonist (Fig. 1A), with an efficacy of 0.05-0.79 (mean 0.45 ± 0.22, n = 38).
The range of EC50 values for glycine covered a 10-fold span (from 37 to 360 μm, n = 83, Fig. 2A) with a mean EC50 of 116 ± 75 μm and a mean Hill coefficient (nH) of 2.75 ± 0.65. Following sequential applications of both agonists to the same oocyte, the apparent affinities for GABA were two orders of magnitude lower than those for glycine and showed a similarly large spread: from 8 to 120 mM (mean EC50= 40 ± 30 mM and nH= 1.96 ± 0.79, n = 37).
Figure 2. Apparent affinity for glycine depends on the expression system and is related to GABA efficacy and apparent affinity.
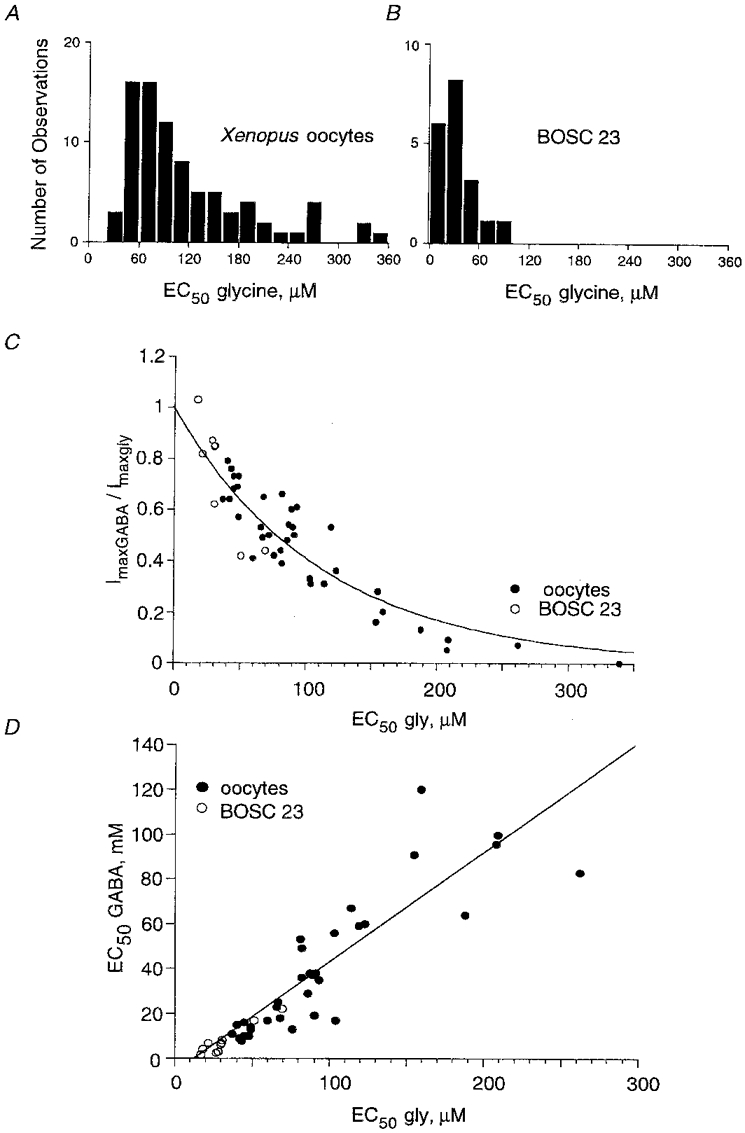
A and B, distribution of EC50 values for glycine obtained from 83 voltage-clamped Xenopus oocytes injected with 50 pg, 270 pg and 5 ng αZ1 cDNA (A) and from 19 transfected BOSC 23 cells recorded in the whole-cell configuration (B). Note that: (i) in both preparations the apparent affinities to glycine vary nearly 10-fold, and (ii) the higher apparent affinities of αZ1 GlyR in BOSC cells than that in Xenopus oocytes. C, relationship between GABA efficacy (expressed as the ratio Imax, GABA/Imax, Gly) and glycine apparent affinity. Points obtained from Xenopus oocytes (•) and BOSC 23 cells (○) were best fitted with the exponential relation: eEC50/C, where C = 112 μm. D, linear relationship between apparent affinities for GABA and glycine in Xenopus oocytes and in BOSC 23 cells. The slope of the line indicates that a 100 μm increase of EC50 for glycine corresponds to a 48 mM increase of EC50 for GABA.
A similar high variability of glycine and GABA actions was observed on human BOSC 23 cells transiently transfected with αZ1-cDNA. Nineteen cells were tested with both neurotransmitters: whole-cell currents evoked by saturating concentrations of glycine (200-500 μm, Vh= -40 mV) were 1.2-21.9 nA (mean 7.2 ± 6.1 nA) and by GABA (50- 100 mM) were 1.2-25.5 nA (mean 6.9 ± 5.9 nA).
The sensitivity of αZ1 GlyR to the agonists was significantly higher in BOSC 23 cells than in oocytes (Fig. 2B). The EC50 for glycine varied from 9 to 92 μm (mean EC50= 33 ± 17 μm and nH= 2.85 ± 0.91, n = 15) and for GABA from 0.7 to 19.1 mM (mean EC50= 4.9 ± 4.7 mM and nH= 2.67 ± 0.75, n = 29). The Imax, GABA/Imax, Gly ranged from 0.42 to 1.16, with a mean of 0.86 ± 0.18 (n = 17).
At the studied concentrations, the desensitization of whole-cell currents was weak (see traces in Fig. 1B). Current decay was more pronounced in cells displaying large current amplitudes. In several experiments the reversal potential of glycine-induced responses (ECl) was determined using a ramp protocol. For some cells a marked shift of ECl (∼5-10 mV) was revealed during a 4-5 s application of agonist (data not shown). This suggests that the desensitization at least partly resulted from the local changes in the intracellular Cl− concentration.
The results obtained in both Xenopus oocytes and BOSC 23 cells revealed an exponential relationship between apparent affinities and relative GABA/glycine efficacies. The efficacy of GABA decreased e-fold for an increase in the glycine EC50 value of 112 μm (Fig. 2C). A similar relationship was observed between GABA efficacy and its apparent affinity (not shown). This is consistent with the apparently linear correlation between the apparent affinities for glycine and GABA (Fig. 2D).
These results demonstrate that, depending on the apparent affinity, GABA can activate the same αZ1 GlyR either as a very weak or as a full potency agonist.
It has been suggested that the apparent affinity for glycine depends on the mean density of receptors in the membrane (Taleb & Betz, 1994). To test this hypothesis we analysed the relationship between Imax and the apparent affinity for glycine in oocytes and BOSC 23 cells (Fig. 3). In Xenopus oocytes the mean expression level of functional GlyR (assessed from the Imax, gly) was higher for cells injected with the largest amounts of cDNA. The mean Imax were 5914 ± 4670 nA (n = 15), 8997 ± 3904 nA (n = 34) and 10 097 ± 4220 nA (n = 19) for cells injected with 50 pg, 270 pg and 5 ng, respectively (mean ±s.d.). Oocytes with larger Imax exhibited significantly higher apparent agonist affinity (Fig. 3A). However, oocytes of similar size displaying comparable Imax showed quite divergent EC50 values (up to 5- to 10-fold differences). For instance, for cells with Imax= 3-4 μA, the EC50 was 37-350 μm (Fig. 3A). Moreover, in BOSC 23 cells there was no significant correlation between these two parameters (Fig. 3B).
Figure 3. Weak correlation between the apparent affinity of αZ1 GlyR for glycine and the amount of expressed channels.
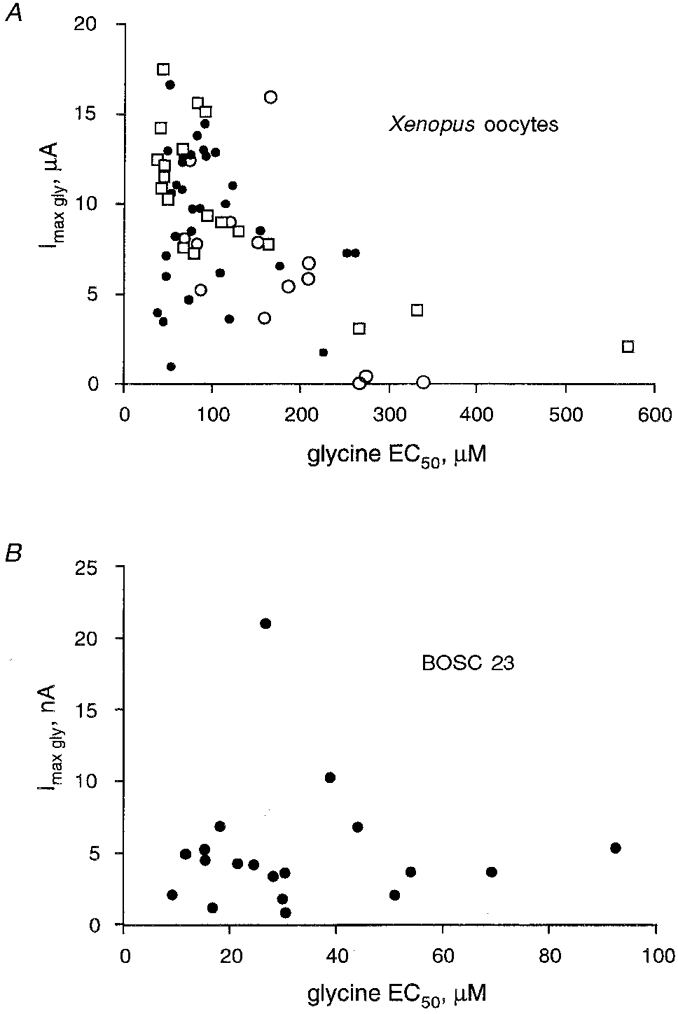
A, relationship between maximal current amplitudes (induced by 1-5 mM glycine) and the EC50 obtained from voltage-clamped Xenopus oocytes (n = 65, Vh= -70 mV) injected with 50 pg (○), 270 pg (•) or 5 ng (□) αZ1 cDNA. Note that oocytes displaying very different EC50 values can have similar Imax and vice versa, similar EC50 correspond to highly variable Imax. B, same display for data obtained with whole-cell recordings of BOSC 23 cells (n = 19, Vh= -40 mV) transiently transfected with αZ1 (500 μm glycine was applied). Note the lack of correlation between the apparent affinities and maximal currents.
Single-channel properties of αZ1 GlyR activated by glycine
The differences in efficacy may arise from (i) variations in single-channel conductances, or (ii) the kinetics of αZ1 GlyR activation. To address these questions, we studied the properties of single αZ1 GlyR channels in patches excised from BOSC 23 cells.
αZ1 GlyRs were activated by glycine in outside-out patches. The main features were similar to those previously described for recombinant (Bormann et al. 1993) and neuronal (Hamill et al. 1983; Twyman & Macdonald, 1991; Legendre & Korn, 1994) GlyRs.
Some αZ1 channels had subconductance levels (Fig. 4A-C). Seven of nineteen outside-out patches exhibited two conductance states. Their distribution ranged from 48 to 100 pS with the most representative states between 85 and 100 pS (not shown). At positive membrane potentials (Vh), two subconductance amplitudes were observed for only two of the seven patches that exhibited two sublevels at negative potentials. The reasons for this differential voltage sensitivity were not analysed. The I-V relationship revealed that channel amplitudes exhibited a small but significant rectification at depolarizing potentials (Figs 4B and 5B). In six outside-out patches the single-channel amplitudes at Vh+50 mV were 74 ± 6% of that observed at -50 mV. Burst durations and the open probability (Po) were voltage dependent (Fig. 4A and D). The open probability (Po) increased e-fold for a 62 mV membrane depolarization (Fig. 4D). Similar dependence of Po on membrane potential was observed during applications of GABA to outside-out patches (n = 4, not shown).
Figure 4. Single-channel currents evoked by glycine at outside-out patches excised from BOSC 23 cells transfected with αZ1.
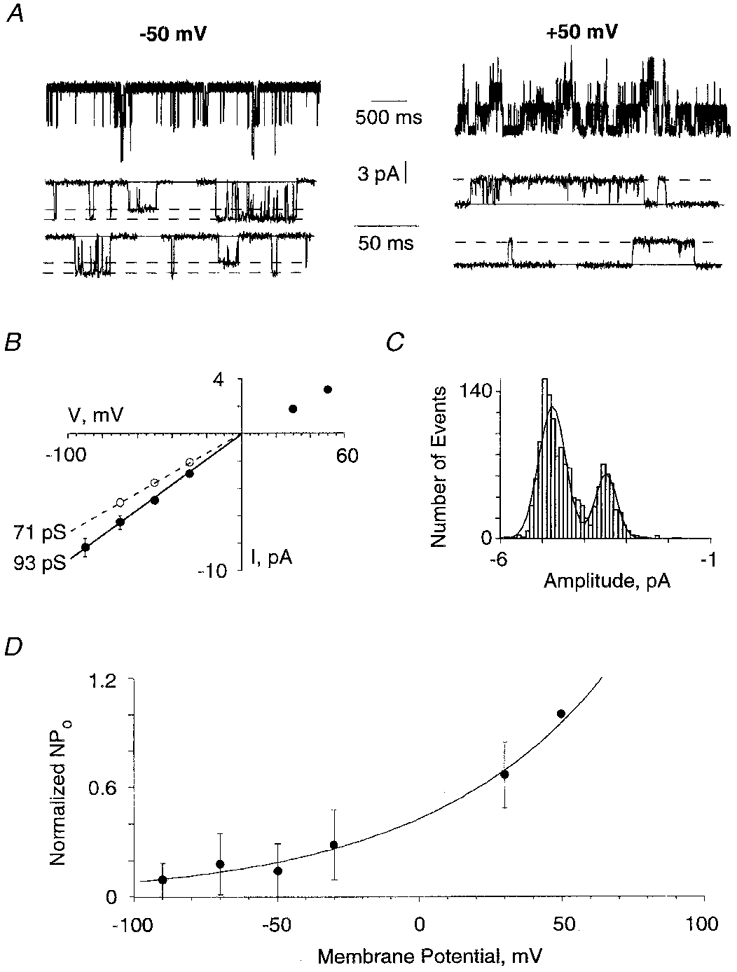
A, currents induced by 5 μm glycine, recorded at the indicated membrane potentials and with an extended time scale for the lower traces. Note the increase in burst durations and Po at positive potentials. B, I-V relationship for the same outside-out patch, with indicated values of unitary conductance states. At positive potentials only one conductance state was observed. C, amplitude distribution of single-channel currents obtained from the same patch as in A, at Vh= -50 mV. The histogram is fitted by the sum of two Gaussian curves. D, relationship between open probability (NPo) and membrane potential. Points represent the mean (±s.d.) for 5 outside-out patches. All values were normalized with respect to the NPo value obtained at +50 mV. The data were best fitted by the exponential relation: AeV/B, where A = 0.43, and B = 62 mV.
Figure 5. Glycine and GABA activate αZ1 GlyR channels with the same unitary conductance.
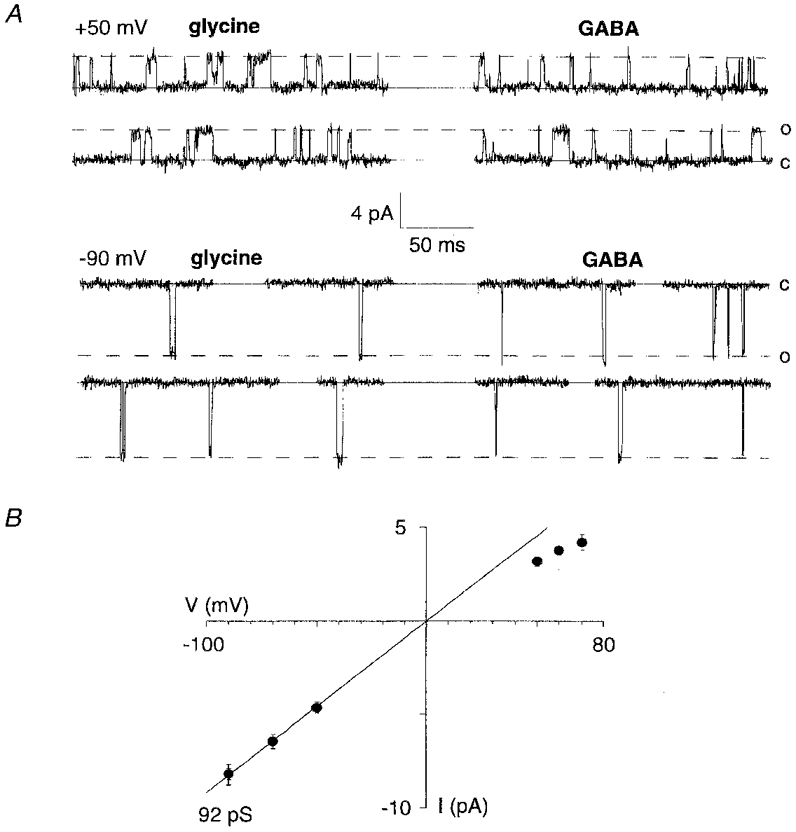
A, single-channel currents produced by glycine (0.5 μm, left) and GABA (100 μm, right) on the same outside-out patch, at the indicated potentials. B, I-V relationship showing the same unitary conductance (92 pS) for both glycine and GABA. The two sets of symbols superimpose exactly.
Glycine and GABA activate αZ1 GlyR with different burst openings
During sequential application of glycine or GABA we found that both neurotransmitters activated αZ1-GlyRs in outside-out patches with identical slope conductances (n = 7, Fig. 5A and B). This suggests that unitary amplitude variations cannot be responsible for the variability of GABA/glycine efficacies.
In contrast, the kinetic behaviour of αZ1 GlyR channels was remarkably different according to whether they were activated by GABA or glycine. At low concentrations (1 μm glycine or 100 μm GABA) both transmitters evoked similarly short single-channel openings (Fig. 6A, top traces). An increase in the glycine concentration to 5 μm produced long bursts of openings. However, a similar increase of the GABA concentration to 500 μm was not accompanied by a pronounced prolongation of burst duration, but only by an increased frequency of activation (Fig. 6A, bottom traces). A 5-fold increase of agonist concentrations resulted in more than a 7-fold prolongation of glycine-induced burst openings in contrast to a 1.3-fold increase for GABA (Table 1). Kinetic analysis revealed that the apparent mean open times for both agonists were similar and weakly concentration dependent. The distributions of apparent open times were best fitted by a sum of three exponentials whose time constants (0.2 ms, 1.5-2 ms and 5-9 ms) did not depend on the nature or concentration of the agonists (Tables 1A and 2A).
Figure 6. Glycine and GABA activate αZ1 GlyR with different burst behaviour.
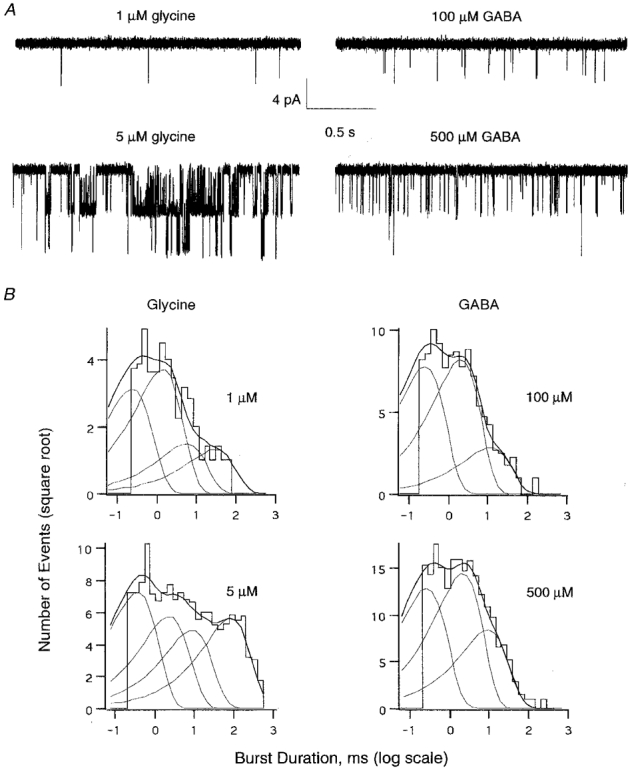
A, single-channel traces obtained from the same outside-out patch (BOSC 23 cell) at the indicated agonist concentrations. Vh, -50 mV. Smaller event amplitudes arise from filtering (1 kHz) of the fast openings. B, distribution of burst durations induced by the indicated concentrations of glycine (left) and GABA (right). For display purposes the histograms are shown as functions of log intervals, with the ordinate on a square root scale. Histograms were best fitted by the sum (thicker line) of four (left) or three (right) exponential decay functions (thin lines). Time constant values and their relative weights are reported, for each concentration, in Table 1. Each histogram represents data obtained from 5 outside-out patches.
Differences between the effects of glycine and GABA became obvious when the closed time and burst distributions were analysed. Closed time distributions obtained with glycine applications were best fitted by the sum of four exponentials (except for 1 μm glycine), whereas only three components (Table 2B) were sufficient in the case of GABA. Details about closed time components considered within bursts can be found in Tables 1B and 2B (see also Methods).
The distributions of glycine-induced burst durations were best fitted by a sum of four exponentials (Fig. 6B and Table 1C). The relative weight of the longest burst population increased with increasing glycine concentration, resulting in the prolonged mean burst time. In contrast, GABA-induced burst distributions were composed of only three kinetic populations (Fig. 6B), whose relative weights only slightly changed with concentration (Table 2C), resulting in a weak modulation of the mean burst kinetics.
It follows that the increase in the Po associated with elevation of glycine concentrations (Fig. 7A) was due to both the prolongation of burst durations and to a higher burst frequency, as further illustrated in Fig. 7B. On the other hand, the elevation in Po observed for GABA (Fig. 7A) was only due to an augmentation of frequency, which in this range of concentrations reached higher values than that for glycine (Fig. 7B). The apparent affinities extrapolated from the relationships between Po and the agonist concentrations (Fig. 7A, EC50, Gly= 13 μm, EC50, GABA= 1.86 mM) were compatible with those measured in whole-cell experiments.
Figure 7. Concentration dependencies of single-channel open probability and burst duration.
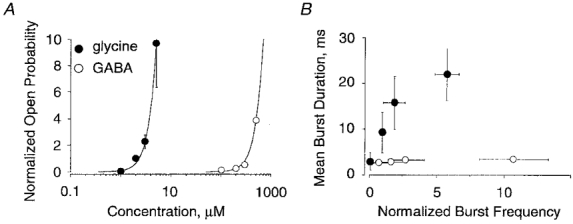
A, effects of increased concentrations of glycine (•) and GABA (○) on Po. Values are means ±s.d. from 5 outside-out patches (Vh= -50 mV). For each patch, data were normalized to the Po obtained with 2 μm glycine. Data for normalized Po were best fitted by the equation: Po, norm= A/(1 + (EC50/[C])nH), with nH and A constrained to 3 and 200, respectively. The choice A = 200 gave the best fitting results. This value was in the range of maximal normalized Po obtained from measurements of macroscopic currents at applications of saturating glycine concentrations to outside-out patches (not shown). EC50 values are 13 μm for glycine and 1.86 mM for GABA. B, relationship between mean burst duration and normalized burst frequency for glycine (•) and GABA (○). Burst frequency values were normalized with respect to those obtained with 2 μm glycine for each of the 5 outside-out patches (as in A). Note that GABA induces a high burst frequency without a substantial increase of burst duration.
GABA and glycine have different deactivation kinetics
The magnitude of the recorded currents (see Fig. 8A) indicated that the functional outside-out patches contained a large number of glycine-activated channels (from 10 to 500). This prevented us from monitoring directly the single-channel kinetics at high agonist concentrations. To circumvent this problem we measured in outside-out patches the deactivation time constant of currents elicited by various agonist concentrations (from 5 to 200 μm glycine, and from 1 to 50 mM GABA) using a fast solution exchanger (see Methods). Indeed, it has been demonstrated with GABAA receptor channels (Lavoie et al. 1997) that the deactivation time constant values are similar to the burst duration component, representing the highest occupied state of the receptor.
Figure 8. Deactivation time constants of αZ1 GlyR are different for glycine and GABA.
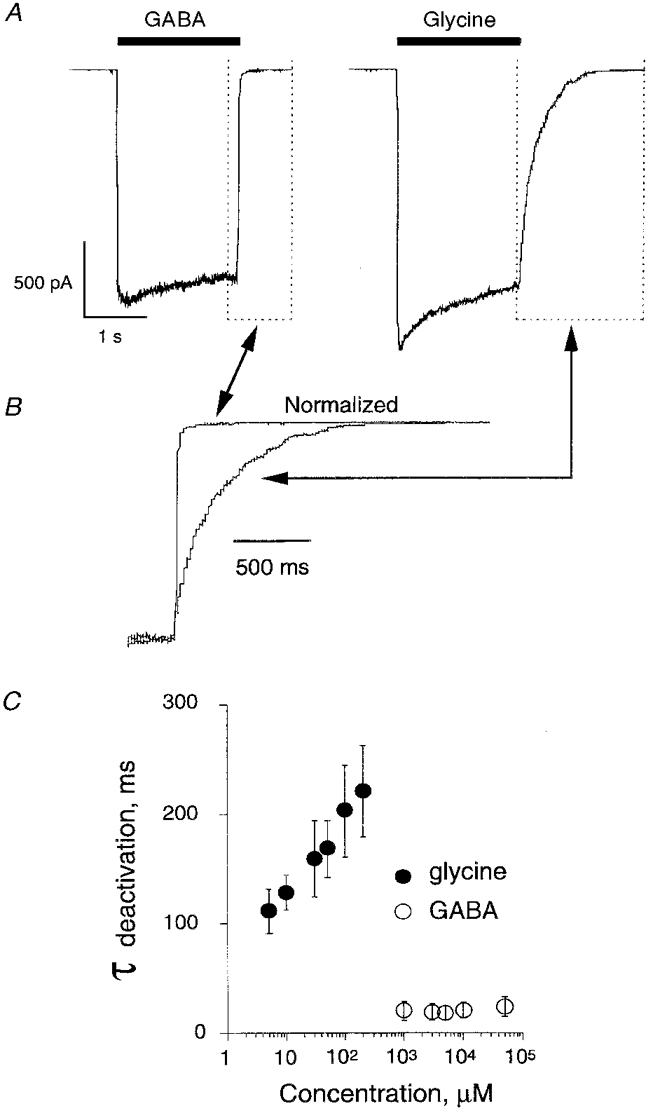
A, typical currents evoked by saturating concentrations of GABA (50 mM) and glycine (200 μm) in an outside-out patch from a BOSC 23 cell. Vh, -40 mV. B, outlined boxes indicated in A (dotted lines) shown at faster sweep speed and after amplitude normalization. Deactivation time constants were 17 ms and 168 ms for GABA and glycine, respectively. C, mean deactivation time constants (ordinates) obtained by best fitting (with a single exponential function) of the outside-out current decays following the fast removal of agonist at different concentrations (abscissa). Note that τ was concentration dependent only for glycine. Data are from 11 patches (mean ±s.d.). Vh, -40 mV.
Application of glycine or GABA to outside-out patches evoked currents which, like the responses observed in the whole-cell configuration, were weakly desensitizing (Fig. 8A). With saturating concentrations of agonists, the amplitudes of the non-desensitizing component were 75-95% of that of the peak current. The degree of desensitization for GABA-induced currents was even less pronounced than that for glycine. In outside-out patches tested with both neurotransmitters, the mean non-desensitizing components were 77 ± 8 and 85 ± 12% (n = 11) of those for glycine and GABA, respectively.
The time course of deactivation was best fitted by a single exponential decay. The mean deactivation time constants of glycine-induced currents were concentration dependent, increasing from 111 ± 20 ms for 5 μm glycine to 221 ± 42 ms for 200 μm glycine (n = 11, Fig. 8B and C). Conversely, deactivation time constants for GABA were much shorter (about 20 ms, Fig. 8) and did not depend on concentration of the agonist.
DISCUSSION
This study demonstrates that two main inhibitory neurotransmitters, glycine and GABA, can activate homomeric αZ1 GlyR channels with similar single-channel conductances but different kinetics. We show also that αZ1 GlyR exhibits a high degree of variability in its sensitivity to these neurotransmitters. Moreover, in different cells, GABA was either a full power agonist or incapable of activating αZ1 GlyRs. This variability in GABA efficacy is directly related to the sensitivity profile displayed by each particular cell.
Variability of GABA/glycine efficacy
In neurons of lower vertebrates the co-activation of receptor-operated channels by glycine and GABA has been reported previously. By way of example, in line with our observations, it has been demonstrated that in isolated lamprey spinal cord neurons, these two inhibitory neurotransmitters activate the same receptor-channel complex with EC50 for glycine of 16 μm and for GABA of 1.5 mM, respectively (Baev et al. 1992). Also, pharmacological evidence in the goldfish led to the suggestion that at Mauthner cell inhibitory synapses, postsynaptic receptors are sensitive to both glycine and GABA (Faber & Korn, 1991).
The results for mammalian GlyRs appear to be more contradictory. In one study, Schmieden et al. (1993) stated that GABA (up to 50 mM) fails to evoke Cl− currents in Xenopus oocytes expressing the wild-type human α1 GlyR subunit. In this case the EC50 for glycine was 260 μm. In another report, Taleb & Betz (1994) found that at a higher density of human α1 GlyR, the homomeric channels have a higher affinity for glycine (EC50= 58 μm) and that, in these conditions, GlyR can be weakly activated by GABA. Recently Jonas et al. (1998) demonstrated that motoneurons in spinal cord slices from young (P5-P10) rats contain GlyRs with a remarkably low apparent affinity for glycine. On application to outside-out patches of short (1 ms) pulses of various glycine concentrations, the EC50 was about 400 μm. GABA (10 mM) was not able to markedly activate the GlyRs in these slices (calculated EC50= 105 mM; Jonas et al. 1998).
Our study suggests a possible resolution of this apparent contradiction by demonstrating that the ability of GABA to activate αZ1 GlyR is strongly related to its apparent affinity. Indeed, in our experiments, in cells displaying a relatively low sensitivity of GlyR to glycine (EC50 > 50 μm), GABA acted as a low affinity partial agonist, whereas in ‘high affinity’ cells (EC50 < 20 μm) GABA was a full agonist, inducing an Imax similar to that produced by glycine (see Fig. 2A). The questions of efficacy/affinity relationships and different mechanisms underlying the modulation of concentration-response curves were carefully analysed in a recent review by Colquhoun (1998). The proportionality between GABA and glycine EC50 values, observed in our experiments (Fig. 2D), suggests that the same molecular mechanisms are responsible for the modulation of both agonist affinities.
Taleb & Betz (1994) suggested that the density of membrane GlyRs may be involved in the affinity modulation, possibly via receptor-receptor interaction mechanisms. Further experiments are necessary to determine the factors accounting for the apparent affinity of GlyR to the tested agonists and its variability. As suggested, a possible explanation may involve the clustering of receptors at the membrane surface. If so, high levels of expression should correspond to an increased clustering. However, the degree of clustering does not necessarily correlate with the mean density of expressed receptors, and indeed we did not observe a significant correlation between the number of functional αZ1 GlyRs (estimated from Imax) and apparent affinities.
To visualize GlyR directly in living cells we recently fused fluorescent marker protein GFP with the αZ1 subunit. Our data indicate that functional GlyRs are distributed, at least in part, as membrane clusters in HEK 293 and BOSC 23 cells or in Xenopus oocytes transfected with a GlyR-GFP construct (David-Watine et al. 1999b).
On the other hand, the affinities of αZ1 GlyR were significantly higher in BOSC 23 cells than that in Xenopus oocytes. This difference also needs further investigation. Cell-dependent membrane environment or cytoplasmic factors may be involved in regulating the functional properties of the αZ1 GlyRs. For instance, a recent comparison of neuronal nicotinic acetylcholine receptors in a mammalian cell line (L-α3β4) with those expressed in Xenopus oocytes and in neurons indicate that ion channel properties can be influenced by the choice of heterologous expression system (Lewis et al. 1997).
Single-channel currents
To elucidate the mechanisms underlying the different behaviour of αZ1 GlyR in response to glycine and GABA, we analysed the single-channel properties of αZ1 GlyRs in BOSC 23 cells.
Glycine-induced single-channel activity exhibited substate conductances with main amplitude 80-100 pS. These values are similar to those reported in human α1 homomeric GlyR in HEK 293 cells (Bormann et al. 1993) and in the Mauthner cells of zebrafish larva (Legendre & Korn, 1994). Furthermore, analysis of I-V relationships revealed that the open probability of glycine-induced currents is higher at depolarizing potentials, similar to that demonstrated in vivo for zebrafish GlyRs (Legendre & Korn, 1995). Thus the main properties of homomeric αZ1 channels are similar to those previously described for zebrafish neurons and mammalian GlyRs.
Differences between GABA- and glycine-induced single-channel currents
We show here that GABA and glycine activate single-channel currents having the same unitary conductances. In contrast, the kinetic behaviour of αZ1 GlyR single channels activated by these two agonists is clearly different.
Similarly to that described previously for GlyRs in mouse spinal cord neurons (Twyman & Macdonald, 1991), increasing the concentration of glycine resulted in a marked prolongation of mean burst openings, due to a change in the relative weights of burst time constants (Table 1). However, a comparable increase in the GABA concentration produced a much smaller prolongation of burst openings. Following Colquhoun (1998), these results suggests that glycine stabilizes the open state of GlyR better than GABA.
Our data can be interpreted assuming five possible agonist binding sites due to the proposed pentameric organization of homomeric GlyRs (Kuhse et al. 1993). The four burst time constants observed during glycine applications might correspond to four possible liganded states that lead to channel opening. In this case the highest occupancy of the receptor should result in the longest open time. When the glycine concentration is increased, the percentage of multi-liganded receptors increases, thereby producing a prolongation in mean burst durations. We detected only three burst time populations for GABA-activated single channels, in the tested concentration range (100-500 μm). Possibly, at least at these concentrations, GABA is not able to fully occupy the αZ1 GlyR.
These conclusions are supported by the deactivation time constant results: the current decays following removal of glycine were concentration dependent and about one order of magnitude longer than following GABA removal, even when saturating agonist concentrations were applied. Furthermore, the deactivation time constants for GABA-induced currents were not dependent on GABA concentration.
Previous reports on NMDA receptors showed that deactivation time constants of current decays following glycine removal are not concentration dependent (Johnson & Ascher, 1992; Wang & MacDonald, 1995). Similarly, the AMPA/kainate receptors of rat hippocampal neurons displayed current decays (after a 1 ms pulse of glutamate) not depending on glutamate concentration (Colquhoun et al. 1992). These results are consistent with concentration-independent current decays arising from receptors having only one predominant multi-liganded active state (as for two binding-site receptor channels).
Such a scheme supports the hypothesis that partial occupation of the homomeric αZ1 GlyR leads to channel openings that contribute substantially to the total current. In the case of glycine, the relative weights of the multiple open channel states (partially or fully occupied) would result in the observed concentration dependence of both burst duration and deactivation time constants. Accordingly, GABA may only partially occupy the αZ1 GlyR, and only one active state of the receptor would predominate, resulting in the weak concentration dependence of these two kinetic parameters.
Functional consideration
Our data show that αZ1 homomeric GlyRs, expressed in Xenopus oocytes and in the BOSC 23 human cell line, can be significantly activated by millimolar concentrations of GABA. Previous reports indicate that GABA and glycine can be co-localized in inhibitory presynaptic terminals (Triller et al. 1987b,Ottersen et al. 1987, 1988; Todd & Sullivan, 1990) and that GABAergic presynaptic terminals can be opposed to GlyRs containing postsynaptic membranes, both in goldfish Mauthner cells (Korn et al. 1990), and in rat spinal neurons (Triller et al. 1987a; Todd et al. 1996).
Jonas and co-workers (1998) demonstrated that rat spinal interneurons can co-release GABA and glycine from individual synaptic vesicles. On the other hand, their work suggests that each of these two neurotransmitters act specifically on functionally distinct postsynaptic receptors, excluding the possibility of a direct and physiologically relevant action of GABA on GlyRs during synaptic transmission. It remains to be determined if this conclusion is valid for all vertebrate inhibitory synapses.
Acknowledgments
We wish to thank Professor Philippe Ascher and Professor Peter Jonas for critical reading of the manuscript and valuable suggestions. The expert technical assistance of Philippe Caramelle is highly appreciated. We also thank R. Aasland for the kind gift of the pCMV-GFP-LpA vector. This research was supported by an INSERM grant to S. Fucile.
References
- Akagi H, Miledi R. Heterogeneity of glycine receptors and their messenger RNAs in rat brain and spinal cord. Science. 1988;242:270–273. doi: 10.1126/science.2845580. [DOI] [PubMed] [Google Scholar]
- Baev K, Rusin KI, Safronov BV. Primary receptor for inhibitory transmitters in lamprey spinal cord neurons. Neuroscience. 1992;46:931–941. doi: 10.1016/0306-4522(92)90195-8. [DOI] [PubMed] [Google Scholar]
- Béchade C, Sur C, Triller A. The inhibitory neuronal glycine receptor. BioEssays. 1994;16:735–744. doi: 10.1002/bies.950161008. [DOI] [PubMed] [Google Scholar]
- Bohlhalter S, Mohler H, Fritschy JM. Inhibitory neurotransmission in rat spinal cord: co-localization of glycine- and GABAA-receptors at GABAergic synaptic contacts demonstrated by triple immunofluorescence staining. Brain Research. 1994;642:59–69. doi: 10.1016/0006-8993(94)90905-9. [DOI] [PubMed] [Google Scholar]
- Bormann J, Ründstrom N, Betz H, Langosh D. Residues within transmembrane segment M2 determine chloride conductance of glycine receptor homo- and hetero-oligomers. EMBO Journal. 1993;12:3729–3737. doi: 10.1002/j.1460-2075.1993.tb06050.x. [DOI] [PMC free article] [PubMed] [Google Scholar]
- Bregestovski P, de Saint Jan D, Stinnakre J, Goblet C, David-Watine B, Korn H. Functional characterization of a glycine receptor α1 subunit from zebrafish Danio rerio. Society for Neuroscience Abstracts. 1997;23:152.4. [Google Scholar]
- Colquhoun D. Binding, gating, affinity and efficacy: The interpretation of structure-activity relationships for agonists and of the effects of mutating receptors. British Journal of Pharmacology. 1998;125:924–945. doi: 10.1038/sj.bjp.0702164. [DOI] [PMC free article] [PubMed] [Google Scholar]
- Colquhoun D, Jonas P, Sakmann B. Action of brief pulses of glutamate on AMPA/kainate receptors from different neurones of rat hippocampal slices. The Journal of Physiology. 1992;458:261–287. doi: 10.1113/jphysiol.1992.sp019417. [DOI] [PMC free article] [PubMed] [Google Scholar]
- Colquhoun D, Sakmann B. Fast events in single-channel currents activated by acetylcholine and its analogues at the frog muscle end-plate. The Journal of Physiology. 1985;369:501–557. doi: 10.1113/jphysiol.1985.sp015912. [DOI] [PMC free article] [PubMed] [Google Scholar]
- Colquhoun D, Sigworth B. Fitting and statistical analysis of single-channel records. In: Sakmann B, Neher E, editors. Single-Channel Recording. 3. New York and London: Plenum Press; 1995. pp. 483–585. [Google Scholar]
- David-Watine B, Goblet C, de Saint Jan D, Fucile S, Devignot V, Bregestovski P, Korn H. Cloning, expression and electrophysiological characterization of glycine receptor alpha subunit from zebrafish. Neurosciences. 1999a;90:303–317. doi: 10.1016/s0306-4522(98)00430-8. [DOI] [PubMed] [Google Scholar]
- David-Watine B, Shorte S, Fucile S, de Saint Jan D, Korn H, Bregestovski P. Functional integrity of green fluorescent protein conjugated glycine receptor channels. Neuropharmacology. 1999b. in the Press. [DOI] [PubMed]
- Faber DS, Korn H. Do some M-cell glycine receptors interact with GABA? Society for Neuroscience Abstracts. 1991;17:103.3. [Google Scholar]
- Fucile S, de Saint Jan D, David-Watine B, Bregestovski P. Analysis of glycine/GABA efficacy on the αZ homomeric glycine receptor. European Journal of Neuroscience. 1998;10(suppl. 10):177. 64.09. [Google Scholar]
- Fucile S, Mileo AM, Grassi F, Salvatore AM, Alemà S, Eusebi F. Identification of a determinant of acetylcholine receptor gating kinetics in the extracellular portion of the γ subunit. European Journal of Neuroscience. 1996;8:2564–2570. doi: 10.1111/j.1460-9568.1996.tb01550.x. [DOI] [PubMed] [Google Scholar]
- Hamill OP, Bormann J, Sakmann B. Activation of multiple-conductance state chloride channels in spinal neurones by glycine and GABA. Nature. 1983;305:805–808. doi: 10.1038/305805a0. [DOI] [PubMed] [Google Scholar]
- Jonas P, Bischofberger J, Sandkühler J. Co-realease of two fast neurotransmitters at a central synapse. Science. 1998;281:419–424. doi: 10.1126/science.281.5375.419. 10.1126/science.281.5375.419. [DOI] [PubMed] [Google Scholar]
- Johnson JW, Ascher P. Equilibrium and kinetic study of glycine action on the N-methyl-D-aspartate receptor in cultured mouse brain neurons. The Journal of Physiology. 1992;455:339–365. doi: 10.1113/jphysiol.1992.sp019305. [DOI] [PMC free article] [PubMed] [Google Scholar]
- Kirsch J, Betz H. The postsynaptic localization of the glycine receptor-associated protein gephyrin is regulated by the cytoskeleton. Journal of Neuroscience. 1995;15:4148–4156. doi: 10.1523/JNEUROSCI.15-06-04148.1995. [DOI] [PMC free article] [PubMed] [Google Scholar]
- Korn H, Faber DS, Triller A. Convergence of morphological, physiological and immunocytochemical techniques for the study of single Mauthner cell. In: Björklund A, Höflet T, Wouterlood FG, Van der Pol AN, editors. Handbook of Chemical Neuroanatomy: Analysis of Microcircuitry and Synaptic Interactions. Vol. 8. Amsterdam, The Netherlands.: Elsevier; 1990. pp. 403–480. [Google Scholar]
- Kuhse J, Laube B, Magalei D, Betz H. Assembly of the inhibitory glycine receptor: identification of amino acid sequence motifs governing subunit stoichiometry. Neuron. 1993;11:1049–1056. doi: 10.1016/0896-6273(93)90218-g. 10.1016/0896-6273(93)90218-G. [DOI] [PubMed] [Google Scholar]
- Lavoie AM, Tingey JJ, Harrison NL, Pritchett DB, Twyman RE. Activation and deactivation rates of recombinant GABAA receptor channels are dependent on α-subunit isoform. Biophysical Journal. 1997;73:2518–2526. doi: 10.1016/S0006-3495(97)78280-8. [DOI] [PMC free article] [PubMed] [Google Scholar]
- Legendre P, Korn H. Glycinergic inhibitory synaptic currents and related receptor channels in the zebrafish brain. European Journal of Neuroscience. 1994;6:1544–1557. doi: 10.1111/j.1460-9568.1994.tb00545.x. [DOI] [PubMed] [Google Scholar]
- Legendre P, Korn H. Voltage dependence of conductance changes evoked by glycine release in the zebrafish brain. Journal of Neurophysiology. 1995;73:2404–2412. doi: 10.1152/jn.1995.73.6.2404. [DOI] [PubMed] [Google Scholar]
- Lewis TM, Harkness P, Sivilotti L, Colquhoun D, Millar N. The ion channel properties of a rat neuronal nicotinic receptor are dependent on the host cell type. The Journal of Physiology. 1997;505:299–306. doi: 10.1111/j.1469-7793.1997.299bb.x. [DOI] [PMC free article] [PubMed] [Google Scholar]
- Morales A, Nguyen QT, Miledi R. Electrophysiological properties of newborn and adult rat spinal cord glycine receptors expressed in Xenopus oocytes. Proceedings of the National Academy of Sciences of the USA. 1994;91:3097–3101. doi: 10.1073/pnas.91.8.3097. [DOI] [PMC free article] [PubMed] [Google Scholar]
- Ottersen OP, Davanger S, Storm-Mathisen J. Glycine-like immunoreactivity in the cerebellum of rat and Senegalese baboon, Papio papio: a comparison with the distribution of GABA-like immunoreactivity and with [3H] glycine and [3H] GABA uptake. Experimental Brain Research. 1987;66:211–221. doi: 10.1007/BF00236216. [DOI] [PubMed] [Google Scholar]
- Ottersen OP, Storm-Mathisen J, Somogyi P. Colocalization of glycine-like and GABA-like immunoreactivities in Golgi cell terminals in the rat cerebellum: a postembedding light and electron microscopic study. Brain Research. 1988;450:342–353. doi: 10.1016/0006-8993(88)91573-9. 10.1016/0006-8993(88)91573-9. [DOI] [PubMed] [Google Scholar]
- Rajendra S, Lynch JW, Schofield PR. The glycine receptor. Pharmacology and Therapeutics. 1997;73.2:121–146. doi: 10.1016/s0163-7258(96)00163-5. 10.1016/S0163-7258(96)00163-5. [DOI] [PubMed] [Google Scholar]
- Schmieden V, Kuhse J, Betz H. Agonist pharmacology of neonatal and adult glycine receptor α subunits: identification of amino acid residues involved in taurine activation. EMBO Journal. 1992;11:2025–2032. doi: 10.1002/j.1460-2075.1992.tb05259.x. [DOI] [PMC free article] [PubMed] [Google Scholar]
- Schmieden V, Kuhse J, Betz H. Mutation of glycine receptor subunit creates beta-alanine receptor responsive to GABA. Science. 1993;262:256–258. doi: 10.1126/science.8211147. [DOI] [PubMed] [Google Scholar]
- Takahashi T, Momiyama A, Hirai K, Hishinuma F, Akagi H. Functional correlation of fetal and adult forms of glycine receptors with developmental changes in inhibitory synaptic receptor channels. Neuron. 1992;9:1155–1161. doi: 10.1016/0896-6273(92)90073-m. [DOI] [PubMed] [Google Scholar]
- Taleb O, Betz H. Expression of the human glycine receptor α1 subunit in Xenopus oocytes: apparent affinities of agonists increase at high receptor density. EMBO Journal. 1994;13:1318–1324. doi: 10.1002/j.1460-2075.1994.tb06384.x. [DOI] [PMC free article] [PubMed] [Google Scholar]
- Todd AJ, Sullivan AC. Light microscope study of the coexistence of GABA-like and glycine-like immunoreactivities in the spinal cord of the rat. Journal of Comparative Neurology. 1990;296:496–505. doi: 10.1002/cne.902960312. [DOI] [PubMed] [Google Scholar]
- Todd AJ, Watt C, Spike RC, Sieghart W. Colocalization of GABA, glycine and their receptors at synapses in the rat spinal cord. Journal of Neuroscience. 1996;16:974–982. doi: 10.1523/JNEUROSCI.16-03-00974.1996. [DOI] [PMC free article] [PubMed] [Google Scholar]
- Triller A, Cluzeaud F, Korn H. γ-Aminobutyric acid-containing terminals can be apposed to glycine receptors at central synapses. Journal of Cell Biology. 1987a;104:947–956. doi: 10.1083/jcb.104.4.947. 10.1083/jcb.104.4.947. [DOI] [PMC free article] [PubMed] [Google Scholar]
- Triller A, Seitanadou T, Cluzeaud F, Korn H. Segregated versus overlapping glycinergic and GABAergic afferent systems at a vertebrate identified neuron. Annual Meeting of the Electron Microscopy Society of America. 1987b Abstract. [Google Scholar]
- Twyman RE, Macdonald RL. Kinetic properties of the glycine receptors main- and sub-conductance states of mouse spinal cord neurons in culture. The Journal of Physiology. 1991;435:303–331. doi: 10.1113/jphysiol.1991.sp018512. [DOI] [PMC free article] [PubMed] [Google Scholar]
- Wang LY, MacDonald JF. Modulation by magnesium of the affinity of NMDA receptors for glycine in murine hippocampal neurones. The Journal of Physiology. 1995;486:83–95. doi: 10.1113/jphysiol.1995.sp020792. [DOI] [PMC free article] [PubMed] [Google Scholar]