

Abstract
Na+-K+-2Cl− cotransport (NKCC) was studied in turkey red cells using Na+ dependence or bumetanide sensitivity of 86Rb+ influx to monitor activity of the transporter.
Deoxygenation was the major physiological stimulus for NKCC activity: oxygen tensions (PO2) over the physiological range modulated the transporter, with a PO2 for half-maximal activation of about 41 mmHg (n = 3). In air, activity of NKCC was also stimulated by shrinkage and isoproteronol (isoprenaline, 5 μm). By contrast, in deoxygenated cells, although the transporter activity was markedly elevated, it was no longer sensitive to volume or β-adrenergic stimulation.
Calyculin A, a protein phosphatase inhibitor, stimulated cotransport with a lag of about 5 min. N-Ethylmaleimide (NEM) inhibited cotransport and also blocked the stimulatory effect of calyculin A if administered before calyculin A. Stimulation by calyculin A and deoxygenation were not additive. Staurosporine (2 μm) inhibited deoxygenated-stimulated K+ influxes, but not those stimulated by calyculin A. NEM added during calyculin A stimulation, i.e. during the 5 min lag, caused transport activity to be clamped at levels intermediate between maximal (calyculin A alone) and control. Cells treated with calyculin A alone or with calyculin A followed by NEM were no longer sensitive to volume, isoproteronol or PO2.
The results have characterized the interaction between deoxygenation and other stimuli of NKCC activity. They have also shown that it is possible to manipulate the transporter in a reciprocal way to that shown previously for K+-Cl− cotransport.
The ability to regulate cell volume in the face of perturbation is a commonly observed property of cells (Parker, 1993; Hoffmann & Dunham, 1995). Shrinkage in response to an initial increase in volume is termed regulatory volume decrease (RVD); swelling in response to shrinkage is termed regulatory volume increase (RVI). In the short term, RVI and RVD are carried out by a variety of membrane transport systems, which use pre-existing electrochemical gradients for the dissipative movement of a range of solutes (or osmolytes). Water then passively follows these solutes by osmosis. Volume regulatory capacities, together with the identity of the transport systems, vary with cell type and species. This is well illustrated by examining the pattern of volume regulatory responses found in vertebrate red cells (Cossins & Gibson, 1997), whose ease of procurement and homogeneity have made them a popular choice for the study of such processes.
Avian red cells possess a powerful Na+-K+-2Cl− cotransport system (McManus & Schmidt, 1978; Alper et al. 1980; Kregenow, 1981; Palfrey & Greengard, 1981). In many tissues, this cotransporter can carry out RVI, as well as having a variety of other roles including transepithelial transport and possibly extrarenal K+ regulation (McManus & Schmidt, 1978; Chipperfield, 1986; Haas, 1994; Mount et al. 1998). The cotransporter has been cloned (and termed NKCC), and monoclonal antibodies to it are available, facilitating its study (Haas, 1994; Lytle, 1997). As well as responding to volume, the activity of NKCC in avian red cells is altered by a number of other stimuli including deoxygenation, fluoride, intracellular [Mg2+] and [ATP], and β-adrenergic agonists (Palfrey & Greengard, 1981). These stimuli fall into two groups, those which act via cAMP and those which do not. However, the transport protein per se is the final target of protein phosphorylation, possibly at the same residues regardless of the identity of the stimulus, since, in all cases studied, increased activity of the transporter was correlated with its phosphorylation (Lytle, 1997).
We have shown previously that oxygen tension (PO2) represents the dominant modulator for an RVD system, K+-Cl− cotransport (termed KCC), in red cells from a number of different species (Cossins & Gibson, 1997). In this case, transport activity is stimulated by high PO2 levels. The response to O2 can be blocked by calyculin A (Cossins et al. 1994; Honess et al. 1996), a specific protein phosphatase inhibitor, indicating that a phosphorylation event is involved. We have also demonstrated that it is possible to ‘clamp’ the activity of KCC using sequential addition first of N-ethylmaleimide (NEM), which acts as a protein kinase inhibitor, and then of calyculin A (Cossins et al. 1994; Honess et al. 1996). Under these conditions, transport activity is locked and unresponsive to the usual stimuli, including PO2, swelling and acid.
The responses of RVD systems (e.g. KCC) and RVI systems (e.g. NKCC cotransport) to many experimental manipulations are reciprocal (Parker et al. 1990; Cossins, 1991; Parker, 1994). Thus deoxygenation, which inhibits KCC, has been shown previously to stimulate NKCC in avian red cells (Palfrey & Greengard, 1981). In this report, we demonstrate that deoxygenation, in fact, represents a major stimulus for NKCC, just as oxygenation controls K+-Cl− cotransport, and we investigate its interaction with other stimuli. We also show that a ‘reverse clamp’ could be established with NKCC, treating cells first with calyculin A, then NEM, and again this clamp abolished its ability to respond to any stimulus. Our findings emphasize the reciprocal behaviour of RVD and RVI systems and are relevant to understanding their co-ordinated regulation.
A preliminary account of some of these findings has been published previously (Muzyamba et al. 1999).
METHODS
Materials and salines
Most reagents were purchased from Sigma with the exception of calyculin A from Calbiochem-Novabiochem (Nottingham, UK), 86Rb+ from NEN (Bad Homburg, Germany), and CaCl2, glucose, MgCl2, HNO3, NaOH and sucrose from Merck. The standard turkey saline comprised (mM): 150 NaCl, 2.5 KCl, 5 CaCl2, 10 glucose and 10 Mops, adjusted to pH 7.4 with NaOH. In Cl−-free saline, NO3− salts replaced those containing Cl−; for Na+-free solutions, N-methylglucamine (NMG) replaced NaCl, and pH was adjusted using Tris base. These salines had an osmolality of 330 ± 5 mosmol kg−1 (measured by freezing point depression: Advanced Instruments Inc., Norwood, MA, USA). The average osmolality of turkey plasma was 328 ± 7 mosmol kg−1 (mean ±s.e.m., n = 8). Where required, saline osmolality was altered by addition of water or sucrose solutions (both containing 2.5 mM K+). Stock solutions of ouabain (10 mM) were prepared in distilled water, stored at 4°C and used at 100 μm in all experiments. Stocks of isoproteronol (isoprenaline) (1 mM in water) were prepared freshly for each experiment; bumetanide (10 mM) was prepared daily in Tris base and used at a final concentration of 10 μm. Stock solutions of calyculin (10−5 M) were prepared in 20% DMSO-80% water, stored at -20°C, and normally used at 100 nM. N-Ethylmaleimide (NEM; 100 mM) and dithiothreitol (DTT; 200 mM) were prepared daily in water and used at a final concentration of 1 mM and 2 mM, respectively.
Blood
Turkeys were purchased from commercial turkey farms and used when 1-4 months old. Blood samples were taken by jugular venepuncture into heparinized turkey saline (all procedures were Home Office approved). The samples were then processed as described previously (Gibson et al. 1998). Briefly, blood was centrifuged to separate red cells from plasma and buffy coat, and these were then aspirated. Red cells were then washed three times into turkey saline and held at low haematocrit at 4°C until use. All experiments were carried out on fresh red cells within 24 h of collection.
Tonometry
Prior to flux measurements, red cell suspensions were incubated at about 40% haematocrit in glass tonometers (Eschweiler & Co, Kiel, Germany). Gas mixtures with variable concentrations of O2 and N2 were made using a calibrated gas mixing pump (Wösthoff, Bochum, Germany), warmed to 37°C and fully humidified through three humidifiers in series (Eschweiler & Co.) prior to delivery to the tonometers. Preliminary experiments showed that red cells equilibrated to the delivered gas concentrations in the tonometers within 10 min. Cells were then diluted (1/10) to an haematocrit of about 4% into saline pre-equilibrated at the required PO2 before measurement of K+ influx. In most cases, cells were either oxygenated in air or pure O2, or deoxygenated in pure N2. Haematocrit was measured by the microhaematocrit method before the 10-fold dilution.
Measurement of K+ influx
Ouabain-insensitive K+ influx (with ouabain present at 100 μm in all experiments) was measured by conventional radioactive tracer techniques using 86Rb+ as a tracer for K+. 86Rb+ (final concentration, 0.02-0.05 MBq ml−1) was added to the cell suspension in Cl−-containing or Cl−-free turkey saline. [K+]o was 2.5 mM. Influx was then measured over 5 min, during which time uptake was linear even in cells maximally stimulated with calyculin A, with the exception of the experiment described in Fig. 4, where cumulative uptake was followed against time. In some experiments, e.g. Fig. 6, individual influx measurements were made at various times after a particular manipulation, e.g. change of PO2 or addition of calyculin A. In all cases, fluxes were terminated and samples then processed as described previously (Gibson et al. 1998). Influxes are expressed as millimoles of K+ per litre of cells per hour (mmol (l cells h)−1), and uptake as millimoles of K+ per litre of cells (mmol (l cells)−1). In experiments in which PO2 was varied, the PO2 required to achieve 50% influx measured in the absence of O2 (P50) was estimated.
Figure 4. Effect of calyculin A on K+ uptake into oxygenated turkey red cells.
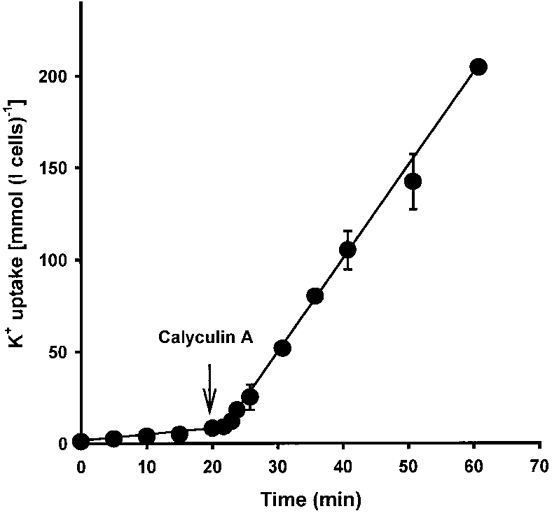
Cells were suspended at low haematocrit (about 4%) in oxygenated saline and 86Rb+ was added at time 0. At the indicated intervals thereafter, aliquots of cells were removed and processed to measure K+ uptake (mmol (l cells)−1) against time. After 20 min, calyculin A (100 nM) was added. Ouabain (100 μm) was present in all cases. Data represent means ±s.d. for triplicate determinations in a single experiment, representative of 3 others.
Figure 6. Effect of ‘clamping’ on K+ influx in turkey red cells.
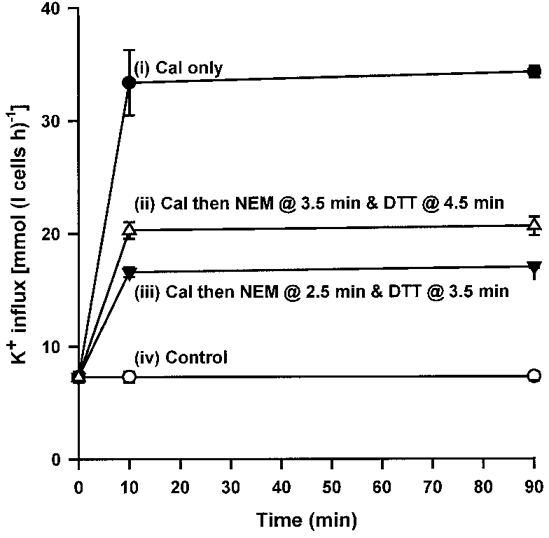
At time 0, aliquots of oxygenated turkey red cells were exposed to (i) calyculin A (Cal; 100 nM) only; (ii) calyculin A followed 3.5 min later by N-ethylmaleimide (NEM; 1 mM) and 4.5 min later by dithiothreitol (DTT; 2 mM); (iii) calyculin A followed 2.5 min later by NEM and 3.5 min later by DTT; or (iv) no drug (control cells). K+ influx (mmol (l cells h)−1) was then measured at the indicated times in the presence of ouabain (100 μm). Data represent means ±s.d. for triplicate determinations in a single experiment, representative of 3 others.
Measurement of cell water content
Cell water content was determined in triplicate using the wet weight/dry weight method (for details see Borgese et al. 1991). Cell water content was expressed as millilitres pre gram of dry cell solids (DCS).
Statistics
Unless otherwise stated, data are expressed as means ± standard error of the mean (s.e.m.) for n birds. Data for some experiments are presented as mean ± standard deviation (s.d.) for triplicate measurements on one turkey and these were representative of similar experiments on at least two further birds.
RESULTS
Modulation of NKCC by physiological stimuli
The magnitude of 86Rb+ influx (hereafter taken to indicate K+ influx) into turkey red cells incubated in oxygenated isotonic saline (control cells) was modest (< 5 mmol (l cells h)−1; e.g. Fig. 1). On deoxygenation, the influx was markedly and rapidly stimulated (5.8 ± 1.9-fold, mean ±s.e.m., n = 3) reaching a high plateau value within 5 min, which was maintained for at least 60 min. The major part (> 95%) of the K+ influx in both control and deoxygenated cells was inhibited by bumetanide (10 μm), and was both Na+- and Cl−-dependent (> 95% in each case), consistent with mediation via NKCC. Figure 1 shows the relationship between oxygen tension (PO2) and K+ influx. K+ influx was stimulated as PO2 was reduced to between 40 and 70 mmHg, peak values were obtained for fully deoxygenated cells, and the PO2 required for half-maximal inhibition of the bumetanide-sensitive K+ influx was about 40 mmHg (41 ± 1, n = 3, estimated by eye). These data show that PO2 values over the physiological range represent a powerful modulator of NKCC.
Figure 1. The effect of oxygen tension on K+ influx in turkey red cells.
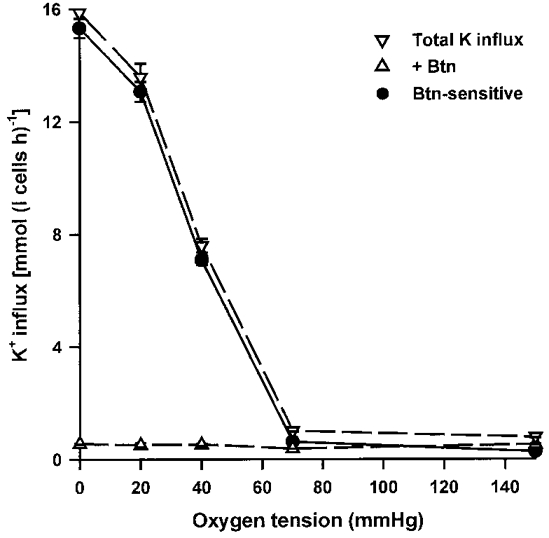
Cells were incubated in tonometers for 15 min at the requisite oxygen tension (PO2). Aliquots of cells were then removed and diluted 10-fold into saline pre-equilibrated at the same gas tension for measurement of K+ influx (mmol (l cells h)−1), in the presence (▵) and absence (▿) of bumetanide (Btn; 10 μm). Bumetanide-sensitive K+ influx is also shown (•). Ouabain (100 μm) was present in all cases. Data represent means ±s.d. for triplicate determinations in a single experiment, representative of 3 others.
Deoxygenation, cell volume and β-adrenergic stimuli
We examined the interaction between PO2 and other stimuli for NKCC. In oxygenated cells, K+ influx was stimulated by anisotonic shrinkage and inhibited by swelling. Ion substitution experiments showed that the volume-sensitive K+ influxes could be inhibited by Na+ substitution but that additional substitution of Cl− (with NO3−) had no further effect, suggesting that the major part of the K+ influx was via NKCC and that there was little KCC activity, or K+-K+ exchange, in these cells (data not shown). The volume sensitivity of K+ influx (defined as influx in cells shrunken by 25%/influx in those swollen by 25%) was 8.0 ± 2.5-fold (mean ±s.e.m., n = 3), with over 95% of the shrinkage-induced K+ influx sensitive to Na+ substitution. Although K+ influx was markedly elevated in cells deoxygenated for 30 min, it showed little volume dependence (mean volume sensitivity was 1.1 ± 0.1, s.e.m., n = 3). A typical experiment is shown in Fig. 2, with K+ influx expressed as a relative influx normalized to that measured in isotonic saline. Similar findings, of decreased volume sensitivity, have been reported following β-adrenergic stimulation of duck red cells (Haas & McManus, 1985).
Figure 2. Volume sensitivity of K+ influx in oxygenated and deoxygenated turkey red cells.
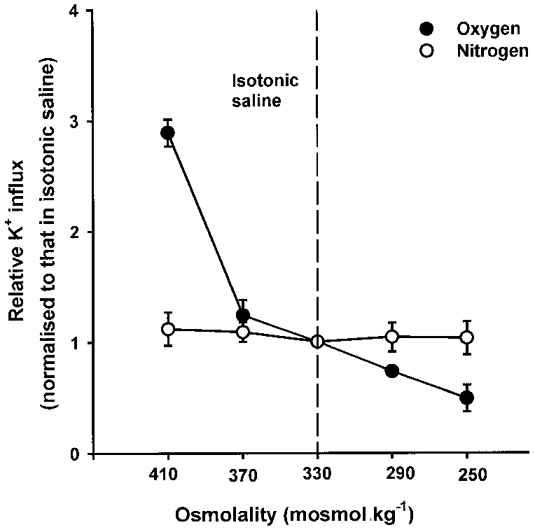
Cells were fully oxygenated (•) or deoxygenated (○) for 30 min in tonometers flushed with O2 or N2, respectively. Aliquots were then diluted into different salines, pre-equilibrated at the same gas tension as the tonometers, at the indicated final osmolalities (changed by addition of water or hypertonic sucrose) to alter cell volume anisotonically. K+ influx (mmol (l cells h)−1) was then measured. Data are presented as influxes normalized to the values measured in isotonic saline, which were 2.04 ± 0.05 and 29.43 ± 0.39 mmol (l cells h)−1 (means ±s.d., n = 3) in oxygenated and deoxygenated cells, respectively. Ouabain (100 μm) was present in all cases. Vertical dashed line indicates osmolality of isotonic saline. Data represent means ±s.d. for triplicate determinations in a single experiment, representative of 3 others.
We also examined the interaction between PO2 and the β-adrenergic agonist isoproteronol. K+ influx in cells held in air was stimulated 10 ± 2-fold (influx in presence of drug/influx in absence: mean ±s.e.m., n = 3) by addition of isoproteronol (5 μm). Following deoxygenation, although the K+ influx was much higher, the additional stimulation by isoproteronol was markedly reduced (Fig. 3), in a similar way to shrinkage-induced K+ influx.
Figure 3. Isoproteronol sensitivity of K+ influx in oxygenated and deoxygenated turkey red cells.
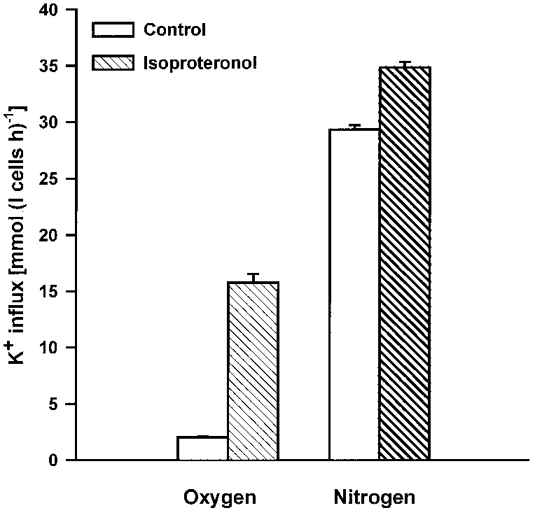
Cells were fully oxygenated or deoxygenated for 30 min in tonometers flushed with O2 or N2, respectively. Aliquots were then diluted into different salines, pre-equilibrated at the same gas tension as the tonometers, with or without addition of isoproteronol (5 μm). K+ influx (mmol (l cells h)−1) was measured 10 min later. Ouabain (100 μm) was present in all cases. Data represent means ±s.d. for triplicate determinations in a single experiment, representative of 3 others.
Modulation of NKCC by protein kinase and protein phosphatase inhibitors
The effect of calyculin A on K+ influx
Calyculin A, a specific protein phosphatase (PP) inhibitor, is a potent stimulus for NKCC in avian red cells (Palfrey & Pewitt, 1993). Figure 4 shows a time course of its effect on K+ uptake in oxygenated turkey red cells. Uptake in control cells was low, about 5 mmol (l cells h)−1, but this was markedly and rapidly stimulated by addition of calyculin A (100 nM). The stimulated rate was maintained for at least 60 min but there was a short lag period before the full effect of calyculin A was observed, about 5 min in Fig. 4. This lag probably represents the time taken for a protein kinase (PK) or kinases (PKs) to phosphorylate fully the amino acid residues controlling NKCC after inhibition of the opposing PP (Lytle, 1998). The influxes in the presence of calyculin A were bumetanide-sensitive and Na+-dependent: in a typical experiment, K+ influx with calyculin A was 27.5 ± 1.2 mmol (l cells h)−1, and this was reduced to 0.5 ± 0.1 with bumetanide and to 3.5 ± 0.1 by Na+ substitution (all means ±s.d., n = 3).
Interaction of calyculin A, staurosporine and deoxygenation
The above shows how a PP inhibitor, caylculin A, stimulated NKCC in turkey red cells. In this section, we examined how calyculin A interacted with deoxygenation-stimulated K+ influxes and with a PK inhibitor, staurosporine (Fig. 5). In deoxygenated cells, the incremental stimulation by calyculin A (100 nM) was reduced relative to that seen in oxygenated cells (about 2- cf. 6-fold). Deoxygenation-stimulated K+ influx was fully inhibited by addition of staurosporine (2 μm). By contrast, calyculin A-stimulated K+ influx was insensitive to subsequent addition of staurosporine. When added prior to calyculin A, staurosporine abolished the stimulatory action of this PP inhibitor and K+ influx was minimal. In these respects, the PK inhibitor staurosporine behaves like NEM (see later).
Figure 5. Effect of calyculin A and staurosporine on K+ influx in oxygenated and deoxygenated turkey red cells.
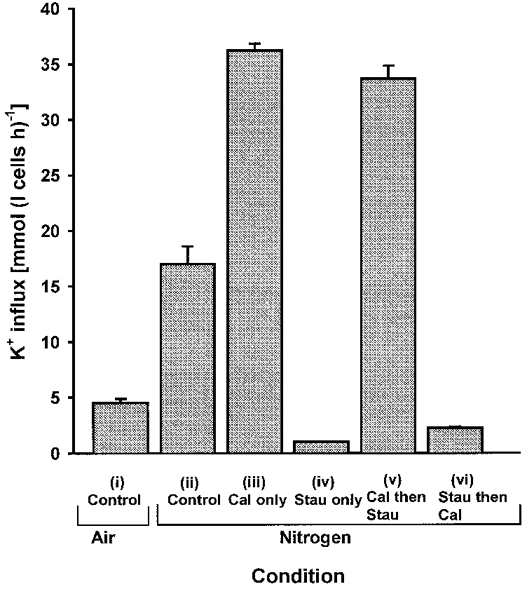
K+ influx (mmol (l cells h)−1) was measured in control cells, under both (i) oxygenated and (ii) deoxygenated conditions; and in deoxygenated cells treated with protein phosphatase and/or protein kinase inhibitors: (iii) calyculin A (Cal; 100 nM) alone, (iv) staurosporine (Stau; 2 μm) alone, and (v and vi) the two in combination with staurosporine added 10 min after calyculin A. Ouabain (100 μm) was present in all cases. Data represent means ±s.d. for triplicate determinations in a single experiment, representative of 3 others.
With the exception of the reduced stimulation by calyculin A, similar responses to the various inhibitors were observed in oxygenated cells (data not shown).
Interaction of calyculin A, N-ethylmaleimide and dithiothreitol
N-Ethylmaleimide (NEM) also modulates the actitivity of electroneutral cotransporters such as NKCC and KCC. Although a non-specific-SH reagent, it appears to behave as a PK inhibitor and antagonizes the effect of calyculin A (Cossins et al. 1994; Honess et al. 1996; Lytle, 1998). The interaction of calyculin A and NEM was examined in turkey red cells. When added prior to calyculin A, NEM largely abrogated stimulation by calyculin A: e.g. calyculin A added after NEM produced an influx of 1.93 ± 0.11 mmol (l cells h)−1 (mean ±s.d., n = 3) compared to 60.88 ± 1.10 with calyculin A alone. This is consistent with an effect of NEM as the inhibitor of the conjugate PK, opposing the calyculin A-sensitive PP. However, NEM also inhibited the K+ influx when added after the maximal stimulation induced by calyculin A had been reached (data not shown), although the extent and rate of this inhibition was variable. It is possible that prolonged incubation with NEM could produce a non-specific inhibition of proteins including membrane transporters (Lauf & Adragna, 1995). We attempted to resolve these two actions of NEM (on stimulatory and inhibitory thiol groups) by incubating the cells at low temperature or by removing unreacted NEM with dithiothreitol (DTT), cf. Lauf & Adragna (1995). Reaction of turkey red cells with NEM at 0°C, followed by washing to remove unreacted drug, partially prevented NEM inhibition of calyculin A-stimulated K+ influx, but again results were variable (data not shown). Addition of DTT (2 mM), 1 min after NEM (1 mM), however, abolished the inhibitory effect of NEM when added after calyculin A stimulation was complete, but did not prevent NEM inhibition when added before calyculin A. For example, K+ influx in cells treated with calyculin A only was 34.4 ± 0.9 mmol (l cells h)−1 (means ±s.d., n = 3); that in cells treated with calyculin A then exposed 10 min later to NEM for 1 min followed by DTT, was 29.3 ± 0.2. In subsequent experiments, DTT was added 1 min after NEM in all cases to prevent the secondary inhibition of influx.
‘Clamping’ and its effect on physiological stimuli of NKCC
Establishment of a ‘reverse clamp’
We have shown that calyculin A stimulated NKCC with a lag of about 5 min before maximal influxes are reached. The effect of adding NEM during this phase was investigated. Typical results are shown in Fig. 6. Control influxes were low; those in cells exposed to calyculin A only were maximal. NEM added during the calyculin A activation process prevented any further increase in influx. The presence of both a PP inhibitor (calyculin A) and a PK inhibitor (NEM) prevents further change in the phosphorylation status of the transporter (or any regulatory proteins) and clamped transport activity. The magnitude of the influx depended on the time interval between exposure to calyculin A and NEM: the longer the interval, the higher the influxes. By this means, the influx could be clamped at any level between minimal, control values and the maximal level reached with calyculin A alone. We refer to this state as the ‘reverse phosphorylation clamp’, compared to the ‘phosphorylation clamp’ of KCC in trout red cells (Cossins et al. 1994). Figure 6 also shows that in all cases (control, calyculin A alone, calyculin A-NEM combinations), influxes were stable for at least 60 min. In addition, in all cases, K+ influxes were largely (> 95%) bumetanide sensitive and Na+ dependent (data not shown), consistent with mediation via NKCC.
Response of ‘clamped’ cells to volume, oxygen tension and β-adrenergic stimulation
In this section, we took control cells, those treated with calyculin A only, and those clamped at intermediate activities (through combinations of calyculin A followed by NEM), and observed their response to different stimuli. Figure 7 shows the effect of alteration in cell volume anisotonically in saline equilibrated with air. K+ influxes are given normalized to the value found in isotonic saline, for all three osmolalities. Control cells showed the usual response to volume change, with K+ influx stimulated by shrinkage and slightly inhibited by swelling. By contrast, K+ influx in cells treated with calyculin A only, or calyculin A followed by NEM, showed no response to volume perturbation. Figure 8 shows a similar pattern for deoxygenation- and isoproteronol-stimulated K+ influxes. In this case, K+ influxes were normalized to the values found in air for the three different conditions (control, calyculin A only, calyculin A-NEM combinations). Control cells responded to deoxygenation or addition of isoproteronol with marked stimulation of K+ influx. K+ influx in cells treated only with calyculin A showed no response to deoxygenation or isoproteronol; those treated with calyculin A followed by NEM did not respond to isoproteronol but show a slight stimulation on deoxygenation. We conclude that clamping with calyculin A and NEM largely abolishes the response of NKCC to physiological stimuli.
Figure 7. Effect of ‘clamping’ on volume sensitivity of K+ influx in turkey red cells.
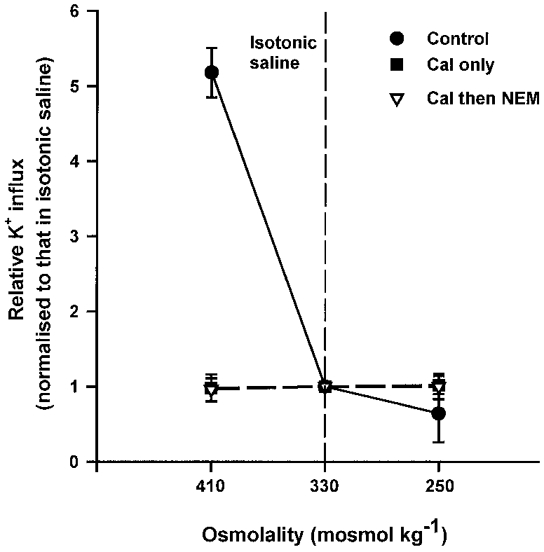
Aliquots of oxygenated turkey red cells were treated in the same way as described in Fig. 6. The osmolality of their saline was then adjusted by addition of water or hypertonic sucrose to alter cell volume anisotonically before measurement of K+ influx (mmol (l cells h)−1). Data are presented as influxes normalized to the values measured in isotonic saline - these were 1.10 ± 0.05, 37.75 ± 1.58 and 27.43 ± 0.82 mmol (l cells h)−1 (means ±s.d., n = 3), respectively, for control cells and those treated with calyculin A alone or with calyculin A followed by NEM. Ouabain (100 μm) was present in all cases. Vertical dashed line indicates osmolality of isotonic saline. Data represent means ±s.d. for triplicate determinations in a single experiment, representative of 3 others.
Figure 8. Effect of ‘clamping’ on sensitivity of K+ influx in turkey red cells to oxygen tension and isoproteronol.
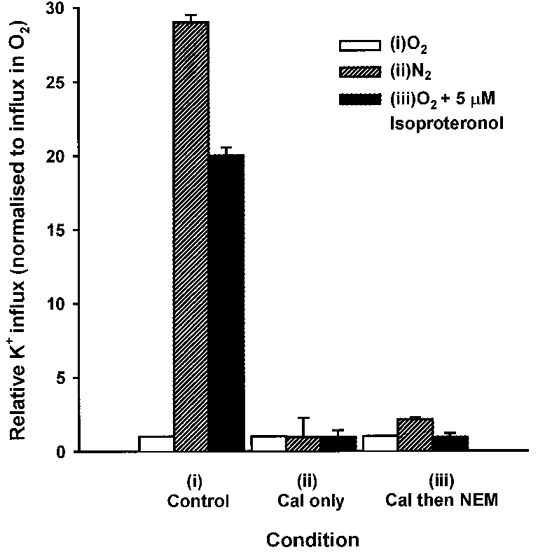
Aliquots of oxygenated cells were treated in the same way as described in Fig. 6. They were then either (i) kept in O2, (ii) incubated in N2 until fully deoxygenated, or (iii) kept in O2 but treated with isoproteronol (5 μm) for 10 min, before measurement of K+ influx (mmol (l cells h)−1). Data are presented as influxes normalized to the values measured in oxygenated saline - these were 0.8 ± 0.1, 36.5 ± 0.4 and 5.9 ± 0.3 mmol (l cells h)−1 (means ±s.d., n = 3), respectively, for control cells and those treated with calyculin A alone or with calyculin A followed by NEM. Ouabain (100 μm) was present in all cases. Data represent means ±s.d. for triplicate determinations in a single experiment, representative of 3 others.
DISCUSSION
The results presented here characterize the response of NKCC in turkey red cells to oxygen tension (PO2) and inhibitors of protein phosphatases (PPs) and kinases (PKs). We show that low PO2 provided a more powerful stimulus than shrinkage or β-adrenergic agonists: sensitivity to volume and isoproteronol were much reduced following stimulation by deoxygenation. We also show that a ‘reverse clamp’ could be established using combinations of PP and PK inhibitors, in a similar, but reciprocal way, to that achieved for KCC activity in trout and horse red cells. These results are important for understanding the mechanisms by which the red cells integrate their response to different stimuli and co-ordinate volume regulatory processes.
Oxygen tension as a control of red cell electroneutral membrane transporters
There were early indications that K+ permeability of duck red cells was altered by PO2, with K+ fluxes stimulated markedly by deoxygenation (Tosteson & Robertson, 1956). It has now become apparent that many electroneutral transport systems in vertebrate red cells respond to changes in PO2 (e.g. NKCC in turkey: Palfrey & Greengard, 1981; β-NHE in trout: Motais et al. 1987; Nikinmaa et al. 1987b; and KCC in trout: Borgese et al. 1991).
The response of KCC to O2 has been well characterized in trout (Nielsen et al. 1992; Cossins et al. 1994) and other species (carp: Jensen, 1992; horse: Gibson et al. 1993; Speake et al. 1997; sheep: Campbell & Gibson, 1998; human HbA and HbS red cells: Gibson et al. 1998). Physiological PO2 levels activate the cotransporter (Nielsen et al. 1992; Honess et al. 1996; Speake et al. 1997) and are required before it can respond to other stimuli such as swelling, acid or urea. O2 also provides a major influence in regulation of the β-NHE of trout red cells, with deoxygenation stimulating the transporter (Motais et al. 1987). A similar situation may occur in frog (Kaloyianni & Rasidaki, 1996) and carp (Nikinmaa et al. 1987a; Salama & Nikinmaa, 1988) red cells.
Deoxygenation increases the activity of NKCC in avian red cells (Palfrey & Greengard, 1981), but the reponse has not been extensively investigated. We show here that a bumetanide-sensitive K+ influx in turkey red cells was markedly stimulated by low PO2 levels, indicative of mediation via the NKCC. Unlike duck red cells, there appeared to be little K+-K+ exchange, as this influx was also inhibited by Na+ removal (c.f. Lytle et al. 1998). We show that deoxygenation represents a more powerful stimulus than isoproteronol or shrinkage. However, deoxygenation was not a prerequisite for cotransporter activity, and NKCC in oxygenated cells could respond modestly to shrinkage and very well to isoproteronol. As for KCC, physiological PO2 levels modulated activity and a possible role may be sequestration of plasma K+, e.g. in blood vessels of active muscle beds, assuming favourable ion gradients (McManus & Schmidt, 1978; Haas & McManus, 1985) and a low PO2.
The behaviour of these electroneutral transport systems in red cells from several species illustrates a primary role for O2 in control of cotransporter activity, conserved across different vertebrate classes and for both RVD and RVI systems. The mechanism of this response probably requires changes in protein phosphorylation (see below) but is otherwise not well understood (see Gibson et al. 1998 for a recent discussion of this topic).
Protein phosphorylation and control of turkey red cell NKCC
Protein phosphorylation is correlated with increased activity of NKCC in avian red cells. Treatment with PP inhibitors (calyculin A, okadaic acid, fluoride) stimulates the transporter and, conversely, PK inhibitors (K252a, staurosporine, N-ethylmaleimide, Mg2+ or ATP depletion) abrogate transport (Pewitt et al. 1990; Palfrey & Pewitt, 1993; Lytle, 1997, 1998). With the introduction of monoclonal antibodies to NKCC, it has been possible to determine unequivocally that the transporter per se is phosphorylated and to correlate the extent of phosphorylation with transporter activity. Different modalities of stimuli (cAMP, shrinkage and fluoride), whether cAMP-dependent or not, were all associated with increased phosphoresidues at four common sites on the transporter, suggesting that a final common PK or several PKs are involved in modulation of the transporter (Lytle, 1997).
In the case of KCC, increased activity is associated with dephosphorylation. PK inhibitors stimulate transport activity (Delpire & Lauf, 1991; Dunham et al. 1993; Cossins et al. 1994), while PP inhibitors reduce it (Jennings & Al-Rohil, 1990; Kaji & Tsukitani, 1991). Like NKCC, KCC has now been cloned. It contains consensus residues for phosphorylation (Gillen et al. 1996; Pellegrino et al. 1998) but, to date, the identity of the regulatory PP/PK enzymes, or whether KCC per se is their target, remains unknown. It is possible to clamp the activity of KCC (at any level) by adding calyculin A during the process of NEM stimulation, which is slow (Cossins et al. 1994; Honess et al. 1996; Speake & Gibson, 1997). The transporter is then unresponsive to the usual stimuli, e.g. swelling, acid or high PO2. Our interpretation of these observations was that NEM acts as a PK inhibitor, leading to slow stimulation as the transporter is dephosphorylated, and that subsequent addition of calyculin prevented the conjugate protein phosphatases from further dephosphorylating its target, producing a maintained phosphorylation state. We termed this the ‘phosphorylation clamp’. In support of this interpretation, NEM has now been shown to block phosphorylation of NKCC in avian red cells (Lytle, 1998).
In the experiments described here, we attempted to establish a ‘reverse phosphorylation clamp’ on the RVI system of NKCC in turkey red cells - ‘reverse’ because this system must first be stimulated with calyculin A then inhibited with NEM. Although it was easy to show that NEM added before calyculin A abolished the stimulation by calyculin A, we encountered two problems. First, we found a variable inhibitory effect of NEM, even after full activation with calyculin A, which was probably non-specific, mediated by reactions of NEM with thiol groups on NKCC (or some other target) rather than the regulatory PK (Lauf & Adragna, 1995; Lytle, 1998). This effect could be abolished at low temperature (KCC in sheep red cells: Lauf & Adragna, 1995) or at low concentrations (< 0.75 mM) of NEM (NKCC in duck red cells: Lytle, 1998). In our hands, neither of these procedures was fully effective but we were able to abolish this secondary inhibitory action of NEM by adding DTT shortly (1 min) after NEM to prevent further thiol reactions. Second, stimulation by calyculin A was very rapid, making it more difficult to clamp activity half-way between full and zero than was the case with KCC and requiring careful timing of addition of inhibitors. Recent work by Lytle suggesting autophosphorylation of a protein kinase regulating NKCC may explain these findings (Lytle, 1998). Using these methods, we were able to demonstrate that NEM added during calyculin A stimulation stopped further increase in activity of NKCC and maintained it at the level reached when NEM was added. The clamped flux was stable for at least 60 min. NKCC was then unresponsive to physiological stimuli, including volume, isoproteronol and PO2. We also show that K+ influxes stimulated by deoxygenation were fully sensitive to PK inhibition using staurosporine, those stimulated pharmacologically with calyculin A were not. These findings suggest that, like the other modalities of stimuli (shrinkage, etc.), deoxygenation is also mediated by phosphorylation of NKCC. Our work, however, does not unequivocally show changes or the lack of them in the phosphorylation state of the transporter and this represents an important caveat. Now that it is possible to investigate the phosphorylation state of NKCC directly (Lytle, 1997, 1998), obvious experiments would be to determine the effects of both deoxygenation and the ‘reverse clamp’ on the phosphoresidues of this transporter.
Reciprocal response of RVD and RVI
The observations early in the 1990s that KCC was inhibited by PP inhibition (Jennings & Schulz, 1991; Kaji & Tsukitani, 1991), whilst NKCC was stimulated (Pewitt et al. 1990), led to the proposal that regulation was in fact co-ordinated (Parker et al. 1990; Cossins, 1991), with the same set of enzymes controlling both regulatory volume effector (RVE) processes. Such co-ordination would help to prevent RVI and RVD systems being active together, serving merely to dissipate solute gradients without useful work. Conversely, there could be two sets of enzymes each acting independently on the opposing transporters. The work of Parker and colleagues, in particular, has greatly strengthened the concept of reciprocal behaviour showing that, in red cells from several species, RVI and RVD respond in an opposite manner to a range of different manipulations including volume, Mg2+, lithium, PP/PK inhibitors, macromolecular concentration and ionic strength (see Parker, 1994 for references). The work reported here showing a reciprocal clamp adds to this body of work. It will facilitate identification and characterization of the enzymes involved in the transduction pathways controlling RVE processes.
Acknowledgments
We thank The Wellcome Trust for financial support. M. C. M. holds a Beit Fellowship and an ORS award.
References
- Alper SL, Palfrey HC, DeReimer SA, Greengard P. Hormonal control of protein phosphorylation in turkey erythrocytes. Journal of Biological Chemistry. 1980;255:11029–11039. [PubMed] [Google Scholar]
- Borgese F, Motais R, Garcia-Romeu F. Regulation of Cl-dependent K transport by oxy-deoxyhemoglobin transitions in trout red cells. Biochimica et Biophysica Acta. 1991;1066:252–256. doi: 10.1016/0005-2736(91)90194-d. [DOI] [PubMed] [Google Scholar]
- Campbell EH, Gibson JS. Oxygen-dependent K+ fluxes in sheep red cells. The Journal of Physiology. 1998;506:679–688. doi: 10.1111/j.1469-7793.1998.679bv.x. [DOI] [PMC free article] [PubMed] [Google Scholar]
- Canessa M, Fabry ME, Nagel RL. Deoxygenation inhibits the volume-stimulated Cl−-dependent K efflux in SS and young AA cells: a cytoplasmic Mg2+ modulation. Blood. 1987;70:1861–1866. [PubMed] [Google Scholar]
- Chipperfield AR. The (Na+-K+-Cl−) co-transport system. Clinical Science. 1986;71:465–476. doi: 10.1042/cs0710465. [DOI] [PubMed] [Google Scholar]
- Cossins AR. A sense of cell size. Nature. 1991;352:667–668. doi: 10.1038/352667a0. [DOI] [PubMed] [Google Scholar]
- Cossins AR, Gibson JS. Volume-sensitive transport systems and volume homeostasis in vertebrate red blood cells. Journal of Experimental Biology. 1997;200:343–352. doi: 10.1242/jeb.200.2.343. [DOI] [PubMed] [Google Scholar]
- Cossins AR, Weaver YR, Lykkeboe G, Nielsen OB. Role of protein phosphorylation in control of K flux pathways of trout red blood cells. American Journal of Physiology. 1994;267:C1641–1650. doi: 10.1152/ajpcell.1994.267.6.C1641. [DOI] [PubMed] [Google Scholar]
- Delpire E, Lauf PK. Magnesium and ATP dependence of K-Cl co-transport in low K+ sheep red blood cells. The Journal of Physiology. 1991;441:219–231. doi: 10.1113/jphysiol.1991.sp018747. [DOI] [PMC free article] [PubMed] [Google Scholar]
- Dunham PB, Klimczak J, Logue PJ. Swelling activation of K-Cl cotransport in LK sheep erythrocytes: a three-state process. Journal of General Physiology. 1993;101:733–766. doi: 10.1085/jgp.101.5.733. 10.1085/jgp.101.5.733. [DOI] [PMC free article] [PubMed] [Google Scholar]
- Gibson JS, Ellory JC, Culliford SJ, Fincham DA. Volume-sensitive KCl co-transport and taurine fluxes in horse red blood cells. Experimental Physiology. 1993;78:685–695. doi: 10.1113/expphysiol.1993.sp003716. [DOI] [PubMed] [Google Scholar]
- Gibson JS, Speake PF, Ellory JC. Differential oxygen sensitivity of the K+-Cl− cotransporter in normal and sickle human red blood cells. The Journal of Physiology. 1998;511:225–234. doi: 10.1111/j.1469-7793.1998.225bi.x. [DOI] [PMC free article] [PubMed] [Google Scholar]
- Gillen CM, Brill S, Payne JA, Forbusch IB. Molecular cloning and functional expression of the KCl cotransporter from rabbit, rat and human. Journal of Biological Chemistry. 1996;217:16237–16244. doi: 10.1074/jbc.271.27.16237. [DOI] [PubMed] [Google Scholar]
- Haas M. The Na-K-Cl cotransporters. American Journal of Physiology. 1994;267:C869–885. doi: 10.1152/ajpcell.1994.267.4.C869. [DOI] [PubMed] [Google Scholar]
- Hass M, McManus TJ. Effect of norepinephrine on swelling-induced potassium transport in duck red cells. Journal of General Physiology. 1985;85:649–667. doi: 10.1085/jgp.85.5.649. 10.1085/jgp.85.5.649. [DOI] [PMC free article] [PubMed] [Google Scholar]
- Hoffmann EK, Dunham PB. Membrane mechanisms and intracellular signalling in cell volume regulation. International Review of Cytology. 1995;161:173–262. doi: 10.1016/s0074-7696(08)62498-5. [DOI] [PubMed] [Google Scholar]
- Honess NA, Gibson JS, Cossins AR. The effects of oxygenation upon the Cl-dependent K flux pathway in equine red cells. Pflügers Archiv. 1996;432:270–277. doi: 10.1007/s004240050133. [DOI] [PubMed] [Google Scholar]
- Jennings ML, Al-Rohil N. Kinetics of activation and inactivation of swelling-stimulated K/Cl transport: The volume-sensitive parameter is the rate constant for inactivation. Journal of General Physiology. 1990;95:1021–1040. doi: 10.1085/jgp.95.6.1021. [DOI] [PMC free article] [PubMed] [Google Scholar]
- Jennings ML, Schulz RK. Okadaic acid inhibition of KCL cotransport: evidence that protein dephosphorylation is necessary for activation of transport by either swelling or N-ethylmaleimide. Journal of General Physiology. 1991;97:799–817. doi: 10.1085/jgp.97.4.799. [DOI] [PMC free article] [PubMed] [Google Scholar]
- Jensen FB. Influence of haemoglobin conformation, nitrite and eicosanoids on K+ transport across the carp red blood cell membrane. Journal of Experimenal Biology. 1992;171:349–371. [Google Scholar]
- Kaji DM, Tsukitani Y. Role of protein phosphorylation in activation of KCl cotransport in human erythrocytes. American Journal of Physiology. 1991;260:C178–182. doi: 10.1152/ajpcell.1991.260.1.C176. [DOI] [PubMed] [Google Scholar]
- Kaloyianni M, Rasidaki A. Adrenergic responses of Rana ridibunda red cells. Journal of Experimental Zoology. 1996;276:175–185. doi: 10.1002/(SICI)1097-010X(19961015)276:3<175::AID-JEZ1>3.0.CO;2-K. [DOI] [PubMed] [Google Scholar]
- Kregenow FM. Osmoregulatory salt transporting mechanisms. Control of cell volume in anisotonic media. Annual Review of Physiology. 1981;43:493. doi: 10.1146/annurev.ph.43.030181.002425. [DOI] [PubMed] [Google Scholar]
- Lauf PK, Adragna NC. Temperature-induced functional deocclusion of thiols inhibitory for sheep erythrocyte K-Cl cotransport. American Journal of Physiology. 1995;269:C1167–1175. doi: 10.1152/ajpcell.1995.269.5.C1167. [DOI] [PubMed] [Google Scholar]
- Lytle C. Activation of the avian erythrocyte Na-K-Cl cotransport protein by cell shrinkage, cAMP, fluoride, and calyculin-A involves phosphorylation at common sites. Journal of Biological Chemistry. 1997;272:15069–15077. doi: 10.1074/jbc.272.24.15069. [DOI] [PubMed] [Google Scholar]
- Lytle C. A volume-sensitive protein kinase regulates the Na-K-2Cl cotransporter in duck red blood cells. American Journal of Physiology. 1998;274:C1002–1010. doi: 10.1152/ajpcell.1998.274.4.C1002. [DOI] [PubMed] [Google Scholar]
- Lytle C, McManus TJ, Haas M. A model of Na-K-2Cl cotransport based on ordered ion binding and glide symmetry. American Journal of Physiology. 1998;274:C299–309. doi: 10.1152/ajpcell.1998.274.2.C299. [DOI] [PubMed] [Google Scholar]
- McManus TJ, Schmidt WFI. Ion and co-ion transport in avian red cells. Membrane Transport Processes. 1978;1:79–106. [Google Scholar]
- Motais R, Garcia-Romeu F, Borgese F. The control of Na/H exchange by molecular oxygen in trout erythrocytes. Journal of General Physiology. 1987;90:197–207. doi: 10.1085/jgp.90.2.197. [DOI] [PMC free article] [PubMed] [Google Scholar]
- Mount DB, Delpire E, Gamba G, Hall AE, Poch E, Hoover RSJ, Hebert SC. The electroneutral cation-chloride cotransporters. Journal of Experimental Biology. 1998;201:2091–2102. doi: 10.1242/jeb.201.14.2091. [DOI] [PubMed] [Google Scholar]
- Muzyamba MC, Cossins AR, Gibson JS. Response of Na+-K+-2Cl− cotransport in turkey red cells to physiological stimuli: effect of ‘phosphorylation clamping’. The Journal of Physiology. 1999;513.P:56. doi: 10.1111/j.1469-7793.1999.0421t.x. P. [DOI] [PMC free article] [PubMed] [Google Scholar]
- Nielsen OB, Lykkeboe G, Cossins AR. Oxygenation-activated K+ fluxes in trout red blood cells. American Journal of Physiology. 1992;263:C1057–1064. doi: 10.1152/ajpcell.1992.263.5.C1057. [DOI] [PubMed] [Google Scholar]
- Nikinmaa M, Cech JJJ, Ryhanen E-L, Salama A. Red cell function of carp (Cyprinus carpio) in acute hypoxia. Experimental Biology. 1987a;47:53–58. [PubMed] [Google Scholar]
- Nikinmaa M, Steffensen JF, Tufts BL, Randall DJ. Control of red cell volume and pH in trout: effects of isoproteronol, transport inhibitors, and extracellular pH in bicarbonate/carbon dioxide-buffered media. Journal of Experimental Zoology. 1987b;242:273–281. [Google Scholar]
- Palfrey HC, Greengard P. Hormone-sensitive ion transport systems in erythrocytes as models for epithelial ion pathways. Annual Proceedings of the New York Academy of Sciences. 1981;372:291–309. doi: 10.1111/j.1749-6632.1981.tb15482.x. [DOI] [PubMed] [Google Scholar]
- Palfrey HC, Pewitt EB. The ATP and Mg2+ dependence of Na+-K+-2Cl− cotransport reflects a requirement for protein phosphorylation: studies using calyculin A. Pflügers Archiv. 1993;425:321–328. doi: 10.1007/BF00374182. [DOI] [PubMed] [Google Scholar]
- Parker JC. In defense of cell volume? American Journal of Physiology. 1993;265:C1191–1200. doi: 10.1152/ajpcell.1993.265.5.C1191. [DOI] [PubMed] [Google Scholar]
- Parker JC. Coordinated regulation of volume-activated transport pathways. In: Strange K, editor. Cellular and Molecular Physiology of Volume Regulation. Boca Raton, FL, USA: CRC Press, Inc.; 1994. pp. 311–321. [Google Scholar]
- Parker JC, McManus TJ, Starke LC, Gitelman HJ. Coordinated regulation of Na/H exchange and K-Cl cotransport in dog red cells. Journal of General Physiology. 1990;96:1141–1152. doi: 10.1085/jgp.96.6.1141. [DOI] [PMC free article] [PubMed] [Google Scholar]
- Pellegrino CM, Rybicki AC, Musto S, Nagel RL, Schwartz RS. Molecular identification of erythroid K:Cl cotransporter in human and mouse erythroleukemic cells. Blood Cells, Molecules and Diseases. 1998;24:31–40. doi: 10.1006/bcmd.1998.0168. [DOI] [PubMed] [Google Scholar]
- Pewitt EB, Hedge RS, Haas M, Palfrey HC. The regulation of Na/K/2Cl cotransport and bumetanide binding in avian erythrocytes by protein phosphorylation and dephosphorylation. Journal of Biological Chemistry. 1990;265:20747–20756. [PubMed] [Google Scholar]
- Salama A, Nikinmaa M. The adrenergic responses of carp (Cyprinus carpio) red cells: effects of PO2 and pH. Journal of Experimental Biology. 1988;136:405–416. doi: 10.1242/jeb.136.1.405. [DOI] [PubMed] [Google Scholar]
- Speake PF, Gibson JS. Urea-stimulated K-Cl cotransport in equine red blood cells. Pflügers Archiv. 1997;434:104–112. doi: 10.1007/s004240050369. [DOI] [PubMed] [Google Scholar]
- Speake PF, Roberts CA, Gibson JS. Effect of changes in respiratory blood parameters on equine red blood cell K-Cl cotransporter. American Journal of Physiology. 1997;273:C1811–1818. doi: 10.1152/ajpcell.1997.273.6.C1811. [DOI] [PubMed] [Google Scholar]
- Tosteson DC, Robertson JS. Potassium transport in duck red cells. Journal of Cellular and Comparative Physiology. 1956;47:147–166. doi: 10.1002/jcp.1030470110. [DOI] [PubMed] [Google Scholar]