

Abstract
The cell-attached configuration of the patch-clamp technique was used to assess resting membrane potential and firing threshold of CA1 pyramidal cells and interneurones of rat hippocampal slices.
Resting potential was inferred from the reversal potential of voltage-gated K+ currents with symmetrical intracellular and pipette K+ concentrations. Its mean value was −74 ± 9 mV for silent interneurones (mean ± s.d.; n = 17) and −84 ± 7 mV for silent pyramidal cells (n = 8). Spontaneous action currents occurred in thirteen out of thirty-two interneurones and two out of ten pyramidal cells. In active cells, membrane potential values fluctuated by up to 20 mV, due in part to the large hyperpolarizations that followed an action current.
Membrane potential values determined from K+ current reversal were 13 ± 6 mV more hyperpolarized than those measured in whole-cell recordings from the same neurones (n = 8), probably due to a Donnan equilibrium potential between pipette and cytoplasm.
Firing threshold of silent cells was determined by elevating external K+ until action currents were generated, while membrane potential was monitored from the cell-attached K+ current reversal. Spike threshold was attained at −49 ± 8 mV for interneurones (n = 17) and at −60 ± 8 mV for pyramidal cells (n = 8). Increasing external Ca2+ from 2 to 4 mM shifted the neuronal voltage threshold by +5 mV, without affecting resting potential.
For comparison with these values, we examined how the rate of membrane polarization influenced firing threshold in whole-cell records. Ramp current injections, of duration 15–1500 ms, revealed that current threshold followed a classical strength-duration relationship. In contrast voltage threshold, determined from current injection or by elevating extracellular K+, varied little with the rate of membrane polarization.
The state of activation and inactivation of Na+ and K+ currents might contribute to the stability of the voltage threshold. Cell-attached records showed that 79 ± 10 % of Na+ channels and 64 ± 10 % of K+ channels were available for activation at resting potential in silent cells (n = 8). As cells were depolarized to threshold, Na+ current availability was reduced to 23 ± 10 %, and K+ current availability to 31 ± 12 %.
The speed of transition into the inactivated states also appears to contribute to the invariance of threshold for all but the fastest depolarizations. At potentials close to threshold, the rate of inactivation of Na+ and K+ followed a double exponential time course, such that Na+ currents were 62 % inactivated and K+ currents were 63 % inactivated within 15 ms.
The excitability of a neurone depends on its resting potential and firing threshold. Nerve cells may either discharge spontaneously or may remain silent until a sufficiently large depolarization drives their membrane potential from its resting level to a threshold from which an action potential is generated. The difference between resting and threshold potentials is therefore a crucial factor that governs the transmission of activity in chains of synaptically connected neurones.
Neuronal membrane potential has been determined using sharp electrodes and from whole-cell records with patch electrodes. Both techniques may introduce errors. Impalement of a neurone with a sharp electrode introduces a leak conductance (Spruston & Johnston, 1992; Staley et al. 1992), which may modify resting potential. Leak conductances are reduced in whole-cell records, but since the exact composition of the intracellular solution cannot be mimicked easily by that in the pipette, junction potentials due to different compositions of electrode and cytoplasmic solutions (Barry & Lynch, 1991; Marty & Neher, 1995) still exist and cause errors in membrane potential measurements.
Measuring neuronal firing threshold may be more difficult since this parameter may not possess a single value. Early work on nerve fibres showed that the threshold current needed to cause firing was reduced as its duration was increased (Lapique, 1907; Nernst, 1908). The classical strength-duration relationship for threshold current results from parameters that describe the charging of a passive structure to a fixed potential. Hill (1936) showed that another factor, accommodation, was needed to account for a reduction in fibre excitability during long-lasting depolarizations. Subsequent work on the squid giant axon (Hodgkin & Huxley, 1952) showed that accommodation corresponds to sodium current inactivation and slow activation of potassium currents.
Neuronal voltage threshold, unlike current threshold, could not be assessed until intracellular records were obtained (Coombs et al. 1957). Noble & Stein (1966) defined it as the potential where the summed inward membrane current exceeds the outward current, and derived relationships showing that for an axon, the voltage threshold is higher for a point polarization than for a uniform one.
In central neurones, voltage threshold may be influenced by many distinct membrane conductances with different voltage and time dependencies. In addition, central neurones possess complex extended geometries and ion channels are not uniformly distributed. In simulations of the motoneurone, Dodge & Cooley (1973) assumed that sodium current density was highest at the axon initial segment and predicted that voltage threshold should be lowest at this site. Non-uniform Na+ channel distributions have been directly measured (Stuart & Hausser, 1994), but although the channel density increases from dendrites to soma to the initial part of the axon, it remains unclear how far from the soma axonal spikes are initiated (Gogan et al. 1983; Colbert & Johnston, 1996; Stuart et al. 1997).
We therefore wished to measure membrane potential and firing threshold using a technique that avoided artifacts associated with leak conductances and junction potentials. We adopted a non-invasive method developed for use on lymphocytes (Verheugen et al. 1995), which permits membrane potential to be determined from the reversal potential of K+ currents activated in cell-attached records. Firing threshold was assessed by increasing K+ in the perfusing solution until action currents appeared in the cell-attached record. This procedure should provide a uniform polarization of slow time course. The resulting voltage threshold might be similar to that resulting from rheobase current stimulation, with a fully developed accommodation. We examined this question by comparing the cell-attached voltage threshold with that derived from whole-cell recordings.
METHODS
Slices
Experiments were performed (according to local regulations) on hippocampal slices obtained from 11- to 26-day-old Sprague- Dawley rats. The animals were anaesthetized by intraperitoneal injection of 7.5 % ketamine and 35 % chloralhydrate, and then perfused intracardially with ice-cold extracellular solution. After decapitation, the hippocampal formation was removed from the brain and cut into 300 μm thick transverse slices using a tissue slicer (Dosaka, Kyoto, Japan). Slices were kept at room temperature in a saline solution (see composition below) bubbled with a mixture of 95 % O2 and 5 % CO2, before being transferred into a heated recording chamber (34°C).
Solutions
The slices were continuously superfused with a solution containing (mM): 130 NaCl, 2.7 KCl, 2 CaCl2, 2 MgCl2, 1.3 NaH2PO2, 20 NaHCO2 and 27.7 glucose, and saturated with 95 % O2 and 5 % CO2. NBQX (5 μm), APV (100 μm) and bicuculline (30 μm) were routinely added to the perfusing solution to block synaptic activity. High-K+ saline solution (concentration up to 12 mM) was obtained by adding 1 M KCl without adjusting ionic strength. Bath application of drugs or solutions containing elevated levels of K+ was accomplished by manually switching to the experimental saline using a multiport valve. The time to exchange the solution in the recording chamber was 30 s, as measured by monitoring the junction potential of an open electrode when switching to distilled water. Pipettes were filled with solutions containing a concentration of K+ ions chosen to be similar to the intracellular concentration, estimated to be 155 mM (Hille, 1992). In experiments where cell-attached recordings only were made, the pipette solution contained (mM): 140 KCl, 2 EGTA, 2 MgCl2 and 5 Hepes; pH was adjusted to 7.3 with KOH. For experiments where both cell-attached and current-clamp recordings in the whole-cell configuration were performed, electrodes contained (mM): 130 potassium gluconate, 10 KCl, 2 EGTA, 2 MgCl2 and 5 Hepes; pH was adjusted to 7.3 with KOH. When examining Na+ and K+ currents (cell-attached recordings), pipettes were filled with (mM): 145 NaCl, 1 MgCl2 and 10 Hepes. In most of these experiments 100 μm TEA and 2 μm 4-aminopyridine (4-AP) were added to the internal solution. All chemicals were purchased from Sigma, except for NBQX and APV (RBI).
Recordings
Patch pipettes were pulled from borosilicate glass of external diameter 1.5 mm (Hilgenberg, Malsfeld, Germany), using a Brown-Flaming electrode puller (Sutter Instruments). Their resistance when filled with recording solution varied from 2 to 5 MΩ. Records were made from pyramidal cells and from interneurones with somata in stratum radiatum of the CA1 area. Cells were identified visually using a Nikon microscope equipped with differential interference contrast (DIC) optics and a × 40 objective. Slices were illuminated with light passed through a filter (high-pass, cut-off 700 nm), which was detected by a camera sensitive to infrared light (Hamamatsu C3077).
Cell-attached and whole-cell records were made with an Axopatch 200A amplifier, using the ‘fast CC mode’ for current-clamp recordings. Stimulation and data acquisition was controlled by pCLAMP 6 software (Axon Instruments). Signals were filtered at 5 kHz and stored on a DAT Biologic tape recorder. They were digitized with a Labmaster interface (Axon Instruments) at a sampling interval of 12 μs for voltage ramps applied in the cell-attached configuration. In current-clamp and cell-attached records of Na+ and K+currents, the sampling interval was 100 μs. Leakage and capacitive currents were subtracted on-line using a P/-4 protocol (four negative correction pulses, amplitude one-quarter of the test pulse).
In cell-attached recordings, the amplifier was set to zero with the recording pipette in the bath solution, to null the junction potential between the bath and the pipette solution (measured according to Neher (1992), this potential was < 3 mV for a KCl-based solution). The pipette was then advanced through the slice under positive pressure. When pressure from the approaching electrode was seen to distort the cell body, negative pressure was applied to form a seal of resistance greater than 1 GΩ between the electrode and the cell. In cell-attached records a holding potential of −60 mV, with respect to the resting membrane potential (Vm), was applied to remove inactivation of K+ currents. Depolarizing voltage ramps of duration 18 ms were applied, at an interval of 1–2.5 s, from −100 to +200 mV, with respect to Vm to obtain I-V curves for somatic K+ current.
Whole-cell current-clamp recordings were established by applying a brief pulse of suction after seal formation to obtain access to the cell cytoplasm. Input resistance in the whole-cell configuration was 150–400 MΩ, and was checked repeatedly during a recording by measuring the voltage response to a hyperpolarizing current pulse of 0.1 nA amplitude.
Analysis
Measurements of membrane potential were based on the principle that with similar K+ concentrations in a cell-attached recording pipette and in the cell cytoplasm, K+ currents evoked by voltage commands should reverse at 0 mV, where the applied holding current is equal and opposite to the membrane potential. Ramp voltage commands were applied to activate K+ currents. As shown in Fig. 1A, voltage ramps elicited a current response consisting of three components. The step from the holding potential of −60 mV to the start of the ramp at −100 mV evoked a transient capacitive component of duration typically less than 1 ms, followed by a linear current with slope dependent on the leak resistance. Potassium currents were evident as a deviation from this linear response. They were initially inward and then reversed to become outward with respect to the linear leak at more positive potentials.
Figure 1. Methods.
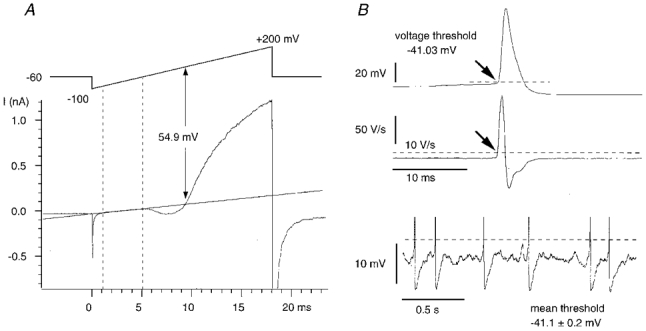
A, membrane potential measured from the reversal of cell-attached K+ currents. The holding potential was −60 mV with respect to the resting membrane potential. Voltage-gated potassium currents activated by a depolarizing voltage ramp from −100 to +200 mV were initially inward, and then reversed to become outward. The reversal potential was determined from the intersection of the fit to the linear leak and the K+ current. B, voltage threshold in whole-cell current-clamp recordings (upper trace). The point at which the dV/dt exceeded 10 V s−1 (middle trace) was chosen as the voltage threshold (dashed line). This threshold definition corresponded with visual estimates, permitted comparison between cells and excluded subthreshold oscillations (lower trace).
These responses were analysed to extract values for K+ current reversal potential and leak conductance using a program written by I. Cohen (Labview language, National Instruments). A linear fit was made to the leak conductance - for ramps of duration 18 ms, this typically corresponded to the interval between 1 and 5 ms after ramp onset, or between holding potentials of about −80 and −20 mV relative to Vm. If single-channel activity appeared during this component of the response, traces were rejected. The reversal potential of the K+ current was determined from the intersection of the linear fit and the K+ current response (Fig. 1A). Each trace was visually checked for the goodness of linear fit and the validity of the intersection point.
The voltage threshold of an action potential is not always well defined in current-clamp records. As an objective criterion that could be generalized between cells, we measured the membrane potential at which the dV/dt exceeded 10 V s−1 (Stuart et al. 1997). This gave a voltage at the foot of an action potential that coincided reasonably well with visual estimates of the point at which the spike was initiated (Fig. 1B). Although sampling frequency did influence the point where the dV/dt exceeded threshold, this error was small: an increase in frequency from 10 to 30 kHz modified voltage threshold by less than 0.3 mV.
RESULTS
Voltage-gated K+ currents in somatic cell-attached patch recordings
Cell-attached recordings were made in the presence of NBQX (5 μm), APV (100 μm) and bicuculline (30 μm) in ten CA1 pyramidal cells and thirty-two interneurones located in the stratum radiatum of the CA1 area. At an external K+ concentration of 2.7 mM, action currents were apparent in records from thirteen of the interneurones and two pyramidal cells.
Voltage-gated K+ currents were examined using ramp voltage commands with pipettes containing high levels of K+ (Fig. 1A). The threshold for potassium current activation occurred at pipette potentials between −20 and +20 mV with respect to the resting potential of the cell (i.e. zero holding potential). The peak amplitude of the inward current ranged from 5 to 71 pA in interneurones (mean 22 pA, n = 28 somatic patches) and from 5 to 35 pA in pyramidal cells (mean 13 pA, n = 9). Currents were carried exclusively by potassium ions since they remained outward over the entire voltage range when 135 mM potassium was replaced by N-methyl-D-glutamine, and were insensitive to the replacement of gluconate by chloride as the major anion in the recording pipette (data not shown). Patches with inward currents less than 5 pA were more often recorded from pyramidal cells than from inhibitory cells, and were not used for analysis. Ramps were repeated at intervals of 1–2.5 s with no detectable progressive inactivation of K+ currents.
Membrane potential measured from the reversal of cell-attached K+ currents
With a potassium concentration in the recording pipette (155 mM) similar to that of the cytoplasm, K+ currents should reverse when the potential across the patch is zero, i.e. when the holding potential is equal and opposite to the resting membrane potential. Measured in this way, we found the mean resting potential was −74.4 ± 9.4 mV (mean ±s.d.) for silent interneurones (n = 17) and −84.4 ± 7.1 mV for pyramidal cells (n = 8). The mean potential measured from interneurones with spontaneously occurring action currents was −59.5 ± 7.5 mV (n = 13 cells).
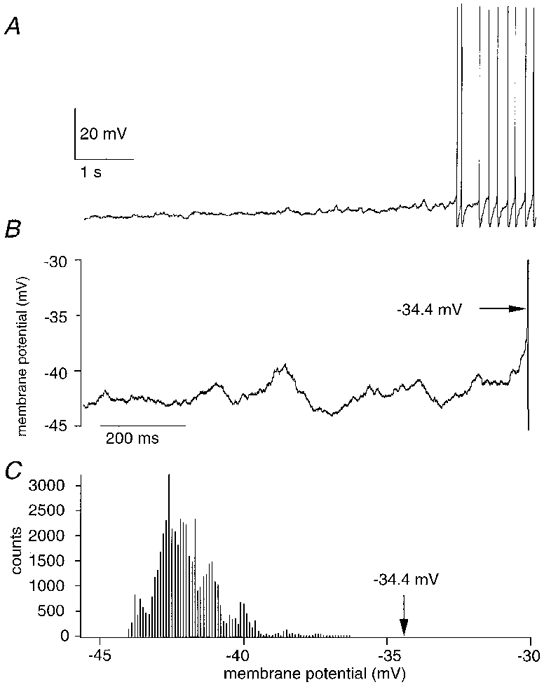
The variability in repeated measurements of membrane potential from silent cells, measured as the standard deviation of ten successive values, was 1.6 ± 0.5 mV (n = 13 cells). In contrast, membrane potential was more variable, 4.6 ± 1.6 mV (n = 13 cells) in cells that discharged action currents (Fig. 2A and B). These fluctuations might result in part from the afterhyperpolarizations that succeed action potentials. To test this hypothesis, we plotted membrane potential against time after a spontaneous action current at which it was measured (Fig. 2C and D). In data from six inhibitory cells this procedure gave a waveform that reached a maximal hyperpolarized level shortly after the action current, and then repolarized over several hundred milliseconds towards a steady potential. In two cells, cell-attached records were converted into whole-cell records, so that the after-hyperpolarization (AHP) could be examined directly in the current-clamp recording mode. At similar spike discharge frequencies, the AHP reconstructed from cell-attached records corresponded rather closely both in amplitude and form to that measured in the whole-cell record (Fig. 2D). One difference, however, was that membrane potential measured from whole-cell recordings was about 13 mV more depolarized than our estimates from K+ current reversal in cell-attached records.
Figure 2. Membrane potential of a spontaneously active interneurone.
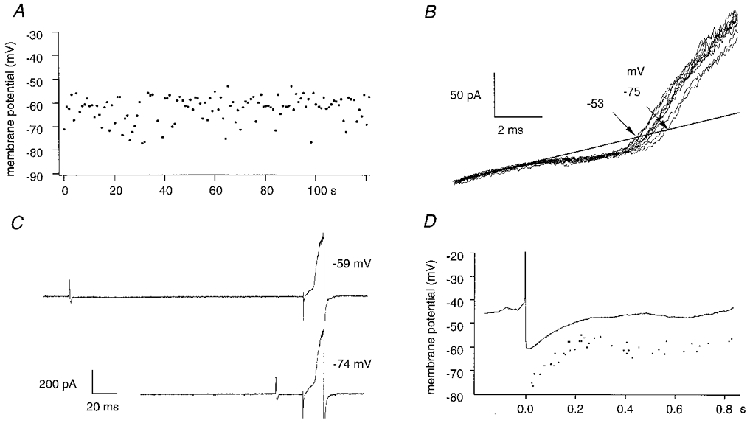
A, in an interneurone that generated spontaneous action currents, membrane potential fluctuated between −53 and −75 mV. B, variability in reversal potential of consecutive ramp-evoked K+ currents. C, the interval between a spontaneous action current and the succeeding measurement of membrane potential was measured. D, the plot of membrane potential against this interval (dots) resembles an AHP waveform. The continuous trace is an action potential and afterhyperpolarization recorded subsequently in whole-cell mode from the same cell. Note the difference of about 12 mV in absolute membrane potential.
This difference in measurements of membrane potential was examined in eight cells by comparing values determined from K+ current reversal (mean of the last twenty measures before break in) and from subsequent whole-cell recording. The resting membrane potential measured in cell-attached configuration was −70 ± 8 mV, and that determined between 1 and 2 min after establishing whole-cell access was −57 ± 4 mV. This difference seems likely to reflect the Donnan junction potential between the cell interior and the pipette solution.
Measurement of firing threshold in cell-attached records by application of high K+
Increasing external potassium depolarizes neurones. By measuring membrane potential in cell-attached records as a neurone depolarized in response to elevated external K+ and noting the potential at which action currents first appeared, we attempted to estimate their voltage threshold. Experiments were done in the presence of APV, NBQX and bicuculline to block synaptic activity, and external K+ was increased from a control value of 2.7 mM, usually by 1 mM each 30 s, until firing threshold was reached.
Figure 3 shows this procedure for an interneurone. Seal resistance measured from the linear portion of the current response remained constant as the increase in K+ depolarized the cell from a resting potential close to −67 mV. The cell began to discharge action currents at a membrane potential near −54 mV and a nominal external K+ concentration of 13 mM. During continued exposure to the high K+ solution, action currents decreased in amplitude and their duration increased.
Figure 3. Membrane potential and firing threshold - interneurone.
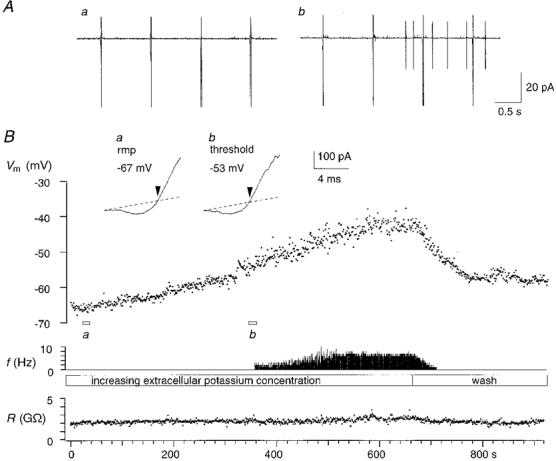
A, membrane potential (Vm) was measured from current ramps at 1 Hz (a); extracellular potassium was increased from 2.7 mM to about 13 mM until action currents appeared (b). B, the upper trace shows the time course of the depolarization during the increase in extracellular potassium, the middle trace gives the action potential frequency (f), and the lower trace shows that seal resistance (R) remained stable close to 2 GΩ. The insets show traces of K+ current reversal at resting membrane potential (rmp) and threshold (a and b).
A sufficient increase in K+ caused firing in all neurones tested (n = 27). Action currents were typically initiated at a nominal external K+ concentration of 6–12 mM. The effects of high K+ on membrane potential varied to some extent between cells. Membrane polarization did not always occur uniformly with time as K+ was increased, and the sensitivity of membrane potential to K+ varied between different cells. In one cell with a resting membrane potential of −84 mV, raising K+ from 2.7 to 10.7 mM induced a depolarization of 25 mV. More typically, this increase in K+ induced a depolarization of about 8 mV. Increasing K+ induced firing in the absence of a detectable change of membrane potential in two previously inactive cells.
The membrane potential of the pyramidal cell shown in Fig. 4 was relatively insensitive to external potassium up to a concentration of about 9 mM, and then depolarized rapidly as K+ concentration was increased to 12.7 mM. Firing occurred in bursts of action potentials, with an intraburst frequency of 60 Hz, and a burst duration of 80–120 ms. We never observed this type of discharge in interneurones. Membrane potential measured during a burst showed an additional depolarization to −47 mV, indicating an underlying depolarizing current. The firing pattern in the subsequent whole-cell current-clamp recording corresponded closely to the bursting discharge behaviour observed in the cell-attached recording, with an intraburst frequency of 60 Hz, and a burst duration close to 100 ms. Bursts were sustained by underlying slow depolarizations, probably generated by Ca2+ currents (Fig. 4A).
Figure 4. Membrane potential and firing threshold - pyramidal cell.
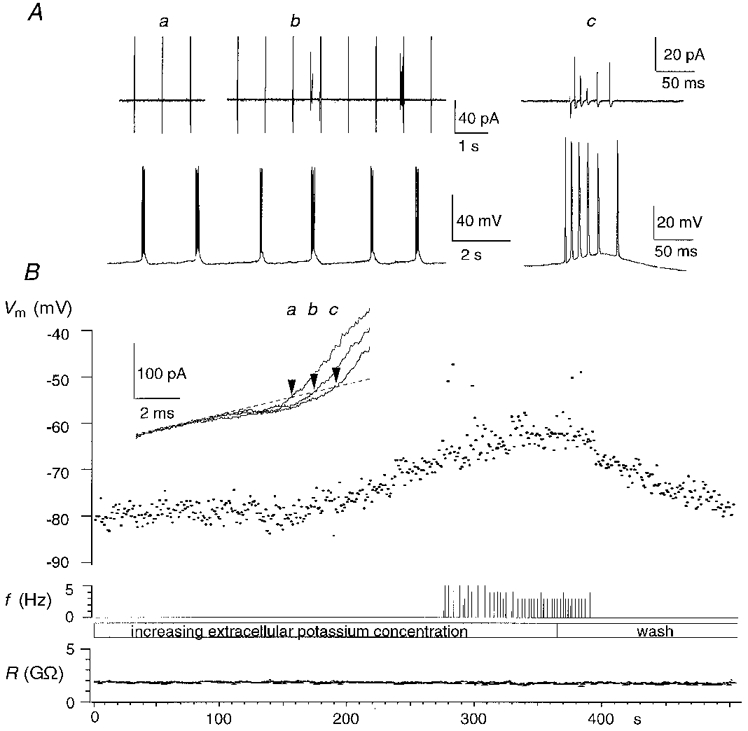
A, membrane potential (Vm) was measured at 1 Hz (a), then extracellular potassium was increased until action currents appeared (b). In this case action currents occurred in stereotyped high frequency bursts (c). Similar bursts were observed when extracellular potassium was increased in subsequent whole-cell recording (bottom). B, the depolarization occurred with a delay after the increase in extracellular potassium (upper trace). The middle trace gives the action potential frequency (f) measured as the number of spikes occuring in each 1 s period. The lower trace shows that seal resistance (R) was about 2 GΩ. Inset: K+ currents at resting membrane potential (a), threshold (b) and during a burst (c).
We wished to examine changes in membrane potential immediately preceding the generation of the first action potential. This was difficult in cell-attached recordings since the interval of 1–2.5 s between measurements could result in a prolonged delay between the last value for membrane potential and the first action potential. The effects of increasing external K+ were therefore examined in whole-cell current-clamp records. In both interneurones and pyramidal cells, the transition to firing was preceded by oscillations in membrane potential (MacVicar, 1985) and the first action potential was typically initiated on the peak of an oscillation (Fig. 5). This suggests that values for threshold determined from cell-attached records should be corrected for an additional membrane depolarization occurring during a period of about 1 s before threshold is reached. To estimate the amplitude of this correction we examined potential fluctuations during the 1 s before the onset of the first action potential (Fig. 5B and C) in current-clamp records from sixteen cells depolarized to threshold by increasing external K+. The mean membrane potential during this period was 8.7 ± 1.7 mV more hyperpolarized than the threshold, defined as the point where dV/dt exceeded 10 V s−1.
Figure 5. Whole-cell records of the approach to firing threshold in elevated extracellular potassium.
A, in current clamp recordings, membrane potential fluctuations increased before the cell started firing. B, the 1 s period before the first action potential (its threshold is shown by the arrow). The mean membrane potential during this period, determined from the all-points histogram in C, was 8.7 mV more hyperpolarized than threshold.
Taking this correction into account, the voltage threshold for silent interneurones was −49 mV. As shown in Fig. 6, this was 25 mV more depolarized than their resting potential. The voltage threshold of spontaneously discharging interneurones is presumably more hyperpolarized than their mean potential. We attempted to determine a threshold for two active interneurones by reducing the external K+ concentration to a nominal value of 0.5 mM, but in neither of these cells could we stop spontaneous discharge of active currents. The mean voltage threshold for pyramidal cells was −60 mV, which was 24 mV depolarized from resting potential.
Figure 6. Overview of membrane potential and threshold of interneurones and pyramidal cells.
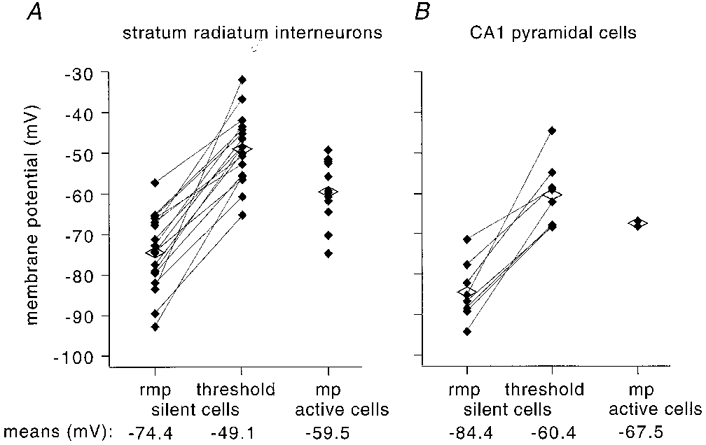
A, values of resting membrane potential (rmp) and threshold for silent interneurones (n = 17) and mean membrane potential (mp) for spontaneously active interneurons (n = 13) and, B, for silent (n = 8) and active pyramidal cells (n = 2). Each filled diamond represents one cell, and the open diamonds correspond to mean values. The mean pyramidal cell resting potential and threshold are both more hyperpolarized than the corresponding values for silent interneurons.
Effects of divalent cations on membrane and threshold potentials
These data suggest that cell-attached measures of voltage threshold correspond reasonably well to those obtained in whole-cell records, when differences in membrane potential due to the method of measurement are taken into account. We wished to examine the sensitivity of the cell-attached technique using a stimulus that would change neuronal voltage threshold in isolation. One such stimulus may be to alter extracellular calcium concentration. Increasing external divalent cations shifts current-voltage relationships for voltage-gated channels to positive potentials, possibly via an effect on membrane surface charges (Hille, 1968).
Thus we determined voltage threshold in the cell-attached configuration using increasing external K+ concentrations to depolarize the cell to threshold, in control conditions (2 mM external Ca2+) and after return to rest a second time in elevated calcium (Fig. 7). In two cells, external calcium was raised to 4 mM, and we found a shift in voltage threshold to more depolarized potentials by 5 and 6 mV. In a third cell external calcium was raised to 5 mM, shifting threshold by 8 mV. In none of these cells was resting membrane potential affected by the increase in external calcium.
Figure 7. Increasing external Ca2+ concentration changes firing threshold.
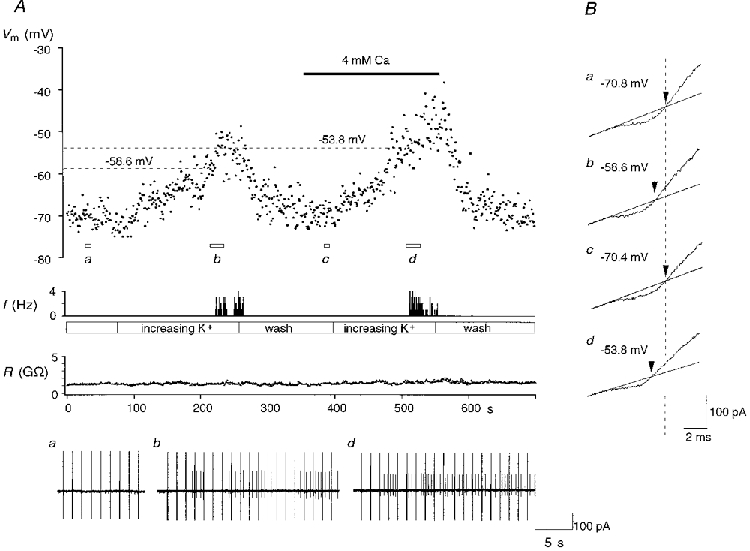
A, threshold measured by high external potassium application, first in control calcium (2 mM) and then in elevated calcium (4 mM). Upper trace, membrane potential (Vm); middle trace, firing frequency (f); and lower trace, seal resistance (R). In this cell the increase in extracellular Ca2+ induced a 5 mV increase in threshold. Cell-attached records are shown below and potassium current reversals, in B, correspond to rest (a), the onset of action potentials during the first potassium challenge (b), the return to rest (c) and the second threshold measurement in elevated calcium (d).
Is there a single voltage threshold for firing?
Elevations of external K+ induce a slow polarization (Figs 4–6) that may be similar to electrical stimulation at rheobase. Classical studies on nerve fibres show that current threshold for discharge varies with stimulus duration (Bostock, 1983; Lapique, 1926). We made whole-cell recordings to determine how current and voltage threshold varied with the speed of depolarization (Fig. 8). Responses to injections of ramp currents of duration 15, 150 and 1500 ms were examined in ten inhibitory cells. The amplitude of current ramps was increased until the cell fired. The current threshold, measured as the minimum current amplitude that evoked an action potential on three successive trials, was lower at slower rates of current injection (Fig. 8A and C). In contrast, the voltage threshold, defined as the potential where dV/dt exceeded 10 V s−1, varied little with the rate of current injection (Fig. 8A, B and D). In five cells the voltage threshold determined from ramp current injections was compared with that measured from application of high K+. The values were not significantly different, thus increased external K+ does not modify threshold. The variability in voltage threshold measured from repeated stimuli with the same current ramp was small (the mean standard deviation for 150 ms ramps was 1.0 mV, n = 10). We also examined whether holding potential might influence voltage threshold. In six cells where discharge was induced by 150 ms ramp currents injected from holding potentials between −50 and −110 mV, voltage threshold did not vary with holding potential (data not shown).
Figure 8. Effect of the rate of depolarization on threshold in whole-cell current-clamp recordings.
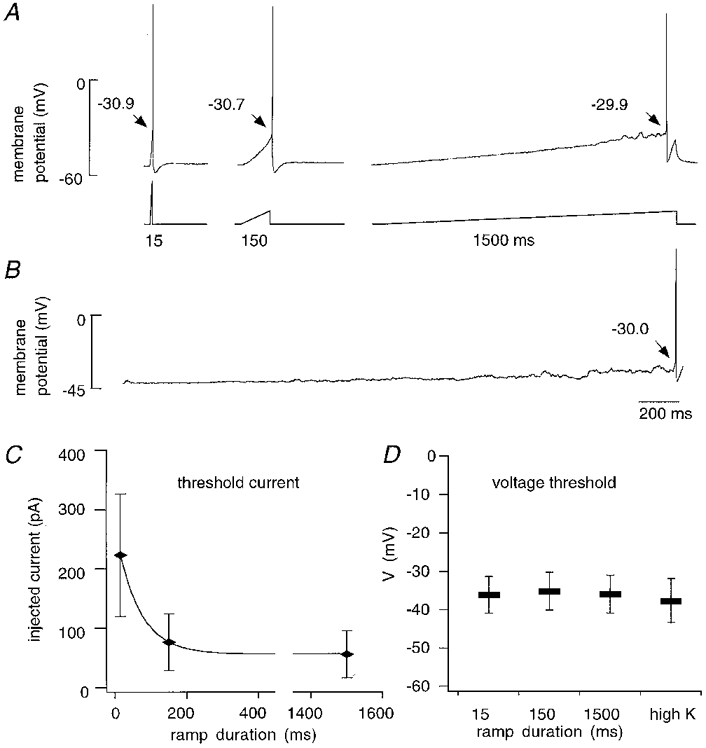
A, action potentials were elicited by injecting current ramps of 15, 150 and 1500 ms duration. B, the same cell was depolarized by elevating extracellular K+ concentration to 6.7 mM from its control value of 2.7 mM. C, the current threshold varied with the rate of injection (n = 10). D, in contrast, the mean voltage threshold measured from ramps of different durations (n = 10) and from K+-induced depolarization (n = 6) was similar. The voltage threshold was normalized to a value of 1, corresponding to the measurement from the ramp of duration 15 ms.
Na+ and K+ currents
These data show that while current threshold in these cells follows classical strength-duration relationships, voltage threshold seems to be rather invariant. This suggests that the inactivation of voltage-dependent currents, which should depend on the speed of membrane depolarization, may have rather little influence on voltage threshold. To examine this point in greater detail we studied the state of activation and inactivation of Na+ and K+ currents at rest and during depolarization to threshold (Fig. 9).
Figure 9. Na+ and K+ currents inactivate when approaching threshold.
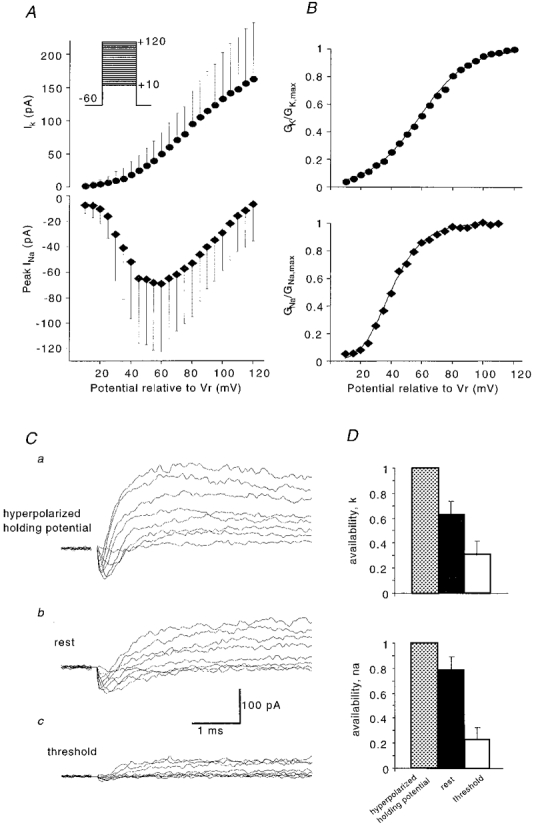
A, I-V relationships of Na+ and K+ currents in cell-attached configuration, mean of n = 11 for K+, and n = 13 for Na+. Currents were elicited from a hyperpolarized holding potential of −60 mV with voltage steps that incremented by 5 mV, starting from +10 mV (these values are command voltages; the true patch voltage should be the sum of the the command potential and the cell potential); see protocol in inset. B, corresponding activation curves obtained by conductance transformation of the data in A. Continuous lines are best fits by a Boltzmann equation. C, representative traces of mixed Na+ and K+ currents elicited from a hyperpolarized holding potential (a, Vr−60 mV), from the cells resting potential (b, 0 mV holding potential) and close to threshold (c, 0 mV holding potential, the cell being depolarized by high external K+). Steps from +20 to +90 mV (a, b) and from +10 to +80 mV (c) are shown. Transient artifacts at step onset were blanked. D, normalized current amplitudes at rest and close to threshold compared with those evoked from a hyperpolarized holding level, with maximal channel availability of 1.0.
Sodium and potassium currents were examined in cell-attached records from sixteen stratum radiatum interneurones. The pipette solution contained 145 mM NaCl, and low doses of 4-AP and TEA (2 μm and 100 μm, respectively). In these conditions, the amplitudes of inward and outward currents were similar and the Na+ current was not significantly curtailed by the K+ current. Currents were evoked by voltage steps to potentials of +10 to +120 mV made from a holding potential of −60 mV to remove inactivation. (Note that these potentials applied to the pipette add to the resting potential of the cell.) The identity of the currents was verified by showing that 1 μm TTX in the pipette solution completely abolished the inward current (n = 3), whereas outward currents were eliminated with 1 mM 4-AP and 15 mM TEA in the recording pipette (n = 1).
Na+ and K+I-V curves (Fig. 9A) were constructed from the peak inward currents (n = 13) and mean outward currents between 1.5 and 3 ms after step onset (n = 11), respectively. The slope conductance determined from a linear fit to the mean I-V curve of sodium currents in the range of +80 to +120 mV was 1.17 nS, which suggests that patches contained, on average, sixty-five Na+ channels of conductance 18 pS (Fleidervish et al. 1996). Maximum inward currents were reached at about +60 mV. Figure 9B shows the conductance transforms of Na+ and K+ mean I-V curves, obtained by dividing current by the driving force. In constructing these curves we used an extrapolated Na+ reversal potential of +122.5 mV, similar to that reported for neocortical neurones (Fleidervish et al. 1996) and a K+ current reversal potential of −25 mV. Data points were fitted with the following Boltzmann-type equations:
where V is the command potential, V½ is the potential at which the value of the Boltzmann function is 0.5, and k is the slope factor (Zhang & McBain, 1995; Martina & Jonas, 1997). In Fig. 9B, GI,max was normalized to a value of 1. The mid-point potential for activation of the sodium current was +40 mV, and for the potassium current it was +58 mV, with respect to the patch resting potential. The slope factors were 12.6 and 16.0 mV, respectively.
Sodium and potassium currents inactivate when approaching threshold slowly
Inactivation of sodium and potassium currents in cell-attached patches was examined in silent inhibitory cells at rest and during depolarization to threshold induced by increasing external K+ concentration. Reversal of K+ currents in cell-attached experiments indicated a potential difference of 16 mV between rest and threshold (neglecting the correction derived as in Fig. 5). I-V curves obtained near threshold were therefore shifted by 16 mV with respect to those measured at rest. For the sodium current component we compared peak inward currents at threshold and at rest from +50 to +70 mV voltage steps. Potassium currents were averaged from values 2–4 ms after the command voltage onset, for steps from +60 to +90 mV. The slow polarization of the cell caused a decrease in Na+ and K+ current amplitudes, consistent with a reduction in channel availability due to channel inactivation. At just sub-threshold potentials, both Na+ and K+ current amplitudes were reduced to about 50 % of their values at resting potential (n = 7, data not shown).
In a second set of experiments (n = 5) we measured the availability of both Na+ and K+ currents (Raman et al. 1997) at rest and close to threshold (Fig. 9C). I-V curves for Na+ and K+ currents measured at rest and close to threshold (shifted by 16 mV) were compared with those elicited at resting potential with a hyperpolarized prepulse potential (−60 mV for ≥ 50 ms) applied to remove inactivation. These experiments showed that both Na+ and K+ channels were partially inactivated at rest. The availability of Na+ currents at resting potential was 79 %, and the availability of K+ channels was 64 %. Polarization to threshold resulted in a substantial increase in steady-state inactivation of both inward and outward currents. Near threshold, Na+ channel availability was 23 %, while K+ channel availability was reduced to 31 % (Fig. 9D).
Rapid onset of inactivation
These data show that the apparent invariance of voltage threshold in these cells does not result from an absence of inactivation of Na+ or K+ currents. On the contrary, both inward and outward currents are very inactivated. An alternative explanation might be that the rate of transition into the inactivated state is faster than the polarization resulting from either ramp stimulation or from depolarization induced by extracellular K+.
We examined the time course of onset of inactivation using protocols that included a prepulse in which the membrane was stepped to near threshold potentials for variable duration (Fig. 10). This should mimic the situation where a cell is depolarized rapidly to attain firing threshold. The prepulse potential was +15 mV, similar to the difference between rest and threshold potential, and this step did not elicit a measurable current. The test pulse activated maximal Na+ currents of −68 pA (n = 6) followed by a K+ current component of 60 pA (n = 5). Current amplitudes were reduced as the duration of the prepulse was increased, to values of 26 % for Na+, and 19 % for K+, with prepulses of 50 ms duration. The onset of inactivation of Na+ and K+ currents at +15 mV followed a double exponential function (Fig. 10B). In three patches with relatively small maximal Na+ current amplitudes (< 40 pA), current amplitudes were reduced to 70 % with a 10 ms prepulse, but did not decay further with longer duration prepulses. These patches were not included in the analysis of Na+ inactivation kinetics. These data suggest that the onset of inactivation at near threshold potentials for both Na+ and K+currents may be sufficiently rapid to explain a relatively constant voltage threshold.
Figure 10. Onset of inactivation is rapid.
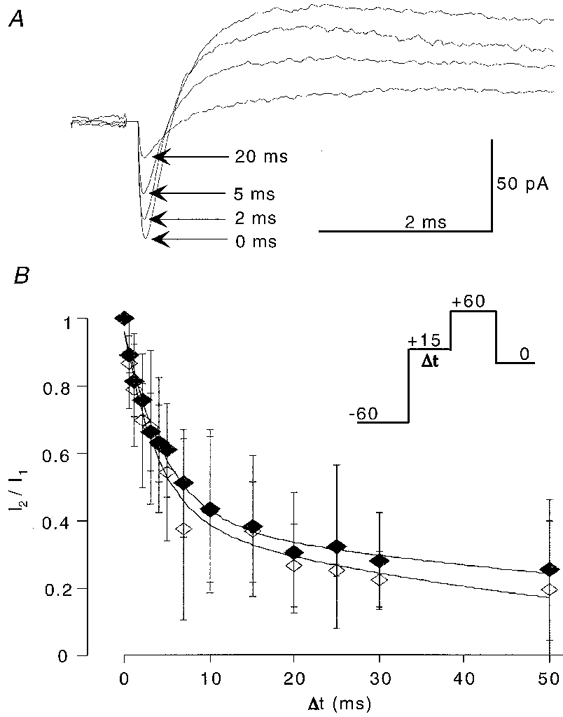
A, the voltage protocol to measure the kinetics of entry into the inactivated state consisted of a 50 ms pulse to −60 mV to abolish inactivation, a prepulse of variable duration to +15 mV, followed by a test pulse to +60 mV, and a step back to 0 mV holding potential. Traces are means of fifteen consecutive trials; artifacts at test pulse onset were blanked. B, as the duration of the prepulse to near threshold potential increased, amplitudes of Na+ and K+ currents decay rapidly, following a double exponential time course. I1 is the maximal current amplitude with no prepulse, and I2 is the current amplitude with a prepulse of duration Δt. Note the similar inactivation onset kinetics of Na+ and K+ currents.
DISCUSSION
We have attempted to measure voltage threshold using cell-attached records from hippocampal neurones. Membrane potential was derived from the reversal of voltage-gated K+ channels (Fig. 1), with symmetrical K+, while cells were polarized to their firing threshold by increasing external K+ (Fig. 3). Membrane potentials derived from cell-attached measurements were more hyperpolarized than those measured from whole-cell records. Unexpectedly, voltage thresholds estimated from slow K+-dependent polarization were similar to those measured by applying current ramps of durations 15–1500 ms (Fig. 8). Cell-attached measurements showed that close to voltage threshold, the availability of both Na+ and K+ currents was reduced to about 25 % (Fig. 9). Rapid transition of both channels into their inactivated states (Fig. 10) implies that the voltage threshold derived from slow polarization by external K+ may be identical with a threshold that is invariant for all but very fast depolarizations.
Resting membrane potential and the junction potential question
Cell-attached measurements of membrane potential may provide several advantages over other techniques. The cell membrane is not broken. This implies that no leak is introduced, as when cells are penetrated with sharp electrodes (Clements & Redman, 1989). Furthermore, the cytoplasm remains undisturbed in contrast to the situation during whole-cell recordings. This also implies the absence of a Donnan liquid junction potential (Marty & Neher, 1995) between the pipette solution and the cell interior. This latter difference may underlie the more negative values for membrane potential reported here than those determined for hippocampal neurones from whole-cell recordings (Staley et al. 1992; Williams et al. 1994; Liu et al. 1996) or using the perforated patch technique (Spruston & Johnston, 1992). We found that membrane potential measured from K+ current reversal was about 13 mV more hyperpolarized than that determined by subsequent whole-cell recording from the same neurones. This difference was maintained during the time course of the after-hyperpolarization succeeding action potential discharge.
Our method for measuring the membrane potential from the potassium reversal potential is based on three prerequisites: (1) the current is potassium selective, (2) pipette and cytoplasmic potassium are equivalent, and (3) cytoplasmic potassium does not vary between cell types. Although we have evidence to support the first assumption, it is more difficult to be certain of the latter two. We have chosen a value of 155 mM (Hille, 1992) although some data suggest a lower internal potassium concentration in central neurones. Measurements of intracellular potassium activity in hypoglossal neurones give an equivalent of 135 mM internal potassium concentration (Jiang & Haddad, 1991). Given these uncertainties we used the Nernst equation to calculate the expected error in our determinations of membrane potential corresponding to a hypothetical 20 mM difference between internal and external K+, i.e. external K+ of 155 mM and internal K+ of 135 mM. A difference of 20 mM would have resulted in an error of < 4 mV in our estimates for membrane potential.
Experiments were all done with fast excitatory and inhibitory synaptic inputs suppressed. In these conditions, a small fraction of CA1 pyramidal cells and almost half of the CA1 interneurones discharged spontaneously. A similar proportion of spontaneously active inhibitory cells has been noted previously (P. Parra, personal communication; Freund & Buzsaki, 1996). Although the ionic mechanisms underlying this spontaneous activity (e.g. Feigenspan et al. 1998) were not examined, our data suggest that the mean membrane potential in inhibitory cells that discharged spontaneously was about 15 mV more depolarized than the resting potential of silent interneurones. The mean resting potential of CA1 pyramidal cells was 10 mV more hyperpolarized than that of silent interneurones.
High external K+ as a depolarizing stimulus
Increasing external potassium was used as a means to drive neurones to their firing threshold while membrane potential was monitored from K+ current reversal. Presumably elevating K+ depolarizes neurones via current flowing through leak conductances (Finkelstein & Mauro, 1977; Chang, 1986), although potassium-permeable voltage-gated channels may also contribute (Maccaferri et al. 1993; Deak et al. 1998). The Nernst equation suggests that increasing the external K+ concentration from 2.7 to 10 mM should shift the K+ equilibrium potential from about −100 to about −70 mV. Somato-dendritic and axonal membranes should be polarized uniformly with this stimulus. Since the exact site of action potential initiation in these neurones is not clear, this technique has advantages over the non-uniform depolarization resulting from point current injection via a somatic recording electrode. However, it obliges us to assume that changes in potential, measured with a somatic patch electrode, were representative of those occurring at the site of action potential initiation (Colbert & Johnston, 1996; Stuart et al. 1997).
Using an elevation of external K+ to depolarize neurones until they fired, we found a significant difference in voltage threshold between silent interneurones (−49 mV) and CA1 pyramidal cells (−60 mV). However, the potential difference between resting potential and voltage threshold was similar, close to 25 mV, in both cell types. Presumably the voltage threshold of spontaneously active interneurones, a functionally important subset of inhibitory cells (Parra et al. 1998), is more hyperpolarized than their mean membrane potential, although we could not demonstrate this in recordings in which excitability was reduced by decreasing external K+.
One disadvantage of using extracellular K+ to polarize neurones is that it takes a considerable time to make one measurement. In our experiments K+ was increased over a period of several minutes, limiting the number of observations that could be made on a single cell. Even so, experiments on the effects of extracellular Ca2+ on threshold (Fig. 6) showed that membrane potential measurements were quite reproducible, and that changes in threshold as small as 5 mV were reliably detected.
Does threshold depend on the rate of depolarization?
We supposed that values for voltage threshold derived from slow depolarizations induced by ramp increases in extracellular K+ would be close to those resulting from rheobase electrical stimulation, and thus different from values obtained with faster stimuli. This question was examined by injecting ramp currents of varying duration in whole-cell recordings. The current intensity needed to induce firing did indeed vary with stimulus duration as expected if strength-duration curves reflect charging of the neuronal membrane (Bostock, 1983). In contrast, the mean voltage threshold, defined as the point during the first action potential where dV/dt exceeded 10 V s−1, did not vary consistently with the speed of membrane polarization. This finding contradicts the expected influence of accommodation (Nernst, 1908), an increase in axonal threshold observed on excitation by currents of long duration. Voltage clamp work on squid axons (Hodgkin & Huxley, 1952) identified accommodation with Na+ current inactivation and slow K+ current activation, but as Noble & Stein (1966) pointed out, these factors may affect rheobase current more strongly than voltage threshold.
Sodium and potassium channels near threshold
We used cell-attached recordings to examine Na+ and K+ currents (Zhang & McBain, 1995; Fleidervish et al. 1996; Martina & Jonas, 1997) and particularly their state of inactivation at rest and close to threshold. Mixed Na+ and K+ currents were examined with low concentrations of K+ channel antagonists inside the recording pipette, so that the peak amplitude of the Na+ component was not reduced. K+ currents were measured at a latency of 2–4 ms after the onset of depolarizing commands, assuming that this component of outward current was largely responsible for the control of action potential initiation, although we did not attempt to identify which K+ channel subtypes were involved (Zhang & McBain, 1995). The absolute level of voltage steps in cell-attached records is not clear (Fleidervish et al. 1996), but it was identical for both inward and outward components of the mixed currents studied in our experiments (Figs 9 and 10). There must also be some uncertainty regarding the exact potential reached by the step of +15 mV, used to depolarize patches from silent cells to near threshold potentials (Fig. 10).
Our ability to define threshold from the onset of action currents as external K+ was increased, while monitoring Na+ and K+ currents, allows firm conclusions to be drawn regarding their availability close to threshold. Thus a Na+ current availability of 79 % at resting potential was reduced to 23 % near threshold. For K+ currents the comparable values were 64 and 31 %. These data suggest that action potentials may be generated by about a quarter of the Na+ channels that these inhibitory cells possess, if somatic channels are similar to those expressed at the site of spike initiation. Comparison with other Na+ current inactivation curves (Huguenard et al. 1988; Magee & Johnston, 1995; Fleidervish et al. 1996; Martina & Jonas, 1997; Raman et al. 1997) suggests that this conclusion may be general for many central neurones.
Since Na+ and K+ channel availabilities are low, the apparent invariance of voltage threshold cannot be explained by an absence of inactivation. Instead, the similarity of voltage threshold for the first spike initiated either by ramp stimuli of 15–1500 ms durations or by slower polarizations induced by elevating external K+ might depend on the rapidity of entry of both Na+ and K+ channels into their inactivated state. Our data (Fig. 10) suggest that transition into the inactivated state may have been complete for all ramp stimuli used. However, faster depolarizations may discharge action potentials at a lower voltage threshold. EPSPs terminating on hippocampal inhibitory cells might provide such a stimulus since they have notably fast rise times (Miles, 1990; Geiger et al. 1997).
Functional implications?
Several studies have asked how many afferent fibres, each initiating an EPSP of a given size, must be simultaneously active to discharge a cell with a given resting potential and voltage threshold (Hu et al. 1992; Barbour, 1993; Otmakhov et al. 1993). While single EPSPs might influence the discharge of spontaneously active inhibitory cells, it seems clear that many simultaneous EPSPs will be needed to fire silent pyramidal cells and interneurones. However, it is not clear that the values of resting potential and neuronal threshold derived here could give a precise number for two reasons.
First, voltage threshold was defined, somewhat arbitrarily though precedents exist (Anderson et al. 1987; Stuart et al. 1997), as the point at which the dV/dt of membrane potential exceeded 10 V s−1. This gave visually reasonable estimates near the foot of action potentials, permitted comparison between cells and was not exceeded by subthreshold potential oscillations that did not initiate spikes (Fig. 1B). At this point a cell was ‘committed’ to fire, but it is difficult to be sure that the same would not have been true for a value somewhat lower than 10 V s−1.
The second uncertainty is regarding the potential oscillations that occur, in the absence of fast inhibitory and excitatory transmission, in a range of about 5–10 mV hyperpolarized from the voltage threshold (Figs 5 and 8). These oscillations presumably originate in interplay between inward and outward currents flowing through spontaneously opening channels (Schneidman et al. 1998; White et al. 1998). Whether an EPSP does or does not initiate firing seems likely to depend on its timing with respect to these oscillations. So while voltage threshold may be invariant, for all but the fastest polarizations, the precise moment at which it is reached seems likely to depend on the history of preceding, stochastic fluctuations in membrane potential (Mainen & Sejnowski, 1995).
Acknowledgments
This work was supported by INSERM, the Human Frontiers Science Organisation and the NIH (MH54671). We thank Ivan Cohen for writing and help with the analysis programme, and Henri Korn for helpful discussions.
References
- Anderson P, Storm J, Wheal HV. Thresholds of action potentials evoked by synapses on the dendrites of pyramidal cells in the rat hippocampus in vitro. The Journal of Physiology. 1987;383:509–526. doi: 10.1113/jphysiol.1987.sp016425. [DOI] [PMC free article] [PubMed] [Google Scholar]
- Barbour B. Synaptic currents evoked in Purkinje cells by stimulating individual granule cells. Neuron. 1993;11:759–769. doi: 10.1016/0896-6273(93)90085-6. [DOI] [PubMed] [Google Scholar]
- Barry PH, Lynch JW. Liquid junction potentials and small cell effects in patch-clamp analysis. Journal of Membrane Biology. 1991;121:101–117. doi: 10.1007/BF01870526. [DOI] [PubMed] [Google Scholar]
- Bostock H. The strength-duration relationship for excitation of myelinated nerve: computed dependence on membrane parameters. The Journal of Physiology. 1983;341:59–74. doi: 10.1113/jphysiol.1983.sp014792. [DOI] [PMC free article] [PubMed] [Google Scholar]
- Chang DC. Is the K permeability of the resting membrane controlled by the excitable K channel? Biophysical Journal. 1986;50:1095–1100. doi: 10.1016/S0006-3495(86)83553-6. [DOI] [PMC free article] [PubMed] [Google Scholar]
- Clements JD, Redman SJ. Cable properties of cat spinal motoneurones measured by combining voltage clamp, current clamp and intracellular staining. The Journal of Physiology. 1989;409:63–87. doi: 10.1113/jphysiol.1989.sp017485. [DOI] [PMC free article] [PubMed] [Google Scholar]
- Colbert CM, Johnston D. Axonal action-potential initiation and Na+ channel densities in the soma and axon initial segment of subicular pyramidal neurons. Journal of Neuroscience. 1996;16:6676–6686. doi: 10.1523/JNEUROSCI.16-21-06676.1996. [DOI] [PMC free article] [PubMed] [Google Scholar]
- Coombs CM, Curtis DR, Eccles JC. The generation of impulses in motorneurones. The Journal of Physiology. 1957;139:232–249. doi: 10.1113/jphysiol.1957.sp005888. [DOI] [PMC free article] [PubMed] [Google Scholar]
- Deak F, Nagy G, Varnai P, Madarasz E, Spat A. Calcium current activated by potassium ions in voltage-clamped rat hippocampal pyramidal neurones. The Journal of Physiology. 1998;508:735–745. doi: 10.1111/j.1469-7793.1998.735bp.x. [DOI] [PMC free article] [PubMed] [Google Scholar]
- Dodge FA, Cooley JW. Action potential of the motoneuron. IBM Journal of Research Development. 1973;17:219–229. [Google Scholar]
- Feigenspan A, Gustincich S, Bean BP, Raviola E. Spontaneous activity of solitary dopaminergic cells of the retina. Journal of Neuroscience. 1998;18:6776–6789. doi: 10.1523/JNEUROSCI.18-17-06776.1998. [DOI] [PMC free article] [PubMed] [Google Scholar]
- Finkelstein A, Mauro A. Physical principles and formalisms of electrical excitability. In: Brookhart JM, Mountcastle VB, editors. Handbook of Physiology, The Nervous System, Cellular Biology of Neurons. Vol. 1. Bethesda, MD, USA: American Physiological Society; 1977. pp. 161–214. part 1 section 1. [Google Scholar]
- Fleidervish IA, Friedman A, Gutnick MJ. Slow inactivation of Na+ current and slow cumulative spike adaptation in mouse and guinea-pig neocortical neurones in slices. The Journal of Physiology. 1996;493:83–97. doi: 10.1113/jphysiol.1996.sp021366. [DOI] [PMC free article] [PubMed] [Google Scholar]
- Freund TF, Buzsaki G. Interneurons of the hippocampus. Hippocampus. 1996;6:347–470. doi: 10.1002/(SICI)1098-1063(1996)6:4<347::AID-HIPO1>3.0.CO;2-I. 10.1002/(SICI)1098-1063(1996)6:4<347::AID-HIPO1>3.0.CO;2-I. [DOI] [PubMed] [Google Scholar]
- Geiger JR, Lubke J, Roth A, Frotscher M, Jonas P. Submillisecond AMPA receptor-mediated signaling at a principal neuron-interneuron synapse. Neuron. 1997;18:1009–1023. doi: 10.1016/s0896-6273(00)80339-6. 10.1016/S0896-6273(00)80339-6. [DOI] [PubMed] [Google Scholar]
- Gogan P, Gueritaud JP, Tyc-Dumont S. Comparison of antidromic and orthodromic action potentials of identified motor axons in the cat's brainstem. The Journal of Physiology. 1983;335:205–220. doi: 10.1113/jphysiol.1983.sp014529. [DOI] [PMC free article] [PubMed] [Google Scholar]
- Hill AV. Excitation and accommodation in nerve. Proceedings of the Royal Society B. 1936;119:305–355. [Google Scholar]
- Hille B. Charges and potentials at the nerve surface. Divalent ions and pH. Journal of General Physiology. 1968;51:221–236. doi: 10.1085/jgp.51.2.221. 10.1085/jgp.51.2.221. [DOI] [PMC free article] [PubMed] [Google Scholar]
- Hille B. Ionic Channels of Excitable Membranes. 2. Sinauer Associates, Inc; 1992. [Google Scholar]
- Hodgkin AL, Huxley AF. A quantitative description of membrane current and its application to conduction and excitation in nerve. The Journal of Physiology. 1952;117:500–544. doi: 10.1113/jphysiol.1952.sp004764. [DOI] [PMC free article] [PubMed] [Google Scholar]
- Hu GY, Hvalby O, Lacaille JC, Piercey B, Ostberg T, Andersen P. Synaptically triggered action potentials begin as a depolarizing ramp in rat hippocampal neurones in vitro. The Journal of Physiology. 1992;453:663–687. doi: 10.1113/jphysiol.1992.sp019250. [DOI] [PMC free article] [PubMed] [Google Scholar]
- Huguenard JR, Hamill OP, Prince DA. Developmental changes in Na+ conductances in rat neocortical neurons: appearance of a slowly inactivating component. Journal of Neurophysiology. 1988;59:778–795. doi: 10.1152/jn.1988.59.3.778. [DOI] [PubMed] [Google Scholar]
- Jiang C, Haddad GG. Effect of anoxia on intracellular and extracellular potassium activity in hypoglossal neurons in vitro. Journal of Neurophysiology. 1991;66:103–111. doi: 10.1152/jn.1991.66.1.103. [DOI] [PubMed] [Google Scholar]
- Lapique L. Recherches quantitatives sur l'excitation électrique des nerfs traitée comme une polarisation. Journal de Physiologie et de Pathologie Génerale. 1907;9:620–635. [Google Scholar]
- Lapique L. L'Excitabilité en Fonction du Temps. Les presses universitaires de France; 1926. [Google Scholar]
- Liu YB, Lio PA, Pasternak JF, Trommer BL. Developmental changes in membrane properties and postsynaptic currents of granule cells in rat dentate gyrus. Journal of Neurophysiology. 1996;76:1074–1088. doi: 10.1152/jn.1996.76.2.1074. [DOI] [PubMed] [Google Scholar]
- Maccaferri G, Mangoni M, Lazzari A, DiFrancesco D. Properties of the hyperpolarization-activated current in rat hippocampal CA1 pyramidal cells. Journal of Neurophysiology. 1993;69:2129–2136. doi: 10.1152/jn.1993.69.6.2129. [DOI] [PubMed] [Google Scholar]
- MacVicar BA. Depolarizing prepotentials are Na+ dependent in CA1 pyramidal neurons. Brain Research. 1985;333:378–381. doi: 10.1016/0006-8993(85)91597-5. [DOI] [PubMed] [Google Scholar]
- Magee JC, Johnston D. Characterization of single voltage-gated Na+ and Ca2+ channels in apical dendrites of rat CA1 pyramidal neurons. The Journal of Physiology. 1995;487:67–90. doi: 10.1113/jphysiol.1995.sp020862. [DOI] [PMC free article] [PubMed] [Google Scholar]
- Mainen ZF, Sejnowski TJ. Reliability of spike timing in neocortical neurons. Science. 1995;268:1503–1506. doi: 10.1126/science.7770778. [DOI] [PubMed] [Google Scholar]
- Martina M, Jonas P. Functional differences in Na+ channel gating between fast-spiking interneurones and principal neurones of rat hippocampus. The Journal of Physiology. 1997;505:593–603. doi: 10.1111/j.1469-7793.1997.593ba.x. [DOI] [PMC free article] [PubMed] [Google Scholar]
- Marty A, Neher E. Tight-seal whole-cell recording. In: Sakman B, Neher E, editors. Single Channel Recording. New York: Plenum Press; 1995. pp. 31–52. [Google Scholar]
- Miles R. Synaptic excitation of inhibitory cells by single CA3 hippocampal pyramidal cells of the guinea-pig in vitro. The Journal of Physiology. 1990;428:61–77. doi: 10.1113/jphysiol.1990.sp018200. [DOI] [PMC free article] [PubMed] [Google Scholar]
- Neher E. Ion channels, Methods in Enzymology. Vol. 207. Academic Press, Inc; 1992. Corrections for liquid junction potentials in patch-clamp experiments; pp. 123–131. [DOI] [PubMed] [Google Scholar]
- Nernst W. Zur Theorie des elektrischen Reizes. Pflügers Archiv. 1908;122:275–314. [Google Scholar]
- Noble D, Stein RB. The threshold condition for initiation of action potentials by excitable cells. The Journal of Physiology. 1966;187:129–162. doi: 10.1113/jphysiol.1966.sp008079. [DOI] [PMC free article] [PubMed] [Google Scholar]
- Otmakhov N, Shirke AM, Malinow R. Measuring the impact of probabilistic transmission on neuronal output. Neuron. 1993;10:1101–1111. doi: 10.1016/0896-6273(93)90058-y. [DOI] [PubMed] [Google Scholar]
- Parra P, Gulyas AI, Miles R. How many subtypes of inhibitory cells in the hippocampus? Neuron. 1998;20:983–993. doi: 10.1016/s0896-6273(00)80479-1. [DOI] [PubMed] [Google Scholar]
- Raman IM, Sprunger LK, Meisler MH, Bean BP. Altered subthreshold sodium currents and disrupted firing patterns in Purkinje neurons of Scn8a mutant mice. Neuron. 1997;19:881–891. doi: 10.1016/s0896-6273(00)80969-1. [DOI] [PubMed] [Google Scholar]
- Schneidman E, Freedman B, Segev I. Ion channel stochasticity may be critical in determining the reliability and precision of spike timing. Neural Computation. 1998;10:1679–1703. doi: 10.1162/089976698300017089. [DOI] [PubMed] [Google Scholar]
- Spruston N, Johnston D. Perforated patch-clamp analysis of the passive membrane properties of three classes of hippocampal neurons. Journal of Neurophysiology. 1992;67:508–529. doi: 10.1152/jn.1992.67.3.508. [DOI] [PubMed] [Google Scholar]
- Staley KJ, Otis TS, Mody I. Membrane properties of dentate gyrus granule cells: comparison of sharp microelectrode and whole-cell recordings. Journal of Neurophysiology. 1992;67:1346–1358. doi: 10.1152/jn.1992.67.5.1346. [DOI] [PubMed] [Google Scholar]
- Stuart G, Hausser M. Initiation and spread of sodium action potentials in cerebellar Purkinje cells. Neuron. 1994;13:703–712. doi: 10.1016/0896-6273(94)90037-x. [DOI] [PubMed] [Google Scholar]
- Stuart G, Schiller J, Sakmann B. Action potential initiation and propagation in rat neocortical pyramidal neurons. The Journal of Physiology. 1997;505:617–632. doi: 10.1111/j.1469-7793.1997.617ba.x. [DOI] [PMC free article] [PubMed] [Google Scholar]
- Verheugen JA, Vijverberg HP, Oortgiesen M, Cahalan MD. Voltage-gated and Ca2+-activated K+ channels in intact human T lymphocytes. Non-invasive measurements of membrane currents, membrane potential, and intracellular calcium. Journal of General Physiology. 1995;105:765–794. doi: 10.1085/jgp.105.6.765. [DOI] [PMC free article] [PubMed] [Google Scholar]
- White JA, Klink R, Alonso A, Kay AR. Noise from voltage-gated ion channels may influence neuronal dynamics in the entorhinal cortex. Journal of Neurophysiology. 1998;80:262–269. doi: 10.1152/jn.1998.80.1.262. [DOI] [PubMed] [Google Scholar]
- Williams S, Samulack DD, Beaulieu C, Lacaille JC. Membrane properties and synaptic responses of interneurons located near the stratum lacunosum-moleculare/radiatum border of area CA1 in whole-cell recordings from rat hippocampal slices. Journal of Neurophysiology. 1994;71:2217–2235. doi: 10.1152/jn.1994.71.6.2217. [DOI] [PubMed] [Google Scholar]
- Zhang L, McBain CJ. Voltage-gated potassium currents in stratum oriens-alveus inhibitory neurones of the rat CA1 hippocampus. The Journal of Physiology. 1995;488:647–660. doi: 10.1113/jphysiol.1995.sp020997. [DOI] [PMC free article] [PubMed] [Google Scholar]