Abstract
This study examined the effects of exercise and diet manipulation intended to alter initial muscle glycogen levels on the capacity to perform prolonged exercise at two ambient temperatures.
Six well-trained cyclists participated in randomized order in two diet and exercise regimens each lasting 8 days and comprising four cycle tests to exhaustion at 70 % of maximum oxygen uptake. On days 1 and 5, subjects exercised to exhaustion to deplete muscle glycogen. Three days after each depletion trial a diet providing 10 % (low carbohydrate (CHO)) or 80 % (high CHO) of energy as CHO was consumed, and each diet was followed by a performance trial at the same ambient temperature, either 10 or 30 °C (days 4 and 8). This schedule was repeated after a week, but performance trials were carried out at the other ambient temperature.
In the cold, cycling time increased (median (range)) from 89.2 min (78.0–129.5 min) on the low CHO trial to 158.2 min (116.9–165.6 min) on the high CHO trial (P < 0.01). In the heat, cycling time increased from 44.0 min (31.8–51.4 min) on the low CHO trial to 53.2 min (50.2–82.2 min) on the high CHO trial (P = 0.02). Total CHO oxidized during exercise in the cold after the low CHO diet was higher than in the heat after either diet suggesting that exercise in the heat was terminated before all available CHO stores had been emptied.
The cause(s) of fatigue during prolonged exercise has not clearly been established in spite of much effort over the last century. The pioneering work of Christensen & Hansen (1939) was instrumental in establishing the role of carbohydrate (CHO) in the development of fatigue. However, the use of the respiratory exchange ratio (R) in these early studies provided only indirect information regarding muscle substrate utilization. This methodological limitation was overcome during the 1960s, with the application of the needle-biopsy technique for muscle sampling, and the development of a number of analytical micromethods for the determination of substrate concentrations. Using this technique, Bergstrom & Hultman (1966) were able to show that muscle glycogen content decreased during exercise. In a subsequent study, these authors showed that muscle glycogen was almost completely depleted when exercise was continued until exhaustion (Bergstrom & Hultman, 1967). A further study (Bergstrom et al. 1967) showed that pre-exercise muscle glycogen levels were altered by administering different diets for 3 days after prolonged exhausting exercise, and a good correlation was found between time to exhaustion and the initial muscle glycogen content. The conclusion from this study was that the glycogen content of the exercising muscles was the main determinant of the capacity to perform prolonged strenuous exercise to exhaustion. A finding in the study of Bergstrom et al. (1967) which has often been overlooked is the higher muscle glycogen content found at exhaustion after a CHO rich diet compared with other diets with a lower CHO content, in spite of the longer exercise time on the high CHO trial. This led Bergstrom and colleagues (Bergstrom et al. 1967) to propose that ‘other factors ultimately limit the performance in this situation’.
In this and in most other studies investigating the metabolic response to prolonged exercise, performance trials were carried out at moderate room temperatures, generally in the range from about 18 to 20°C. In a recent study, however, Galloway & Maughan (1997) measured the endurance capacity of subjects cycling at 70 % of maximum oxygen uptake (VO2,max) at ambient temperatures of 4, 11, 21 and 31°C and found 11°C to be optimal for this type of exercise, with shorter exercise times being achieved at lower and higher temperatures. Depletion of muscle glycogen was considered to be the limiting factor in the cold but not in the heat, where exercise time was substantially reduced (52 min) relative to the performance in the cold (94 min). This proposition was based on the observation that total CHO oxidation in the trial at 31°C was only 90 g, compared with 166 g when the ambient temperature was 11°C. Therefore, the purpose of the present study was to examine the effects of exercise and diet manipulation intended to alter initial muscle glycogen levels on the capacity of trained individuals to perform cycling exercise in the cold and in the heat.
METHODS
Subjects
Six well-trained competitive cyclists gave their written informed consent to take part in the present study which was approved by the local Ethics Committee. The study was conducted in the winter months and none of the subjects was heat acclimatized. Their physical characteristics (means ±s.d.) were: age, 28 ± 8 years; height, 177 ± 5 cm; body weight, 71.2 ± 6.0 kg; VO2,max, 67.5 ± 5.5 ml kg−1 min−1.
Experimental design
All subjects had their VO2,max measured during an initial discontinuous incremental test on an electrically braked cycle ergometer (Gould Corival 300) and this value was verified in a second test a few days later. One minute expired gas collections were made into Douglas bags during the final minute of each 3 min exercise bout and these samples were analysed within 5 min. Expired gases were analysed for CO2 concentration (Beckman LB2 Analyser, Beckman Instruments Ltd, Buckinghamshire, UK), O2 concentration (570A Analyser, Servomex Instruments Ltd, Sussex, UK), volume (Dry gas meter, Harvard Apparatus Ltd, Kent, UK) and temperature (C6600 10 Channel Microprocessor, Comark Ltd, Hertfordshire, UK). All gas volumes were corrected to standard temperature and pressure, dry (STPD). Barometric pressure was measured using a standard mercury barometer.
The experimental design is complex and is best understood by reference to Fig. 1. The study consisted of two diet and exercise regimens, each lasting 8 days and comprising four cycle tests to volitional exhaustion at an intensity of approximately 70 % of VO2,max. Prior to the first of these trials, a full-scale familiarization trial was completed in order to familiarize subjects with the exercise protocol and experimental procedures, and to allow each subject's normal energy intake and diet composition to be determined. During this familiarization period, subjects exercised to the point of fatigue at an intensity of approximately 70 % of VO2,max in a climatic chamber maintained at an ambient temperature of 20°C on days 1, 4, 5 and 8. The work rate was set at 70 % of VO2,max during the initial familiarization session and where necessary the work rate was adjusted prior to the second and third familiarization sessions to achieve the desired exercise intensity. During this 8 day familiarization period, subjects were required to follow their normal diet and to weigh and record all food and drink consumed. Digital weighing scales readable to 1 g were used. The weighed dietary intake data were used to determine energy intake and diet composition using a computerized version of the food composition tables of McCance & Widdowson as revised by Holland et al. (1991). Based on this information, high and low CHO diets (Table 1) were designed for consumption during the two subsequent experimental periods.
Figure 1. Schematic representation of the familiarization period (i) and the two diet and exercise protocols (ii and iii).
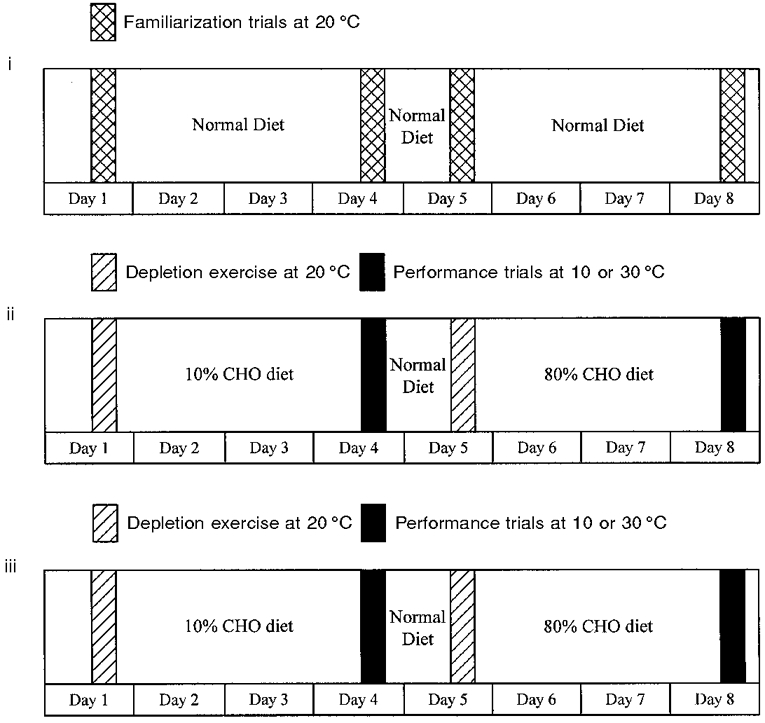
Table 1.
Mean daily energy intake and diet composition during the two experimental regimens
| Low CHO diet | Normal diet | High CHO diet | ||||||||
|---|---|---|---|---|---|---|---|---|---|---|
| Day 1 | Day 2 | Day 3 | Day 4 | Day 4 | Day 5 | Day 5 | Day 6 | Day 7 | Day 8 | |
| Trial 1A (10 °C) | Trial 2A (10 °C) | |||||||||
| Energy intake (MJ) | 4.9 ± 1.1 | 14.5 ± 3.2 | 14.6 ± 3.2 | 9.9 ± 2.1 | 5.0 ± 1.3 | 9.7 ± 2.1 | 5.1 ± 1.2 | 14.6 ± 3.1 | 14.5 ± 3.1 | 9.7 ± 2.1 |
| CHO (%) | 9 ± 4 | 9 ± 4 | 9 ± 1 | 8 ± 1 | 58 ± 20 | 62 ± 11 | 82 ± 3 | 81 ± 3 | 83 ± 2 | 82 ± 1 |
| Fat (%) | 65 ± 9 | 64 ± 9 | 61 ± 7 | 69 ± 7 | 28 ± 18 | 27 ± 10 | 9 ± 3 | 9 ± 3 | 8 ± 2 | 8 ± 2 |
| Protein (%) | 26 ± 6 | 27 ± 7 | 30 ± 7 | 23 ± 7 | 13 ± 2 | 11 ± 2 | 9 ± 2 | 10 ± 1 | 9 ± 1 | 10 ± 2 |
| Alcohol (%) | – | – | – | – | 1 ± 3 | – | – | – | – | – |
| Trial 1B (30 °C) | Trial 2B (30 °C) | |||||||||
| Energy intake (MJ) | 4.9 ± 1.1 | 14.5 ± 3.1 | 14.6 ± 3.1 | 9.7 ± 2.1 | 5.0 ± 1.3 | 9.8 ± 2.1 | 5.1 ± 1.2 | 14.7 ± 3.1 | 14.6 ± 3.1 | 9.7 ± 2.1 |
| CHO (%) | 9 ± 3 | 9 ± 3 | 9 ± 1 | 8 ± 1 | 60 ± 11 | 61 ± 12 | 83 ± 3 | 82 ± 2 | 81 ± 2 | 82 ± 1 |
| Fat (%) | 66 ± 7 | 65 ± 6 | 64 ± 4 | 67 ± 5 | 27 ± 9 | 27 ± 11 | 9 ± 3 | 8 ± 1 | 9 ± 1 | 8 ± 2 |
| Protein (%) | 25 ± 6 | 26 ± 4 | 27 ± 5 | 25 ± 5 | 12 ± 2 | 12 ± 3 | 8 ± 2 | 10 ± 1 | 10 ± 2 | 10 ± 2 |
| Alcohol (%) | – | – | – | – | 1 ± 3 | – | – | – | – | – |
Values are presented as the mean ± s.d.
Subjects were assigned in randomized order to the two experimental study periods. Within each study period, two performance trials were carried out at the same ambient temperature, either 10°C (A) or 30°C (B), with relative humidity maintained at 70 % and air velocity at approximately 0.7 m s−1. On the first day of each study period, subjects exercised to exhaustion at the predetermined workload and at an ambient temperature of 20°C in order to deplete muscle glycogen levels (Bergstrom et al. 1967). During the following 3 days a diet providing 10 % of energy in the form of CHO (low CHO diet) was consumed (Table 1), and this was followed by the first experimental trial (Trial 1) when subjects again exercised to exhaustion at an intensity of approximately 70 % of VO2,max, but this time at either 10°C or 30°C. For the remainder of this day, after the end of the experimental trial, and during the first part of the following day, subjects were allowed to consume their normal diet (Table 1). On the following day, they again exercised to exhaustion at approximately 70 % of VO2,max at an ambient temperature of 20°C to reduce muscle glycogen stores before embarking on an 80 % CHO diet (high CHO diet). After 3 days on the high CHO diet (Table 1), subjects performed the second experimental trial to fatigue (Trial 2) at the same ambient temperature as Trial 1. After an interval of 1 week, this study period was repeated with the same diet and exercise schedule, but the performance trials were carried out at the alternative ambient temperature.
All familiarization trials and depletion sessions were carried out in a controlled environment at an ambient temperature of 20°C. All diets throughout the study periods were isoenergetic with the subjects' normal diet. Subjects were supplied with diet sheets containing the type and weight of the individual food items to be consumed each day. Food items prescribed were based predominantly on each subject's normal diet. Subjects were instructed to consume all prescribed food items and to do so in a manner typical of their normal dietary habits. The two study periods were separated by 1 week to allow the subjects to recover. Subjects were requested to refrain from all other strenuous training during the experimental periods.
The diet and exercise manipulation protocol used in this study was similar to the protocol used by Bergstrom et al. (1967) and was intended to produce low muscle glycogen levels prior to the first performance trial and high muscle glycogen levels prior to the second performance trial. In the study by Bergstrom et al. (1967), prolonged exhausting exercise followed by 3 days on a high fat and protein diet resulted in a 64 % reduction in muscle glycogen levels compared with the glycogen levels attained following a mixed diet, while 3 days on a high CHO diet after exhausting exercise resulted in a 92 % increase in muscle glycogen levels (1.93 g glycogen (100 g muscle)−1 after the mixed diet, 0.69 g glycogen (100 g muscle)−1 after the high fat and protein diet, and 3.70 g glycogen (100 g muscle)−1 after the high CHO diet).
Procedures
All cycling tests during the two experimental regimens were carried out between 17.00 and 21.00 h following a 6 h fast: water was allowed ad libitum during the 6 h fast. Upon arrival at the laboratory, body mass was measured to the nearest 50 g, following which a thermistor was inserted 10 cm beyond the anal sphincter for the measurement of rectal temperature (TR). The subject was then seated in a comfortable environment (approximately 25°C) while thermistors were attached to the skin of the chest, triceps, thigh and calf on the right-hand side of the body for the measurement of skin temperature and a heart rate (HR) monitor (Polar Sport Tester, Polar Electro Oy, Kempele, Finland) was positioned. The subject's left hand and forearm were immersed in water at 42–44°C for 15 min in order to allow the arterialization of the venous blood (Forster et al. 1972). Following this, a 21 gauge venous cannula was introduced into a superficial vein on the dorsal surface of the heated hand or the forearm and a resting blood sample (6 ml) obtained. The venous cannula was kept patent by a slow (ca 0.5 ml min−1) infusion of isotonic saline between samples. Following baseline recordings of TR and skin temperature, the subject was transferred to the climatic chamber and began cycling within approximately 1 min of entering the chamber. The subject was asked to maintain a pedal cadence of 60–80 r.p.m. throughout the test. Exhaustion was defined as the point at which the subject could no longer maintain the pedal cadence above 60 r.p.m. The subject was not given any fluids to drink during the entire cycling test although mouth rinsing with water was permitted. Blood samples were obtained at rest, at 15 min intervals during exercise and at the end of exercise. One minute expired gas collections were made into Douglas bags every 15 min and were analysed within 15 min for the determination of oxygen uptake (VO2) and R. From these measurements, estimated rates of fuel oxidation were calculated. Skin, rectal and ambient temperatures, relative humidity and HR were recorded every 5 min during exercise. A subjective rating of perceived exertion (RPE) was obtained every 10 min until exhaustion using the Borg category scale (Borg, 1982). Time to exhaustion was recorded, but this information was withheld from the subject until all subjects had completed the study. Weighted mean skin temperature (Tsk) was calculated using the equation of Ramanathan (1964). Following exercise the subject was weighed and sweat loss calculated after correcting for respiratory water loss and substrate oxidation (Mitchell et al. 1972).
Blood treatment and analysis
From each blood sample (6 ml), approximately 3.5 ml was dispensed into two tubes containing K3EDTA while the remainder of the blood was dispensed into tubes containing no anticoagulant. Duplicate aliquots (100 μl) of whole blood from one of the K3EDTA tubes were rapidly deproteinized in 1 ml of ice-cold 0.3 mol l−1 perchloric acid; following centrifugation, the supernatant was used for the measurement of glucose and lactate (Maughan, 1982). Some of the EDTA-treated blood was also used for the measurement of haemoglobin (cyanmethaemoglobin method, Sigma) and packed cell volume (PCV) (conventional microhaematocrit method). All blood analyses were carried out in duplicate with the exception of PCV which was analysed in triplicate. Plasma volume changes were calculated from changes in haemoglobin and PCV relative to initial resting values as described by Dill & Costill (1974).
Data analysis
Data are expressed as the mean ±s.d. or median (range) as appropriate following a test for the normality of distribution. The group s.d. is used in the graphical representation of some of the results to aid clarity. The group s.d. is the pooled estimate of the common s.d. (all trials) and represents the square root of the mean square error (Group s.d.=√m.s. error). Statistical analysis of the data was carried out using one-way ANOVA or Kruskal-Wallis tests followed by Fisher's LSD or Mann-Whitney tests as appropriate. Statistical significance was declared when P < 0.05.
RESULTS
Diet
During the familiarization period, the subjects' normal diet comprised 14.5 ± 3.1 MJ day−1 of which 60 ± 8 % of total energy intake was in the form of CHO, 27 ± 7 % was fat, 12 ± 2 % was protein and 1 ± 2 % was alcohol. The mean daily energy intake and diet composition during the two experimental regimens are presented in Table 1. No differences were found in energy intake or diet composition between experimental weeks (Table 1), and body mass, measured prior to each of the performance trials, remained constant (Trial 1A, 71.0 ± 6.2 kg; 2A, 71.2 ± 6.4 kg; 1B, 70.7 ± 6.0 kg; 2B, 71.3 ± 6.4 kg). The ambient temperature and relative humidity were controlled for the four performance trials: Trial 1A, 10.0 ± 0.2°C and 72 ± 4 %; 2A, 9.9 ± 0.2°C and 70 ± 3 %; 1B, 29.9 ± 0.5°C and 70 ± 2 %; 2B, 30.3 ± 0.4°C and 70 ± 1 %.
Time to exhaustion
Cycling time to exhaustion following the subjects' normal diet (at an ambient temperature of 20°C) was 85.1 min (60.7–124.1 min) and 81.2 min (62.6–103.4 min) on day 1 of each of the two experimental study periods (P = 0.94). Cycling time to exhaustion was influenced by both ambient temperature and diet (P < 0.01; Fig. 2). In the cold, cycling time to exhaustion increased (P < 0.01) from 89.2 min (78.0–129.5 min) on the low CHO trial to 158.2 min (116.9–165.6 min) on the high CHO trial. Individual improvements in cycling capacity ranged from 28 to 100 % as a result of the diet manipulation in the cold. In the heat, cycling time increased (P = 0.02) from 44.0 min (31.8- 51.4 min) on the low CHO trial to 53.2 min (50.2–82.2 min) on the high CHO trial. Individual improvements in cycling capacity as a result of the diet manipulation in the heat ranged from 8 to 73 %. Cycling capacity in the cold on the low CHO trial was greater than on the low (P < 0.01) or high (P = 0.01) CHO trials in the heat.
Figure 2. Time to exhaustion during the four performance trials.
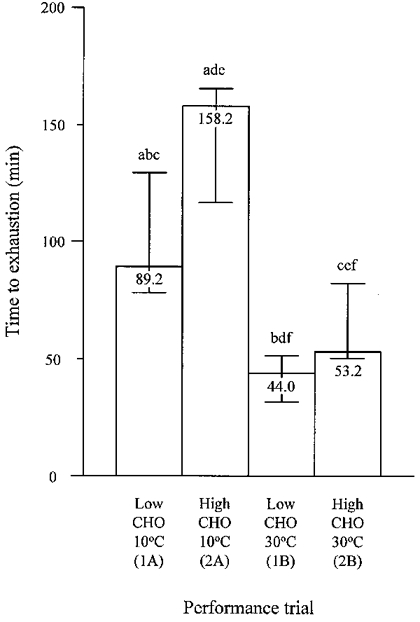
Columns and bars represent median and range. Significant differences between trials are as follows: a, 1A vs. 2A; b, 1A vs. 1B; c, 1A vs. 2B; d, 2A vs. 1B; e, 2A vs. 2B; f, 1B vs. 2B.
Oxygen uptake and substrate utilization during exercise
Oxygen uptake and respiratory exchange ratio (R) during exercise on all trials were not different over time from the 15 min time point, except during exercise in the cold following the high CHO diet, where a reduction in R after 90 min of exercise indicates a rise in the estimated rate of fat oxidation (Fig. 3). No difference in VO2 was found between conditions (Fig. 3). Both R and the rate of CHO oxidation were higher, while the rate of fat oxidation was lower, following the high CHO diet than following the low CHO diet during exercise in both ambient conditions (Fig. 3). The total amount of CHO oxidized during exercise in the cold following the high CHO diet (434 ± 77 g) was greater than the amount oxidized on any of the other three performance trials (Trial 1A, 201 ± 36 g; 1B, 96 ± 19 g; 2B, 187 ± 42 g). Similarly, during exercise in the cold on the low CHO trial, the total amount of CHO oxidized was greater than on the low CHO trial in the heat (Fig. 4). During exercise in the heat, the total amount of CHO oxidized was greater on the high CHO trial than on the low CHO trial (Fig. 4). The total amount of fat oxidized was similar (in spite of the large differences in exercise times) during the two trials in the cold (Trial 1A, 87 ± 49 g; 2A, 78 ± 17 g). Total fat oxidation during each of the trials in the cold was greater than in either trial in the heat regardless of diet (Trial 1B, 34 ± 9 g; 2B, 20 ± 11 g), reflecting the differences in total exercise time (Fig. 4).
Figure 3. Respiratory exchange ratio, oxygen uptake and rate of CHO and fat oxidation during the four performance trials.
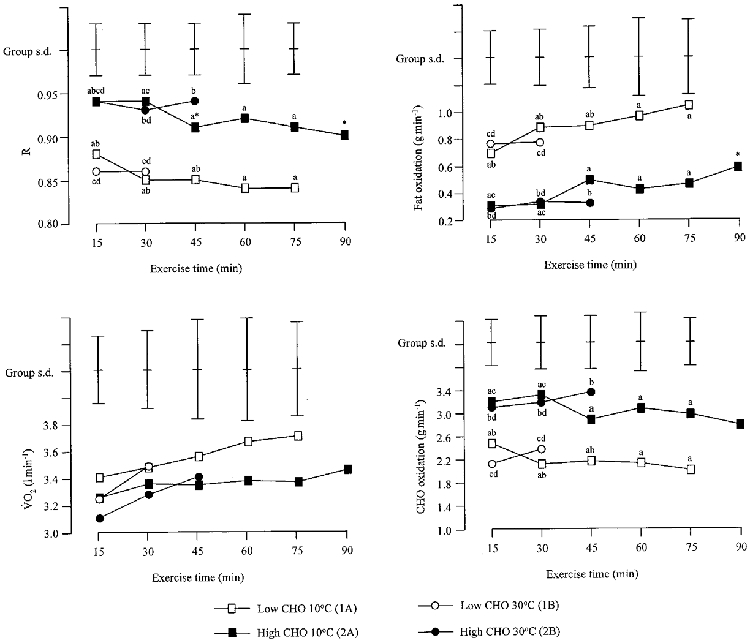
Mean values and s.d. are shown. Significant differences between trials are as follows: a, 1A vs. 2A; b, 1A vs. 2B; c, 2A vs. 1B; d, 1B vs. 2B. * Significantly different from 15 min time point.
Figure 4. Total CHO and fat oxidation during the four performance trials.
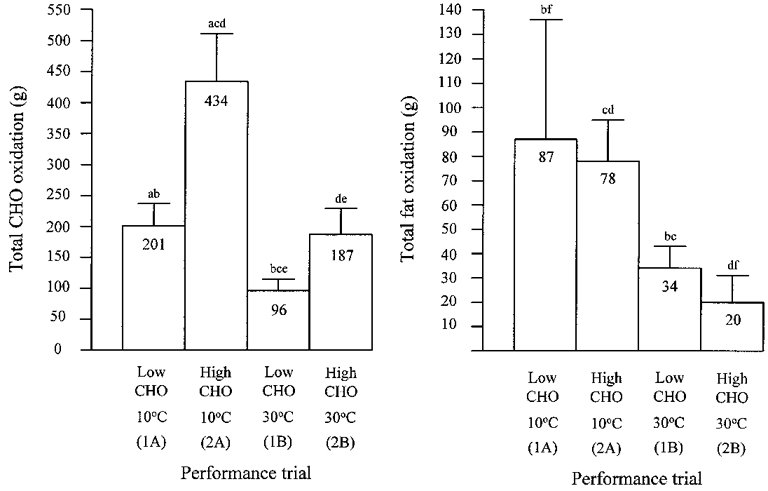
Means and s.d. are shown. Significant differences between trials are as follows: a, 1A vs. 2A; b, 1A vs. 1B; c, 2A vs. 1B; d, 2A vs. 2B; e, 1B vs. 2B; f, 1A vs. 2B.
Heart rate during exercise
There was a progressive rise in heart rate (HR) during exercise on all four trials. Following both diet conditions, HR was higher during exercise in the heat than during exercise in the cold (Fig. 5). During exercise in the cold, HR was higher during the low CHO trial than during the high CHO trial; in the heat, HR tended to be higher during the low CHO trial than during the high CHO trial but this difference did not reach statistical significance. At the last time point at the end of both trials in the heat, HR was higher than the corresponding value reached after exercise on the same diet in the cold. Heart rate at exhaustion on the low CHO trial in the heat was also higher than on the high CHO trial in the cold.
Figure 5. Heart rate and rating of perceived exertion during the four performance trials.
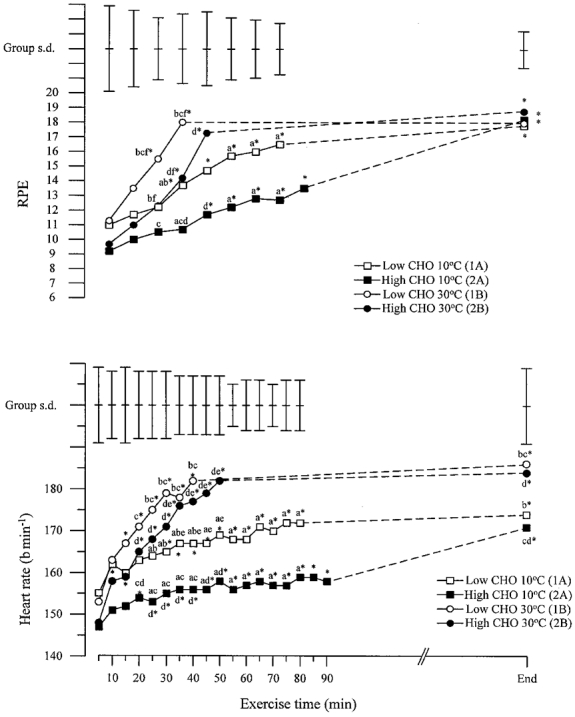
Mean values and s.d. are shown. Significant differences between trials are as follows: a, 1A vs. 2A; b, 1A vs. 1B; c, 2A vs. 1B; d, 2A vs. 2B; e, 1A vs. 2B; f, 1B vs. 2B. * Significantly different from 5 min (HR) and 10 min (RPE) time point.
Rating of perceived exertion during exercise
There was a progressive rise in the rating of perceived exertion (RPE) during exercise on all four trials. There was a clear pattern for the subjective rating of effort to be higher in the heat than in the cold and higher after the low CHO diet than after the high CHO diet. No significant difference between trials in RPE was found during the first 20 min of exercise; thereafter RPE was greater on the low CHO trial than on the high CHO trial at the high and at the low ambient temperature (Fig. 5). During exercise in the heat, RPE was greater than during exercise in the cold following the same diet. Rating of perceived exertion was also greater during exercise in the heat following the low CHO diet than during exercise in the cold following the high CHO diet. No difference in RPE between trials was found at exhaustion.
Rectal and skin temperatures during exercise
Rectal temperature (TR) rose during exercise on all four trials (Fig. 6). This rise continued until exhaustion during both trials in the heat, while no further increase was found after 15 min of exercise during both trials in the cold. No differences in TR between the two ambient temperature conditions were found during the first 30 min of exercise; thereafter TR during exercise in the heat was higher than during exercise in the cold regardless of diet, and these differences persisted until exhaustion. At the end of exercise in the heat TR was also higher on the high CHO trial than on the low CHO trial. Weighted mean skin temperature (Tsk) was higher during exercise in the heat than in the cold but there was no effect of diet on Tsk during exercise at either ambient temperature (Fig. 6). There was a rapid increase in Tsk during exercise in the heat, and a rapid decrease during exercise in the cold; no further change in Tsk was found after 10 min of exercise at either ambient temperature. (Fig. 6).
Figure 6. Rectal and weighted mean skin temperatures during the four performance trials.
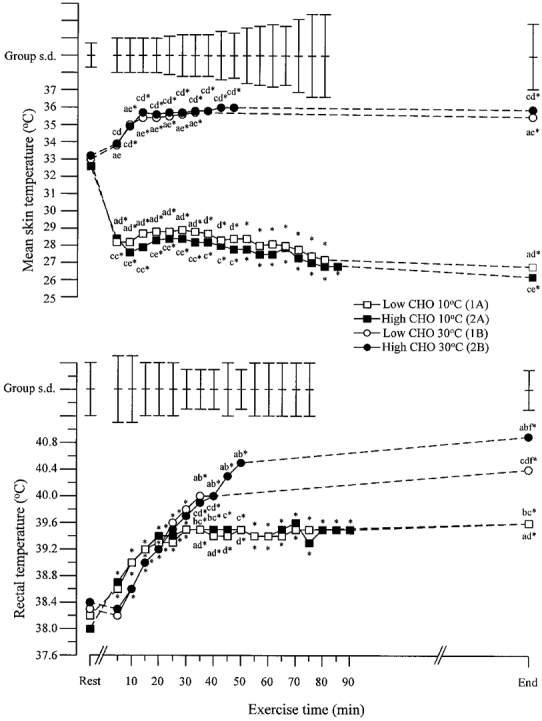
Mean values and s.d. are shown. Significant differences between trials are as follows: a, 1A vs. 1B; b, 2A vs. 1B; c, 2A vs. 2B; d, 1A vs. 2B; e, 2A vs. 1B; f, 1B vs. 2B. * Significantly different from resting value.
Blood metabolite concentrations at rest and during exercise
The blood glucose concentration during exercise on all trials was not significantly different over time from the resting level (Fig. 7). The only difference in blood glucose between conditions was found after 45 min of exercise. At this time point, blood glucose during exercise in the heat on the high CHO trial was greater than at the corresponding time point during both performance trials in the cold. The blood glucose concentration at the end of exercise on the four trials ranged between 3.4 and 7.5 mmol l−1.
Figure 7. Blood glucose and lactate concentrations during the four performance trials.
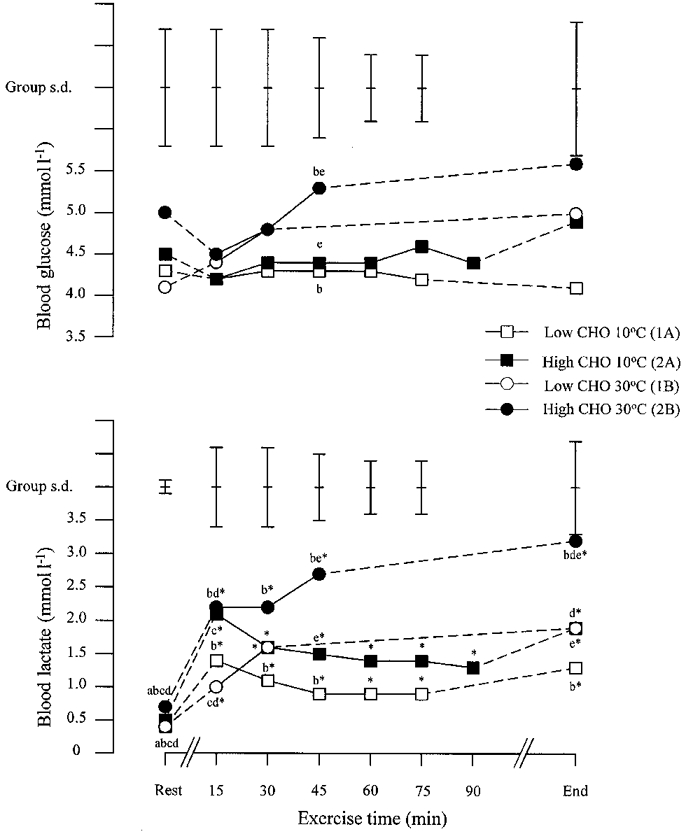
Mean values and s.d. are shown. Significant differences between trials are as follows: a, 1A vs. 2A; b, 1A vs. 2B; c, 2A vs. 1B; d, 1B vs. 2B; e, 2A vs. 2B. * Significantly different from resting value.
The blood lactate concentration rose after 15 min of exercise on all four performance trials and then fell on the two trials in the cold, but continued to rise on the two trials in the heat (Fig. 7). At rest the blood lactate concentration was higher following the two high CHO diets than following the two low CHO diets (P < 0.01). This effect of diet on blood lactate concentration was also found after 15 min of exercise in the heat and at exhaustion; in the cold, blood lactate concentration during the high CHO trial was higher throughout exercise but this difference did not reach statistical significance (P < 0.10). Blood lactate concentration during the high CHO trial in the heat was higher after 45 min of exercise and at exhaustion than during both diets in the cold.
Plasma volume changes
Plasma volume fell by about 5–10 % within the first 15 min of exercise and thereafter remained largely unchanged; there was no difference between conditions (Fig. 8).
Figure 8. Changes in plasma volume during the four performance trials.
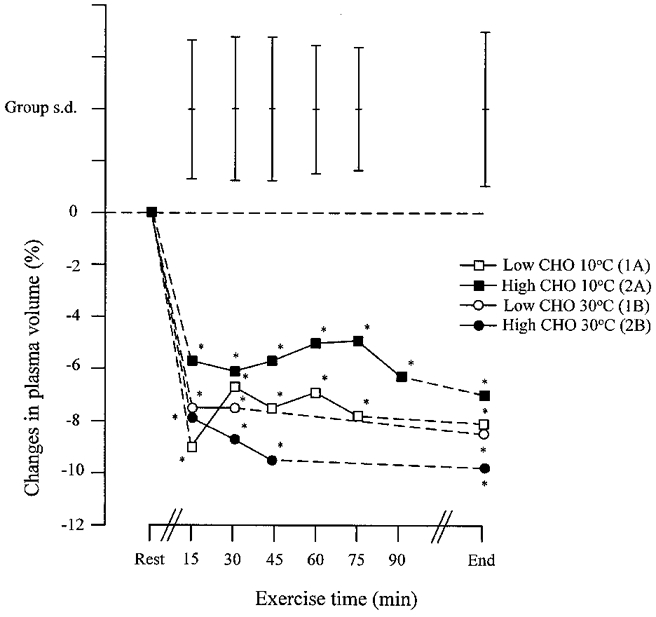
Mean values and s.d. are shown. * Significant reduction in plasma volume from the pre-exercise value.
Sweat rate and sweat loss during exercise
Mean sweat rate during exercise was greater in the heat than in the cold regardless of diet (Trial 1A, 0.95 ± 0.20 l h−1; 2A, 0.79 ± 0.12 l h−1; 1B, 1.70 ± 0.34 l h−1; 2B, 1.64 ± 0.26 l h−1). Diet had no effect on sweat rate during exercise at the same ambient temperature. During exercise at both ambient temperatures, there was a tendency for total sweat loss to be greater on the high CHO trial, reflecting the differences in exercise time, but no statistical difference was found (1.4 l during both high CHO trials compared with 1.1 l during both low CHO trials; P = 0.11).
DISCUSSION
The results of this study are consistent with the view that the factors responsible for the termination of prolonged exercise in the heat are not the same as those that cause fatigue at low ambient temperature. Fatigue during exercise in the heat may be a result of some thermoregulatory limitation (Nielsen et al. 1993; Nielsen, 1994) while in the cold, fatigue appears more likely to be the result of substrate depletion (Maughan et al. 1996). Exercise capacity for exercise of this intensity carried out at an ambient temperature of 18–20°C is known to be closely related to the pre-exercise muscle glycogen content (Bergstrom et al. 1967). Muscle glycogen content was not measured in this study, but previous studies have shown that the protocol used would have resulted in a substantially higher pre-exercise muscle glycogen content after the high CHO diet than after the low CHO diet (Hultman, 1967). In the present study, the point of exhaustion was reached on the high CHO trial in the heat sooner than after the low CHO diet in the cold; the total CHO oxidation was also less than at the point of fatigue on the low CHO trial in the cold. The CHO oxidation data are consistent with the proposition that fatigue during exercise in the cold was due to substrate depletion, but it is unlikely that muscle glycogen depletion was the primary limiting factor during exercise in the heat.
In the recent study by Galloway & Maughan (1997), the finding of a greater exercise capacity of subjects cycling at 70 % of VO2,max at an ambient temperature of 11°C than at 4, 21 or 31°C would suggest that 11°C is the optimum ambient temperature for this type of exercise. Muscle CHO depletion has been shown to be the primary cause of fatigue during prolonged exercise (Bergstrom et al. 1967); these experiments were carried out at normal room temperature (18–20°C). The average time to exhaustion (at a work rate corresponding to 71–82 % of the subjects'VO2,max) in the study by Bergstrom et al. (1967) was 167 min following the CHO rich diet and 57 min following the high fat and protein diet. In that study, 482 g of CHO was utilized on the high CHO trial while only 85 g was utilized on the high fat and protein trial. Exercise capacity at 10°C in the present study increased from 89 min following the low CHO diet to 158 min following the high CHO diet. The high CHO diet had the effect of increasing the rate of CHO oxidation during exercise (Fig. 3). The higher rate of CHO oxidation and the longer exercise time resulted in total CHO oxidation being greater during the two high CHO trials than during the two low CHO trials. Total CHO oxidation during exercise in the cold increased from 201 g during the low CHO trial to 434 g during the high CHO trial (Fig. 4) and it is highly probable that muscle CHO depletion was the primary cause of fatigue on both these trials as previously concluded by Bergstrom et al. (1967). Blood glucose concentration was well maintained on all four trials (Fig. 7), and was far from hypoglycaemic levels.
In the heat, exercise capacity increased from 44.0 min following the low CHO diet to 53.2 min following the high CHO diet; exercise capacity on both these trials was significantly less than on both trials in the cold. It is unlikely that CHO availability limited exercise capacity during the two trials in the heat as there was at least a 2-fold greater total CHO oxidation during the two trials in the cold than for the same diet conditions in the heat. Therefore, fatigue during exercise in the heat was most probably due to some thermoregulatory limitation. Galloway et al. (1997) have recently reviewed the published literature and concluded that fatigue during exercise in the heat can result from thermoregulatory stress, hypohydration, and/or changes in muscle metabolism.
The combined effect of heat exposure and metabolic heat production during exercise exerts a significant stress on the thermoregulatory system, resulting in a marked increase in TR. Fatigue during prolonged exercise in the heat has been attributed to this rise in core temperature (Nielsen et al. 1993; Nielsen, 1994). In the earlier of these two studies, the authors observed that fatigue in the heat before and after heat acclimation coincided with a ‘critical’ core temperature in each subject (oesophageal temperature of approximately 39.5°C). This led the authors to suggest that core temperature was the limiting factor during exercise in the heat. The ‘critical’ core temperature could affect the function of the motor centres (Nielsen, 1994), reduce the ability to recruit motor units (Nielsen, 1994), or even decrease ‘motivation’ for muscular activity (Bruck & Olschewski, 1987; Nielsen, 1994). However, in the present study, TR at exhaustion on both trials in the heat was higher than the critical core temperature reported by Nielsen et al. (1993) and was different between the trials: TR was higher at the end of exercise on the high CHO trial. The higher core temperatures found in the present study than the critical core temperature reported by Nielsen and colleagues (Nielsen et al. 1993) may be the result of the use of TR as the measurement of core temperature in this study. Rectal temperatures are generally 0.2°C higher than oesophageal temperature values (Saltin & Hermansen, 1966), the latter reflecting mixed venous blood temperature with an average difference of 0.1°C (Shiraki et al. 1986). Since hypothalamic temperature is mostly determined by the temperature of arterial blood (Nadel, 1977), the measured core temperature in the present study probably exceeds blood and, therefore, hypothalamic temperature.
Increases in muscle temperature could also have contributed to the earlier onset of fatigue during the two trials in the heat. Previous studies have found an association between muscle temperature and fatigue (Edwards et al. 1972; Segal et al. 1986). Possible mechanisms by which temperature may affect muscle function include alterations in enzyme kinetics and therefore in the rate of glycolysis (Edwards et al. 1972), and alterations in sarcoplasmic reticulum function (Inesi et al. 1973). The extent to which high muscle temperatures contributed to fatigue during the dynamic exercise used in the two trials in the heat cannot be determined based on the present data.
No measurable difference in hydration status between trials was found in the present study; changes in plasma volume and total sweat loss were similar. Heart rate during both trials in the heat was higher than in the cold (Fig. 5). The higher exercising HR in the heat can be attributed to an increased blood flow to the skin for heat dissipation while maintaining flow to the exercising muscles for O2 and substrate delivery. Previous authors have reported large increases in blood lactate concentration during exercise in the heat, and have attributed this increase to a compromised blood flow to the exercising muscles (Rowell et al. 1968; Fink et al. 1975). In the present study, a significantly higher blood lactate concentration was found during the high CHO trial in the heat than in the same diet condition in the cold, but no such difference was found when comparing the two low CHO trials (Fig. 7). It cannot be established from the measurements made in this study whether the higher blood lactate concentration on the high CHO trial in the heat than on the high CHO trial in the cold was the result of compromised blood flow to the exercising muscles or to a diet-induced increase in the rate of muscle glycogenolysis.
The reason for the earlier onset of fatigue during exercise in the heat on the low CHO trial than on the high CHO trial is not easily apparent. Nielsen et al. (1993) have proposed that exercise in the heat is terminated when a critical core temperature is reached, but exercise capacity on the low CHO trial was clearly terminated prior to the attainment of this critical core temperature: TR was lower at exhaustion on this trial than at the end of exercise on the high CHO trial. An alternative cause of fatigue must therefore apply during exercise in the heat with low muscle glycogen stores. Fatigue on the low CHO trial may have resulted from glycogen depletion within specific fibres due to an augmented rate of muscle glycogen degradation during exercise in the heat. Previous studies have shown a higher rate of muscle glycogenolysis during exercise in the heat than that measured in cooler environments (Fink et al. 1975; Febbraio et al. 1994). Fink et al. (1975) showed muscle glycogen degradation to be higher during prolonged intermittent exercise in the heat (41°C) than that observed in a 9°C cool environment. However, this effect of ambient temperature on muscle glycogenolysis has not always been observed (Young et al. 1985; Nielsen et al. 1990; Yaspelkis et al. 1993). A change in muscle fibre recruitment pattern from type I to type II fibres during exercise in the heat has been postulated by Young et al. (1985) based on the observation that subjects with a greater proportion of type II fibres had higher muscle lactate levels following exercise in the heat. In contrast, Febbraio et al. (1994) did not find a relationship between the muscle fibre recruitment pattern and post-exercise muscle lactate content, but found that type I fibres were preferentially recruited during exercise in the heat. In the present study, the only evidence in favour of increased glycogenolysis during exercise in the heat was the finding of a higher blood lactate concentration after 45 min of exercise and at exhaustion following the high CHO diet than for the same diet condition in the cold (Fig. 7). As muscle glycogen was not measured, the present data can neither refute nor confirm selective muscle glycogen depletion as the mechanism responsible for the earlier onset of fatigue during exercise in the heat following the low but also the high CHO diet.
Conclusions
This study has shown that the capacity to perform exercise at an intensity of about 70 % of VO2,max is influenced both by the ambient temperature and by a diet and exercise regimen designed to manipulate the pre-exercise muscle glycogen stores. In the heat and in the cold, exercise capacity was greater after the high CHO diet, but fatigue in the heat occurred before depletion of the body's CHO stores at both ambient temperatures.
During both trials in the cold, fatigue could have resulted from depletion of muscle glycogen stores. During the trials in the heat, it seems highly improbable that total muscle glycogen depletion was the performance-limiting factor. Fatigue after the low CHO diet in the heat is not easily explained either by hyperthermia or by substrate depletion.
Acknowledgments
This study was supported in part by a grant from Mars Incorporated. The authors acknowledge the assistance of Dr J. B. Leiper, Dr S. M. Shirreffs and Mr G. D. Henderson at various stages of this study. The co-operation of the subjects is greatly appreciated.
References
- Bergstrom J, Hermansen L, Hultman E, Saltin B. Diet, muscle glycogen and physical performance. Acta Physiologica Scandinavica. 1967;71:140–150. doi: 10.1111/j.1748-1716.1967.tb03720.x. [DOI] [PubMed] [Google Scholar]
- Bergstrom J, Hultman E. Muscle glycogen synthesis after exercise: an enhancing factor localised to the muscle cells in man. Nature. 1966;210:309–310. doi: 10.1038/210309a0. [DOI] [PubMed] [Google Scholar]
- Bergstrom J, Hultman E. A study of the glycogen metabolism during exercise in man. Scandinavian Journal of Clinical and Laboratory Investigation. 1967;19:218–228. doi: 10.3109/00365516709090629. [DOI] [PubMed] [Google Scholar]
- Borg GA. Psychophysical bases of perceived exertion. Medicine and Science in Sports and Exercise. 1982;14:377–381. [PubMed] [Google Scholar]
- Bruck K, Olschewski H. Body temperature related factors diminishing the drive to exercise. Canadian The Journal of Physiology and Pharmacology. 1987;65:1274–1280. doi: 10.1139/y87-203. [DOI] [PubMed] [Google Scholar]
- Christensen EH, Hansen O. I. Zur methodik der Respiratorischen quotient-bestimmungen in ruhe und arbeit. II. Untersuchungen uber die verbrennungsvorgange bei langdauernder, schwerer muskelarbeit. III. Arbeitsfahigkeit und ernahrung. Scandinavian Archives for Physiology. 1939;81:137–171. [Google Scholar]
- Dill DB, Costill DL. Calculation of percentage changes in volumes of blood, plasma, and red cells in dehydration. Journal of Applied Physiology. 1974;37:247–248. doi: 10.1152/jappl.1974.37.2.247. [DOI] [PubMed] [Google Scholar]
- Edwards RHT, Harris RC, Hultman E, Kaijser L, Koh D, Nordesjo L-O. Effect of temperature on muscle energy metabolism and endurance during successive isometric contractions, sustained to fatigue, of the quadriceps muscle in man. The Journal of Physiology. 1972;220:335–352. doi: 10.1113/jphysiol.1972.sp009710. [DOI] [PMC free article] [PubMed] [Google Scholar]
- Febbraio MA, Snow RJ, Hargreaves M, Stathis CG, Martin IK, Carey MF. Muscle metabolism during exercise and heat stress in trained men: effect of acclimation. Journal of Applied Physiology. 1994;76:589–597. doi: 10.1152/jappl.1994.76.2.589. [DOI] [PubMed] [Google Scholar]
- Fink WJ, Costill DL, Van Handel PJ. Leg muscle metabolism during exercise in the heat and cold. European Journal of Applied Physiology. 1975;34:183–190. doi: 10.1007/BF00999931. [DOI] [PubMed] [Google Scholar]
- Forster HV, Dempsey JA, Thomson J, Vidruk R, DoPico GA. Estimation of arterial PO2, PCO2, pH and lactate from arterialised venous blood. Journal of Applied Physiology. 1972;32:134–137. doi: 10.1152/jappl.1972.32.1.134. [DOI] [PubMed] [Google Scholar]
- Galloway SDR, Maughan RJ. Effects of ambient temperature on the capacity to perform prolonged cycle exercise in man. Medicine and Science in Sports and Exercise. 1997;29:1240–1249. doi: 10.1097/00005768-199709000-00018. [DOI] [PubMed] [Google Scholar]
- Galloway SDR, Shirreffs SM, Leiper JB, Maughan RJ. Exercise in the heat: factors limiting exercise capacity and methods for improving heat tolerance. Sports Exercise and Injury. 1997;3:19–24. [Google Scholar]
- Holland B, Welch AA, Unwin ID, Buss DH, Paul AA, Southgate DAT. In: The Composition of Foods. McCance RA, Widdowson ED, editors. Cambridge: Goodfellow Egan Phototypesetting Ltd; 1991. [Google Scholar]
- Hultman E. Studies on muscle metabolism of glycogen and active phosphate in man with special reference to exercise and diet. Scandinavian Journal of Clinical and Laboratory Investigation. 1967;19(suppl. 94):1–63. [PubMed] [Google Scholar]
- Inesi G, Millman M, Eletr S. Temperature-induced transitions of function and structure in sarcoplasmic reticulum membranes. Journal of Molecular Biology. 1973;81:483–504. doi: 10.1016/0022-2836(73)90518-4. [DOI] [PubMed] [Google Scholar]
- Maughan RJ. A simple, rapid method for determination of glucose, lactate, pyruvate, alanine, 3-hydroxybutyrate and acetoacetate in a single 20 μl blood sample. Clinica Chimica Acta. 1982;122:231–240. doi: 10.1016/0009-8981(82)90282-0. 10.1016/0009-8981(82)90282-0. [DOI] [PubMed] [Google Scholar]
- Maughan RJ, Galloway SDR, Pitsiladis Y, Shirreffs SM, Leiper JB. Thermoregulation and fluid balance as possible limiting factors in prolonged exercise in humans. In: Steinacker J, Ward SA, editors. The Physiology and Pathophysiology of Exercise Tolerance. USA: Plenum Publishing Co.; 1996. pp. 103–112. [Google Scholar]
- Mitchell JW, Nadel ER, Stolwijk JAJ. Respiratory weight losses during exercise. Journal of Applied Physiology. 1972;32:474–476. doi: 10.1152/jappl.1972.32.4.474. [DOI] [PubMed] [Google Scholar]
- Nadel ER. A brief overview. In: Nadel ER, editor. Problems With Temperature Regulation During Exercise. USA: Academic Press; 1977. pp. 1–10. [Google Scholar]
- Nielsen B. Heat stress and acclimation. Ergonomics. 1994;37:49–58. doi: 10.1080/00140139408963622. [DOI] [PubMed] [Google Scholar]
- Nielsen B, Hales JRS, Strange S, Christensen NJ, Warberg J, Saltin B. Human circulatory and thermoregulatory adaptations with heat acclimation and exercise in a hot, dry environment. The Journal of Physiology. 1993;460:467–485. doi: 10.1113/jphysiol.1993.sp019482. [DOI] [PMC free article] [PubMed] [Google Scholar]
- Nielsen B, Savard G, Richter EA, Hargreaves M, Saltin B. Muscle flood flow and muscle metabolism during exercise and heat stress. Journal of Applied Physiology. 1990;69:1040–1046. doi: 10.1152/jappl.1990.69.3.1040. [DOI] [PubMed] [Google Scholar]
- Ramanathan NL. A new weighting system for mean surface temperature of the human body. Journal of Applied Physiology. 1964;19:531–533. doi: 10.1152/jappl.1964.19.3.531. [DOI] [PubMed] [Google Scholar]
- Rowell LB, Brengelmann GL, Blackmon JR, Twiss RD, Kusumi F. Splanchnic blood flow and metabolism in heat stressed man. Journal of Applied Physiology. 1968;24:475–484. doi: 10.1152/jappl.1968.24.4.475. [DOI] [PubMed] [Google Scholar]
- Saltin B, Hermansen L. Esophageal, rectal and muscle temperature during exercise. Journal of Applied Physiology. 1966;21:1757–1762. doi: 10.1152/jappl.1966.21.6.1757. [DOI] [PubMed] [Google Scholar]
- Segal SS, Faulkner JA, White TP. Skeletal muscle fatigue in vitro is temperature dependent. Journal of Applied Physiology. 1986;61:660–665. doi: 10.1152/jappl.1986.61.2.660. [DOI] [PubMed] [Google Scholar]
- Shiraki K, Konda N, Sagawa S. Esophageal and tympanic temperature responses to core blood temperature changes during hyperthermia. Journal of Applied Physiology. 1986;61:98–102. doi: 10.1152/jappl.1986.61.1.98. [DOI] [PubMed] [Google Scholar]
- Yaspelkis BB, Scroop GC, Wilmore KM, Ivy JL. Carbohydrate metabolism during exercise in hot and thermoneutral environments. International Journal of Sports Medicine. 1993;14:13–19. doi: 10.1055/s-2007-1021139. [DOI] [PubMed] [Google Scholar]
- Young AJ, Sawka MN, Levine L, Cadarette BS, Pandolf KB. Skeletal muscle metabolism during exercise is influenced by heat acclimation. Journal of Applied Physiology. 1985;59:1929–1935. doi: 10.1152/jappl.1985.59.6.1929. [DOI] [PubMed] [Google Scholar]


