

Abstract
Calcium currents (ICa) were monitored in enzymatically isolated murine toe muscle fibres using the two-microelectrode voltage-clamp technique. ICa was recorded (i) in hypertonic solution to suppress contraction, and (ii) in actively shortening fibres in isotonic solution.
In hypertonic solution the threshold potential for ICa was about −30 mV for both 2 and 10 mM external Ca2+ solution. Maximum peak currents measured −12.6 ± 2.3 nA (mean ± s.d.; n = 4) in 2 mM Ca2+ and −65 ± 15 nA (n = 7) in 10 mM Ca2+. The time to peak (TTP) ICa was 96 ± 22 ms (n = 4) in 2 mM Ca2+ and 132 ± 13 ms (n = 7) in 10 mM Ca2+. The exponential decay of ICa was similar in 2 and 10 mM Ca2+ with rate constants (τ−1(V)) of 3.7 s−1 (2 mM) and 3.8 s−1 (10 mM) at +10 mV.
ICa in isotonic 10 mM Ca2+ solution was recorded by inserting the micropipettes exactly opposite to each other close to the centre of mass of the fibre where negligible contraction-induced movement occurs.
In isotonic 10 mM Ca2+ solution ICa had a smaller peak amplitude (−45 ± 5 nA; n = 7) and faster TTP (82.8 ± 22.1 ms; n = 7) than in hypertonic solution. The exponential decay of ICa showed a significantly larger τ−1(V) of 6.4 s−1 at +10 mV (P < 0.03).
To test for calcium depletion, extracellular Ca2+ was buffered by malic acid in isotonic solution to 9 mM. The decay of ICa had a time constant of 348 ± 175 ms (n = 14) vs. 107 ± 24 ms (n = 12; P < 0.001) at 0 mV in unbuffered 10 mM Ca2+ solution.
We conclude that calcium depletion from the transverse tubular system contributes significantly to the decay of calcium currents in murine toe muscle fibres under hypertonic as well as isotonic conditions. In the latter, depletion is even more prominent.
Slowly activating Ca2+ channels (dihydropyridine (DHP) receptors) in skeletal muscle fibres are almost exclusively located in the membrane of the transverse tubular system (TTS) (Nicola-Siri et al. 1980; Potreau & Raymond, 1980; Almers et al. 1981), which consists of small tubules as invaginations from the surface membrane. The TTS comprises about 0.3–0.4 % of the fibre volume in frog sartorius muscle (Peachey, 1965) and 0.5–0.6 % of that in rat laryngeal and sternomastoid muscle (Dulhunty, 1982; Hinrichsen & Dulhunty, 1982), whilst the TTS volume to surface ratio is smaller in mammalian compared with amphibian muscle fibres (Dulhunty, 1984). Currents through Ca2+ channels (ICa) decline during maintained depolarization under voltage-clamp conditions in amphibian (Beaty & Stefani, 1976; Stanfield, 1977; Sánchez & Stefani, 1978, 1983; Almers & Palade, 1981; Almers et al. 1981; Cota et al. 1983; Cota & Stefani, 1989) and mammalian muscle fibres (Donaldson & Beam, 1983; Francini et al. 1992; García et al. 1992).
In all previous voltage-clamp studies where ICa was recorded, active shortening and contraction of the tissue had to be avoided, for example in the Vaseline-gap technique by adding internal EGTA and in the two- or three-microelectrode voltage-clamp (2-MVC, 3-MVC) technique by adding external sucrose for hypertonicity (e.g. Hodgkin & Horowicz, 1957; Neuhaus et al. 1990). Therefore either the volume of the TTS increased due to hypertonicity (e.g. Fink et al. 1980; Moore et al. 1984) or the fibre contained the calcium binding-agent EGTA.
When using the 3-MVC technique in intact fibres under hypertonic conditions the decay of ICa in amphibian skeletal muscle was explained solely by a voltage-dependent inactivation mechanism (Cota & Stefani, 1989). However, with the Vaseline-gap technique it has been shown in amphibian skeletal muscle under isotonic conditions that tubular Ca2+ depletion is the main mechanism responsible for the decay of ICa when 80 mM EGTA is present in the myoplasmic space (Almers et al. 1981). With only 20 mM EGTA inside the fibre voltage-dependent inactivation was found and depletion was not evident, whereas it was clearly evident with 70 mM EGTA, suggesting that EGTA, needed to suppress shortening in cut fibre preparations, impaired the voltage-dependent inactivation mechanism and made Ca2+ depletion occur at higher EGTA concentrations (Francini & Stefani, 1989). However, there is some indirect evidence that tubular Ca2+ depletion also exists in fibres bathed in isotonic solutions (Lorkovic & Rüdel, 1983) and in stretched fibres (Nicola-Siri et al. 1980; Miledi et al. 1983; Cota et al. 1984).
In the present study Ca2+ currents were recorded for the first time in intact mammalian skeletal muscle under isotonic conditions in single short contracting fibres using the 2-MVC technique to address the point whether or not tubular Ca2+ depletion plays a role in the decay of ICa. From our results we show that calcium depletion from the TTS is likely to be even more of a problem in mammalian than in amphibian fibres and that it contributes significantly under physiological conditions to the decline of ICa under maintained depolarization.
METHODS
Preparations
Lumbrical and interossei muscles of male BALB/c mice (2–3 months old) were dissected using a dissection microscope (Olympus SZ60) after the animals had been killed by a 10 min exposure to an overdose of ether. All experiments were carried out according to the guidelines laid down by the local Animal Care Committee. The isolated muscles were treated with collagenase (Type IA, Sigma; 1.5 mg ml−1) for 30 min at 30°C in an incubator with gentle stirring. Collagenase was washed out with normal saline. The muscles were then incubated in isotonic high calcium test solution (10 mM Ca2+) and stored at 4°C for up to 15 h. For the electrophysiological experiments, single fibres were separated from the muscle bundles using a fire-polished Pasteur pipette to gently apply suction and pressure to the preparation. The isolated fibres were collected from the bottom of the Sylgard-coated dish with another Pasteur pipette and transferred to the recording chamber. Fibre dimensions were always measured in isotonic solution, and ranged from 420 to 681 μm in length and from 28 to 70 μm in diameter. The focusing error under our experimental conditions was estimated to be about ±7 μm for diameter measurements and ±14 μm for length measurements. To optimize the recording conditions and to minimize the voltage drop at the end of the fibres (see ‘Theory’) only short fibres with large diameters were used.
Solutions
Normal saline Ringer solution contained (mM): 136 NaCl, 4 KCl, 2 CaCl2, 1 magnesium acetate, 5 Hepes and 11 glucose. K+- and Cl−-free Ca2+ test solutions contained (mM): 146 TEA-Br, 1 magnesium acetate, 5 CsBr, 5 4-aminopyridine (4-AP), 5 3,4-di-aminopyridine (3,4-DAP), 10 Hepes, 2 or 10 calcium acetate and 11 glucose. The 10 mM Ca2+ solution had an osmolarity of about 322 mosmol l−1, and the 2 mM Ca2+ solution an osmolarity of 306 mosmol l−1 (Semi-Micro Osmometer Type ML, Knauer, Berlin, Germany). The ionic strengths (Γ/2 values) of the solutions were calculated to be 189 mM for 10 mM Ca2+ and 169 mM for 2 mM Ca2+, and the concentrations of ionic equivalents (Miller & Smith, 1984; Fink et al. 1986) were 178 mM for 10 mM Ca2+ and 162 mM for 2 mM Ca2+ solutions. In the Ba2+ experiments calcium acetate was replaced on an equimolar basis by barium acetate. For hypertonicity, 300 mM sucrose was added to the Ca2+ or Ba2+ solution. The pH was adjusted to 7.40 ± 0.02 with NaOH or fumarate. The Ca2+-buffered isotonic solution was designed using the binding constants from Martell & Smith (1977) for malic acid (Sigma) as the buffering agent. To calculate a free calcium concentration of 10 mM, the software program React (version 2.03, 1991, kindly provided by Dr G. L. Smith, Institute of Biomedical and Life Sciences, University of Glasgow, Glasgow, UK) was used. Furthermore, Ca2+-buffered solutions were adjusted to similarly high concentrations as in the unbuffered 10 mM Ca2+ solution using a calcium-sensitive electrode (Orion Laboratory Products, Boston, MA, USA). The high Ca2+-buffered solution was made with (mM): 1 Mg(OH)2, 10 Hepes, 1 4-AP, 1 3,4-DAP, 5 CsBr, 0.1 KCl, 65 Ca(OH)2, 120 TEA-OH and 115 malic acid, and had an ionic addition of 5 mM calcium acetate to increase the [Ca2+] to 8.8 mM measured by the Ca2+-sensitive electrode calibrated at a Γ/2 of 200 mM. The final buffered ∼9 mM Ca2+ isotonic solution had an osmolarity of 304 mosmol l−1.
Electrodes
Micropipettes for voltage-clamp measurements were made from borosilicate glass tubes (GB 150 F8P, Science Products, Hofheim, Germany) using a horizontal puller (P87, Sutter Instruments) in a two-step program. Pipettes were filled with 3 M KCl and connected to the amplifiers via AgCl electrodes. The electrode resistance ranged from 6 to 15 MΩ in normal saline. The reference electrode was a compact AgCl-Pellet (Science Products).
Recording chamber
The recording chamber consisted of two compartments (Fig. 1): one test compartment containing the actual recording solution, the preparation and the microelectrodes; and a second compartment containing 3 M KCl that was clamped to virtual ground via a bath headstage (VG-2A-x100, Axon Instruments). The two compartments were electrically connected by an agar bridge containing the same ionic composition as the test solution in the recording chamber to minimize junction potentials between the micropipettes and the reference electrode. Figure 1 shows a schematic diagram of the chamber and the circuit. Connected to the chamber were two small reservoirs for exchanging the solutions. On one side solution was supplied by hydrostatic pressure via a small glass pipette, and on the other side excess solution was continuously removed above a given level by a water suction pump. The volume of the recording chamber was 0.8 ml and could be completely exchanged within 10 s. To ensure complete exchange of solution the chamber volume was perfused with fresh solution about 6–7 times. While recording in a particular solution the test compartment was continuously perfused at a slow rate.
Figure 1. Recording chamber.
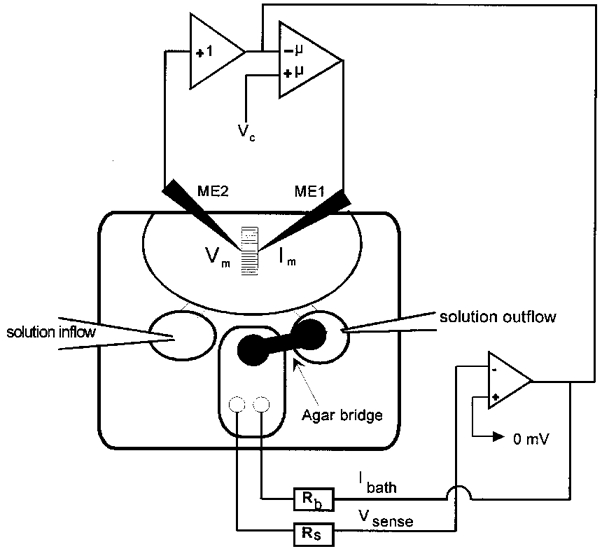
Schematic diagram of the recording chamber and the circuit for the 2-MVC technique using an additional bath clamp (μ, amplifer gain). The fibre is placed in the middle of the chamber allowing the micropipettes to be inserted perpendicular to the fibre axis. ME2, voltage-sensing microelectrode; ME1, current-passing microelectrode; Vc, command voltage; Rb, compensating bath current electrode for bath current Ibath; Rs, voltage-sensing bath electrode for bath voltage Vsense.
Voltage-clamp recording
The 2-MVC technique was performed with a commercial amplifier (GeneClamp 500, Axon Instruments) connected to a DMA interface (TL-1-125, Axon Instruments) and a 486DX microprocessor. Fibre penetration was performed under visual control on the stage of an inverted microscope (IMT-2, Olympus) with stepwise × 60, × 150 and × 300 optical amplification using a video camera (Sony CCD, DXC-107P). The micropipettes were positioned opposite each other close to the middle of the fibre and inserted perpendicular to the fibre axis (Fig. 2) allowing fibre contraction when depolarizing beyond the threshold potential. Using this technique the movements of the micropipettes and the related mechanical artifacts were minimized and damage to the membrane was avoided. The potential at the tip of the pipettes while inserting was monitored using the GeneClamp amplifier with AxoTape software (Axon Instruments). Resting membrane potentials ranged from −30 to −75 mV in isotonic solutions and were about 10–15 mV less negative in hypertonic solutions. Only fibres showing potentials of −40 mV or more negative values were used for further voltage-clamp experiments. Data acquisition and processing were performed using pCLAMP 6 software (Axon Instruments). Fibres were voltage clamped at a holding potential (Vh) of −70 mV and voltage-clamp protocols were run using a sampling rate of 400–770 Hz for the current traces. In 10 mM Ca2+ and Ba2+ solutions, linear currents during a voltage pulse were subtracted digitally using the P/4 leak subtraction procedure. The P/4 method has also been used in other studies on Ca2+ currents in muscle (e.g. Garcia et al. 1992) though we found that under our experimental conditions it only worked well for larger currents (e.g. ICa in 10 mM Ca2+ solutions) and smaller depolarizations (up to +20 mV). The P/4 method also leads in some fibres to apparent fast initial inward transients which increase with larger depolarizations. These initial transients (see e.g. Fig. 4) varied, however, from fibre to fibre; for example, they were not apparent in the currents shown in Fig. 8. For smaller currents, e.g. in 2 mM Ca2+ solution, overcompensation for non-linear leakage can be so severe that the amplitudes of the Ca2+ currents are affected. We therefore decided, for the analysis of ICa in 2 mM Ca2+ solutions (i) to subtract the estimated leakage following the decline of the capacitive transients before ICa developed from the original (not P/4-corrected) current traces, and (ii) to limit the depolarizations up to +20 to +30 mV.
Figure 2. Two microelectrodes approaching a single fibre perpendicular to the fibre axis.
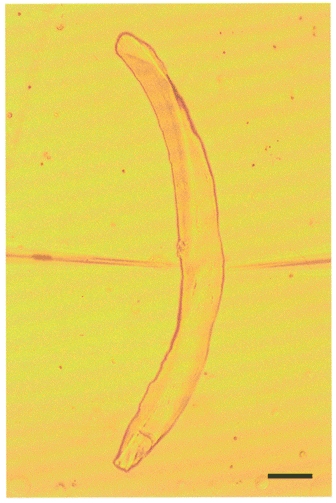
Scale bar, 50 μm.
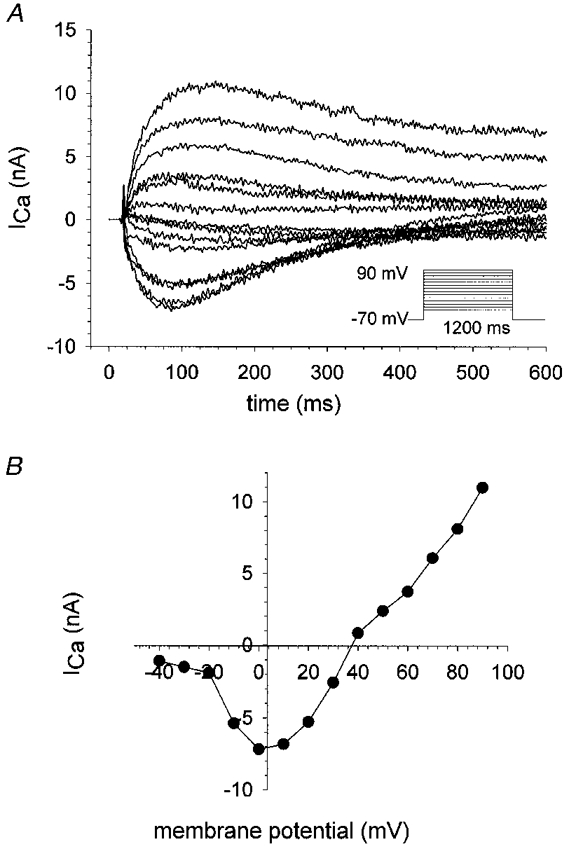
Figure 4. Calcium currents in hypertonic and isotonic 10 mM Ca2+ solution.
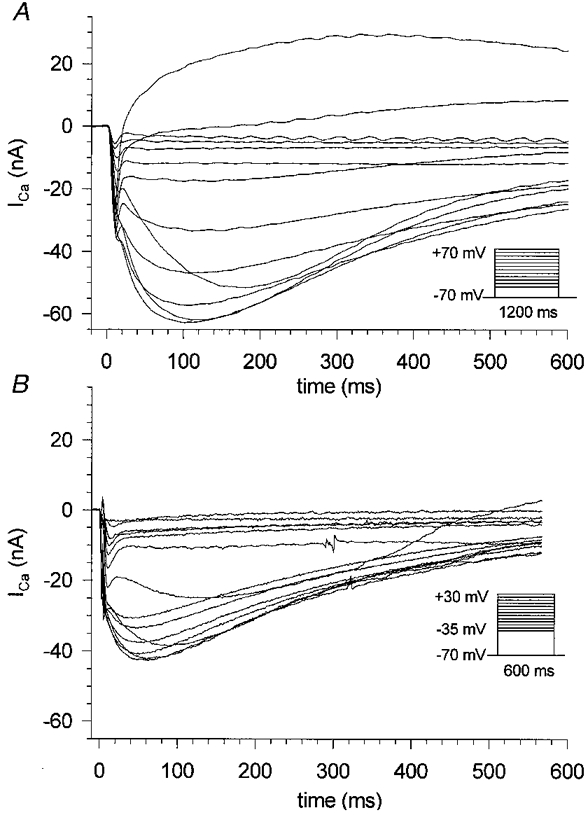
Calcium currents were elicited by the activation pulse protocols in the insets. A, currents recorded from a single fibre (length, 602 ± 14 μm; diameter, 56 ± 7 μm) bathed in hypertonic 10 mM Ca2+ solution containing 300 mM sucrose. The non-contracting fibres showed inward Ca2+ currents which decayed under maintained depolarization with 1.2 s test pulses. B, currents recorded in isotonic 10 mM Ca2+ solution (fibre dimensions: length, 595 ± 14 μm; diameter, 42 ± 7 μm). The fibre contracted and shortened with larger depolarizing steps of 600 ms duration. Note that fibre survival declined with longer pulse durations and also the voltage range was smaller in the isotonic case. For easier comparison only the first 600 ms in the hypertonic case are shown.
Figure 8. Decay of ICa under maintained depolarization.
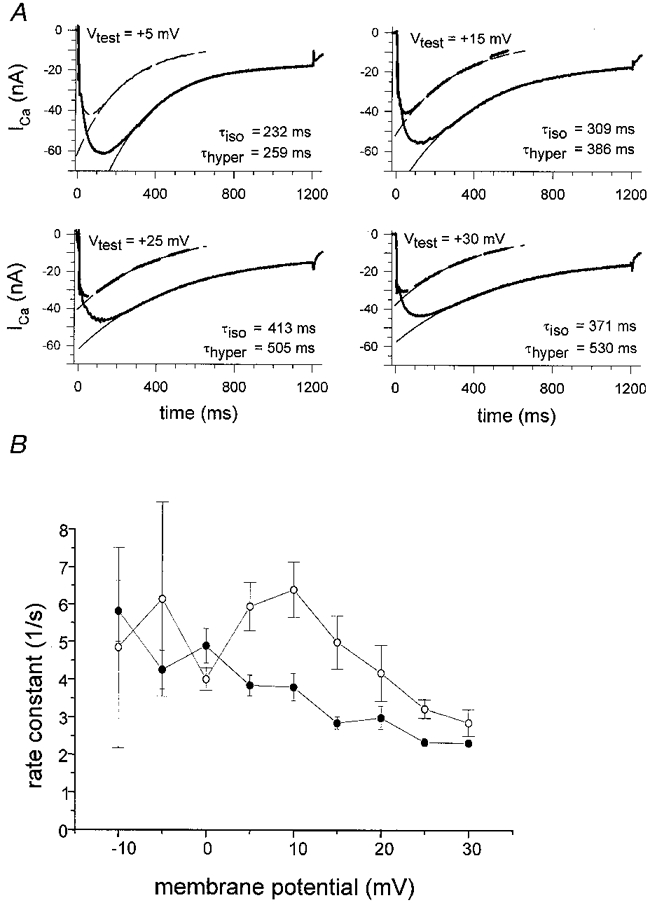
A, the decay of calcium currents under maintained depolarization is shown for four membrane potentials for two fibres of similar dimensions in 10 mM Ca2+ hypertonic (length, 630 μm; diameter, 42 μm; continuous lines) or isotonic solution (length, 616 μm; diameter, 42 μm; dashed lines). The decay was fitted by a single exponential with time constant τ. B, rate constants τ−1(V) in hypertonic (•, n = 7) and isotonic solution (○, n = 5) of similar value were calculated from the fits performed in A and are plotted for different membrane potentials. In the isotonic case, calcium currents showed a significantly faster decay for potentials more positive than 0 mV (P < 0.03, except for +20 mV where P = 0.16; Student's t test) indicating that at least one other mechanism (calcium depletion) is responsible for the decay of calcium currents in addition to voltage-dependent inactivation.
Series resistance errors were corrected for before and after each measurement by controlling the voltage between pipette and bath (see e.g. Finkel & Gage, 1985).
The following stimulation protocols were used. (a) Activation protocol: from the holding potential, 1.2 s (hypertonic solution) or 600 ms (isotonic solution) pulses were given over the range −70 to +80 mV (hypertonic solution) or −35 to +35 mV (isotonic solution) in 10 mV or 5 mV increments (P/4). (b) Inactivation protocol: prepulses lasting 1.75–2 s from −140 to +80 mV in 10 mV increments were applied followed by a 1.2 s test pulse to 0 mV (hypertonic solution).
Data analysis
Data analysis was carried out using pCLAMP 6, Sigma-Plot (Jandel Scientifics, USA) and Origin software (Microcal, USA). Values are given as means ±s.d. with the number of observations (n).
Theory
When current is applied to the middle of a short fibre the steady-state voltage distribution along the fibre length l is given by (e.g. Weidmann, 1952; Adrian et al. 1970; Jack et al. 1975):
where V0 is the steady-state (e.g. the command) voltage at the middle of the fibre at x = 0. The length constant λ is given by:
where Volfibre is the fibre volume, which is assumed to be constant, Rm is the membrane resistance, and Ri is the internal specific resistance. We used standard values for Ri at 22°C (160 Ω cm for isotonic solution, 250 Ω cm for hypertonic solution; Adrian et al. 1969).
Using the 2-MVC technique, we wanted to estimate the voltage error at the end of the fibre. The relative voltage drop ratio K(a, l, Ri, Rm) at the end of the fibre (x =l/2) with radius a can be obtained using the following equation:
Figure 3A shows the relationship between the voltage drop K at the end of the fibre, the fibre length and the membrane resistance (Rm) for a fixed radius (here a = 32 μm). A numerical calculation allowing a maximum of 5 % voltage drop (K≥ 0.95) and assuming a membrane resistance of 3000 Ω cm2 at a mean fibre radius of 25 μm suggests that the fibre length should not exceed about 550 μm. For a voltage drop of up to 15 % and a low Rm value of 500 Ω cm2 a required fibre length of 430 μm is obtained.
Figure 3. The voltage drop (K) calculated for toe muscle fibres approximated as uniform short cables.
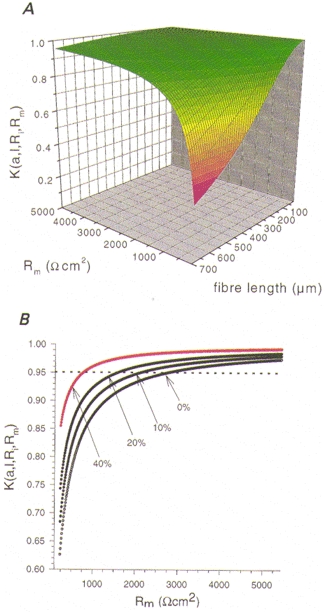
A, the voltage drop K at the end of a muscle fibre with length l is shown relative to the varying membrane resistance Rm. B, the effect of percentage shortening of fibre length during contraction is given for an average fibre with initial length l = 525 μm and a radius a = 24 μm. The voltage drop was continuously minimized during shortening with constant fibre volume improving the uniform spread of voltage along the membrane.
RESULTS
Figure 4 shows representative slow calcium currents (ICa) in single toe muscle fibres obtained with the 2-MVC technique under hypertonic (10 mM Ca2+ solution with 300 mM sucrose; Fig. 4A) and isotonic (10 mM Ca2+ solution; Fig. 4B) conditions at room temperature (22–23°C). The control voltage protocols are given in the insets. In hypertonic solution fibres were completely relaxed and non-shortening during depolarizing voltage pulses of 1.2 s or even longer duration. The slow ICa in hypertonic solution (Fig. 4A) started to develop at −30 mV reaching a maximum amplitude with voltage steps close to 0 mV. Outward currents were detected at +60 mV. The time to peak of these currents was 132 ± 13 ms in seven fibres which is about 100 ms faster than values found in omohyoid skeletal muscle of the rat (Donaldson & Beam, 1983) at room temperature. At the early onset of ICa an apparent fast inward transient can be seen for depolarizations more positive than about +30 mV in Fig. 4. This is most probably due to an overcompensation by the P/4 procedure for non-linear leak currents, and it varied in amplitude (see Methods and e.g. Figs 11 and 12). Also, these currents do not seem to be T-type Ca2+ currents which show a different voltage dependence, disappear during myogenesis and are unlikely to be found in adult mammalian muscle fibres (Beam & Knudson, 1988). Furthermore, the voltage dependence of the early transients rules out the possibility that they are due to Ca2+ flowing through Na+ channels (see e.g. Aggarwal et al. 1997; Gissel & Clausen, 1999). The kinetics of the initial transients are considerably faster than those of the Ca2+ currents through the L-type channels and do not seem to noticeably influence the slow ICa kinetics analysed in our study. Figure 4B shows ICa transients recorded in isotonic solution from a single fibre of similar dimensions to that in Fig. 4A. With increasingly depolarizing voltages fibres contracted slightly between −30 and −10 mV and more vigorously beyond −5 mV. In general, pulse durations of 600 ms were used and test pulses covered a range from −35 to +30 mV because fibre survival was found to be negatively correlated with larger pulse amplitudes and longer pulse durations. Therefore pulse protocols could cover only a small potential range compared with fibres in hypertonic solution and the pulse durations had to be shorter. Under these conditions the holding current between the test pulses remained very stable indicating no membrane damage occurred. With fibres in isotonic solution the slow ICa became evident at −25 mV and reached a maximal amplitude near +5 mV. The time to peak for the currents was shorter with a mean value of 82.8 ± 22.1 ms (n = 7) in fibres in isotonic solution compared with those in hypertonic solution. The I-V plots for peak ICa for seven fibres of similar dimensions in isotonic (open circles) and hypertonic solution (filled circles; fibre dimensions were always measured in isotonic solution) are shown in Fig. 5. Shortening fibres showed significantly smaller amplitudes for peak currents compared with non-shortening fibres (−45 ± 5 and −62 ± 13 nA at +5 mV, respectively). In addition, the maximum inward current was shifted by about 5 mV towards more positive potentials in isotonic compared with hypertonic solutions.
Figure 11. Inactivation (f∞) of calcium currents.
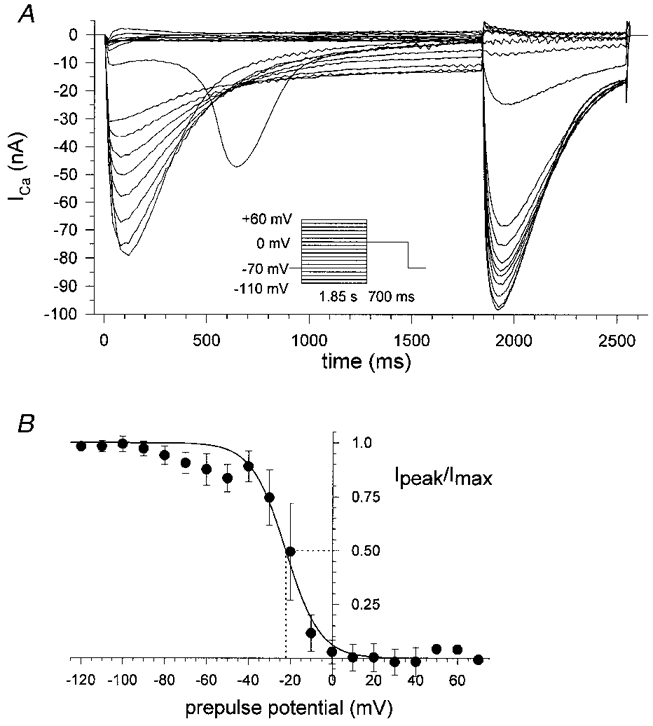
Recordings were obtained using the inactivation pulse protocol consisting of a variable prepulse followed by a depolarization to 0 mV. A, records for a single fibre in hypertonic solution (length, 595 μm; diameter, 42 μm). Peak currents were then normalized with respect to the maximum peak inward current measured during the 0 mV test pulse and plotted vs. the prepulse potential. B, averaged f∞ plots for ten fibres fitted with a Boltzmann function (dotted line, half-inactivation).
Figure 12. Comparison of calcium and barium currents in single fibres in 10 mM Ca2+ and 10 mM Ba2+ hypertonic solution.
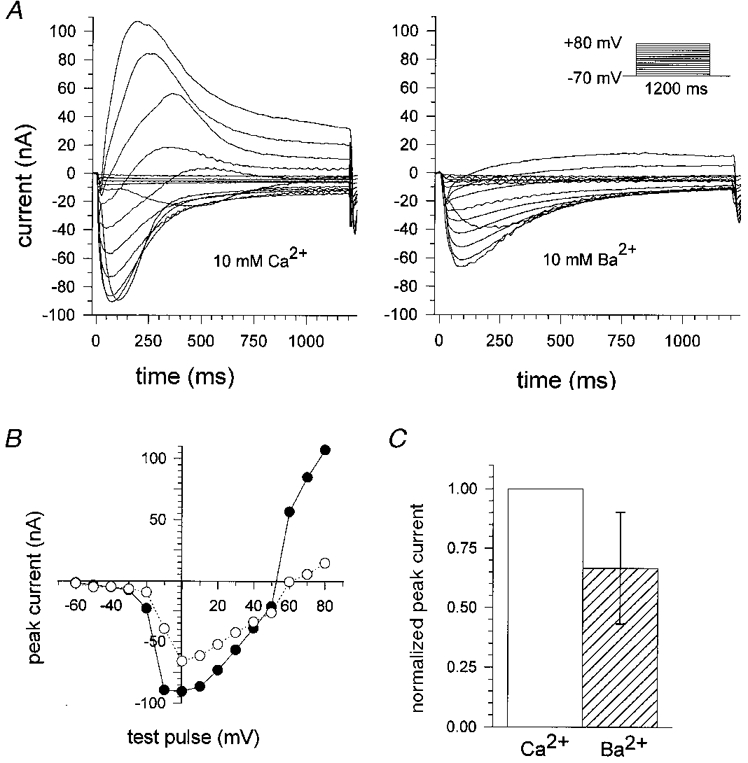
A, currents recorded in hypertonic solution containing 10 mM Ca2+ (left) and after changing to 10 mM Ba2+ (right) from a single fibre (length, 770 μm; diameter, 56 μm) stimulated for each condition with the same pulse protocol. Peak currents were smaller in amplitude when recorded in Ba2+. B, corresponding I-V plot for peak currents (•, 10 mM Ca2+; ○, 10 mM Ba2+). C, the decrease of the mean maximum peak current for Ba2+ (n = 6) was calculated and compared with the mean maximum peak current for Ca2+, which was set to 100 %.
Figure 5. I-V plot for peak Ca2+ currents in hypertonic and isotonic 10 mM Ca2+ solution.
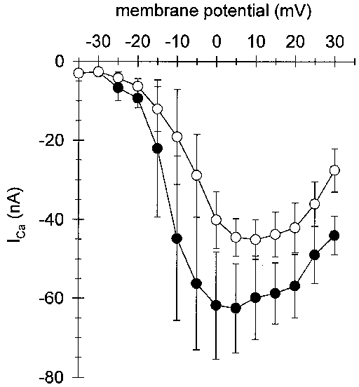
The I-V plot shows the averaged peak currents (±s.d.) vs. command voltage for seven single fibres in hypertonic (300 mM sucrose added, •) and isotonic solution (normal 10 mM Ca2+ saline, ○). In the two cases the threshold potential was the same (−30 mV). Shortening fibres (○) showed significantly smaller amplitudes for peak currents in 10 mM Ca2+ compared with non-shortening fibres (•). The maximum inward currents for the isotonic case were shifted by about 5 mV towards more positive potentials compared with the hypertonic case.
For the physiological Ca2+ concentration of 2 mM representative slow calcium currents are given in Fig. 6A. The measurements were carried out in hypertonic 2 mM Ca2+ solution. In 2 mM Ca2+ solution the peak current amplitude at 0 mV had a mean value of −12.6 ± 2.3 nA (n = 4) and showed a time to peak of 96.3 ± 20.2 ms (n = 4). The voltage-dependent activation of the slow Ca2+ currents expressed as the averaged 10–90 % rise time for eight fibres in hypertonic solution (filled circles) and six fibres in isotonic solution (open circles) is given in Fig. 7 for test solutions containing 10 mM Ca2+. Under the two experimental conditions the Ca2+ currents showed similar rise times between −10 and 0 mV whereas the currents of shortening fibres reached their peak amplitudes slightly faster than non-shortening fibres for positive voltage steps.
Figure 6. Slowly activating calcium currents (ICa) in hypertonic solution containing 2 mM Ca2+.
A, ICa in a single fibre bathed in hypertonic test solution containing a physiological concentration of 2 mM Ca2+. Pulse protocol is shown in the inset. Fibre dimensions were: length, 495 ± 7 μm; diameter, 49 ± 7 μm. Holding potential, −70 mV. B, the corresponding I-V plot. Peak currents were usually reduced by a factor of approximately 5–7 compared with measurements done in 10 mM Ca2+-containing solution (see Figs 4 and 5).
Figure 7. Rise time (10–90 %) of calcium currents in hypertonic and isotonic 10 mM Ca2+ solution.
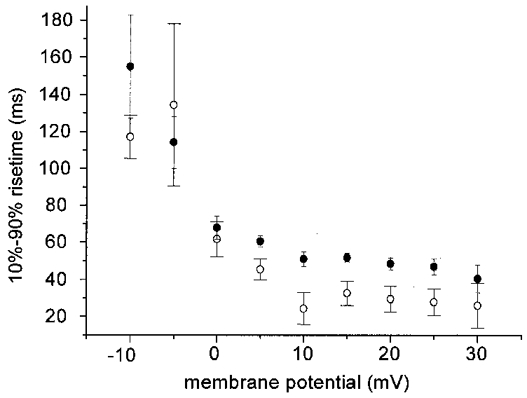
Averaged 10–90 % rise times are shown for maximal activation of inward currents of single fibres in hypertonic (•, n = 8) and isotonic (○, n = 6) solution relative to the membrane potential. In the isotonic case the rise times for positive voltage steps were slightly faster than in the hypertonic case.
The slow ICa decayed under maintained depolarization for voltages between −30 and +80 mV and could be fitted by a single exponential time course as previously described (Almers et al. 1981; Francini & Stefani, 1989). Figure 8 shows the time course of the exponentials fitted to the Ca2+ currents for intact isolated fibres in hypertonic and isotonic 10 mM Ca2+ solution. In Fig. 8A, the currents for the two conditions are displayed on the same plot for two fibres with similar dimensions at four different voltage steps from +5 to +30 mV. Again, Ca2+ currents of fibres in isotonic solution (dashed lines) were smaller in amplitude when compared with those in hypertonic solution (continuous lines). For each voltage step decay time constants (τ) were smaller in isotonic solution than in hypertonic solution. Time constants for hypertonic 2 mM Ca2+-containing solution were comparable to those for 10 mM Ca2+, being 260 ± 120 ms at 0 mV (n = 6) and 269 ± 125 ms at +10 mV (n = 7). In Fig. 8B, the rate constants for 10 mM Ca2+ solution are plotted against the depolarizing membrane potential for seven fibres in hypertonic solution (filled circles) and five fibres in isotonic solution (open circles). The rate constants in the isotonic case were significantly larger than those in the hypertonic case for all potentials more positive than +5 mV. If one assumes that the decline of current is mostly due to inactivation in the hypertonic case (Cota & Stefani, 1989), the larger rate constants for fibres in isotonic solution strongly suggests an additional mechanism for the decay of ICa, which is most probably the mechanism of tubular Ca2+ depletion suggested by Almers et al. (1981). As a further test of the depletion hypothesis, we investigated the effect of the extracellular calcium buffer malic acid on the time course of current decline (Almers et al. 1981). The calcium currents of representative single fibres (Fig. 9A and B) were compared in unbuffered isotonic 10 mM Ca2+ solution (left panel of Fig. 9A and B) and buffered isotonic 9 mM Ca2+ solution (right panel of Fig. 9A and B). For all fibres, the current decline was slowed down in Ca2+-malate, which supports the depletion hypothesis if one considers that the approximately eightfold higher total calcium concentration of the undissociated Ca2+-malate compared with the free Ca2+ concentration of 9 mM will buffer Ca2+ in the TTS compartment thus reducing changes in calcium concentration and thereby slowing down the decline in ICa. As only a few test pulses were applied, it should be noted that for these shorter protocols pulse durations were well tolerated up to 1200 ms in shortening fibres. In about 40 % of the fibres the initial decline of current was followed by a second component of inward current as shown in Fig. 9B (left panel) which was not observed in the other 60 % of the fibres following an exponential time course throughout the whole decline (Fig. 9A, left panel). The time constants of the initial decline in the two types of current were not significantly different (Student's unpaired t test, P = 0.78) and were therefore grouped together (Fig. 9C). It should also be noted that the time constants of the same fibres (with or without a second inward current) were in the same range in the buffered 9 mM free Ca2+ solutions where we never observed a second component of inward current. Thus, the nature of the second inward current remains unclear as a simple mechanical artifact should also result in a second component of the likewise contracting fibre in the Ca2+-buffered solution.
Figure 9. Actively shortening single fibres bathed in isotonic unbuffered 10 mM Ca2+ and buffered 9 mM Ca2+ solution.
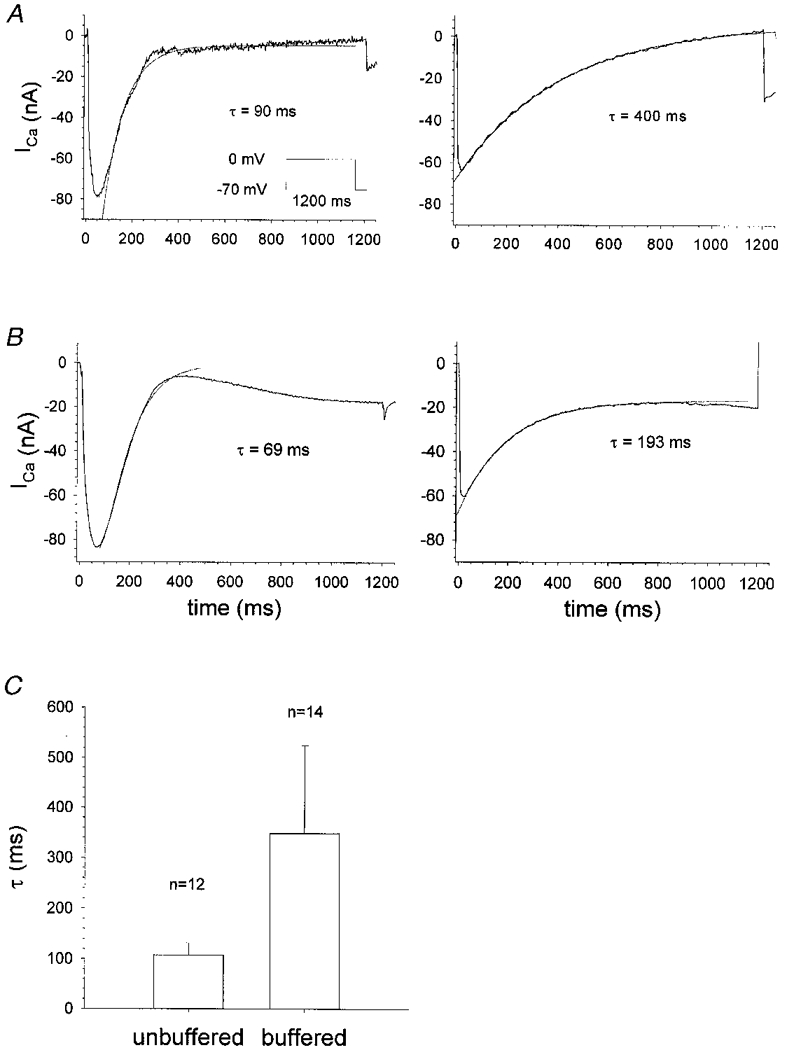
A, the slow ICa is shown in a representative fibre bathed in unbuffered isotonic 10 mM Ca2+ solution (left plot: length, 490 ± 14 μm; diameter, 70 ± 10 μm), elicited by a test pulse to 0 mV from a holding potential of −70 mV. The decay of the current was fitted by a single exponential with the indicated time constant. The right plot shows the slow ICa in another fibre after solution exchange to calcium-buffered isotonic 9 mM Ca2+ solution (length, 455 ± 14 μm; diameter, 42 ± 7 μm). The time constant of the decay was increased fourfold. B, ICa in a different fibre (length, 490 ± 14 μm; diameter, 70 ± 7 μm) for both unbuffered (left plot) and buffered (right plot) solution. In some fibres (about 40 % of the experiments), a second component of the inward current was detected following the initial peak of the decline. In C the means and s.d. of the time constants for the decay in twelve unbuffered and fourteen buffered fibres are shown. On average, buffered vs. unbuffered fibres showed a ratio of 3 : 1 for the time constant (P < 0.001; Student's t test).
Figure 9C compares the mean time constants for the initial decline of the Ca2+ currents in the unbuffered and Ca2+-buffered solutions. The mean time constant of 349 ± 175 ms (n = 14) in the buffered case differed significantly from that of 107 ± 24 ms (n = 12) in the unbuffered case (Student's unpaired t test, P < 0.001). The threefold larger time constant in the Ca2+-buffered solution is strong evidence for the contribution of Ca2+ depletion in the TTS to the decay of slow ICa in unbuffered isotonic solution.
Figure 10 compares the current-voltage relationship and the ‘steady-state’ activation of calcium currents in hypertonic and isotonic 10 mM Ca2+ solution. The left-hand panels in Fig. 10A (hypertonic) and Fig. 10B (isotonic) show the I-V plots for membrane current density calculated under the assumption of a negligible voltage drop as set out in the approximation for the short fibre developed in the Methods (fibre length was about 450 μm and diameter was about 50 μm for both fibres). The maximal calcium slope conductance gCa obtained from the I-V plots was 2.1 mS in hypertonic and 1.7 mS in isotonic solution. The ‘steady-state’ activation d∞ was calculated as given by Matsuda et al. (1990):
Figure 10. Activation of calcium currents for isotonic and hypertonic 10 mM Ca2+ solution.
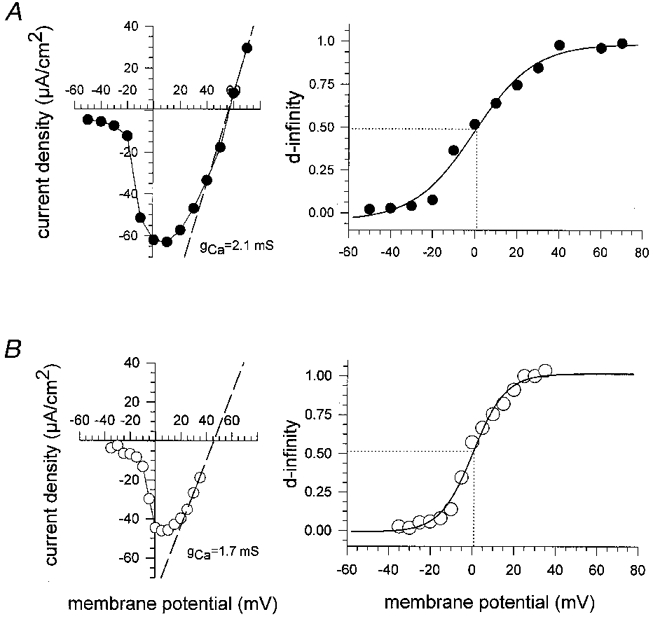
The activation of calcium currents was calculated from the I-V plot for the activation pulse protocol of two single fibres using the equation for the activation d∞=Ipeak,Ca/(gCa(V - Vrev)). The I-V plots are given for membrane current density. The maximum slope conductance gCa was interpolated from the I-V plot. The activation plot was well fitted by a Boltzmann function. A, hypertonic case. B, isotonic case. Note that half-activation (dotted line) was similar in the two cases (0 mV vs.+1 mV).
where the reversal potential Vrev was determined by using the maximal slope of the I-V plot extrapolated through the apparent reversal potential (Matsuda et al. 1990). In 2 mM hypertonic Ca2+ solution the apparent reversal potential was found at +47 ± 14 mV (n = 4). For 10 mM external Ca2+ the reversal potentials were +47.8 ± 4.6 mV (n = 5) for hypertonic and +47.6 ± 2.0 mV (n = 3) for isotonic solution. For both experimental conditions d∞ followed a Boltzmann function with a very similar half-activation (d0.5) between 0 and +5 mV. To investigate the inactivation f∞ of ICa, an inactivation protocol (see Methods) was carried out (Matsuda et al. 1990). As a relatively long depolarizing prepulse was necessary to establish voltage-dependent inactivation, the protocol could only be performed on fibres in hypertonic solution because in isotonic solution the survival of shortening fibres was limited to the first two or three of the very long (about 2 s) prepulse steps required. Figure 11 shows recordings of ICa during the inactivation protocol (Fig. 11A) and the calculation of the f∞ graph by normalizing the peak currents during the 0 mV test pulse to the maximum inward current Imax (Fig. 11B). The experimental points were also fitted with a Boltzmann function. V0.5 was −20.4 ± 5.3 mV in ten relaxed fibres which is more positive than the value found in twitch muscle fibres of the frog (−27.5 mV; Francini & Stefani, 1989).
We also compared inward currents in hypertonic 10 mM Ca2+ solution with those in hypertonic 10 mM Ba2+ solution. Though Ba2+ has been found to have slightly larger peak inward currents in rat omohyoid muscle fibres by Donaldson & Beam (1983), these authors assumed similar barium permeability to that of calcium. Ba2+ caused a hyperpolarizing shift in the voltage dependence of the inward currents under their experimental conditions. In our preparation Ba2+ also caused a hyperpolarizing shift in the holding current of about 10–15 nA at −70 mV. Figure 12A shows the recorded currents of a single fibre first bathed in 10 mM external Ca2+ and then after exchange to 10 mM external Ba2+. In our preparation, Ba2+ caused a reduction of peak current for inward and outward currents. Time to peak remained unchanged. The corresponding I-V plot is shown in Fig. 12B. Figure 12C shows the decrease of the maximum peak currents in six fibres for Ba2+ compared with the maximum peak currents for Ca2+ which were set to 100 %. IBa was about 30 % smaller in amplitude.
DISCUSSION
Total Ca2+ membrane currents and membrane current density
We measured slowly activating ICa in single murine muscle fibres using the 2-MVC technique. This method has the advantage of allowing the monitoring of intact fibres under active shortening even in the physiological state of isotonic external solution during depolarizing voltage steps above the contraction threshold (for cut skeletal muscle fibres see Kim et al. 1996). The total Ca2+ membrane currents can be converted into approximated membrane current densities when the drop of the command voltage at the end of the fibre is minimized by the use of short thick fibres with large diameters. The validity of the approximation is derived in the Methods, and the voltage drop is shown in Fig. 3A as a function of membrane resistance and fibre length. The approximation justifies the assumption of a uniform depolarization in short fibres with a large diameter when current is applied to the middle of the fibre length. For example, the relative voltage drop is calculated to be less than 5 % for a Rm of 3000 Ω cm2, a fibre length of 525 μm and a diameter of 48 μm. Considering a contracting fibre in isotonic solution during stimulation, one can determine from the equations given in the Methods that the value of the length constant λ increases during contraction due to a reduction of the length to diameter ratio. Figure 3B shows the development of the voltage drop for a contracting fibre during different percentages of shortening. Assuming a maximum shortening by 40 % of the original length the voltage drop was not larger than 5 % even for calcium conductances (gCa) near the maximum slope conductance of 1.7 mS in the isotonic case (Fig. 10B). Our application of the 2-MVC technique for short contracting fibres also allows investigation of other total membrane currents, e.g. those of the delayed rectifier K+ conductance, from which the membrane current densities can be calculated for given fibre dimensions.
Influence of tonicity on activation kinetics and amplitudes of slow calcium currents
We observed different amplitudes of peak currents in isotonic and hypertonic solutions. With shortening fibres in isotonic solution peak currents appeared to be up to 50 % smaller in amplitude and also showed a shorter time to peak compared with currents recorded in fibres of similar dimensions in hypertonic solution. This might be due to two possible mechanisms. (i) In hypertonic solution the volume of the TTS is expected to enlarge relative to the shrinking fibre volume (Freygang et al. 1964; Cota & Stefani, 1989), which was shown by electron microscopy studies (Moore et al. 1984) as well as indicated from asymmetric charge and membrane capacity measurements (Lamb, 1986). The total membrane surface area remains constant. This leads to a higher Ca2+ flux from the external bulk solution into the TTS compartment in the presence of a concentration gradient which appears as soon as L-type Ca2+ channels open and start to deplete the TTS compartment. (ii) The higher volume of the TTS in the hypertonic case means more time is required for this volume to be depleted compared with the isotonic case, assuming a constant number of channels for both. Therefore, currents from fibres in isotonic solution are substantially diminished due to depletion of Ca2+ in the TTS when compared with currents in fibres bathed in hypertonic solution. The currents in fibres bathed in isotonic solution consequently should show a shorter time to peak and a reduced amplitude of the peak current, which is consistent with our experimental findings (Figs 4 and 8A; see also below). Peak conductances and time-to-peak values in our preparations of mouse toe muscle were about 50 % smaller than those measured with the 3-MVC technique in rat omohyoid muscle (Donaldson & Beam, 1983) under otherwise similar hypertonic conditions.
In our study, the voltage-dependent steady-state activation of ICa was similar in fibres bathed in hypertonic or isotonic solution (Fig. 10). This may indicate that the intrinsic voltage-dependent gating properties of the L-type Ca2+ channels are not influenced by the hypertonicity of the external solution needed to suppress contraction.
Similarly, the reversal potentials for the slowly activating ICa were about +48 mV under both hypertonic and isotonic conditions for 10 mM Ca2+ solution and +47 mV for 2 mM hypertonic Ca2+ solution which deviate from the theoretical values given by the Nernst equation of approximately +148 mV (10 mM Ca2+) and +127 mV (2 mM Ca2+) for an assumed intracellular Ca2+ concentration of 10−7 M. The differences between observed and calculated reversal potentials can be explained by the additional flux of monovalent cations, e.g. K+, through L-type Ca2+ channels as first proposed by Reuter & Scholz (1977) for mammalian cardiac muscle (see also for example Ohya et al. 1986, for mammalian intestinal muscle) and recently demonstrated in a complex model which gave an open channel I-V relationship for L-type Ca2+ channels that resulted in a reversal potential of approximately +68 mV (Jafri et al. 1998).
Inward currents with barium substituted for calcium
Replacement of Ca2+ with Ba2+ in the external solution also resulted in inward currents. Interestingly, in our preparations Ba2+ currents were about 30 % smaller than currents recorded in equimolar Ca2+ whereas in frog muscle fibres (Almers et al. 1981) and rat muscle fibres (Donaldson & Beam, 1983) equimolar replacement with Ba2+ gave larger or similar currents. A possible explanation might be that Ca2+ was not completely removed during the solution exchange in our preparations. Although we used a solution volume 10 times greater than the chamber volume it is possible that a small amount of Ca2+ remained in the chamber which may have led to smaller currents than with either divalent cation alone (Almers & McCleskey, 1984; Hess & Tsien, 1984).
Depletion of Ca2+ from the transverse tubular system
The decline of ICa under maintained depolarization using the Vaseline-gap technique (Almers et al. 1981; Francini & Stefani, 1989; Cota & Stefani, 1989) or the 3-MVC technique (Donaldson & Beam, 1983) has been shown to be due to two important mechanisms: (i) Ca2+ depletion from the TTS, and (ii) voltage-dependent inactivation. However, it is still controversial to what degree the two mechanisms contribute to the decline of ICa, in particular for muscle fibres under physiologically isotonic conditions.
Using the Vaseline-gap technique on ‘cut’ semi-tendinosus fibres in isotonic solution, Almers et al. (1981) found with 10 and 100 mM extracellular Ca2+ and with 70 mM internal EGTA that depletion of Ca2+ from the TTS was the dominant mechanism explaining the decay of ICa under maintained depolarization adequately, although a smaller voltage-dependent inactivation was also described by these authors. The depletion was slower and less complete with a higher calcium ion concentration.
Under hypertonic conditions using the 3-MVC technique only voltage-dependent inactivation was found in frog sartorius muscle fibres (Cota & Stefani, 1989). For the hypertonic case our data confirm the presence of voltage-dependent inactivation in a mammalian toe muscle fibre preparation (see Fig. 11). Examination of the influence of intracellular EGTA on the decay of slowly activating Ca2+ currents using the Vaseline-gap technique led to the conclusion that a high concentration of EGTA impairs the voltage-dependent inactivation mechanism. For example, with a concentration of 70 mM EGTA (Almers et al. 1981; Francini & Stefani, 1989) Ca2+ depletion becomes the main factor for the decay of ICa while with 20 mM EGTA inside the fibre only voltage-dependent inactivation was present (Francini & Stefani, 1989).
Thus, the decline of ICa in skeletal muscle has not been studied under isotonic conditions without EGTA or another Ca2+ buffer in the internal solution to suppress contraction.
In this context, it should be mentioned that transverse tubular changes in the free Ca2+ concentration have recently been directly followed by the use of the lipophilic membrane-associated Ca2+ indicator Calcium Green C-18 with laser-scanning confocal microscopy in cardiac myocytes (Blatter & Niggli, 1998).
Our application of the 2-MVC technique allowed for the first time investigation of the time course of the decline of ICa in intact fully contracting skeletal muscle fibres under isotonic physiological conditions. Active shortening of the fibres did not have to be suppressed which also allowed the E-C coupling mechanism to remain intact.
The rate constants for the decay due to the voltage-dependent inactivation mechanism in amphibian skeletal muscle reported by Cota & Stefani (1989) never exceeded 2 s−1 (up to +40 mV). Francini & Stefani (1989) gave even lower values, in the range 0.5–1.2 s−1 (also up to +40 mV) although the authors suggested that their constants might be affected by EGTA-induced impairment of the inactivation mechanism. The magnitude of the rate constants where depletion was evident was at least 4 s−1 (Almers et al. 1981; Francini & Stefani, 1989). In our study the magnitude of the rate constants as well as their decline at higher potentials (see Fig. 8B) suggest that in addition to the voltage-dependent inactivation there is Ca2+ depletion from the TTS which contributes significantly to the decay of ICa. This depletion seen in fibres bathed in isotonic solution should be far less pronounced or not occur at all in hypertonic solution because of the fractional increase of the TTS volume relative to the fibre volume by hypertonicity. This is supported by the values for the rate constants of ICa decay in isotonic solution which were always larger than those in hypertonic solution for potentials more positive than 0 mV (Fig. 8B). For smaller depolarizations the individual differences in thresholds for the ICa activation of the fibres and the incomplete voltage-dependent activation (Fig. 7) resulted in a large scatter of the data and may also mask the difference in the rate constants for the initial decay observed for larger depolarizations in fibres bathed in isotonic compared with hypertonic solution (Fig. 8B). Our experiments also confirmed the presence of calcium depletion in the TTS of interossei fibres when we used an extracellular calcium buffer (malic acid) to investigate the rate of decline, similar to the approach taken by Almers et al. (1981). The decline of the Ca2+ currents under maintained depolarization was significantly slower in the presence of malic acid (Fig. 9) which could only be explained by the minimization of changes in Ca2+ concentration with the Ca2+ buffer in the depleted TTS compartment. However, some voltage-dependent inactivation was still present, as seen by a slow exponential decline. Overall, our results are similar to those of Almers et al. (1981) in amphibian semitendinosus muscle fibres with external Ca2+ buffer and a high internal EGTA concentration, whereas Francini & Stefani (1989) did not find any depletion of Ca2+ in the TTS in their study with 20 mM intracellular EGTA in amphibian semi-tendinosus muscle fibres.
The different extents of Ca2+ depletion from the TTS may simply be due to the differences in the TTS geometry in amphibian and mammalian muscles. These differences were confirmed by (i) direct electron microscopy evidence by Dulhunty (1984) who showed that the volume to surface ratio of the TTS was smaller in mammalian than in amphibian fibres (see also Peachey, 1965, amphibian sartorius muscle; Hinrichsen & Dulhunty, 1982, mammalian laryngeal muscle), and (ii) capacitance measurements of different mammalian and amphibian muscle types (Huang, 1983; Dulhunty et al. 1984; Lamb, 1986). The higher total tubular system volume in mammalian compared with amphibian muscle is mainly due to the presence of two transverse tubules per sarcomere in mammalian muscle and only one per sarcomere in amphibian muscle. These data are fully supported by our findings which clearly show that Ca2+ depletion from the TTS is an important mechanism substantially contributing to the decline of ICa under maintained depolarization which seems to be even more predominant in mammalian fibres under isotonic conditions than under hypertonic conditions.
It should be pointed out that under our experimental conditions the decay of ICa is obtained from fibres in a more physiological state than in previous studies. The main conclusion from our results is that both mechanisms, voltage-dependent inactivation and Ca2+ depletion from the TTS compartment, contribute to the decay of ICa during maintained depolarization under isotonic physiological conditions in murine fast-twitch toe muscle fibres.
Acknowledgments
We are grateful to Professor H. Ch. Lüttgau for helpful comments on the manuscript. This work was supported by grants from the European Community (BMH4-CT96-1552) and the Deutsche Forschungsgemeinschaft (DFG, Graduiertenkolleg 388 ‘Biotechnologie’). Parts of the work are the subject of a doctoral thesis (O. F.).
References
- Adrian RH, Chandler WK, Hodgkin AL. The kinetics of mechanical activation in frog muscle. The Journal of Physiology. 1969;204:207–230. doi: 10.1113/jphysiol.1969.sp008909. [DOI] [PMC free article] [PubMed] [Google Scholar]
- Adrian RH, Chandler WK, Hodgkin AL. Voltage clamp experiments in striated muscle fibres. The Journal of Physiology. 1970;208:607–644. doi: 10.1113/jphysiol.1970.sp009139. [DOI] [PMC free article] [PubMed] [Google Scholar]
- Aggarwal R, Shorofsky SR, Goldman L, Balke CW. Tetrodotoxin-blockable calcium currents in rat ventricular myocytes; a third type of cardiac cell sodium current. The Journal of Physiology. 1997;505:353–369. doi: 10.1111/j.1469-7793.1997.353bb.x. [DOI] [PMC free article] [PubMed] [Google Scholar]
- Almers W, Fink R, Palade PT. Calcium depletion in frog muscle tubules: the decline of calcium current under maintained depolarization. The Journal of Physiology. 1981;312:177–207. doi: 10.1113/jphysiol.1981.sp013623. [DOI] [PMC free article] [PubMed] [Google Scholar]
- Almers W, McCleskey EW. Non-selective conductance of calcium channels in frog muscle. The Journal of Physiology. 1984;353:565–583. doi: 10.1113/jphysiol.1984.sp015352. [DOI] [PMC free article] [PubMed] [Google Scholar]
- Almers W, Palade PT. Slow calcium and potassium currents across frog muscle membrane: measurements with a vaseline-gap technique. The Journal of Physiology. 1981;312:159–176. doi: 10.1113/jphysiol.1981.sp013622. [DOI] [PMC free article] [PubMed] [Google Scholar]
- Beam KG, Knudson CM. Effect of postnatal development on calcium currents and slow charge movement in mammalian skeletal muscle. Journal of General Physiology. 1988;91:799–815. doi: 10.1085/jgp.91.6.799. [DOI] [PMC free article] [PubMed] [Google Scholar]
- Beaty GN, Stefani E. Inward calcium current in twitch muscle fibres of the frog. The Journal of Physiology. 1976;260:27P. [PubMed] [Google Scholar]
- Blatter LA, Niggli E. Confocal near-membrane detection of calcium in cardiac myocytes. Cell Calcium. 1998;23:269–279. doi: 10.1016/s0143-4160(98)90023-9. [DOI] [PubMed] [Google Scholar]
- Cota G, Nicola-Siri L, Stefani E. Calcium-channel gating in frog skeletal muscle membrane: effects of temperature. The Journal of Physiology. 1983;338:395–412. doi: 10.1113/jphysiol.1983.sp014679. [DOI] [PMC free article] [PubMed] [Google Scholar]
- Cota G, Nicola-Siri L, Stefani E. Calcium channel inactivation in frog (Rana pipiens and Rana montezuma) skeletal muscle fibres. The Journal of Physiology. 1984;354:99–108. doi: 10.1113/jphysiol.1984.sp015365. [DOI] [PMC free article] [PubMed] [Google Scholar]
- Cota G, Stefani E. Voltage-dependent inactivation of slow calcium channels in intact twitch muscle fibers of the frog. Journal of General Physiology. 1989;94:937–951. doi: 10.1085/jgp.94.5.937. [DOI] [PMC free article] [PubMed] [Google Scholar]
- Donaldson PL, Beam KG. Calcium currents in a fast-twitch skeletal muscle of the rat. Journal of General Physiology. 1983;82:449–468. doi: 10.1085/jgp.82.4.449. 10.1085/jgp.82.4.449. [DOI] [PMC free article] [PubMed] [Google Scholar]
- Dulhunty AF. Effect of chloride withdrawal on the geometry of the T-tubules in amphibian and mammalian muscle. Journal of Membrane Biology. 1982;67:81–90. doi: 10.1007/BF01868650. [DOI] [PubMed] [Google Scholar]
- Dulhunty AF. Heterogeneity of T-tubule geometry in vertebrate skeletal muscle fibres. Journal of Muscle Research and Cell Motility. 1984;5:333–347. doi: 10.1007/BF00713111. [DOI] [PubMed] [Google Scholar]
- Dulhunty AF, Carter G, Hinrichsen C. The membrane capacity of mammalian skeletal muscle fibres. Journal of Muscle Research and Cell Motility. 1984;5:315–332. doi: 10.1007/BF00713110. [DOI] [PubMed] [Google Scholar]
- Fink R, Grocki K, Lüttgau HC. The effect of energy deprivation and hyperosmolarity upon tubular structures and electrophysiological parameters of muscle fibres. European Journal of Cell Biology. 1980;21:101–108. [PubMed] [Google Scholar]
- Fink RHA, Stephenson DG, Williams DA. Potassium and ionic strength effects on the isometric force of skinned twitch muscle fibres of the rat and toad. The Journal of Physiology. 1986;370:317–337. doi: 10.1113/jphysiol.1986.sp015937. [DOI] [PMC free article] [PubMed] [Google Scholar]
- Finkel AS, Gage PW. Conventional voltage clamping with two intracellular microelectrodes. In: Smith T Jr, editor. Voltage and Patch Clamping with Microelectrodes. Baltimore: Williams & Wilkins; 1985. [Google Scholar]
- Francini F, Pizza L, Traina G. Inactivation of the slow calcium currents in twitch skeletal muscle fibres of the frog. The Journal of Physiology. 1992;448:633–653. doi: 10.1113/jphysiol.1992.sp019062. [DOI] [PMC free article] [PubMed] [Google Scholar]
- Francini F, Stefani E. Decay of the slow calcium current in twitch muscle fibers of the frog is influenced by intracellular EGTA. Journal of General Physiology. 1989;94:953–969. doi: 10.1085/jgp.94.5.953. 10.1085/jgp.94.5.953. [DOI] [PMC free article] [PubMed] [Google Scholar]
- Freygang WH, Jr, Goldstern DA, Hellam DC, Peachey LD. The relation between the late after potential and size of the transverse tubular system of frog muscle. Journal of General Physiology. 1964;48:235–263. doi: 10.1085/jgp.48.2.235. 10.1085/jgp.48.2.235. [DOI] [PMC free article] [PubMed] [Google Scholar]
- García J, McKinley K, Appel SH, Stefani E. Ca2+ current and charge movement in adult single human skeletal muscle fibres. The Journal of Physiology. 1992;454:183–196. doi: 10.1113/jphysiol.1992.sp019259. [DOI] [PMC free article] [PubMed] [Google Scholar]
- Gissel H, Clausen T. Excitation-induced Ca2+ uptake in rat skeletal muscle. American Journal of Physiology. 1999;276:R331–339. doi: 10.1152/ajpregu.1999.276.2.R331. [DOI] [PubMed] [Google Scholar]
- Hess P, Tsien RW. Mechanism of ion permeation through calcium channels. Nature. 1984;309:453–456. doi: 10.1038/309453a0. [DOI] [PubMed] [Google Scholar]
- Hinrichsen C, Dulhunty A. The contractile properties, histochemistry, ultrastructure and electrophysiology of the cricothyroid and posterior cricoarytenoid muscles in the rat. Journal of Muscle Research and Cell Motility. 1982;3:169–190. doi: 10.1007/BF00711941. [DOI] [PubMed] [Google Scholar]
- Hodgkin AL, Horowicz P. The differential action of hypertonic solutions on the twitch and action potential of a muscle fibre. The Journal of Physiology. 1957;136:17–18P. [Google Scholar]
- Huang CL-H. Experimental analysis of alternative models of charge movement in frog skeletal muscle. The Journal of Physiology. 1983;336:527–543. doi: 10.1113/jphysiol.1983.sp014596. [DOI] [PMC free article] [PubMed] [Google Scholar]
- Jack JJB, Noble D, Tsien RW. Electric Current Flow in Excitable Cells. Oxford: Clarendon Press; 1975. [Google Scholar]
- Jafri MS, Rice JJ, Winslow RL. Cardiac Ca2+ dynamics: the roles of ryanodine receptor adaption and sarcoplasmic reticulum load. Biophysical Journal. 1998;74:1149–1169. doi: 10.1016/S0006-3495(98)77832-4. [DOI] [PMC free article] [PubMed] [Google Scholar]
- Kim AM, DiFranco M, Vergara JL. A gap isolation method to investigate electrical and mechanical properties of fully contracting skeletal muscle fibers. Biophysical Journal. 1996;71:924–931. doi: 10.1016/S0006-3495(96)79296-2. [DOI] [PMC free article] [PubMed] [Google Scholar]
- Lamb GD. Asymmetric charge movement in contracting muscle fibres in the rabbit. The Journal of Physiology. 1986;376:63–83. doi: 10.1113/jphysiol.1986.sp016142. [DOI] [PMC free article] [PubMed] [Google Scholar]
- Lorkovic H, Rüdel R. Influence of divalent cations on potassium contracture duration in frog muscle fibres. Pflügers Archiv. 1983;398:114–119. doi: 10.1007/BF00581057. [DOI] [PubMed] [Google Scholar]
- Martell AE, Smith RM. Critical Stability Constants. Vol. 1. New York: Plenum Press; 1977. [Google Scholar]
- Matsuda JJ, Volk KA, Shibata EF. Calcium currents in isolated rabbit coronary arterial smooth muscle myocytes. The Journal of Physiology. 1990;427:657–680. doi: 10.1113/jphysiol.1990.sp018192. [DOI] [PMC free article] [PubMed] [Google Scholar]
- Miledi R, Parker I, Zhu PH. Changes in threshold for calcium transients in frog skeletal muscle fibres owing to calcium depletion in the T-tubules. The Journal of Physiology. 1983;344:233–241. doi: 10.1113/jphysiol.1983.sp014936. [DOI] [PMC free article] [PubMed] [Google Scholar]
- Miller DJ, Smith GL. EGTA purity and the buffering of Ca ions in physiological solutions. American Journal of Physiology. 1984;246:C160–166. doi: 10.1152/ajpcell.1984.246.1.C160. [DOI] [PubMed] [Google Scholar]
- Moore LE, Schmid A, Isenberg G. Linear electrical properties of isolated cardiac cells. Journal of Membrane Biology. 1984;81:29–40. doi: 10.1007/BF01868807. [DOI] [PubMed] [Google Scholar]
- Neuhaus R, Rosenthal R, Lüttgau HC. The effects of dihydropyridine derivatives on force and Ca2+ current in frog skeletal muscle fibres. The Journal of Physiology. 1990;427:187–209. doi: 10.1113/jphysiol.1990.sp018167. [DOI] [PMC free article] [PubMed] [Google Scholar]
- Nicola-Siri L, Sanchez JA, Stefani E. Effect of glycerol treatment on the calcium current of frog skeletal muscle. The Journal of Physiology. 1980;305:87–96. doi: 10.1113/jphysiol.1980.sp013351. [DOI] [PMC free article] [PubMed] [Google Scholar]
- Ohya Y, Terada K, Kitamura K, Kuriyama H. Membrane currents from a fragment of rabbit intestinal smooth muscle cell. American Journal of Physiology. 1986;251:C335–346. doi: 10.1152/ajpcell.1986.251.3.C335. [DOI] [PubMed] [Google Scholar]
- Peachey LD. The sarcoplasmatic reticulum and transverse tubules of the frog's sartorius. Journal of Cell Biology. 1965;25:209–231. doi: 10.1083/jcb.25.3.209. [DOI] [PubMed] [Google Scholar]
- Potreau D, Raymond G. Calcium dependent electrical activity and contraction of voltage-clamped frog single muscle fibres. The Journal of Physiology. 1980;307:9–22. doi: 10.1113/jphysiol.1980.sp013420. [DOI] [PMC free article] [PubMed] [Google Scholar]
- Reuter H, Scholz H. A study of the ion selectivity and the kinetic properties of the calcium dependent slow inward current in mammalian cardiac muscle. The Journal of Physiology. 1977;264:17–47. doi: 10.1113/jphysiol.1977.sp011656. [DOI] [PMC free article] [PubMed] [Google Scholar]
- Sánchez JA, Stefani E. Inward calcium current in twitch muscle fibres of the frog. The Journal of Physiology. 1978;283:197–209. doi: 10.1113/jphysiol.1978.sp012496. [DOI] [PMC free article] [PubMed] [Google Scholar]
- Sánchez JA, Stefani E. Kinetic properties of calcium channels of twitch muscle fibres of the frog. The Journal of Physiology. 1983;337:1–17. doi: 10.1113/jphysiol.1983.sp014607. [DOI] [PMC free article] [PubMed] [Google Scholar]
- Stanfield PR. A calcium dependent inward current in frog skeletal muscle fibres. Pflügers Archiv. 1977;368:267–270. doi: 10.1007/BF00585206. [DOI] [PubMed] [Google Scholar]
- Weidmann S. The electrical constants of Purkinje fibre. The Journal of Physiology. 1952;118:348–360. doi: 10.1113/jphysiol.1952.sp004799. [DOI] [PMC free article] [PubMed] [Google Scholar]