

Abstract
Long-term potentiation (LTP) of synaptic transmission is the putative mechanism underlying learning and memory. Despite intensive study, it remains controversial whether LTP is expressed at a pre- or postsynaptic locus. A new approach was used to investigate this question at excitatory synapses from the medial perforant path (MPP) onto granule cells in the hippocampal dentate gyrus. The variance of the evoked synaptic amplitude was plotted against mean synaptic amplitude at several different Cd2+ concentrations. The slope of the variance-mean plot estimates the average amplitude of the response following the release of a single vesicle of transmitter (Qav). A presynaptic modulation should not affect Qav, but a postsynaptic modulation should alter it.
The variance-mean technique was tested by applying the analysis before and after three different synaptic modulations: (i) a reduction in Qav by the addition of the competitive antagonist CNQX; (ii) a reduction in the average probability of transmitter release (Pav) by the addition of baclofen; and (iii) an increase in the number of active synaptic terminals (N) by increasing the stimulus strength. CNQX reduced the average synaptic amplitude and Qav to the same extent, consistent with a postsynaptic action. In contrast, neither a change in N nor Pav altered Qav. This confirms that the variance-mean technique can distinguish between a pre- and a postsynaptic site of modulation.
Induction of LTP increased EPSC amplitude by 50 ± 0·4% (n = 5) and, in the same cells, increased Qav by 47 ± 0·6%. There was no significant difference between the increase in EPSC amplitude and the increase in Qav. Thus, LTP of the MPP input to dentate granule cells can be explained by an increase in the postsynaptic response to transmitter.
Long-term potentiation (LTP) was first described for the excitatory synaptic contacts made by axons of the perforant path onto dentate granule cells (Bliss & Lomo, 1973). LTP has since become the primary experimental model of learning and memory and has been described in many other brain regions (Bliss & Collingridge, 1993). Two excitatory input pathways, the medial perforant path (MPP) and the lateral perforant path (LPP) synapse onto dendrites of dentate granule cells. Anatomical studies show that the LPP terminates on the distal third and the MPP on the central third of the dendritic tree (Witter, 1993). LTP of the MPP input is blocked by NMDA receptor antagonists, or by the injection of Ca2+-chelating agents into the postsynaptic cell (Colino & Malenka, 1993). This implicates an essential role for Ca2+ influx through postsynaptic NMDA receptors in LTP induction. Two lines of evidence are consistent with a postsynaptic locus of LTP expression at MPP synapses. Following LTP induction: (i) there is no change in paired-pulse depression (Christie & Abraham, 1994); and (ii) AMPA binding, measured using quantitative autoradiography, increases in parallel with the potentiation of the extracellular field EPSC (Maren et al. 1993). In contrast, several recent studies suggest a presynaptic locus. Following LTP induction: (i) progressive MK-801 block of the NMDA EPSC is faster (Min et al. 1998); (ii) the AMPA EPSC mean2/variance (μ2/σ2) increases, implying an increase in quantal content (Wang et al. 1996); and (iii) release of glutamate from the dentate region is potentiated (Bliss & Collingridge, 1993). In summary, the locus of expression of LTP for the MPP synapses onto dentate granule cells remains a contentious question. A similar controversy surrounds this issue at other synapses exhibiting NMDA-dependent LTP (Nicoll & Malenka, 1995).
We have developed a new approach for investigating the site of synaptic modulation and used it to investigate LTP at MPP synapses. The approach is free of unrealistic assumptions concerning the release mechanism, and it can be applied confidently to multifibre EPSCs. The variance of the evoked synaptic amplitude was plotted against mean synaptic amplitude at several different Cd2+ concentrations. The slope of the variance-mean plot estimates the average amplitude of the response following the release of a single vesicle of transmitter (Qav). The induction of LTP increased the synaptic amplitude and Qav to the same extent, strongly supporting a postsynaptic locus of LTP expression in the dentate gyrus.
METHODS
Wistar rats (17-21 days old) were decapitated by guillotine, their brains rapidly removed and placed into ice-cold artificial cerebrospinal fluid (ACSF). Transverse slices (300 μm) of brain tissue were prepared as described previously (Stricker et al. 1996). All experiments were carried out in accordance with the guidelines laid down by the animal welfare committee of the Australian National University. The superfusing solution contained (mM): NaCl, 125; KCl, 3; NaHCO3, 25; NaH2PO4, 1.25; MgCl2, 1; CaCl2, 2; and glucose, 11. It also contained 10 μM bicuculline (RBI) and was bubbled through with 95% O2/5% CO2 (pH 7.4). Experiments were conducted at room temperature (20-24°C). ‘Blind’ whole-cell patch-clamp recordings were obtained from dentate granule cells using patch electrodes (3-5 MΩ) containing (mM): CsCl, 125; EGTA, 0.5; Tes buffer, 10; ATP, 3; GTP, 0.4; and MgCl2, 3. The pH was adjusted to 7.3 using CsOH and osmolarity was adjusted to between 270 and 290 mosmol l−1 with sorbitol. All salts were from Sigma. 6-Cyano-7-nitroquinoxaline-2,3-dione (CNQX) and baclofen were obtained from RBI. Currents were recorded by a patch-clamp amplifier, low-pass filtered at 5 kHz and digitally sampled at 10 kHz. Miniature EPSCs (mEPSCs) were detected using a sliding template technique (Clements & Bekkers, 1997). To ensure recording stability, series resistance (Rs) was monitored by analysing the response to a 5 ms, 5 mV depolarizing step that was applied before each synaptic stimulus (Fig. 3A). Mean Rs was 19 ± 2 MΩ (n = 11). During synaptic stimulation cells were voltage clamped at between -60 and -70 mV. EPSCs were evoked every 3 s using low-intensity, constant current stimulation through a concentric bipolar tungsten stimulating electrode. The stimulating electrode was positioned in the central third of the dentate gyrus molecular layer. This preferentially stimulated the MPP, as confirmed by the presence of paired-pulse depression at these synapses (interstimulus interval, 30-60 ms, n = 4) (McNaughton, 1980).
Figure 3. Construction and analysis of a variance-mean plot.
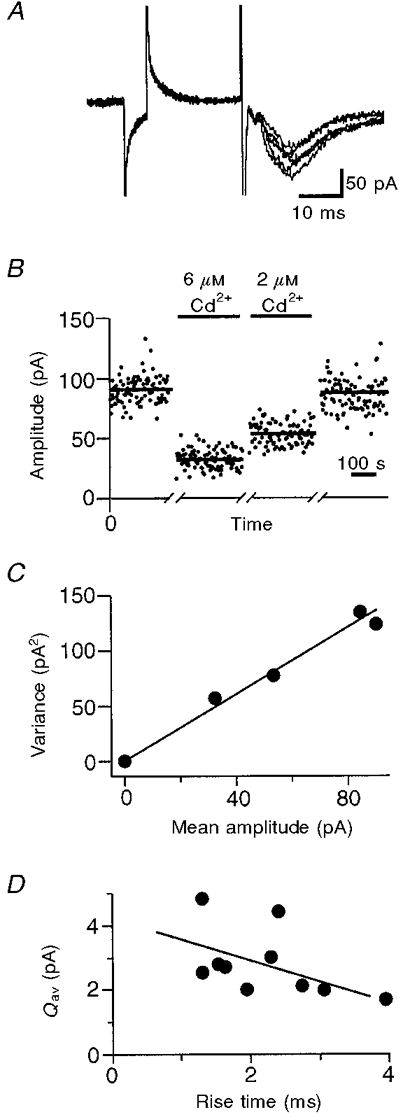
A, 5 consecutive EPSCs recorded from a granule cell in the dentate gyrus exhibit trial-to-trial amplitude fluctuations that contain information about synaptic function. Each EPSC was preceded by a small voltage step to measure Rs, and to ensure that recording conditions remained stable. B, EPSC amplitude plotted against time. Epochs during which EPSC amplitude remained stable are shown for each Cd2+ concentration (0, 2 or 6 μM). A bar shows the mean amplitude during each epoch. Addition of Cd2+ reduced both the mean and the variance of the EPSC amplitude. C, the variance of the EPSC amplitude is plotted against the mean for each stable epoch (variance-mean plot). The slope of this plot estimates the average amplitude of the response following the release of a single vesicle, Qav. D, the 20-80% rise time of the control EPSC is plotted against Qav for 10 cells. These parameters were negatively correlated due to capacitative filtering by the dendritic and somatic membrane, and the uncompensated series resistance.
To induce LTP, cells were voltage clamped at -20 mV while applying three 100 Hz stimulus trains of 1 s duration at 60 s intervals (Wang et al. 1996). LTP was defined as a > 30% potentiation lasting > 30 min. EPSC amplitudes were measured by averaging over a 5 ms window around the peak after subtracting the average current over the 10 ms interval immediately before the stimulus. Mean EPSC amplitude and variance were calculated over a stable epoch of 60-150 events. The variance attributable to recording noise was estimated in the region prior to the test pulse, and was subtracted from the EPSC variance. A zero point was included in each variance-mean plot to indicate that the noise variance was subtracted. All variance-mean plots were fitted by minimizing χ2.
Variance-mean analysis
Consider a synaptic input consisting of a single terminal (Fig. 1A). Following a stimulus, it releases a vesicle of transmitter with probability P, which produces a synaptic response with amplitude Q. The average synaptic amplitude μ, and the variance of the synaptic amplitude σ2, can be calculated from binomial theory:
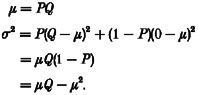 |
Thus the relationship between the variance and mean of the synaptic response is a parabola with an initial slope Q, and a maximum when P =½ (Fig. 1A). If the synaptic response varies from vesicle to vesicle, then Q becomes the average amplitude of the synaptic response, and the coefficient of variation of the synaptic response is CV. The variance-mean relationship becomes:
which also describes a parabola, but one with an initial slope of Q(1 + CV2), and a maximum when P = (1 + CV2)/2. This model can be generalized to describe a real synaptic input consisting of many terminals, each with different properties. When the inputs from many synaptic terminals are summed, both their amplitudes and their variances add linearly. The variance-mean parabolas for each individual terminal sum to form a larger parabola describing the combined synaptic input (Fig. 1B). We define the transmitter release probability at the ith terminal Pi, the average amplitude of the synaptic response at the ith terminal Qi, and the mean synaptic amplitude at the ith terminal μi. Mean amplitudes and variances add linearly, so:
These expressions can be simplified if we define the weighted average amplitude of the unitary synaptic response at a terminal, Qav, and the weighted average transmitter release probability Pav, as:
Note that Qav and Pav are not arithmetic averages, but are weighted towards the terminals with larger Pi and Qi values. Substituting Pav and Qav into the equation for σ2 gives:
This expression has the same form as a classical equation developed for non-stationary noise analysis of voltage-gated currents (Sigworth, 1980), but is applied here to synaptic amplitude fluctuations. It can be exploited by varying Pav and plotting σ2vs.μ. If Pav is restricted to a low range (Pav < 0.3), the variance-mean plot will be approximately linear with slope Qav(1 + CV2) (Fig. 1B). This approach assumes that the technique used to vary Pav does not alter Qav. A uniform presynaptic modulation, where the values of Pi are scaled by the same fraction at all terminals, satisfies this requirement. At hippocampal synapses, Cd2+ acts uniformly at all terminals (Reid et al. 1997). For this reason, Cd2+ was used to construct the variance-mean curves in the present study. The additional assumptions needed to derive the variance-mean equation are: (i) a constant number of independent release sites; (ii) Qi and CV do not change with time; and (iii) linear summation of Qi. The value of Pav at a given point on the variance-mean curve can also be estimated using this approach. Higher values of Pav correspond to points further to the right on the parabola (Fig. 1B). However, the data in this study were limited to the linear, low Pav range, so the derivation of an expression for Pav will not be given here. A recent report presents a comprehensive analysis of variance-mean curves under conditions where Pav is varied over almost the entire range from 0 to 1 (Silver et al. 1998).
Figure 1. Schematic outline of variance-mean analysis.
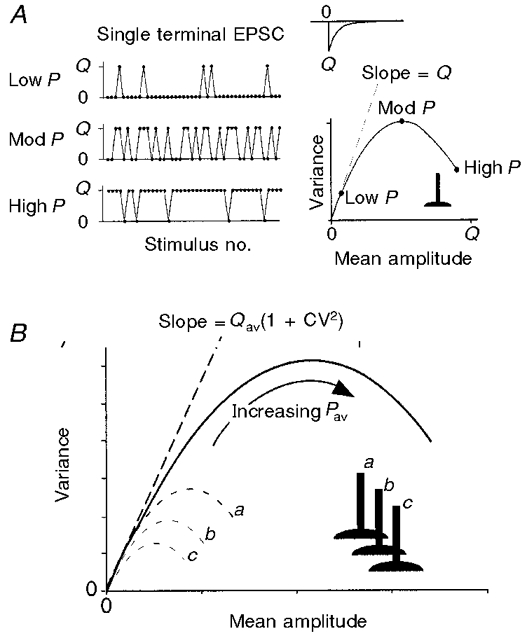
A, an idealized single terminal releases transmitter in an all-or-none manner, producing responses with amplitudes of either 0 or Q (the ‘quantal’ amplitude). When P is low, most stimuli result in zero amplitude responses (failures), so variance is relatively low. When P is 0.5, the response fluctuates randomly between 0 and Q, and variance is high. When P is high, there are few failures and the variance is again low. A parabola results when the variance of the EPSC amplitude is plotted vs. the mean amplitude at several different P settings. The initial slope of the parabola is equal to Q. B, when the inputs from many synaptic terminals are summed onto a single postsynaptic cell, both their amplitudes and their variances add linearly. The variance-mean parabolas for each individual terminal sum to form a larger parabola describing the combined synaptic input. This is true even when the quantal amplitudes and release probabilities are different at each terminal. The initial slope of the parabola is equal to the average quantal amplitude Qav.
RESULTS
The practical utility of the variance-mean technique was tested by applying it to simulated data and then by applying it to EPSCs recorded before and after three different synaptic modulations. It could distinguish reliably between a pre- and a postsynaptic site of modulation. It was then used to investigate the locus of LTP expression.
Monte Carlo test of the variance-mean technique
The performance and reliability of the variance-mean technique were investigated by applying it to simulated data. A model of a compound synaptic input was used to generate fluctuating EPSC amplitudes. The model input consisted of 480 terminals with highly non-uniform properties, as shown in Table 1. The postsynaptic response to a vesicle had a CV of 0.4 at each terminal. Gaussian noise with a standard deviation of 3 pA was added to the simulated amplitudes. A 50% synaptic potentiation was modelled via three different mechanisms, each acting in a non-uniform manner: a 100% presynaptic increase in P at half the terminals; a 100% postsynaptic increase in Q at half the terminals; a 100% increase in N for half the terminal classes. Application of Cd2+ was modelled via a 60% reduction in P at all terminals. Fifty EPSCs were simulated before and 50 during Cd2+ application and a variance-mean plot was constructed. A typical simulated data set is shown in Fig. 2A and the average variance-mean plots before and after modulation are shown in Fig. 2B. Because Pav was low in these simulations, the slope of the variance-mean plot (Svm) was used to estimate Qav =Svm/(1 + CV2). The results for Qav are summarized in Fig. 2C. There was a clear distinction between the postsynaptic modulation which altered Qav and the other modulations which did not. The results also revealed a small (< 10%) systematic underestimation of Qav that is expected from the linear approximation used to calculate this parameter. Thus, the variance-mean technique provides a robust estimate of Qav from as few as 100 EPSC amplitude measurements. The estimate is insensitive to recording noise, intrinsic variability of the response to a vesicle and non-uniformities in the properties of terminals, including their response to a modulation. Therefore the technique can be applied confidently to multifibre (compound) synaptic inputs.
Table 1.
Model synapse
| Group number | 1 | 2 | 3 | 4 | 5 | 6 | 7 | 8 |
|---|---|---|---|---|---|---|---|---|
| Terminals in group (N) | 80 | 40 | 80 | 40 | 80 | 40 | 80 | 40 |
| Vesicle release probability (P) | 0.04 | 0.2 | 0.04 | 0.2 | 0.04 | 0.2 | 0.04 | 0.2 |
| Average response to a vesicle (Q) | 3 | 3 | 6 | 6 | 3 | 3 | 6 | 6 |
A simulation of a compound synaptic input was used to generate randomly fluctuating EPSCs. The model input consisted of 480 terminals with highly non-uniform properties. The terminals were divided into 8 groups.
Figure 2. The variance-mean plot can identify the locus of synaptic modulation when applied to simulated data.
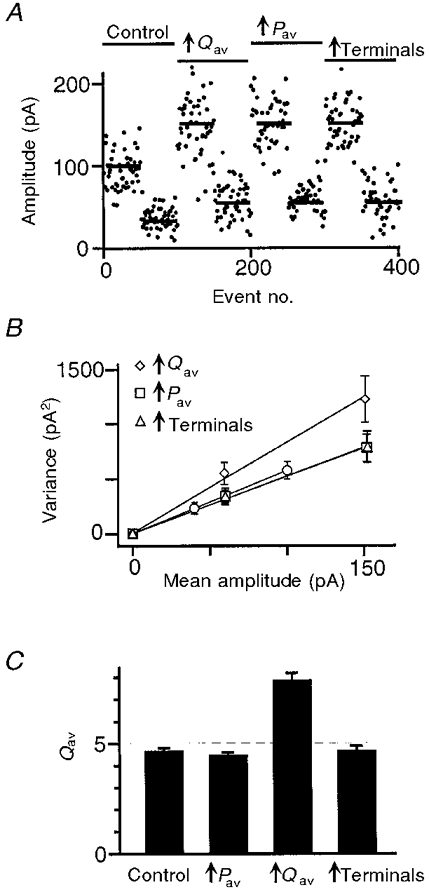
A, simulated EPSC amplitudes plotted against event number. A model of a compound synaptic contact was used to simulate EPSC amplitudes under control conditions and following each of 3 types of modulation: postsynaptic modulation that increased Qav, presynaptic modulation that increased Pav, and modulation that increased the number of active terminals. Under each condition, 50 events were generated before and 50 after the simulated application of Cd2+. B, the average variance-mean plot under control conditions (○), and following each type of modulation: postsynaptic (⋄), presynaptic (□), and increased number of terminals (▵). Error bars indicate ±s.e.m. (n = 20). C, average value of Qav estimated from the slope of individual variance-mean plots under control conditions and following each type of modulation. Error bars indicate +s.e.m. (n = 20). The dashed line indicates the expected value of Qav under control conditions. Only postsynaptic modulation produced a significant change in Qav.
Variance-mean analysis measures mean quantal amplitude
We recorded compound EPSCs in dentate granule cells following stimulation of the medial perforant path (MPP) in rat hippocampal slices (Fig. 3A). The slightly irregular shape of the EPSCs was typical, and may result from different conduction delays in the axons that form the compound synaptic input. The EPSC amplitude fluctuated from stimulus to stimulus primarily because of random variations in the number of transmitter vesicles that were released (Fig. 3A). In contrast, the response to a voltage pulse preceding the stimulus did not fluctuate, and was monitored to ensure stable recording conditions (Fig. 3A). Both the mean (μ) and the variance (σ2) of the EPSC amplitude were reduced following the addition of 2 or 6 μM Cd2+ to the extracellular solution (Fig. 3B). The relationship between σ2 and μ was approximately linear and exhibited no detectable roll-off (Fig. 3C). This implies that average release probability is low (< 0.3) for MPP synapses onto granule cells at physiological Ca2+ concentrations, consistent with results at other hippocampal synapses (Rosenmund et al. 1993; Hessler et al. 1993). Therefore, the slope of the variance-mean plot can be used to estimate Qav as above. In principle, additional information could have been extracted by increasing release probability (for example by increasing extracellular Ca2+) and analysing the parabolic roll-off of the variance-mean plot. Preliminary experiments revealed that the MPP synaptic response ran down during a period of elevated Ca2+, invalidating the analysis. The intrinsic variability of the response to single vesicles, CV, has been estimated at 0.46 for MPP synapses on dentate granule neurons by measuring asynchronous mEPSCs (Bekkers, 1995), so in this preparation:
We found that Qav = 2.3 ± 0.3 pA (n = 10) at -70 mV. This estimate of Qav is relatively insensitive to error in the experimental estimate of CV. For example, a 33% reduction of CV to 0.3 would produce an 11% increase in Qav. Whole-cell recordings systematically underestimate EPSC peak amplitude and rise time due to capacitative filtering of high frequencies by the cell membrane, and the filter cut-off frequency decreases as the series resistance (Rs) increases (Stricker et al. 1996). Asynchronous activation of synaptic terminals and dendritic filtering of distal inputs further slow the EPSC rise, broaden its peak and thereby reduce the measured value of Qav. Consistent with this, Qav was negatively correlated with both EPSC rise time (r = -0.58, n = 10; Fig. 3D) and Rs (r = -0.55, n = 10), but not with EPSC amplitude (r = 0.13, n = 10) or baseline noise (r = 0.19, n = 10). These systematic measurement errors do not invalidate the variance-mean plot as a tool for investigating synaptic plasticity, because Qav will be underestimated by the same factor before and after modulation.
The average amplitude of spontaneous mEPSCs can, in principle, provide an independent estimate of Qav across all terminals on a cell, but only if all mEPSCs have amplitudes greater than twice the standard deviation of the recording noise (σn) so that they can be detected reliably (Clements & Bekkers, 1997). If there is a detection problem, then average mEPSC amplitude will be correlated with σn and will be greater than 2σn. In our recordings, σn was 1.7 ± 0.1 pA (n = 7 cells) and Qav was 2.3 pA, so we expect that the majority of mEPSCs will go undetected. The average amplitude of the detected mEPSCs was 6.9 ± 0.5 pA (about 4σn) and was correlated with σn (r = 0.6, n = 7 cells), consistent with unreliable mEPSC detection.
Variance-mean technique reliably identifies site of synaptic modulation
The simulations presented above show that the variance- mean technique can be used to investigate the locus of a synaptic modulation. We further tested its reliability by using it to analyse EPSCs recorded in dentate granule neurons before and after applying each of three different synaptic modulators: (i) CNQX (0.4 μM), a competitive antagonist at postsynaptic AMPA receptors; (ii) baclofen (4 μM), a presynaptic modulator acting via GABAB receptors; and (iii) an increase in the stimulus strength to activate additional presynaptic terminals. As expected, CNQX reduced the slope of the variance-mean plot (and hence Qav) to the same extent that it reduced EPSC amplitude (Fig. 4A). In contrast, Qav was not affected by baclofen or by increased stimulus strength (Fig. 4B-D). Thus our approach can distinguish between a postsynaptic modulation which alters Qav, and presynaptic modulations which do not.
Figure 4. The variance-mean plot can identify the locus of synaptic modulation when applied to EPSCs recorded from dentate granule cells.
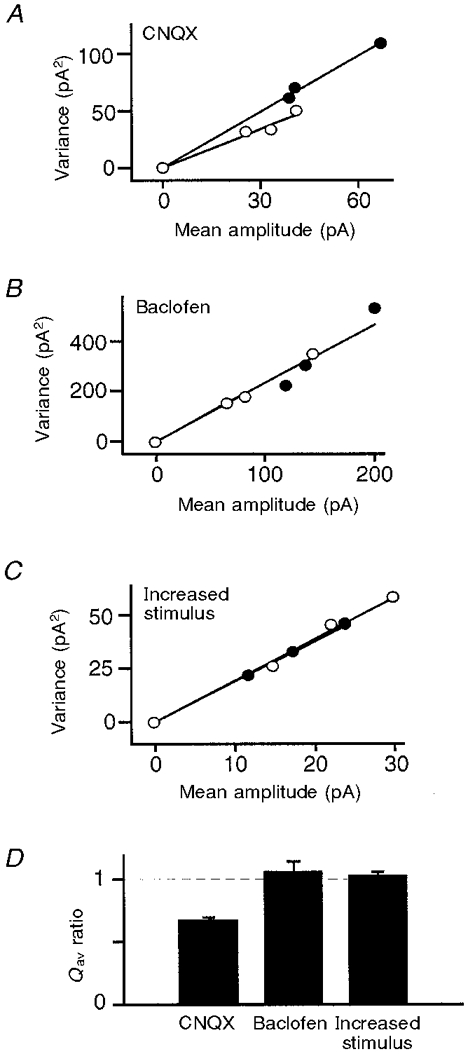
A-C, the variance of the EPSC amplitude is plotted against the mean amplitude during stable epochs at each Cd2+ concentration (0, 2 or 6 μM) before and after a synaptic modulation. A, variance-mean plot before (•) and after (○) the application of CNQX (0.4 μM), a competitive antagonist at postsynaptic AMPA receptors. CNQX reduced the slope of the plot and hence Qav, consistent with a postsynaptic modulation. B, variance- mean plot before (•) and after (○) the application of baclofen (4 μM), which reduces the probability of vesicle release from the presynaptic terminal. There was no change in Qav, consistent with a presynaptic modulation. C, variance-mean plot before (•) and after (○) an increase in the strength of the stimulus to the presynaptic axons. There was no change in Qav, consistent with a presynaptic modulation. D, average change in Qav after the application of CNQX (n = 5), baclofen (n = 5) and an increase in stimulus strength (n = 5). Error bars indicate +s.e.m. Only CNQX produced a significant change in Qav.
A postsynaptic mechanism for LTP
We constructed variance-mean plots and measured Qav before and after the induction of LTP. If LTP results from a presynaptic increase in vesicle release probability (Malinow & Tsien, 1990; Bekkers & Stevens, 1990), or from the unmasking of silent synaptic terminals (Liao et al. 1995; Wang et al. 1996), then little or no change in Qav is expected. In contrast, if LTP results from an enhancement of the postsynaptic response (Manabe et al. 1992; Isaac et al. 1996; Benke et al. 1998), then Qav will increase in parallel with the evoked synaptic amplitude. The induction protocol produced > 30% potentiation lasting > 30 min in 5 out of 12 cells. LTP increased EPSC amplitude by 50 ± 0.4% (n = 5; Fig. 5A), and in the same cells increased Qav by 47 ± 0.6% (Fig. 5B). There was no significant difference between the increase in EPSC amplitude and the increase in Qav (P = 0.6, Student's paired t test, n = 5). Thus, in every cell, LTP of the MPP input to dentate granule cells can be explained by an increase in the postsynaptic response to a vesicle of transmitter.
Figure 5. The variance-mean plot identifies a postsynaptic locus for expression of LTP.
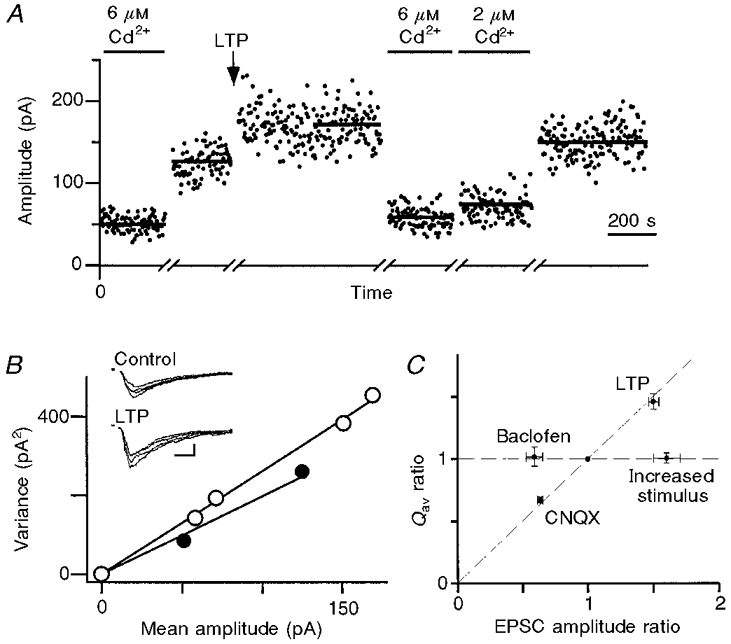
A, EPSC amplitude plotted against time. Epochs during which EPSC amplitude remained stable are shown for each Cd2+ concentration before and after the induction of LTP. A bar shows the mean amplitude during each epoch. B, variance-mean plot before (•) and after (○) the induction of LTP. The inset shows 4 consecutive EPSCs measured in 2 mM Ca2+ before and after the induction of LTP. Inset scale bars, 10 ms and 100 pA. The slope of the variance-mean plot and hence Qav increased following LTP. This increase was very similar to the increase in mean EPSC amplitude following LTP. C, summary of the changes in Qavvs. changes in EPSC amplitude after various synaptic modulations. The ratio of Qav after to Qav before modulation is plotted against the ratio of EPSC amplitude after to EPSC amplitude before modulation. The amplitude ratio was measured with no added Cd2+. Baclofen and increased stimulus strength (2 different presynaptic modulations) did not alter Qav (horizontal dashed line). CNQX (a postsynaptic modulation) and LTP altered Qav to the same extent that they altered the EPSC amplitude (diagonal dashed line).
Variance-mean analysis was performed before and after the induction protocol for 3 out of 7 cells where LTP was not observed. In these three cells the induction protocol changed the average EPSC amplitude by +15%, -10% and -16%, and altered Qav by +9%, -16% and -12%, respectively. Thus, the induction protocol only increased Qav in the cells where it also produced a long-lasting enhancement of the EPSC amplitude.
When the variance-mean analysis is restricted to the low Pav range, it is a mathematical generalization of the μ2/σ2 technique (see Discussion). When μ2/σ2 was calculated using the subset of our data recorded in the absence of Cd2+, it did not change following LTP (P = 0.5, paired t test, n = 5) consistent with a postsynaptic modulation.
The main experimental results are summarized in Fig. 5C, which plots the change in Qav against the change in μ following various synaptic modulations. Presynaptic modulations should fall on the horizontal dashed line, and postsynaptic modulations on the diagonal line. Taken together, these results demonstrate the reliability with which the variance-mean technique can identify the site of synaptic modulation, and strongly support a postsynaptic site for LTP expression at MPP synapses onto dentate granule cells.
DISCUSSION
Other evidence concerning the site of LTP expression in the dentate gyrus
LTP induction in the dentate gyrus increases AMPA binding measured using quantitative autoradiography. This may reflect an increase in average receptor affinity or an increase in receptor number. The increased binding is highly correlated with the potentiation of the extracellular field EPSC supporting a postsynaptic mechanism for LTP (Maren et al. 1993). No change in paired-pulse depression is seen following LTP induction at MPP synapses onto dentate granule cells, implying no change in Pav (Christie & Abraham, 1994). In contrast, an increase in glutamate release from the dentate gyrus following LTP induction suggests a presynaptic mechanism (Errington et al. 1987; Bliss et al. 1987). LTP in the dentate gyrus is also associated with an enhancement of synaptosomal glutamate release (Canevari et al. 1994). A weakness of glutamate release studies is that they are not pathway specific. An increase in glutamate release may be accounted for by an increase in Pav at LPP synapses. Consistent with this, a reduction in paired-pulse facilitation after LTP induction has been noted for the LPP, suggesting an increase in Pav (Christie & Abraham, 1994).
A presynaptic site of LTP expression was suggested by a recent study that used MK-801 (Min et al. 1998). The rate of progressive block of the NMDA receptor component of the EPSC in the presence of MK-801 was faster following LTP induction. However, LTP induction may alter the kinetic properties of the NMDA receptor (Lu et al. 1998). This would make a comparison of MK-801 progressive block before and after LTP difficult to interpret. An increase in μ2/σ2 has been reported following LTP induction in dentate granule cells, implying a presynaptic mechanism (Wang et al. 1996). Interestingly, both Min et al. (1998) and Wang et al. (1996) found that the AMPA receptor component of the EPSC was preferentially increased compared with the NMDA receptor component. Traditionally, this has been considered as evidence for a postsynaptic locus of LTP expression (Kauer et al. 1988; Perkel & Nicoll, 1993).
The controversy concerning the locus of LTP expression at the MPP synapse may be due to the different recording conditions or stimulus protocols used in various studies. In principle, these could affect the mechanism of LTP expression. Wang et al. (1996) used minimal stimulation, whereas we used a stronger stimulus to generate a compound synaptic input. Another difference concerns the length of time between the start of whole-cell recording and the induction of LTP. In the present study, it was necessary to construct a variance-mean plot prior to LTP induction. This took 10-20 min, and the prolonged perfusion of the postsynaptic neuron may have reduced its ability to express LTP. Consistent with this, the average amplitude increase following LTP induction was less in the present study than in previous reports (Wang et al. 1996; Min et al. 1998).
Short- versus long-term potentiation
In the present study, Qav was measured over a period between 5 and 60 min after the induction protocol. This period is generally termed ‘early phase LTP’. Some short-term potentiation may have contaminated the first epoch, but the data point on the variance-mean plot calculated over this epoch fell on the same regression line, and close to the point calculated over the final epoch from 50-60 min (Fig. 5A and B), suggesting that a similar mechanism underlies the potentiation during the two epochs.
Variance-mean technique versusμ2/σ2 technique
When variance-mean analysis is restricted to the low Pav range, it becomes a mathematical generalization of the μ2/σ2 technique used in some previous LTP studies (Bekkers & Stevens, 1990; Malinow & Tsien, 1990; Manabe et al. 1993; Wang et al. 1996), but it retains several practical advantages. It is free of the unrealistic assumption that synaptic terminals have uniform properties. Therefore, it can be applied confidently to compound EPSCs, and the stimulus can be adjusted to guarantee reliable stimulation of the afferent inputs. This approach also makes it possible to work with large synaptic responses, well out of the recording noise. The graphical demonstration that σ2 varies linearly with μ directly confirms that Pav is low, which is simply assumed in most μ2/σ2 studies. Thus, our approach avoids many of the technical difficulties associated with the traditional technique (Korn et al. 1991). The variance- mean technique also provides built-in protection against extraneous sources of excess variability such as run-down of the response or active dendritic properties. For example, active dendritic conductances should become more apparent as Pav is increased. This would contribute excess variability, and the variance-mean plot would deviate upwards from the straight line. This deviation would become more apparent following an increase in stimulus strength. We saw no systematic upward deviation of the variance-mean relationship in the present study, even when stimulus strength was increased (Fig. 4C). An advantage of both variance-mean analysis and the μ2/σ2 technique is their lack of sensitivity to recording noise and intrinsic quantal variability (CV). Both require the assumption that CV does not change following LTP induction.
Despite its reliance on simplifying assumptions, the traditional μ2/σ2 approach may remain valid under some circumstances, especially when Pav is low. When μ2/σ2 was calculated using the subset of our data recorded in the absence of Cd2+, it did not change following LTP, consistent with a postsynaptic locus of expression in our system.
Variance-mean technique versus other methods
The variance-mean technique developed here represents an extension of some previously reported analysis methods (Miyamoto, 1975; Clamann et al. 1989; Frerking & Wilson, 1996). In contrast to these earlier methods, it does not make the unrealistic assumption that release probability or quantal amplitude are uniform at all synaptic terminals. Our technique is closely related to the approach developed in a recent paper, which demonstrated that the variance- mean relationship follows the predicted parabolic form at the powerful climbing fibre-Purkinje cell synapse (Silver et al. 1998). We were not able to demonstrate the parabolic relationship at the weaker MPP-granule cell synapse, because the response ran down during periods of elevated Ca2+. However, all our data were fitted well by a linear relationship which is the limiting case for a parabola when Pav is restricted to a low range (Pav < 0.3). The theoretical treatment of the variance-mean parabola developed by Silver et al. (1998) to treat the high Pav range requires arbitrary assumptions about the distribution of Pi values, and the progressive changes in this distribution as Pav is increased towards 1.0. These assumptions complicate interpretation of the results. In the present study, release probability was restricted to the low Pav range so these complicating assumptions were not required.
The average amplitude of spontaneous mEPSCs can provide an independent estimate of Qav. Several investigations of the locus of LTP expression have used a change in the amplitude distribution of mEPSCs to indicate a postsynaptic site (Manabe et al. 1992), or a change in their frequency of occurrence to indicate a presynaptic site (Malgaroli & Tsien, 1992). In our recordings, average σn was 1.7 pA and Qav was 2.3 pA, so we expect that only the largest mEPSCs will be detectable. This leads to the prediction that the average amplitude of the detected mEPSCs in a given cell will be correlated with σn in that cell, as was observed (see Results). This correlation represents an essential test for problems with the mEPSC detection procedure, but in general it has not been applied in previous mEPSC studies. If a significant percentage of smaller events were missed in these studies, interpretation of changes in mEPSC frequency or amplitude may not be valid.
Quantal analysis based on the detection of peaks in evoked amplitude histograms can also provide an independent estimate of Qav, but this analysis requires CV < 0.1 and Qav≥ 2σn (Redman, 1990), conditions that are not met in our preparation. Another common approach uses a change in the percentage of stimuli that do not evoke a postsynaptic response (failure rate) to indicate a presynaptic site of expression (Malinow & Tsien, 1990; Foster & McNaughton, 1991; Stevens & Wang, 1994; Stricker et al. 1996). This approach assumes that the postsynaptic response to a single vesicle can be detected reliably. Again, the signal-to-noise conditions in dentate granule cells mean that many small EPSCs will be missed and incorrectly counted as failures. In summary, if the techniques of quantal analysis, failure counting or mEPSC frequency were to be inappropriately applied to dentate granule cell recordings, they could lead to the incorrect identification of a presynaptic site of modulation following LTP induction.
Presynaptic mechanisms that could increase Qav
There is only one conceivable presynaptic mechanism that could produce an increase in Qav that matches the increase in mean amplitude, but it is implausible. The presynaptic modulation would have to act selectively at a subpopulation of terminals with below average release probability, but with above average postsynaptic amplitude. This would increase Qav by increasing the weighting factors (μi/μ) for terminals with larger Qi (see Methods). Such a modulation is inconsistent with recent findings which suggest that large presynaptic terminals have above average release probability (Murthy et al. 1997), more docked vesicles and larger postsynaptic size (Harris & Sultan, 1995). It is also inconsistent with the idea that induction of LTP is synapse specific and requires simultaneous pre- and postsynaptic activity. These conditions are more likely to apply at terminals with larger Pi and Qi values. A selective increase in release probability at these terminals would never increase Qav by as much as it increased the mean EPSC amplitude. To obtain a parallel increase in Qav and mean EPSC amplitude, just the right amount of selective modulation would be required at terminals with low release probabilities and large postsynaptic amplitudes, and this amount would be different for each synaptic input, depending on the initial distribution of properties (Qi and Pi values) across the active terminals. Baclofen is known to produce a non-uniform presynaptic modulation (Rosenmund et al. 1993), yet it produced no detectable alteration of Qav. A uniform or non-selective postsynaptic modulation offers the simplest, most plausible explanation of the observed parallel increase in Qav and average EPSC amplitude following induction of LTP.
Postsynaptic mechanisms for LTP
A postsynaptic mechanism of NMDA-dependent LTP expression is consistent with several recent studies. LTP induction promotes phosphorylation of AMPA receptors, leading to a covalent modification which could increase AMPA channel open probability. The phosphorylation is catalysed by Ca2+, which enters through NMDA receptors and interacts with calmodulin-dependent protein kinase II (Barria et al. 1997). Non-stationary fluctuation analysis of AMPA EPSCs suggests an increase in the single-channel conductance of AMPA receptors following LTP induction at CA3-CA1 synapses (Benke et al. 1998). Membrane fusion proteins may also play a role in the expression of LTP (Lledo et al. 1998), possibly via insertion of AMPA receptors into the postsynaptic membrane. It remains to be determined whether the increase in Qav following induction of LTP in the dentate gyrus is due to an increase in the number of AMPA receptors per synaptic terminal, an increase in their open probability, an increase in their affinity, or some combination of these factors.
Conclusion
We have demonstrated that the variance-mean technique is a reliable and robust tool for identifying the site of synaptic modulation. It works well under recording conditions where other techniques may produce unreliable or misleading results. This new approach strongly supports a postsynaptic site for LTP expression at MPP synapses onto dentate granule cells.
Acknowledgments
We thank Angus Silver, John Bekkers, Greg Stuart and Mat Ferking for helpful discussions and comments on earlier drafts of this manuscript. This work was supported by a Queen Elizabeth II Fellowship from the Australian Research Council (J. D. C.) and by a PhD scholarship from the JCSMR (C. A. R.).
References
- Barria A, Muller D, Derkach V, Griffith LC, Soderling TR. Regulatory phosphorylation of AMPA-type glutamate receptors by CaM-KII during long-term potentiation. Science. 1997;276:2042–2045. doi: 10.1126/science.276.5321.2042. [DOI] [PubMed] [Google Scholar]
- Bekkers JM. Synchronous and asynchronous EPSCs evoked in hippocampal slices: A test of the quantal model of neurotransmission. Society for Neuroscience Abstracts. 1995;21:1091. [Google Scholar]
- Bekkers JM, Stevens CF. Presynaptic mechanism for long-term potentiation in the hippocampus. Nature. 1990;346:724–729. doi: 10.1038/346724a0. [DOI] [PubMed] [Google Scholar]
- Benke TA, Luthi A, Isaac JT, Collingridge GL. Modulation of AMPA receptor unitary conductance by synaptic activity. Nature. 1998;393:793–797. doi: 10.1038/31709. [DOI] [PubMed] [Google Scholar]
- Bliss TV, Collingridge GL. A synaptic model of memory: long-term potentiation in the hippocampus. Nature. 1993;361:31–39. doi: 10.1038/361031a0. [DOI] [PubMed] [Google Scholar]
- Bliss TV, Errington ML, Laroche S, Lynch MA. Increase in K+-stimulated, Ca2+-dependent release of [3H]glutamate from rat dentate gyrus three days after induction of long-term potentiation. Neuroscience Letters. 1987;83:107–112. doi: 10.1016/0304-3940(87)90224-2. [DOI] [PubMed] [Google Scholar]
- Bliss TV, Lomo T. Long-lasting potentiation of synaptic transmission in the dentate area of the anaesthetized rabbit following stimulation of the perforant path. The Journal of Physiology. 1973;232:331–356. doi: 10.1113/jphysiol.1973.sp010273. [DOI] [PMC free article] [PubMed] [Google Scholar]
- Canevari L, Richter Levin G, Bliss TV. LTP in the dentate gyrus is associated with a persistent NMDA receptor-dependent enhancement of synaptosomal glutamate release. Brain Research. 1994;667:115–117. doi: 10.1016/0006-8993(94)91720-5. [DOI] [PubMed] [Google Scholar]
- Christie BR, Abraham WC. Differential regulation of paired-pulse plasticity following LTP in the dentate gyrus. NeuroReport. 1994;5:385–388. doi: 10.1097/00001756-199401120-00003. [DOI] [PubMed] [Google Scholar]
- Clamann HP, Mathis J, Luscher HR. Variance analysis of excitatory postsynaptic potentials in cat spinal motoneurons during posttetanic potentiation. Journal of Neurophysiology. 1989;61:403–416. doi: 10.1152/jn.1989.61.2.403. [DOI] [PubMed] [Google Scholar]
- Clements JD, Bekkers JM. Detection of spontaneous synaptic events with an optimally scaled template. Biophysical Journal. 1997;73:220–229. doi: 10.1016/S0006-3495(97)78062-7. [DOI] [PMC free article] [PubMed] [Google Scholar]
- Colino A, Malenka RC. Mechanisms underlying induction of long-term potentiation in rat medial and lateral perforant paths in vitro. Journal of Neurophysiology. 1993;69:1150–1159. doi: 10.1152/jn.1993.69.4.1150. [DOI] [PubMed] [Google Scholar]
- Errington ML, Lynch MA, Bliss TV. Long-term potentiation in the dentate gyrus: induction and increased glutamate release are blocked by D(-)aminophosphonovalerate. Neuroscience. 1987;20:279–284. doi: 10.1016/0306-4522(87)90019-4. 10.1016/0306-4522(87)90019-4. [DOI] [PubMed] [Google Scholar]
- Foster TC, McNaughton BL. Long-term enhancement of CA1 synaptic transmission is due to increased quantal size, not quantal content. Hippocampus. 1991;1:79–91. doi: 10.1002/hipo.450010108. [DOI] [PubMed] [Google Scholar]
- Frerking M, Wilson M. Effects of variance in mini amplitude on stimulus-evoked release: a comparison of two models. Biophysical Journal. 1996;70:2078–2091. doi: 10.1016/S0006-3495(96)79774-6. [DOI] [PMC free article] [PubMed] [Google Scholar]
- Harris KM, Sultan P. Variation in the number, location and size of synaptic vesicles provides an anatomical basis for the nonuniform probability of release at hippocampal CA1 synapses. Neuropharmacology. 1995;34:1387–1395. doi: 10.1016/0028-3908(95)00142-s. 10.1016/0028-3908(95)00142-S. [DOI] [PubMed] [Google Scholar]
- Hessler NA, Shirke AM, Malinow R. The probability of transmitter release at a mammalian central synapse. Nature. 1993;366:569–572. doi: 10.1038/366569a0. 10.1038/366569a0. [DOI] [PubMed] [Google Scholar]
- Isaac JT, Hjelmstad GO, Nicoll RA, Malenka RC. Long-term potentiation at single fiber inputs to hippocampal CA1 pyramidal cells. Proceedings of the National Academy of Sciences of the USA. 1996;93:8710–8715. doi: 10.1073/pnas.93.16.8710. 10.1073/pnas.93.16.8710. [DOI] [PMC free article] [PubMed] [Google Scholar]
- Kauer JA, Malenka RC, Nicoll RA. A persistent postsynaptic modification mediates long-term potentiation in the hippocampus. Neuron. 1988;1:911–917. doi: 10.1016/0896-6273(88)90148-1. [DOI] [PubMed] [Google Scholar]
- Korn H, Fassnacht C, Faber DS. Is maintenance of LTP presynaptic. Nature. 1991;350:282. doi: 10.1038/350282a0. 10.1038/350282a0. [DOI] [PubMed] [Google Scholar]
- Liao D, Hessler NA, Malinow R. Activation of postsynaptically silent synapses during pairing-induced LTP in CA1 region of hippocampal slice. Nature. 1995;375:400–404. doi: 10.1038/375400a0. 10.1038/375400a0. [DOI] [PubMed] [Google Scholar]
- Lledo PM, Zhang X, Sudhof TC, Malenka RC, Nicoll RA. Postsynaptic membrane fusion and long-term potentiation. Science. 1998;279:399–403. doi: 10.1126/science.279.5349.399. 10.1126/science.279.5349.399. [DOI] [PubMed] [Google Scholar]
- Lu YM, Roder JC, Davidow J, Salter MW. Src activation in the induction of long-term potentiation in CA1 hippocampal neurons. Science. 1998;279:1363–1367. doi: 10.1126/science.279.5355.1363. 10.1126/science.279.5355.1363. [DOI] [PubMed] [Google Scholar]
- McNaughton BL. Evidence for two physiologically distinct perforant pathways to the fascia dentata. Brain Research. 1980;199:1–19. doi: 10.1016/0006-8993(80)90226-7. 10.1016/0006-8993(80)90226-7. [DOI] [PubMed] [Google Scholar]
- Malgaroli A, Tsien RW. Glutamate-induced long-term potentiation of the frequency of miniature synaptic currents in cultured hippocampal neurons. Nature. 1992;357:134–139. doi: 10.1038/357134a0. 10.1038/357134a0. [DOI] [PubMed] [Google Scholar]
- Malinow R, Tsien RW. Presynaptic enhancement shown by whole-cell recordings of long-term potentiation in hippocampal slices. Nature. 1990;346:177–180. doi: 10.1038/346177a0. 10.1038/346177a0. [DOI] [PubMed] [Google Scholar]
- Manabe T, Renner P, Nicoll RA. Postsynaptic contribution to long-term potentiation revealed by the analysis of miniature synaptic currents. Nature. 1992;355:50–55. doi: 10.1038/355050a0. 10.1038/355050a0. [DOI] [PubMed] [Google Scholar]
- Manabe T, Wyllie DJ, Perkel DJ, Nicoll RA. Modulation of synaptic transmission and long-term potentiation: effects on paired pulse facilitation and EPSC variance in the CA1 region of the hippocampus. Journal of Neurophysiology. 1993;70:1451–1459. doi: 10.1152/jn.1993.70.4.1451. [DOI] [PubMed] [Google Scholar]
- Maren S, Tocco G, Standley S, Baudry M, Thompson RF. Postsynaptic factors in the expression of long-term potentiation (LTP): increased glutamate receptor binding following LTP induction in vivo. Proceedings of the National Academy of Sciences of the USA. 1993;90:9654–9658. doi: 10.1073/pnas.90.20.9654. [DOI] [PMC free article] [PubMed] [Google Scholar]
- Min MY, Asztely F, Kokaia M, Kullmann DM. Long-term potentiation and dual-component quantal signaling in the dentate gyrus. Proceedings of the National Academy of Sciences of the USA. 1998;95:4702–4707. doi: 10.1073/pnas.95.8.4702. 10.1073/pnas.95.8.4702. [DOI] [PMC free article] [PubMed] [Google Scholar]
- Miyamoto MD. Binomial analysis of quantal transmitter release at glycerol treated frog neuromuscular junctions. The Journal of Physiology. 1975;250:121–142. doi: 10.1113/jphysiol.1975.sp011045. [DOI] [PMC free article] [PubMed] [Google Scholar]
- Murthy VN, Sejnowski TJ, Stevens CF. Heterogeneous release properties of visualized individual hippocampal synapses. Neuron. 1997;18:599–612. doi: 10.1016/s0896-6273(00)80301-3. 10.1016/S0896-6273(00)80301-3. [DOI] [PubMed] [Google Scholar]
- Nicoll RA, Malenka RC. Contrasting properties of two forms of long-term potentiation in the hippocampus. Nature. 1995;377:115–118. doi: 10.1038/377115a0. 10.1038/377115a0. [DOI] [PubMed] [Google Scholar]
- Perkel DJ, Nicoll RA. Evidence for all-or-none regulation of neurotransmitter release: implications for long-term potentiation. The Journal of Physiology. 1993;471:481–500. doi: 10.1113/jphysiol.1993.sp019911. [DOI] [PMC free article] [PubMed] [Google Scholar]
- Redman S. Quantal analysis of synaptic potentials in neurons of the central nervous system. Physiology Reviews. 1990;70:165–198. doi: 10.1152/physrev.1990.70.1.165. [DOI] [PubMed] [Google Scholar]
- Reid CA, Clements JD, Bekkers JB. Nonuniform distribution of Ca2+ channel subtypes on presynaptic terminals of excitatory synapses in hippocampal cultures. Journal of Neuroscience. 1997;15:2738–2745. doi: 10.1523/JNEUROSCI.17-08-02738.1997. [DOI] [PMC free article] [PubMed] [Google Scholar]
- Rosenmund C, Clements JD, Westbrook GL. Nonuniform probability of glutamate release at a hippocampal synapse. Science. 1993;262:754–757. doi: 10.1126/science.7901909. [DOI] [PubMed] [Google Scholar]
- Sigworth FJ. The variance of sodium current fluctuations at the node of Ranvier. The Journal of Physiology. 1980;307:97–129. doi: 10.1113/jphysiol.1980.sp013426. [DOI] [PMC free article] [PubMed] [Google Scholar]
- Silver RA, Momiyama A, Cull-Candy SG. Locus of frequency-dependent depression identified with multiple- probability fluctuation analysis at rat climbing fibre-Purkinje cell synapses. The Journal of Physiology. 1998;510:881–902. doi: 10.1111/j.1469-7793.1998.881bj.x. [DOI] [PMC free article] [PubMed] [Google Scholar]
- Stevens CF, Wang Y. Changes in reliability of synaptic function as a mechanism for plasticity. Nature. 1994;371:704–707. doi: 10.1038/371704a0. 10.1038/371704a0. [DOI] [PubMed] [Google Scholar]
- Stricker C, Field AC, Redman SJ. Changes in quantal parameters of EPSCs in rat CA1 neurones in vitro after the induction of long-term potentiation. The Journal of Physiology. 1996;490:443–454. doi: 10.1113/jphysiol.1996.sp021156. [DOI] [PMC free article] [PubMed] [Google Scholar]
- Wang S, Wojtowicz JM, Atwood HL. Synaptic recruitment during long-term potentiation at synapses of the medial perforant pathway in the dentate gyrus of the rat brain. Synapse. 1996;22:78–86. doi: 10.1002/(SICI)1098-2396(199601)22:1<78::AID-SYN9>3.0.CO;2-F. 10.1002/(SICI)1098-2396(199601)22:1<78::AID-SYN9>3.3.CO;2-Y. [DOI] [PubMed] [Google Scholar]
- Witter MP. Organization of the entorhinal-hippocampal system: a review of current anatomical data. Hippocampus. 1993;3:33–44. [PubMed] [Google Scholar]