

Abstract
We used confocal Ca2+ imaging and fluo-3 to investigate the transition of localized Ca2+ releases induced by focal caffeine stimulation into propagating Ca2+ waves in isolated rat ventricular myocytes.
Self-sustaining Ca2+ waves could be initiated when the cellular Ca2+ load was increased by elevating the extracellular [Ca2+] ([Ca2+]o) and they could also be initiated at normal Ca2+ loads when the sensitivity of the release sites to cytosolic Ca2+ was enhanced by low doses of caffeine. When we prevented the accumulation of extra Ca2+ in the luminal compartment of the sarcoplasmic reticulum (SR) with thapsigargin, focal caffeine pulses failed to trigger self-sustaining Ca2+ waves on elevation of [Ca2+]o. Inhibition of SR Ca2+ uptake by thapsigargin in cells already preloaded with Ca2+ above normal levels did not prevent local Ca2+ elevations from triggering propagating waves. Moreover, wave velocity increased by 20 %. Tetracaine (0·75 mM) caused transient complete inhibition of both local and propagating Ca2+ signals, followed by full recovery of the responses due to increased SR Ca2+ accumulation.
Computer simulations using a numerical model with spatially distinct Ca2+ release sites suggested that increased amounts of releasable Ca2+ might not be sufficient to generate self-sustaining Ca2+ waves under conditions of Ca2+ overload unless the threshold of release site Ca2+ activation was set at relatively low levels (< 1·5 μM).
We conclude that the potentiation of SR Ca2+ release channels by luminal Ca2+ is an important factor in Ca2+ wave generation. Wave propagation does not require the translocation of Ca2+ from the spreading wave front into the SR. Instead, it relies on luminal Ca2+ sensitizing Ca2+ release channels to cytosolic Ca2+.
In mammalian cardiac myocytes, contractile activation occurs in response to Ca2+ influx from the extracellular space, triggering Ca2+ release via Ca2+-sensitive channels located in the membrane of the sarcoplasmic reticulum (SR) (Bers, 1991; Stern & Lakatta, 1992; Eisner et al. 1998). Despite its self-regenerating nature, this process of Ca2+-induced Ca2+ release (CICR) in myocytes is not normally all-or-none but instead is smoothly graded according to the amounts of trigger Ca2+ entering into the cell (Cannell et al. 1987; Beuckelmann & Wier, 1988). Under certain conditions, such as increased cellular Ca2+ load, Ca2+ release does show signs of uncontrollable behaviour. Spontaneous discharges of SR Ca2+ begin locally, then propagate as regenerative Ca2+ waves through the cell (Kort et al. 1985; Wier et al. 1987; Takamatsu & Wier, 1990; Lipp & Niggli, 1994; Trafford et al. 1995; Engel et al. 1995; Wussling & Salz, 1996; Cheng et al. 1996; Lukyanenko et al. 1996). This chaotic behaviour has been implicated in certain cardiac abnormalities including after-depolarizations and Ca2+-dependent arrhythmias (Ishide, 1996). At the present time, the factors responsible for preventing CICR from self regenerating or the alterations responsible for transition from graded release to all-or-none spontaneous release are not precisely understood.
The clue to understanding these questions may come from the recognition that the control of CICR occurs in spatially discrete sub-domains (Niggli & Lederer, 1990; Stern, 1992; Györke & Palade, 1993). Local fluorescence signals reflecting activation of individual release sites have been visualized directly using confocal imaging (Cheng et al. 1993; Lipp & Niggli, 1994). These local Ca2+ signals, called Ca2+ sparks, are confined to an area with a diameter of < 3 μm and reach a peak amplitude of 100-500 nM. It appears that Ca2+ release during both normal excitation-contraction coupling and propagating Ca2+ waves is a result of spatial and temporal summation of Ca2+ sparks (Cannell et al. 1994; Lopez-Lopez et al. 1995; Cheng et al. 1996). Under normal conditions, almost all sparks remain localized and die out without inducing release in adjacent release sites (Cheng et al. 1993, 1996; Lukyanenko et al. 1996). Under conditions of increased cellular Ca2+ load, sparks increase in amplitude and frequency and become initiation sites of propagating Ca2+ waves (Cheng et al. 1993, 1996; Lukyanenko et al. 1996; Satoh et al. 1997).
In principle, propagation of Ca2+ release could be caused by any of the following mechanisms. (1) Ca2+ acting at the cytoplasmic activation site of the SR Ca2+ release channel in a manner similar to that during normal excitation-contraction coupling (Stern et al. 1988; Stern, 1992; Trafford et al. 1995). Transition of local release to propagating release could be due to a combination of increased resting Ca2+ and a larger amount of Ca2+ released during a spark. (2) Ca2+ acting at an intraluminal site on the SR Ca2+ release channel following its uptake into the SR (Takamatsu & Wier, 1990; Fabiato, 1992). This possibility is consistent with recent evidence showing that increased luminal Ca2+ can activate the Ca2+ release channels in lipid bilayers (Sitsapesan & Williams, 1994; Lukyanenko et al. 1996). It is also consistent with results indicating that increased SR Ca2+ load can potentiate CICR release in intact and patch-clamped myocytes (Han et al. 1994; Janczewski et al. 1994; Bassani et al. 1995; Lukyanenko et al. 1996; Györke et al. 1997; Györke & Györke, 1998). (3) A combination of the first and second mechanisms when the sensitivity of ryanodine receptors (RyRs) to cytosolic Ca2+ is enhanced by increased luminal Ca2+. In support of this possibility, increased luminal Ca2+ has been shown to increase the sensitivity of RyRs to cytosolic Ca2+ in lipid bilayers (Lukyanenko et al. 1996; Györke & Györke, 1998).
To distinguish between these possibilities we monitored the subcellular properties of SR Ca2+ release using confocal Ca2+ imaging and fluo-3 in rat ventricular myocytes. We examined the transition of localized Ca2+ release into propagating Ca2+ waves under various experimental conditions, including inhibition of the SR Ca2+ pump by thapsigargin, sensitization of the SR Ca2+ release channels to cytosolic Ca2+ by caffeine, and inhibition of the SR Ca2+ channels by tetracaine. In addition we investigated the factors for successful Ca2+ wave propagation using a numerical model of the Ca2+ wave. Our results indicate that the primary factor responsible for propagation of the Ca2+ wave is cytosolic Ca2+. Luminal Ca2+ plays a modulatory role by enhancing the sensitivity of the Ca2+ release channels to cytoplasmic Ca2+.
METHODS
Cell isolation and experimental solutions
Adult Sprague-Dawley rats (200-300 g) were killed by lethal injection of pentobarbitone sodium (Nembutal; 100 mg kg−1i.p.) as approved by the Animal Care and Use Committee. Single ventricular myocytes were obtained by enzymatic dissociation as described before (Györke et al. 1997). The cells were loaded with fluo-3 by a 20 min incubation with 5 μM fluo-3 AM (acetoxymethyl ester form; Molecular Probes) at 23°C.
The Tyrode solution contained (mM): 140 NaCl, 2 KCl, 0.5 MgCl2, 1-5 CaCl2, 10 Hepes, 0.25 NaH2PO4, 5.6 glucose, pH 7.3. Tetrodotoxin (Sigma) at 10 μM was added to the bathing solution to avoid depolarization-induced Ca2+ release due to spontaneous action potentials. Caffeine, thapsigargin (Calbiochem) or tetracaine were used at the concentrations indicated.
Confocal microscopy
Experiments were performed using an Olympus laser scanning confocal microscope (LSM-GB200) equipped with an Olympus × 60, 1.4 NA objective (Lukyanenko et al. 1996). Fluo-3 was excited by light at 488 nm (25 mW argon laser, intensity attenuated to 1-3 %), and fluorescence was measured at wavelengths of>515 nm (confocal detector aperture set to 25 % of maximum). As determined with 0.1 μm fluorescent beads (Molecular Probes), the system provided an axial resolution of 0.4 μm and a depth of field of about 0.7 μm. Images were acquired in the linescan mode at a rate of 8 or 32 milliseconds per scan. For calibration purposes, the total linescan [Ca2+] in 1 mM [Ca2+]o was assumed to be 100 nM and it served as a reference point for the determination of [Ca2+] in the course of an experiment. [Ca2+] was calculated from fluo-3 fluorescence using an equation and calibration parameters described previously (Cheng et al. 1993). Image processing and analysis were performed by using NIH Image (NIH, Bethesda, MD, USA) and IDL software (Research Systems Inc., Boulder, CO, USA).
Lipid bilayer experiments
Heavy sarcoplasmic reticulum (SR) microsomes were isolated by differential centrifugation from the ventricles of dog heart (Dettbarn et al. 1994). The dogs were killed by lethal injection of Nembutal (70 mg kg−1i.v.) as approved by the Animal Care and Use Committee. SR microsomes were fused into planar lipid bilayers and single channels were recorded as described previously (Lukyanenko et al. 1996). SR vesicles were added to one side of the bilayer (defined as cis) and the other side was defined as trans (virtual ground). Bilayers contained 80 % phosphatidylethanolamine and 20 % phosphatidylcholine dissolved in decane at a final concentration of 50 mg ml−1. Standard solutions contained 350 mM cis CsCH3SO3, 20 mM trans CsCH3SO3, 20 μM CaCl2, 20 mM Hepes (pH 7.4). After channel incorporation, the trans CsCH3SO3 was adjusted to 350 mM. Single channel recording was carried out using an Axopatch 200A (Axon Instruments) patch-clamp amplifier. Data were filtered at 2 kHz and digitized at 5 kHz. Acquisition and analysis of data were performed using pCLAMP 6.01 software (Axon Instruments).
Model of the Ca2+ wave
To simulate Ca2+ waves, we used a numerical model of CICR with spatially discrete release sites. The model includes 50 individual release sites (equally spaced at intervals of 2 μm), two spatially homogeneous removal fluxes (SR Ca2+ pumps and soluble buffers), diffusible dye, the calcium-dye complex (Ca:dye) and calcium bound to endogenous buffers (Ca:B). The spatiotemporal distributions of the free cytoplasmic Ca2+, the Ca:dye complex and the free dye, along with the temporal evolution of the bound buffers, are described by the following coupled system of reaction-diffusion equations and ordinary differential equation:
| (1) |
| (2) |
| (3) |
| (4) |
Here DCa, DCa:dye and Ddye are the diffusion coefficients of Ca2+, Ca:dye and free dye, respectively (the endogenous buffers are assumed to be immobile, see below); ▿2[Ca2+], ▿2[Ca:dye] and ▿2[dye] are the Laplacians; qrel is the release flux and qrem the removal flux. The removal flux consists of three contributions:
| (5) |
The quantity qb is the removal by binding to endogenous buffers, and qSR is the removal by the Ca2+-ATPase of the SR. qdye is the binding flux of free calcium to the indicator dye. The quantity qrel0 is the calcium release from the SR under basal conditions. Removal by the Ca2+-ATPase and Na+-Ca2+ exchanger of the sarcolemma (SL) is ignored in this study. The Ca2+ release flux, qrel, of each release site was implemented using the model equations and parameter values in the appendix of Keizer et al. (1998; eqns 7–10). It is given by the following expression:
| (6) |
Here the coefficient vrel is the conductance of the release site, f0([Ca2+](r,t)) is the calcium-dependent fractional activation of each site and [Ca2+](r,t) is the local free calcium concentration. The quantity c* is the threshold value of myoplasmic calcium above which the site is able to release calcium. ri is the location of release site i. [Ca2+]SR is the calcium concentration in the sarcoplasmic reticulum (taken to be constant in a given simulation).
With regard to buffering, the flux was calculated from the following equation, which lumps all the endogenous buffers into a single immobile pool:
| (7) |
The rate constants for binding and dissociation are given by kb,on and kb,off respectively. [B]0 is the total concentration of buffers and [Ca:B] is the concentration of the calcium-buffer complexes. Implicit in this expression is the use of the conservation relation:
| (8) |
Then the concentration of the free buffer at any time, [B], can simply be found by difference. The use of this relation is valid when the initial distribution of the buffers is uniform and binding of calcium to the buffers does not change the diffusion coefficient of the buffers. The flux transported by the Ca2+ pumps was calculated from the expression given by Tang & Othmer (1994):
| (9) |
where VSR is the maximal capacity and KSR the calcium capacity at which the transport is half-maximal for a particular process. The flux of calcium binding to the indicator is given by the following expression:
| (10) |
As with the endogenous buffers, a conservation relation among the total dye, bound dye and free dye may be employed when the initial distribution of dye is uniform and the diffusion coefficients of the free and bound dye are the same. However, we chose in this case to model the free dye in an equivalent fashion with a reaction diffusion equation instead of the conservation relations because we wished to incorporate the flexibility to relax the assumptions that permit the conservation relation in future studies.
The term qrel0 is given by:
| (11) |
The parameters of release, diffusion, buffering and uptake of Ca2+ are presented in Table 1.
Table 1. Parameters of the Ca2+ wave model.
| Parameter | Value | Source |
|---|---|---|
| DCa (μm2 ms−1) | 0.30 | Albritton et al. (1992) |
| DCa:dye (μm2 ms−1) | 0.02 | Harkins et al. (1993) |
| Ddye (μm2 ms1) | 0.02 | Harkins et al. (1993) |
| VSR (μM s−1) | 208 | Smith et al. (1998),Smith et al. (1998) |
| KSR (nM) | 120 | Tang & Othmer (1994) |
| kb,on (nM−1 ms−1) | 10−4 | Sipido & Wier (1991) |
| kb,off (ms−1) | 4 × 10⁻² | Sipido & Wier (1991) |
| kdye,on (nM−1 ms−1) | 2.4 × 10⁻⁴ | Escobar et al. (1995) |
| kdye,off (ms−1) | 1.8 × 10⁻² | Escobar et al. (1995) |
| [B]0 (nM) | 1.20 × 10⁵ | Fabiato (1983),Fabiato (1992) |
| [Ca2+]SR (mM) | 5 | Chen et al. (1996) |
Definitions are given in the text.
The governing equations are subject to the following initial and boundary conditions:
 |
(12) |
The value of the basal calcium level was taken to be [Ca2+]0 = 0.1 μM. The basal values [Ca:dye]0 and [dye]0 were taken to be in equilibrium with [Ca2+]0 ([Ca:dye]0 = 5 μM, [dye]0 = 45 μM, [Ca:B]0 = 0.041 μM). The dimension a = 100 μm, and is the radius of the spherical domain being simulated. The coupled reaction- diffusion equations were solved numerically using an explicit Euler scheme. The time derivatives were made discrete using a forward finite difference approximation, and the spatial derivatives were made discrete using a second-order, central finite difference approximation. Our time step was Δ t = 8.571 × 10⁻² ms, and our space step was Δ x = 0.1 μm. The modelling code was written in VISUAL FORTRAN Standard Edition 5.0.A (Digital) and executed on a Pentium IID 266 desktop computer.
RESULTS
Generation and measurement of Ca2+ waves
To study the mechanisms underlying Ca2+ wave propagation we used the technique of local caffeine application. It has been demonstrated that Ca2+ release by caffeine can be confined to small regions of the cell to trigger Ca2+ waves propagating away from the area of application (Trafford et al. 1995). Caffeine (10 mM) was applied through a micropipette (∼1 μm diameter) positioned near the surface of fluo-3-loaded cells and the resulting [Ca2+]i changes were measured by repeatedly scanning a single line along the longitudinal axis of the cell. The spatial characteristics of our local solution application system were visualized upon injection of fluorescein-containing solution into the bath (Fig. 1Aa). As can be seen, the solution application was confined within an area of < 20 μm diameter. Local application of caffeine to cells induced Ca2+ waves which propagated from the area of initiation giving rise to a characteristic inverted ‘V’ fluorescence pattern on the linescan image (Fig. 1Ac).
Figure 1. The effects of [Ca2+]o on [Ca2+]i responses to focal caffeine applications.

Aa, linescan image illustrating diffusion of fluorescein in water following pressure injection (10 p.s.i. for 20 ms) of fluorescein-containing solution (5 μM l−1) from a micropipette. b and c, linescan images of fluorescence changes induced by focal application of caffeine (10 mM) with injection settings similar to those in a at 1 mM [Ca2+]o (non-propagating response; b) and 1 min after increasing [Ca2+]o to 3 mM (propagating Ca2+ wave; c). The experimental protocol is presented schematically at the top. d, portion of the image in c marked by arrows; white dots indicate the position of the wave defined at half-maximal amplitude of the local [Ca2+]i. Calibration bars: horizontal, 14 μm; vertical, 0.28 s. B, time-dependent changes in fluorescence at the site of caffeine applications (marked in Ab and c by bars) at 1 mM [Ca2+]o (black trace) and 3 mM [Ca2+]o (grey trace). C, linear fit to the position of the wave as defined in Ad; the reciprocal of the slope of the line yields the average wave velocity v = 51 μm s−1. D, space-averaged Ca2+ transients elicited by application of 20 mM caffeine to the whole bath before (lefthand trace) and 1 min after increasing [Ca2+]o from 1 to 3 mM (righthand trace).
In accordance with previous studies (Trafford et al. 1990, 1995), the potency of the cells to generate propagating responses depended on their Ca2+ loading status. With [Ca2+]o < 2 mM, most responses triggered by caffeine typically decayed in both amplitude and propagation velocity, and died out within 20-30 μm of their site of origin. With [Ca2+]o>2 mM, most responses propagated throughout the entire cell at constant amplitude and velocity. Figure 1A shows images from a typical experiment in which abortive waves measured with 1 mM [Ca2+]o (Fig. 1Ab) became regenerative 1 min after increasing [Ca2+]o to 3 mM (Fig. 1Ac). Similar results were obtained in eight out of ten cells in which [Ca2+] was changed from 1 to between 2 and 5 mM. In the two remaining experiments (at 2 mM [Ca2+]o), local caffeine pulses failed to trigger propagating Ca2+ waves. Figure 1B plots time-dependent fluorescence changes measured from the site of caffeine applications before and after elevating [Ca2+]o. In accordance with our previous studies (Lukyanenko et al. 1996), elevating [Ca2+]o resulted in a slight increase in the resting fluorescence and a larger increase in the amplitude of the peak caffeine-induced fluorescence transients. The position of the Ca2+ wave in the x-t plane was defined at half-maximal amplitude of the rising phase of the signal using a computer selection algorithm (Fig. 1Ad). The average velocity of the propagating wave was determined by fitting a linear function to the position of the wave (Fig. 1C). The average wave velocity varied from 32 to 74 μm s−1 (46.0 ± 2.3 μm s−1, n = 25) at [Ca2+]o of 3 mM. These estimates of the Ca2+ wave velocities should not be affected significantly by local shortening of the cell. It has been shown previously that contractile waves follow calcium waves with a delay of 50-100 ms (Kort et al. 1985). Thus, as has been argued previously (Wussling & Salz, 1996), although regional shortening can affect initial Ca2+ wave velocity it should have no impact on the velocity of the Ca2+ wave at later times (> 100 ms), when the Ca2+ and contractile waves travel at the same speed.
The effects of increasing [Ca2+]o on SR Ca2+ content were assessed in a separate series of experiments, in which caffeine (20 mM) was applied to the whole bath and changes in space-averaged [Ca2+] were measured (Lukyanenko et al. 1996). As indexed by changes in the amplitude of the caffeine-induced Ca2+ transients (0.84 ± 0.05 μM vs. 1.10 ± 0.06 μM, n = 8), the SR Ca2+ load increased by 26 % upon elevating [Ca2+]o from 1 to 3 mM (Fig. 1D). In addition, the resting [Ca2+] tended to increase slightly (from 100 ± 6 to 112 ± 10 nM). These results are in agreement with our previous assessment of changes in SR Ca2+ load caused by elevations in extracellular [Ca2+] (Lukyanenko et al. 1996).
Effects of thapsigargin
The transition from an abortive Ca2+ wave to a regenerative Ca2+ wave on elevation of [Ca2+]o could be caused by increases in either cytosolic or intra-SR [Ca2+]. To distinguish between these possibilities, we examined the ability of local caffeine application to induce propagating Ca2+ waves under conditions when the SR Ca2+ uptake was inhibited by thapsigargin before elevating bathing [Ca2+]. Thapsigargin selectively inhibits the SR Ca2+-ATPase (Thastrup et al. 1989; Kirby et al. 1992). As illustrated in Fig. 2A, exposure of the cells to thapsigargin prior to elevation of [Ca2+]o resulted in a failure of caffeine pulses to trigger regenerative Ca2+ waves. In these experiments, thapsigargin (10 μM) was introduced to the bath 1 min before elevating [Ca2+] from 1 to 3 mM and the caffeine pulse was applied 2 min after the Ca2+ elevation. At this concentration and exposure time, thapsigargin has been shown to inhibit SR Ca2+ uptake by about 90 % without causing a significant change in the SR Ca2+ load (Bassani et al. 1993). At the site of caffeine application the basal fluorescence was again slightly elevated, but the peak amplitude of the caffeine-induced fluorescence signal did not show a significant change in the presence of thapsigargin (Fig. 2B). This result would be consistent with the notion that thapsigargin, while preventing uptake of extra Ca2+ into the SR, did not cause a measurable loss of Ca2+ from the SR during the time period of the measurements. Similar results were obtained in four out of four other experiments.
Figure 2. The effects of [Ca2+]o on [Ca2+]i responses to focal applications of caffeine in cells pretreated with thapsigargin.
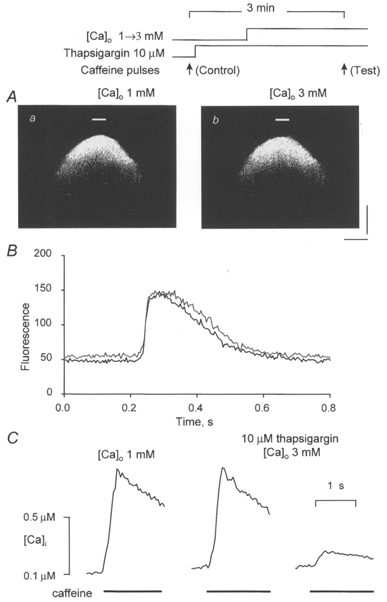
A, linescan images of fluorescence changes induced by focal applications of caffeine (10 mM) in the presence of 1 mM [Ca2+]o (a) and 2 min after increasing [Ca2+]o to 3 mM (b). Thapsigargin (10 μM) was introduced into the bath 1 min prior to elevating [Ca2+]o. The experimental protocol is presented schematically at the top. Calibration bars: horizontal, 18 μm; vertical, 0.64 s. B, time-dependent changes in fluorescence at the site of caffeine applications (marked in Aa and b by bars) at 1 mM [Ca2+]o (black trace) and 3 mM [Ca2+]o (grey trace). C, caffeine-induced Ca2+ transients measured before and after successive applications of thapsigargin and 3 mM Ca2+ to the bath. Caffeine (20 mM) was applied for 2 s. The lefthand trace is the control ([Ca2+]o = 1 mM). The middle trace was recorded 3 and 2 min after introduction to the bath of thapsigargin (10 μM) and elevated Ca2+ (3 mM), respectively. The righthand trace was acquired 2 min after the middle trace in the continuous presence of thapsigargin and 3 mM Ca2+.
The effects of thapsigargin on the Ca2+ load and Ca2+ uptake capacity of the SR were further investigated in a separate series of experiments with caffeine application to the whole bath. Figure 2C illustrates caffeine-induced Ca2+ transients measured under control conditions and also after successive introductions to the bath of thapsigargin (10 μM) and elevated Ca2+ (3 mM). Consistent with the results of experiments employing local caffeine applications (Fig. 2B), elevation of [Ca2+]o in the presence of thapsigargin, while resulting in a small elevation in the basal [Ca2+] (from 100 ± 9 to 140 ± 15 μM, n = 5), did not cause a significant increase in amplitude of the caffeine-induced Ca2+ transients (0.81 ± 0.09 vs. 0.86 ± 0.10 μM). The amplitude of the second caffeine-induced Ca2+ transient measured 2 min later in the continuous presence of thapsigargin was reduced dramatically (by 72 ± 11 %), verifying a substantial inhibition in SR Ca2+ uptake. These results confirm that thapsigargin can effectively prevent the accumulation of extra Ca2+ in the SR on increasing [Ca2+]o under our experimental conditions. Taken together, these results suggest that the increased accumulation of Ca2+ in the SR is a critical factor in the generation of propagating Ca2+ waves under conditions of increased cellular Ca2+ load. The remainder of this study was therefore concerned with defining the mechanisms through which increased [Ca2+]SR results in wave propagation.
It has been suggested that propagation of Ca2+ waves is mediated by Ca2+ uptake into a highly loaded SR and subsequent activation of the release mechanism from within the SR (Takamatsu & Wier, 1990; Fabiato, 1992; Lukyanenko et al. 1996). To test this hypothesis directly, we examined the ability of thapsigargin to inhibit propagation of Ca2+ release following focal caffeine applications in cells already preloaded by Ca2+ above normal levels. Figure 3A illustrates the effects of exposure of the cells to thapsigargin (10 μM for 1 min) on the caffeine-induced responses in the presence of 3 mM Ca2+ in the bathing solution. Rather than inhibiting wave propagation, thapsigargin actually enhanced it (Fig. 3B). Again, the peak amplitude of the caffeine-induced responses was without a change, indicating no significant alterations in the SR Ca2+ load (Fig. 3C). Based on the results of six experiments, the velocities of Ca2+ waves before and after application of thapsigargin were 43.0 ± 1.2 and 50.2 ± 1.7 μm s−1, respectively ( P < 0.05). The effects of thapsigargin on space-averaged caffeine-induced Ca2+ transients are shown in Fig. 3D. Again, inhibition of the Ca2+ uptake capacity of the SR is confirmed by the reduced amplitude of the caffeine-induced Ca2+ signal in the presence of the drug. Similar results were obtained in four other experiments.
Figure 3. The effects of thapsigargin on [Ca2+]i responses to focal applications of caffeine in cells preloaded with Ca2+ above normal levels.
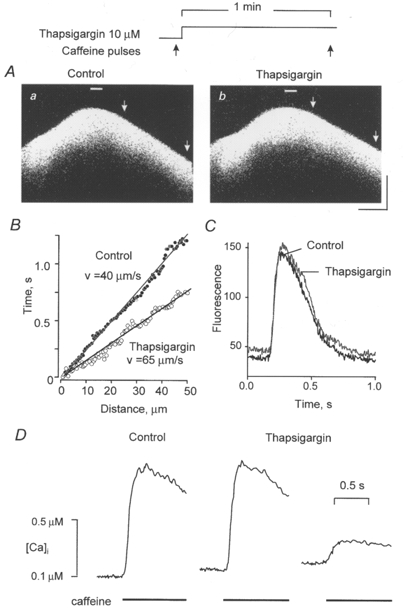
A, linescan images of fluorescence changes induced by focal applications of caffeine (10 mM) before (a) and 2 min after introducing of 10 μM thapsigargin to the bath (b). [Ca2+]o was 3 mM. Calibration bars: horizontal, 18 μm; vertical, 0.66 s. B, linear fits to the positions of the wave in Aa (•) and b (○) in sections defined by the arrows; the values of mean wave velocities are indicated next to the respective linear fits. C, time-dependent changes in fluorescence at the sites of caffeine application (marked in Aa and b by bars) in the presence (black trace) and absence (grey trace) of thapsigargin. D, Ca2+ transients induced by applications of caffeine before (lefthand trace) and after introduction to the bath of 10 μM thapsigargin (middle and righthand traces). Caffeine (20 mM) was applied to the bath for 2 s at 2 min intervals; thapsigargin was applied 1 min prior to the second addition of caffeine.
Since the enhancement of Ca2+ wave propagation by thapsigargin could be also due to a potentiation of the release mechanism by thapsigargin, we examined the effect of thapsigargin on SR Ca2+ release channels incorporated into lipid bilayers (not shown). In four channels the open probability (Po) measured before and after application of 10 μM thapsigargin to the cytosolic side of the channel was 0.21 ± 0.03 and 0.26 ± 0.04, respectively. This result is consistent with the lack of effect of thapsigargin (100 μM) on Ca2+ release in purified muscle vesicles (Kirby et al. 1992). Taken together, these results suggest that Ca2+ uptake from the approaching wave front is not required for wave propagation.
Effects of low caffeine concentrations
It has been demonstrated that elevation of luminal Ca2+ increases the sensitivity of the Ca2+ release channel to cytosolic Ca2+ (Györke & Györke, 1998). Such an increase in Ca2+ sensitivity of the Ca2+ release mechanism, expected as a result of enhanced Ca2+ accumulation in the SR, could represent another mechanism for Ca2+ wave propagation in Ca2+-overloaded myocytes. To investigate whether the conditions for propagation of Ca2+ waves can be created ‘artificially’ by sensitizing the release channels to cytosolic Ca2+ (i.e. without increasing the SR Ca2+ load), we tested the effects of low concentrations of caffeine on the ability of local caffeine pulses to trigger propagating releases. Caffeine is a known potentiator of CICR, which is believed to act by enhancing the sensitivity of the Ca2+ release channel to cytosolic Ca2+ (Endo, 1977). Figure 4 illustrates the results of exposure of cells to 0.5 mM caffeine under the conditions of reduced ([Ca2+]o = 1 mM) or elevated ([Ca2+]o = 3 mM) SR Ca2+ loads employed beforehand. Caffeine was applied to the whole bath 20 s prior to delivery of the focal 10 mM caffeine pulse. At this combination of concentration and exposure time, caffeine used for conditioning of the release channels could effectively reach the channels inside the cell but at the same time did not cause premature Ca2+ release on a massive scale. It can be seen that with 1 mM [Ca2+]o the 10 mM caffeine pulse again induced only an abortive Ca2+ response, which died out within 30 μm of the site of caffeine application (Fig. 4Aa). However, following pre-exposure of the cell to 0.5 mM caffeine the release became regenerative and propagated through the entire cell (Fig. 4Ab). This was despite the fact that the SR Ca2+ content might have been slightly reduced in the presence of 0.5 mM caffeine, as suggested by the decreased amplitude of the local caffeine-induced [Ca2+] transient (Fig. 4C). Interestingly, the velocity of the waves recorded under these conditions (i.e. 0.5 mM caffeine and 1 mM [Ca2+]o) was much lower than under our standard conditions with no caffeine and 3 mM [Ca2+]o (31.4 ± 2.9 (n = 12) vs. 46.0 ± 2.3 (n = 25), P < 0.05; Fig. 4B). Such low wave velocities at reduced Ca2+ loads evidently result from reduced diffusion of Ca2+ out of the wavefront due to a smaller wave amplitude (Stern, 1992). With 3 mM [Ca2+]o, propagating Ca2+ waves could be triggered under control conditions, but preconditioning with 0.5 mM caffeine caused a significant increase in the velocity of the wave (51.0 ± 3.4 vs. 65.2 ± 3.8, n = 9, P < 0.05; Fig. 5A and B). Exposure to 0.5 mM caffeine for periods longer than 0.5-1 min resulted in a decrease in both propagation ability and magnitude of the Ca2+ responses below their respective control levels (not shown). These changes were evidently caused by a progressive loss of the SR Ca2+ content in the presence of caffeine.
Figure 4. The effects of sensitizing the release channels to cytosolic Ca2+ by low doses of caffeine on the ability of local releases to induce propagating Ca2+ waves under conditions of reduced SR Ca2+ load.

A, linescan images of fluorescence changes induced by focal applications of caffeine (10 mM) before (a) and 20 s after introducing 0.5 mM caffeine to the bath (b). The experimental protocol is illustrated by the scheme at the top. [Ca2+]o was 1 mM. Calibration bars: horizontal, 18 μm; vertical, 0.66 s. B, linear fits to the position of the propagating Ca2+ wave for the section in Ab defined by the arrows; the value of the mean wave velocity (v) is indicated. C, time-dependent changes in fluorescence at the sites of caffeine application (marked in corresponding images in A by bars) with (black traces) and without (grey traces) conditioning by 0.5 mM caffeine.
Figure 5. The effects of low doses of caffeine on Ca2+ wave propagation at increased SR Ca2+ load.

A, linescan images of fluorescence changes induced by focal applications of caffeine (10 mM) before (a) and 20 s after introducing 0.5 mM caffeine to the bath (b), as illustrated by the scheme at the top. [Ca2+]o was 3 mM. Calibration bars: horizontal, 18 μm; vertical, 0.66 s. B, linear fits to the positions of the Ca2+ waves for sections defined by arrows in corresponding images; the values of mean wave velocities are indicated. C, time-dependent changes in fluorescence at the sites of caffeine applications (marked in the corresponding images by bars) with (black traces) and without (grey traces) conditioning by 0.5 mM caffeine.
To quantify the potentiatory effects of 0.5 mM caffeine on the release mechanism, we performed measurements from single cardiac SR Ca2+ release channels incorporated into lipid bilayers. Ca2+ release channels were recorded using symmetrical 300 mM CsMeSO3 in the presence of 3 mM cytosolic MgATP with 2 μM and 1 mM Ca2+ at the cytosolic and luminal sides of the channel, respectively. Figure 6 shows examples of traces acquired from a single channel before and after the addition of 0.5 mM caffeine to the cytosolic side of the channel. It can be seen that caffeine caused a dramatic potentiation of channel activity. On average, 0.5 mM caffeine increased the channel Po measured for 1 min after addition of the drug by 400 % (0.014 ± 0.003 vs. 0.056 ± 0.006, n = 5, P < 0.05). For comparison, increasing luminal Ca2+ from 20 μM to 2 mM under similar ionic conditions has been shown to increase Po by 700 % (Lukyanenko et al. 1996). Therefore, using 0.5 mM caffeine can indeed be regarded as a reasonable approximation of the effects of increased luminal Ca2+ on Ca2+ release channel activity.
Figure 6. The effects of 0.5 mM caffeine on the activity of single cardiac RyR channels incorporated into lipid bilayers.

A and B, representative single channel traces recorded before (A) and after (B) introduction of 0.5 mM caffeine into the cis chamber. Current recordings were obtained at -40 mV holding potential in symmetrical 350 mM CsCH3SO3, pH 7.4. The cis chamber contained 3 mM MgATP and 2 μM free [Ca2+]. The trans chamber contained 1 mM Ca2+.
Effects of tetracaine
To probe further the role of luminal Ca2+ in Ca2+ wave propagation, we examined the effects of the allosteric inhibitor of the RyR channel, tetracaine, on responses induced by focal caffeine applications. It has been shown that submaximal tetracaine concentrations have only a transient suppressing effect on spontaneous (i.e. Ca2+ sparks and waves) and electrically evoked Ca2+ release (Györke et al. 1997; Overend et al. 1997, 1998). The temporary nature of tetracaine inhibition has been attributed to the increased SR Ca2+ accumulation caused by the drug (presumably via inhibition of Ca2+ leakage through the Ca2+ release channels). One possibility is that the recovery of release in the presence of tetracaine is due to the increased amount of releasable Ca2+ (Györke et al. 1997; Overend et al. 1997). Such a compensation of blockage could only occur when the inhibition by the drug is partial and at least some release sites remain available for liberation of Ca2+. Alternatively, luminal Ca2+ alters the tetracaine sensitivity of the Ca2+ release channels through an allosteric mechanism, making the channels more resistant to tetracaine (Györke et al. 1997). With such a removal of blockage, a recovery of release could occur even following a complete initial inhibition. The effects of tetracaine on caffeine-induced Ca2+ waves are summarized in Fig. 7. Exposure of the cells to 0.75 mM tetracaine for 1 min resulted in a complete inhibition of caffeine-induced Ca2+ release of all forms (Fig. 7Aa and b). However, further continuous incubation of the cells with the drug resulted in re-emergence of first localized (1 min, Fig. 7Ac) and then propagating Ca2+ releases (3 min, Fig. 7Ad). The amplitude of the fluorescence signal at the site of caffeine application was significantly increased compared with the reference situation (Fig. 7B). Similar results were obtained in eight other experiments. This is consistent with an increase in the SR Ca2+ content caused by tetracaine (Györke et al. 1997; Overend et al. 1997). The increased accumulation of Ca2+ in the SR in the presence of tetracaine was confirmed in experiments with application of caffeine to the entire cell (Fig. 7C). The magnitude of the caffeine-induced Ca2+ transients increased by 39 %± 7 % (n = 4) after 3 min of incubation with 0.75 mM tetracaine. Based on these results we conclude that the recovery of release from inhibition in the presence of tetracaine is not simply due to a compensation of blockage by increased SR Ca2+ load. Instead, the release mechanism itself becomes altered in a way that makes it less sensitive to inhibition by tetracaine. These results further support the possibility that a modulation of the release mechanism by luminal Ca2+ may be involved in the generation of Ca2+ waves in cardiac myocytes.
Figure 7. The effect of tetracaine on [Ca]i responses induced by focal caffeine applications.

A, linescan images of fluorescence changes acquired under control conditions (a) and at different times (1, 2 and 3 min; b, c and d, respectively) after addition to the bath of 0.75 mM tetracaine. [Ca2+]o was 3 mM. Calibration bars: horizontal, 10 μm; vertical, 0.33 s. B, time-dependent changes in fluorescence at the site of caffeine applications (marked by bars) for the images in A, as indicated. C, Ca2+ transients elicited by application of 20 mM caffeine to the whole bath before (lefthand trace) and 3 min after exposure of the cell to 0.75 mM tetracaine (righthand trace).
DISCUSSION
Growing evidence suggests that the activity of Ca2+ release channels of the SR can be influenced by luminal Ca2+ (Fabiato, 1992; Sitsapesan & Williams, 1994; Bassani et al. 1995; Lukyanenko et al. 1996; Györke et al. 1997; Santana et al. 1997; Györke & Györke, 1998). The present study is the first systematic attempt to define the potential role of this mechanism in the generation and propagation of Ca2+ waves in cardiac myocytes under conditions of increased Ca2+ loading. Two specific hypotheses were considered: (1) Increased luminal Ca2+ sensitizes the Ca2+ release channels to cytosolic Ca2+, enhancing the ability of cytosolic Ca2+ to activate adjacent release sites via CICR. (2) Ca2+ transported from the wavefront into the adjacent SR elements raises luminal Ca2+ above a critical threshold level, resulting in activation of the release channels at a luminal site.
To trigger and measure propagating Ca2+ waves we used focal caffeine application in combination with linescan confocal Ca2+ imaging. We created conditions for the transition of localized Ca2+ releases into propagating Ca2+ waves by increasing the cellular Ca2+ load via elevation of extracellular [Ca2+]. This procedure is known to increase [Ca2+] in both cytosolic and SR luminal compartments of cardiac myocytes (Wier et al. 1987; Lukyanenko et al. 1996; and the present study). We found that selectively inhibiting the accumulation of extra Ca2+ into the luminal compartment by thapsigargin prevented the transition of non-propagating Ca2+ responses to propagating Ca2+ waves upon elevation of [Ca2+]o. This result provides a direct experimental confirmation of the common assumption that increased SR Ca2+ content plays a critical role in the generation of propagating Ca2+ waves in Ca2+-overloaded cardiac myocytes. We further found that inhibition of the SR Ca2+ uptake into the SR with thapsigargin did not prevent Ca2+ wave propagation in cells already preloaded with Ca2+ above normal levels. Moreover, the velocity of the waves was accelerated relative to the control conditions (Fig. 3). This result shows unequivocally that propagation of Ca2+ waves does not require Ca2+ uptake from the approaching wave front. This conclusion is consistent with the relatively weak temperature dependency of Ca2+ wave propagation (Engel et al. 1995) and the rapid kinetics of local [Ca2+] rise during the wave (Cheng et al. 1996) shown recently in rat ventricular myocytes.
Another important finding of the present study was that sensitizing the release channels to cytosolic Ca2+ by low concentrations of caffeine dramatically augmented the ability of local releases to induce propagating Ca2+ waves. These results showed for the first time that propagating Ca2+ waves could be produced solely by enhancing the activity of the Ca2+ release channels without increasing the cellular Ca2+ load. These results are consistent with the hypothesis that potentiation of the Ca2+ release channel activity by elevated luminal Ca2+ may be involved in propagation of Ca2+ waves in cardiac myocytes. This hypothesis was further supported by the results of our experiments with the allosteric blocker of the RyR channel, tetracaine. We have recently demonstrated in lipid bilayer experiments that increased luminal Ca2+ modifies the RyRs in a fashion that makes them more sensitive to activation by cytosolic Ca2+ and more resistant to inhibition by cytosolic Ca2+ and tetracaine (Györke et al. 1997; Györke & Györke, 1998). In the present study we used a tetracaine resistance test to confirm that RyRs also become allosterically altered in intact myocytes upon increasing the SR Ca2+ load. We showed that tetracaine (0.75 mM) initially inhibited fully both localized and propagating responses triggered by focal caffeine applications. This inhibition was, however, completely reversed by the increased accumulation of Ca2+ in the SR caused by the drug (Fig. 7). We speculate that the tetracaine-resistant conformation with altered Ca2+ gating is the form of the channel that is involved in Ca2+ wave generation in cardiac myocytes.
To better understand how alterations in the activity of the release channels could affect the generation of Ca2+ waves, we performed computer simulations using a numerical model of the Ca2+ wave. Recently, Keizer et al. (1998) showed that a simple ‘fire-diffuse-fire’ model can account for saltatory wave propagation in cardiac myocytes. In their work, they numerically solved a single reaction diffusion model for free [Ca2+] in one spatial dimension. We expanded upon the Keizer model by including the effects of soluble Ca2+ buffers, Ca2+:dye complex and the free dye. Immunochemical and ultrastructural evidence indicate that SR Ca2+ release channels are localized in junctional and corbular SR, which occur at the level of Z-lines and t-tubules (Jorgensen et al. 1993; Franzini-Armstrong & Protasi, 1997). In addition, elementary Ca2+ release events - Ca2+ sparks - have been shown to originate at t-tubules in cardiac cells (Shacklock et al. 1995; Cheng et al. 1996). Therefore, we mimicked the subsarcomeric localization of the Ca2+ release channels by placing the release sites at a distance of 2 μm from each other. The parameters of release, diffusion, buffering and uptake were selected from the accepted range of literature values so as to maximize uninterrupted diffusion of Ca2+ between the release sites (Table 1). Nuclear magnetic resonance studies have shown that upon increasing the cellular Ca2+ load, luminal [Ca2+] can rise up to 5 mM (Chen et al. 1996). Thus to mimic the rise of luminal [Ca2+] under conditions of increased cellular Ca2+ loads, [Ca2+]SR was set at 5 mM. Using this model, we investigated the range for the Ca2+ threshold of release site activation required for successful wave propagation. Ca2+ waves were initiated by triggering Ca2+ release in a region with a diameter of 6 μm containing three release sites. Examples of theoretical linescan responses generated by using four different threshold values (5, 2, 1.3 and 0.5 μM) are presented in Fig. 8. In accordance with simulations by Keizer and co-authors (1998) the propagating Ca2+ waves exhibited clear saltatory properties. With the threshold set at 5 μM, the local Ca2+ elevation did not initiate Ca2+ release from the release sites (Fig. 8a). With a threshold of 2 μM the same stimulus triggered CICR that propagated to both sides by sequential activation of release sites for a distance of about 10 μm but then died out spontaneously (Fig. 8b). When the Ca2+ threshold was set below 1.5 μM the same local Ca2+ elevations triggered self-sustaining Ca2+ waves which propagated over the entire domain of simulation (Fig. 8c and d). The velocity of the wave was higher for simulations that employed lower Ca2+ activation threshold settings (cf. Fig. 8d and c). The results of these simulations are in accordance with our experimental results, which showed that sensitizing the release mechanism to cytosolic Ca2+ enhanced wave generation and propagation in cardiac myocytes (Fig. 5). Our experimental images of Ca2+ waves did not show the clear site-to-site propagation seen in the images of theoretical Ca2+ waves. This apparent discrepancy could be ascribed to the limited spatial and temporal resolution provided by the confocal microscope. A similar problem in detecting localized release events during both normal E-C coupling and Ca2+ waves has been described previously (Cheng et al. 1993, 1996; Cannel et al. 1994). It has been shown that image enhancement analysis can reveal Ca2+ wave propagation by sequential activation of release sites (Cheng et al. 1996).
Figure 8. The dependence of theoretical [Ca2+]i responses on the threshold of release site Ca2+ activation.

a-d, simulated linescan images of [Ca2+]i responses at different Ca2+ activation thresholds (5, 2, 1.3 and 0.5 μM, respectively). The [Ca2+]i responses were triggered by a Ca2+ elevation produced by an exponentially decaying release flux with a peak amplitude of 30 mM s−1 and decay time constant of 2 ms in a region with a diameter of 6 μm. The simulation included 50 individual release sites with a diameter of 0.1 μm each spaced at intervals of 2 μm, 2 spatially homogeneous removal fluxes (SR Ca2+ pumps and soluble buffers), diffusible dye and the Ca2+:dye complex. The values of the mean wave velocities (v,μm s−1) in c and d are indicated.
It is interesting to note that in Fig. 8b, the wave propagated only 10 μm when the threshold was 2 μM. The reason for termination is that there is a net depletion of calcium in the wavefront, i.e. qrel - qrem < 0. The wave will terminate when the local free calcium concentration falls below the firing threshold. Increasing the magnitude of the initial trigger signal while holding the firing threshold fixed resulted in increased wave propagation length (not shown). Our model therefore predicts that an abortive (i.e. intrinsically not self-sustaining) wave propagates only over the region in which the initial calcium release has a diffusive influence.
Our computer simulations indicate that even with fairly large Ca2+ releases and with parameters of the model favouring Ca2+ diffusion, a localized release fails to initiate a self-sustaining Ca2+ wave for thresholds ≥ 1.3 μM. In rat ventricular myocytes under normal SR Ca2+ loading conditions, the cytosolic Ca2+ concentration required for activation of a Ca2+ spark has been estimated to be close to 15 μM (Cannel et al. 1994). This value is consistent with the low Ca2+ sensitivity of the RyR channels (KD≈ 30 μM; Györke & Györke, 1998) in reconstitution experiments in the presence of physiological concentrations of Mg2+ and ATP. Studies from our laboratory have shown that increased luminal [Ca2+] enhances the sensitivity of the RyRs to cytosolic [Ca2+] (Lukyanenko et al. 1996; Györke & Györke, 1998). In particular, elevating luminal Ca2+ from 0.2-1 to 5-10 mM induced a 2- to 7-fold increase in the Po of RyRs activated by cytosolic [Ca2+] (Györke & Györke, 1998). Values for resting free [Ca2+]SR have been estimated to be in the 0.7-1.5 mM range at loading conditions that can be considered normal (Chen et al. 1996; Shannon & Bers, 1997). Under conditions of increased cellular Ca2+ load, free [Ca2+]SR can rise to 5 mM (Chen et al. 1996). Such an elevation in [Ca2+]SR would be expected to augment RyR channel activity, bringing the threshold of activation of the RyRs by cytosolic Ca2+ closer to the range that is required for Ca2+ wave propagation according to our simulations. Therefore, the results of our Ca2+ wave simulations suggest that increased amounts of releasable Ca2+ alone may not be sufficient to account for the transition of local releases into propagating Ca2+ waves under conditions of increased SR Ca2+ loads. However, sensitization of the release sites to activating Ca2+ can effectively promote the generation of self-sustaining Ca2+ waves.
Taken together, the results of the present study suggest that the potentiation of SR Ca2+ release channels by luminal Ca2+ is an important factor in the generation of self-sustaining Ca2+ waves in rat ventricular myocytes. Ca2+ wave propagation does not require the translocation of Ca2+ from the spreading wave front into the SR. Instead it appears to rely on the steadier effects of luminal Ca2+, consisting of sensitization of the Ca2+ release channels to cytosolic Ca2+. These results may have implications for understanding mechanisms of Ca2+ waves in other cell types where modulatory effects of luminal Ca2+ on the release mechanism have been implicated (Nunn & Taylor, 1992).
Acknowledgments
This work was supported by the National Institutes of Health (HL 52620 and HL 03739). S. Györke is an Established Investigator of the American Heart Association.
References
- Albritton NL, Meyer T, Stryer L. Range of messenger action of calcium ion and inositol 1,4,5-trisphosphate. Science. 1992;258:1812–1815. doi: 10.1126/science.1465619. [DOI] [PubMed] [Google Scholar]
- Bassani JW, Bassani RA, Bers DM. Twitch-dependent SR Ca accumulation and release in rabbit ventricular myocytes. American Journal of Physiology. 1993;265:C533–540. doi: 10.1152/ajpcell.1993.265.2.C533. [DOI] [PubMed] [Google Scholar]
- Bassani JW, Yuan W, Bers DM. Fractional SR Ca2+ release is regulated by trigger Ca2+ and SR Ca2+ content in cardiac myocytes. American Journal of Physiology. 1995;268:C1313–1329. doi: 10.1152/ajpcell.1995.268.5.C1313. [DOI] [PubMed] [Google Scholar]
- Bers DM. Excitation-Contraction Coupling and Cardiac Contractile Force. Dordrecht, The Netherlands: Kluwer Academic Publishers; 1991. [Google Scholar]
- Beuckelmann DJ, Wier WG. Mechanism of release of calcium from sarcoplasmic reticulum of guinea-pig cardiac cells. The Journal of Physiology. 1988;405:233–255. doi: 10.1113/jphysiol.1988.sp017331. [DOI] [PMC free article] [PubMed] [Google Scholar]
- Cannell MB, Berlin JR, Lederer WJ. Effect of membrane potential changes on the calcium transient in single rat cardiac muscle cells. Science. 1987;238:1419–1423. doi: 10.1126/science.2446391. [DOI] [PubMed] [Google Scholar]
- Cannell MB, Cheng H, Lederer WJ. Spatial non-uniformities in [Ca2+]i during excitation-contraction coupling in cardiac myocytes. Biophysical Journal. 1994;67:1942–1956. doi: 10.1016/S0006-3495(94)80677-0. [DOI] [PMC free article] [PubMed] [Google Scholar]
- Chen W, Steenbergen C, Levy L, Vance J, Murphy E. Measurement of free Ca2+ in sarcoplasmic reticulum in perfused rabbit heart loaded with 1,2-bis(2-amino-5,6-difluorophenoxy)ethane-N,N,N’-tetraacetic acid by 19F NMR. Journal of Biological Chemistry. 1996;29:7398–7403. [PubMed] [Google Scholar]
- Cheng H, Lederer W, Cannell MB. Calcium sparks: elementary events underlying excitation-contraction coupling in heart muscle. Science. 1993;262:740–744. doi: 10.1126/science.8235594. [DOI] [PubMed] [Google Scholar]
- Cheng H, Lederer MR, Lederer WJ, Cannell MB. Calcium sparks and [Ca2+]i waves in cardiac myocytes. American Journal of Physiology. 1996;270:C148–159. doi: 10.1152/ajpcell.1996.270.1.C148. [DOI] [PubMed] [Google Scholar]
- Dettbarn C, Györke S, Palade P. Many agonists induce ‘quantal’ Ca2+ release or adaptive behavior in muscle ryanodine receptors. Molecular Pharmacology. 1994;46:502–507. [PubMed] [Google Scholar]
- Eisner DA, Trafford AW, Diaz ME, Overend CL, O'Neill SC. The control of Ca release from the cardiac sarcoplasmic reticulum: regulation versus autoregulation. Cardiovascular Research. 1998;38:589–604. doi: 10.1016/s0008-6363(98)00062-5. 10.1016/S0008-6363(98)00062-5. [DOI] [PubMed] [Google Scholar]
- Endo M. Calcium release from the sarcoplasmic reticulum. Physiological Reviews. 1977;57:71–108. doi: 10.1152/physrev.1977.57.1.71. [DOI] [PubMed] [Google Scholar]
- Engel J, Sowerby AJ, Finch AE, Fechner M, Stier A. Temperature dependence of Ca2+ wave properties in cardiomyocytes: implications for the mechanism of autocatalytic Ca2+ release in wave propagation. Biophysical Journal. 1995;68:40–45. doi: 10.1016/S0006-3495(95)80196-7. [DOI] [PMC free article] [PubMed] [Google Scholar]
- Escobar AL, Cifuentes F, Vergara JL. Detection of Ca2+-transients elicited by flash photolysis of DM-nitrophen with a fast calcium indicator. FEBS Letters. 1995;364:335–338. doi: 10.1016/0014-5793(95)00425-9. 10.1016/0014-5793(95)00425-9. [DOI] [PubMed] [Google Scholar]
- Fabiato A. Calcium-induced release of calcium from the cardiac sarcoplasmic reticulum. American Journal of Physiology. 1983;245:C1–14. doi: 10.1152/ajpcell.1983.245.1.C1. [DOI] [PubMed] [Google Scholar]
- Fabiato A. Two kinds of calcium-induced release of calcium from the sarcoplasmic reticulum of skinned cardiac cells. In: Frank GB, editor. Excitation-Contraction Coupling in Skeletal, Cardiac and Smooth Muscle. New York: Plenum Press; 1992. pp. 245–262. [DOI] [PubMed] [Google Scholar]
- Franzini-Armstrong C, Protasi F. Ryanodine receptors of striated muscles: a complex channel capable of multiple interactions. Physiological Reviews. 1997;77:699–729. doi: 10.1152/physrev.1997.77.3.699. [DOI] [PubMed] [Google Scholar]
- Györke I, Györke S. Regulation of the cardiac ryanodine receptor channel by luminal Ca involves luminal Ca sensing sites. Biophysical Journal. 1998 doi: 10.1016/S0006-3495(98)77723-9. in the Press. [DOI] [PMC free article] [PubMed] [Google Scholar]
- Györke S, Lukyanenko V, Györke I. Dual effects of tetracaine on spontaneous calcium release in rat ventricular myocytes. The Journal of Physiology. 1997;500:297–309. doi: 10.1113/jphysiol.1997.sp022021. [DOI] [PMC free article] [PubMed] [Google Scholar]
- Györke S, Palade P. Role of local Ca2+ domains in activation of Ca2+-induced Ca2+ release in crayfish muscle. American Journal of Physiology. 1993;264:C1505–1512. doi: 10.1152/ajpcell.1993.264.6.C1505. [DOI] [PubMed] [Google Scholar]
- Han S, Schiefer A, Isenberg G. Ca2+ load of guinea-pig ventricular myocytes determines efficacy of brief Ca2+ currents as trigger for Ca2+ release. The Journal of Physiology. 1994;480:411–421. doi: 10.1113/jphysiol.1994.sp020371. [DOI] [PMC free article] [PubMed] [Google Scholar]
- Harkins AB, Kurebayashi N, Baylor SM. Resting myoplasmic free calcium in frog skeletal muscle fibers estimated with fluo-3. Biophysical Journal. 1993;65:865–881. doi: 10.1016/S0006-3495(93)81112-3. [DOI] [PMC free article] [PubMed] [Google Scholar]
- Ishide N. Intracellular calcium modulators for cardiac muscle in pathological conditions. Japanese Heart Journal. 1996;37:1–17. doi: 10.1536/ihj.37.1. [DOI] [PubMed] [Google Scholar]
- Janczewski AMJ, Spurgeon HA, Stern MD, Lakatta EG. Effects of sarcoplasmic reticulum Ca2+ load on the gain function of Ca2+ release by Ca2+ current in cardiac cells. American Journal of Physiology. 1994;268:H916–920. doi: 10.1152/ajpheart.1995.268.2.H916. [DOI] [PubMed] [Google Scholar]
- Jorgensen AO, Shen AC, Arnold W, McPherson PS, Campbell KP. The Ca2+ release channel/ryanodine receptor is localized in junctional corbular sarcoplasmic reticulum in cardiac muscle. Journal of Cell Biology. 1993;120:969–980. doi: 10.1083/jcb.120.4.969. 10.1083/jcb.120.4.969. [DOI] [PMC free article] [PubMed] [Google Scholar]
- Keizer J, Smith G, Ponce-Dawson S, Pearson J. Saltatory propagation of Ca2+ waves by Ca2+ sparks. Biophysical Journal. 1998;75:595–600. doi: 10.1016/S0006-3495(98)77550-2. [DOI] [PMC free article] [PubMed] [Google Scholar]
- Kirby MS, Sagara Y, Gaa S, Inesi G, Lederer WJ, Rogers TB. Thapsigargin inhibits contraction and Ca2+ transient in cardiac cells by specific inhibition of the sarcoplasmic reticulum Ca2+ pump. Journal of Biological Chemistry. 1992;25:12545–12551. [PubMed] [Google Scholar]
- Kort A, Capogrossi M, Lakatta E. Frequency, amplitude, and propagation velocity of spontaneous Ca2+-dependent contractile waves in intact adult rat cardiac muscle and isolated myocytes. Circulation Research. 1985;57:844–855. doi: 10.1161/01.res.57.6.844. [DOI] [PubMed] [Google Scholar]
- Lipp P, Niggli E. Modulation of Ca2+ release in cultured neonatal rat cardiac myocytes. Circulation Research. 1994;74:979–990. doi: 10.1161/01.res.74.5.979. [DOI] [PubMed] [Google Scholar]
- Lopez-Lopez JR, Shacklock PS, Balke CW, Wier WG. Local calcium transients triggered by single L-type calcium channel currents in cardiac cells. Science. 1995;268:1042–1045. doi: 10.1126/science.7754383. [DOI] [PubMed] [Google Scholar]
- Lukyanenko V, Györke I, Györke S. Regulation of calcium release by calcium inside the sarcoplasmic reticulum in ventricular myocytes. Pflügers Archiv. 1996;432:1047–1054. doi: 10.1007/s004240050233. [DOI] [PubMed] [Google Scholar]
- Lukyanenko V, Wiesner T, Györke S. Inactivation of Ca2+ release during Ca2+ sparks in rat ventricular myocytes. The Journal of Physiology. 1998;507:667–677. doi: 10.1111/j.1469-7793.1998.667bs.x. [DOI] [PMC free article] [PubMed] [Google Scholar]
- Niggli E, Lederer WJ. Voltage-independent calcium release in heart muscle. Science. 1990;250:565–568. doi: 10.1126/science.2173135. [DOI] [PubMed] [Google Scholar]
- Nunn DL, Taylor CW. Luminal Ca2+ increases the sensitivity of Ca2+ stores to inosytol 1,4,5-trisphosphate. Molecular Pharmacology. 1992;41:115–119. [PubMed] [Google Scholar]
- Overend CL, Eisner DA, O'Neill CO. The effect of tetracaine on spontaneous Ca2+ release and sarcoplasmic reticulum calcium content in rat ventricular myocytes. The Journal of Physiology. 1997;502:471–479. doi: 10.1111/j.1469-7793.1997.471bj.x. [DOI] [PMC free article] [PubMed] [Google Scholar]
- Overend CL, O'Neill CO, Eisner DA. The effect of tetracaine on stimulated contractions, sarcoplasmic reticulum Ca2+ content and membrane current in isolated rat ventricular myocytes. The Journal of Physiology. 1998;507:759–769. doi: 10.1111/j.1469-7793.1998.759bs.x. [DOI] [PMC free article] [PubMed] [Google Scholar]
- Santana LF, Gomez AM, Kranias EG, Lederer WJ. Amount of calcium in the sarcoplasmic reticulum: influence on excitation-contraction coupling in heart muscle. Heart Vessels. 1997;12(suppl.):44–49. [PubMed] [Google Scholar]
- Satoh H, Blatter LA, Bers DM. Effects of [Ca2+]i, SR Ca2+ load, and rest on Ca2+ spark frequency in ventricular myocytes. American Journal of Physiology. 1997;272:H657–668. doi: 10.1152/ajpheart.1997.272.2.H657. [DOI] [PubMed] [Google Scholar]
- Shacklock PS, Wier WG, Balke CW. Local Ca2+ transients (Ca2+ sparks) originate at transverse tubules in rat heart cells. The Journal of Physiology. 1995;487:601–608. doi: 10.1113/jphysiol.1995.sp020903. [DOI] [PMC free article] [PubMed] [Google Scholar]
- Shannon TR, Bers DM. Assessment of intra-SR free [Ca] and buffering in rat heart. Biophysical Journal. 1997;73:1524–1531. doi: 10.1016/S0006-3495(97)78184-0. [DOI] [PMC free article] [PubMed] [Google Scholar]
- Sipido KR, Wier WG. Flux of Ca2+ across the sarcoplasmic reticulum of guinea-pig cardiac cells during excitation-contraction coupling. The Journal of Physiology. 1991;435:605–630. doi: 10.1113/jphysiol.1991.sp018528. [DOI] [PMC free article] [PubMed] [Google Scholar]
- Sitsapesan R, Williams AJ. Regulation of the gating of the sheep cardiac sarcoplasmic reticulum Ca2+-release channel by luminal Ca2+ Journal of Membrane Biology. 1994;137:215–226. doi: 10.1007/BF00232590. [DOI] [PubMed] [Google Scholar]
- Smith GD, Keizer JE, Stern MD, Lederer WJ, Cheng HA. Simple numerical model of calcium spark formation and detection in cardiac myocytes. Biophysical Journal. 1998;75:15–32. doi: 10.1016/S0006-3495(98)77491-0. [DOI] [PMC free article] [PubMed] [Google Scholar]
- Song LS, Stern MD, Lakatta EG, Cheng H. Partial depletion of sarcoplasmic reticulum calcium does not prevent calcium sparks in rat ventricular myocytes. The Journal of Physiology. 1997;505:665–675. doi: 10.1111/j.1469-7793.1997.665ba.x. [DOI] [PMC free article] [PubMed] [Google Scholar]
- Stern MD. Theory of excitation-contraction coupling in cardiac muscle. Biophysical Journal. 1992;63:495–517. doi: 10.1016/S0006-3495(92)81615-6. [DOI] [PMC free article] [PubMed] [Google Scholar]
- Stern MD, Capogrossi MC, Lakatta EG. Spontaneous calcium release from the sarcoplasmic reticulum in myocardial cells: mechanisms and consequences. Cell Calcium. 1988;9:247–256. doi: 10.1016/0143-4160(88)90005-x. [DOI] [PubMed] [Google Scholar]
- Stern MD, Lakatta E. Excitation-contraction in the heart: the state of the question. FASEB Journal. 1992;6:3092–3100. doi: 10.1096/fasebj.6.12.1325933. [DOI] [PubMed] [Google Scholar]
- Takamatsu T, Wier WG. Calcium waves in mammalian heart: quantification of origin, magnitude, waveform, and velocity. FASEB Journal. 1990;4:1519–1525. doi: 10.1096/fasebj.4.5.2307330. [DOI] [PubMed] [Google Scholar]
- Tang Y, Othmer HG. A model of calcium dynamics in cardiac myocytes based on the kinetics of ryanodine-sensitive calcium channels. Biophysical Journal. 1994;67:2223–2235. doi: 10.1016/S0006-3495(94)80707-6. [DOI] [PMC free article] [PubMed] [Google Scholar]
- Thastrup O, Dawson AP, Scharff O, Foder B, Cullen PJ, Drobak BK, Bjerrum PJ, Christensen SB, Hanley MR. Thapsigargin, a novel molecular probe for studying intracellular calcium release and storage. Agents Actions. 1989;27:17–23. doi: 10.1007/BF02222186. [DOI] [PubMed] [Google Scholar]
- Trafford AW, Lipp P, O'Neil CO, Niggli E, Eisner DA. Propagating calcium waves initiated by local caffeine application in rat ventricular myocytes. The Journal of Physiology. 1995;489:319–326. doi: 10.1113/jphysiol.1995.sp021053. [DOI] [PMC free article] [PubMed] [Google Scholar]
- Trafford AW, O'Neill SC, Eisner DA. Factors affecting the propagation of locally activated systolic Ca transients in rat ventricular myocytes. Pflügers Archiv. 1990;425:181–183. doi: 10.1007/BF00374521. [DOI] [PubMed] [Google Scholar]
- Wier WG, Cannell MB, Berlin JR, Marban E, Lederer WJ. Cellular and subcellular heterogeneity of [Ca2+]i in single heart cells revealed by Fura-2. Science. 1987;235:325–328. doi: 10.1126/science.3798114. [DOI] [PubMed] [Google Scholar]
- Wussling MHP, Salz H. Nonlinear propagation of spherical calcium waves in rat cardiac myocytes. Biophysical Journal. 1996;70:1144–1153. doi: 10.1016/S0006-3495(96)79715-1. [DOI] [PMC free article] [PubMed] [Google Scholar]