

Abstract
The effects of reduced Na+/K+ gradients and Na+-K+ pump stimulation on compound action potentials (M waves) and contractile force were examined in isolated rat soleus muscles stimulated through the nerve.
Exposure of muscles to buffer containing 85 mM Na+ and 9 mM K+ (85 Na+/9 K+ buffer) produced a 54 % decrease in M wave area and a 50 % decrease in tetanic force compared with control levels in standard buffer containing 147 mM Na+ and 4 mM K+. Subsequent stimulation of active Na+-K+ transport, using the β2-adrenoceptor agonist salbutamol, induced a marked recovery of M wave area and tetanic force (to 98 and 87 % of the control level, respectively). Similarly, stimulation of active Na+-K+ transport with insulin induced a significant recovery of M wave area and tetanic force.
During equilibration with 85 Na+/9 K+ buffer and after addition of salbutamol there was a close linear correlation between M wave area and tetanic force (r = 0·92, P< 0·001). Similar correlations were found in muscles where tetrodotoxin was used to reduce excitability and in muscles fatigued by 120 s of continuous stimulation at a frequency of 30 Hz.
These results show a close correlation between excitability and tetanic force. Furthermore, in muscles depressed by a reduction in the Na+/K+ gradients, β-adrenergic stimulation of the Na+-K+ pump induces a recovery of excitability which can fully explain the previously demonstrated recovery of tetanic force following Na+-K+ pump stimulation. Moreover, the data indicate that loss of excitability is an important factor in fatigue induced by high-frequency (30 Hz) stimulation.
During excitation of muscle fibres the action potentials are associated with a marked increase in Na+ influx and K+ efflux. The activity of the Na+-K+ pump will compensate for these fluxes, but it is well documented that the capacity of this transport system may not be large enough to prevent progressive reductions in the transmembrane gradients for Na+ and K+ (Sreter & Woo, 1963; Juel, 1986; Nielsen & Overgaard, 1996). It has been hypothesized that such reductions may eventually cause muscle fatigue due to lowered excitability (Bigland-Ritchie et al. 1979; Sjögaard, 1990).
It is well known from experiments with isolated muscles that large increases in [K+]o lead to a decrease in contractile force (Holmberg & Waldeck, 1980; Juel, 1988; Clausen et al. 1993). This is associated with broadening of the action potential, loss of propagation velocity and, in some fibres, inexcitability (Jones, 1981; Juel, 1988; Kossler et al. 1991). Recordings of M waves indicate that similar changes in the action potential occur in human muscles stimulated to fatigue in vivo (Bigland-Ritchie, 1981).
Bouclin et al. (1995) found that in frog muscle the effect of increased [K+]o on contractile force was potentiated by a simultaneous decrease in [Na+]o. Similarly, in rat soleus muscles it was shown that whereas a reduction in [Na+]o to 71 mM or an increase in [K+]o to 8 mM did not reduce tetanic force, the combination of decreased [Na+]o and increased [K+]o led to a marked decrease (71 %) in tetanic force (Overgaard et al. 1997a).
Stimulation of the Na+-K+ pump with adrenaline, a β2-adrenoceptor agonist or insulin induces a recovery from the loss of contractility produced by reductions in the Na+ or K+ gradients (Clausen et al. 1993; Overgaard et al. 1997a). This effect can be related to a recovery of the Na+/K+ gradients as such, but may also be related to an increased electrogenic contribution of the Na+-K+ pump to the membrane potential (Overgaard et al. 1997a). It has been suggested that the activity of the Na+-K+ pump is important for the maintenance of muscle action potential activity, especially during and following intense fatiguing activity (Hicks & McComas, 1989).
The aim of this investigation was to examine whether the previously noted changes in force development upon reduction in Na+/K+ gradients and subsequent stimulation of the Na+-K+ pump were correlated to similar changes in action potential activity (hereafter referred to as ‘excitability’). This was done in muscles stimulated either via the nerve or by field stimulation. Furthermore, by the use of tetrodotoxin (TTX), we investigated more thoroughly if the observed link between excitability and contractility could apply more generally to muscle function, or if it was specific to changes in Na+/K+ gradients. Finally, the observed changes in contractility and excitability were compared with those seen during a fatigue protocol.
Surface recordings of compound muscle action potentials (M waves) were used to assess muscle excitability. A method was developed which allowed simultaneous recording of force production and M waves from isolated muscles in vitro. Part of the results have been briefly reported in a preliminary form (Overgaard et al. 1997b).
METHODS
Animals and muscle preparation
All handling and use of animals complied with Danish animal welfare regulations. All experiments were carried out using soleus muscles from 4-week-old male or female Wistar rats weighing 60-70 g (own breed). The rats were fed ad libitum and were maintained at a constant temperature (21°C) and day length (12 h). Animals were killed by decapitation. Muscles were dissected out with tendons intact. The bony attachment of the proximal end of the muscle and approximately 10 mm of the nerve were left attached. The cross-sectional area over the mid-portion of the muscles was 1.6 mm2 and the average weight of the preparation was 23 mg. The muscles measured 2.3 cm from tendon to tendon when mounted at optimal length. The standard incubation medium was Krebs-Ringer bicarbonate buffer containing (mM): 122 NaCl, 25 NaHCO3, 2.8 KCl, 1.2 KH2PO4, 1.2 MgSO4, 1.3 CaCl2 and 5.0 D-glucose (standard KR). The buffer was maintained at 30°C and equilibrated with a mixture of 95 % O2 and 5 % CO2 (pH = 7.4) throughout the experiments. After preparation, muscles were equilibrated in this buffer for at least 30 min before starting the experiment. In buffers containing 85 mM Na+, NaCl was replaced with equimolar amounts of N-methyl-D-glucamine chloride. To produce buffers with 9 mM K+, KCl was added and an equal amount of NaCl (or N-methyl-D-glucamine chloride in low-Na+ buffers) was withheld to keep the osmolarity constant.
Intracellular Na+ and water content
Intracellular Na+ content was determined following experimentation using procedures previously described (Overgaard et al. 1997a). In brief, muscles were rapidly transferred to ice-cold Na+-free Tris-sucrose buffer (pH 7.45) and washed 4 × 15 min in order to remove extracellular Na+. Then muscles were blotted, weighed and soaked overnight in 0.12 M trichloroacetic acid (TCA). This procedure was shown to give complete extraction of Na+ from the tissue (Clausen et al. 1993). The concentration of Na+ in the TCA extract was measured by flame photometry (FLM3, Radiometer, Copenhagen, Denmark). The intracellular water content was determined by measuring total water content and subtracting extracellular water content measured using [14C]sucrose (Kohn & Clausen, 1971). In muscles incubated for 90 min in standard KR, intracellular water corresponded to 54 ± 1 % of the wet weight (n = 6). This value was not significantly different from that of the contralateral muscles incubated for 90 min in buffer containing 85 mM Na+ and 9 mM K+ (85 Na+/9 K+ buffer) (52 ± 1 % of the wet weight, n = 5). The intracellular [Na+] ([Na+]i) could thus be expressed as millimoles per litre cell water using a value for intracellular water of 53 % of the wet weight and under the assumption that all the intracellular Na+ was freely dissolved herein.
Force development and electrical stimulation
Muscles were mounted vertically with their tendons intact in thermostatically controlled chambers (Clausen & Everts, 1991). Isometric force development was measured using a force displacement transducer (Grass FTO3) calibrated with standard weights and recorded both with a chart recorder and digitally on a computer.
Muscles were adjusted to optimal length and initial tests of contractility were performed. Tetanic contractions were evoked by trains of 1.5 s duration at 30 Hz. The duration of the train used also assured complete development of tetanic force in the modified buffers. A stimulation frequency of 30 Hz was chosen because it is close to the maximal motor unit discharge rates observed for soleus muscles in vivo (Bigland-Ritchie & Woods, 1984; Hennig & Lömo, 1985). High-resolution measurements showed that at 30 Hz the maximum fluctuations in force were 0.4 ± 0.3 % (n = 4) of the force produced, indicating that the contractions were close to smooth tetani. After 30 min of rest and equilibration in KR buffer, three control contractions (1.5 s, 30 Hz) were elicited at 5 min intervals, and the mean force of these three contractions was used as the control value.
Muscles were stimulated with constant current pulses by an 8-channel programmable stimulator (Master 8, A.M.P.I., Israel) through a stimulus isolator (Isolator-10, Axon Instruments; modified to deliver up to 100 mA constant current). Nerve stimulation was elicited through a glass suction electrode with a tip diameter of 350 μm closely fitting the nerve twig. The anode was inside the glass tube and the cathode was coiled around the outside of the glass tube. Pulses of 10 mA and ∼8 V were used, which was found to be supramaximal for stimulation of the nerve without producing any direct stimulation of muscle fibres. If not otherwise noted, a 0.2 ms pulse duration was used for both field and nerve stimulation. In experiments in which muscles were exposed to TTX and/or D-tubocurarine, field stimulation was elicited through a set of silver electrodes placed at the end of the muscle distal to the M wave recording electrodes. The current needed to elicit maximal contraction was approximately 10 times higher when field stimulation was applied (up to 100 mA). The experiments with D-tubocurarine showed that the field stimulation applied in the M wave set-up was not adequate to produce full force development. In order to minimize the interference of stimulus artefacts with the M wave signal it was necessary to use a short pulse duration (0.2 ms) and an isolated stimulus pulse and to keep the stimulating and recording electrodes apart spatially. With these technical restrictions it was not possible to stimulate the muscles maximally using field stimulation. Therefore, lower values of tetanic force and M wave area were obtained in the experiments with D-tubocurarine. In experiments where M waves were not recorded, field stimulation was applied through two platinum electrodes, which passed current over the central part of the muscle.
M wave recordings
Unipolar M wave signals were recorded from either of two circular silver electrodes with a recording area of 0.79 mm2. The electrodes were placed 3.5 mm apart so that both were in contact with the muscle above the innervation zone. The reference electrode (Ag/AgCl) was placed in the bath at a distance of a few centimetres from the muscle and connected to ground (Fig. 1). The diameter of the recording electrodes was approximately half the width of the muscle, allowing that a relatively large number of fibres could contribute to the M wave recordings. The signals were led through a high-impedance headstage and processed by a differential amplifier (DAM 70, World Precision Instruments), with a band-pass filter (cut-off values of 1 Hz and 10 kHz). After amplification and filtering, the signals were digitized by an A/D converter (TL-125, Axon Instruments), fed into a personal computer (PC) and stored for later data processing. Averaging of signals and other data processing was performed with a commercial software package (pCLAMP 5 and 6, Axon Instruments).
Figure 1. Diagram of the set-up for M wave measurements.
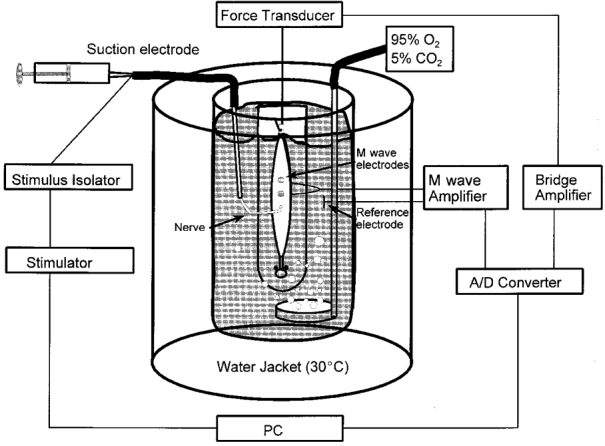
The muscle-nerve preparation was mounted in a thermostatically controlled chamber containing aerated KR buffer. The nerve twig was stimulated through a suction electrode. The muscle was placed in contact with the surface M wave electrodes and the reference electrode was placed in the bath a few centimetres away from the muscle. M wave and force signals were filtered, amplified and stored digitally.
When tetanic stimulations (1.5 s, 30 Hz) were used the PC program recorded 23 out of the 45 M waves in each train (every second M wave). These 23 signals were adjusted to a common baseline and averaged. The coefficient of variation from a series of M waves in a tetanus was between 3 and 9 % of the peak value and did not change with the different buffers or substances used. Also there was no tendency towards a decrease or increase of the M waves within a 1.5 s tetanus. From the averaged M wave for each tetanus the area, amplitude and time to peak were measured as shown in Fig. 2. M wave area is generally interpreted as a measure of the magnitude of the total current passage at the recording electrode, which is a function of the size of the individual action potentials and the number of activated fibres (Bigland-Ritchie, 1981). Thus M wave area provides an integrated measure of excitability of all the fibres ‘seen’ by the recording electrode. When muscle twitches were studied a train of five twitches at 0.5 Hz was evoked. These five signals were averaged and the M wave properties measured. To calculate the propagation velocity the time to peak recorded from one recording electrode was subtracted from the time to peak measured from the other recording electrode (Fig. 2) and the inter-electrode distance (3.5 mm) was then divided by this difference.
Figure 2. Typical M wave traces from the same muscle recorded from the 2 surface electrodes indicating the area, amplitude and time to peak.
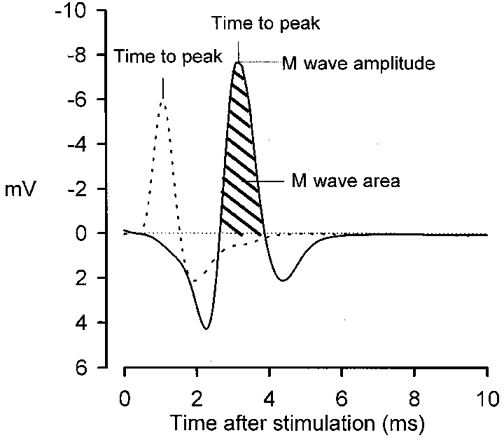
Dashed line, M wave recorded from the lower electrode (closest to the point of innervation). Continuous line, M wave recorded from the upper electrode. M wave area was defined as the area between the baseline (0 mV) and the major negative peak of the M wave trace (negative area). The M wave amplitude was the maximal voltage of the negative peak (note the inverted Y-axis). The propagation velocity was calculated from the difference in time to peak between recordings from the 2 electrodes.
Chemicals, isotopes and hormones
All chemicals were of analytical grade. Ouabain, salbutamol, D-tubocurarine, TTX and N-methyl-D-glucamine were purchased from Sigma. [14C]sucrose was from Amersham. Insulin was a gift from Novo Nordisk A/S (Copenhagen).
Statistics
All data are expressed as means ±s.e.m. The statistical significance of any difference between two groups was determined using Student's two-tailed t test for paired or non-paired observations as specified in the text. When more than two groups were compared, one-way ANOVA was performed followed by t tests where appropriate. Correlations between variables were analysed with linear regression.
RESULTS
Effects of reduced Na+/K+ gradients and Na+-K+ pump stimulation on tetanic force and M wave area
Experiments were performed to follow the changes in excitability and force development during exposure of muscles to 85 Na+/9 K+ buffer for 60 min and during subsequent stimulation of the Na+-K+ pump with salbutamol. As shown in Fig. 3, exposure to 85 Na+/9 K+ buffer led to a gradual decrease in the M wave area and tetanic force, which reached a steady level after 40 min. Addition of 10−5 M salbutamol after 60 min caused M wave area and tetanic force to recover sharply, attaining 97 % and 84 %, respectively, of the control levels within 5 min. Maximum recovery was reached after 10 min (see below).
Figure 3. Time course of changes in tetanic force and M wave area upon reduction of Na+/K+ gradients and after addition of 10−5 M salbutamol.
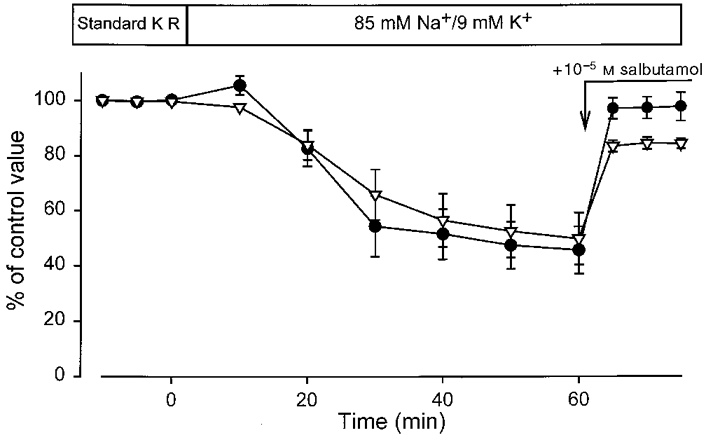
Muscles were stimulated via the nerve (1.5 s at 30 Hz) every 5 or 10 min and tetanic force (▿) and M wave area (•) were recorded. Initially, control contractions were measured in standard KR buffer. Muscles were then incubated in buffer containing 85 mM Na+ and 9 mM K+. After 60 min 10−5 M salbutamol was added (n = 6).
In order to uncover how the M wave parameters were affected by a reduction of either the Na+ gradient or the K+ gradient per se, muscles were tested at increased [K+]o or at reduced [Na+]o, both separately and in combination. Figure 4 shows data from 24 muscles divided into four groups of six. The absolute values of M wave area and tetanic force from these muscles in the standard KR buffer prior to any incubation in experimental buffers were 5.2 ± 0.3 mV ms and 228 ± 7 mN (n = 24), respectively. In this control situation there was no significant difference in either M wave area or tetanic force between the four groups of muscles (one-way ANOVA, P > 0.05). As shown in the bottom panel of Fig. 4, 60 min of exposure to a [K+]o of 9 mM or a [Na+]o of 85 mM did not produce significant changes in M wave area or tetanic force compared with muscles incubated for 60 min in standard KR buffer. When muscles were exposed for 60 min to 85 Na+/9 K+ buffer, however, M wave area and tetanic force decreased significantly to 46 ± 9 % and 50 ± 9 % of the initial control value in standard KR, respectively (Fig. 4).
Figure 4. Effects of increased [K+]o and/or reduced [Na+]o and subsequent addition of salbutamol on M waves and tetanic force.
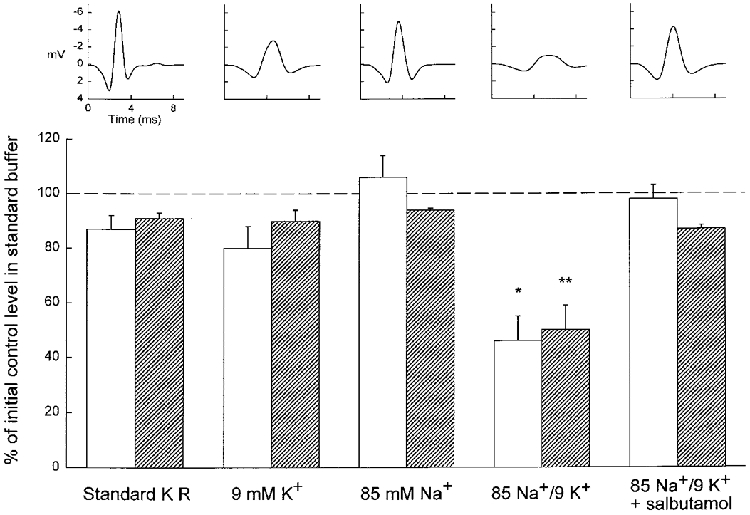
Top, typical M waves from muscles after 60 min in any of the 4 different buffers (indicated below the bottom panel) and 10 min after addition of 10−5 M salbutamol in 85 Na+/9 K+ buffer. Each M wave trace is the mean of 23 recordings from the same tetanic contraction. Bottom, bar chart of M wave area (□) and tetanic force ( ) after 60 min in any of the 4 different buffers indicated and 10 min after addition of 10−5 M salbutamol in 85 Na+/9 K+ buffer. Values are expressed as the percentage of initial control values in standard KR. Columns are means of 6 muscles in all groups, error bars denote +s.e.m. Significant differences from all the 4 other data groups (one-way ANOVA followed by unpaired t tests) are denoted by *P < 0.05 and **P < 0.01.
As shown in Fig. 4, the effects of 85 Na+/9 K+ buffer on M wave area and tetanic force were overcome when the Na+-K+ pump was stimulated by the β2-adrenergic agonist salbutamol (10−5 M). This led to a significant recovery of M wave area and tetanic force to 98 and 87 % of the control level, respectively (85 Na+/9 K+vs. 85 Na+/9 K++ salbutamol, paired t tests, P < 0.01 and 0.05, respectively). The values for M wave area and tetanic force after addition of salbutamol in muscles incubated in 85 Na+/9 K+ buffer were not significantly different from those of muscles incubated for 60 min in standard KR (unpaired t test, P > 0.05).
From the top panel of Fig. 4 it is evident that the M wave amplitude of the muscles exposed to 9 mM K+ decreased. However, this led only to an insignificant reduction in M wave area due to the compensatory effect of a simultaneous broadening of the M wave. Also, the decrease in the M wave area in 85 Na+/9 K+ buffer was caused by a large reduction in M wave amplitude, which was accompanied by an increase in time to peak and a considerable broadening of the M wave. The complete recovery of the M wave area after addition of salbutamol was caused by a partial recovery of M wave amplitude and a partially maintained broadening of the M wave. Thus the shape of the M wave was not fully recovered.
In order to see if the effects of salbutamol on M wave area and tetanic force were actually due to a stimulation of the Na+-K+ pump and not to some other action of the substance, we performed additional experiments similar to those described above using insulin instead of salbutamol. Insulin is known to stimulate active Na+-K+ transport through a mechanism separate from the cAMP pathway that is responsible for the Na+-K+ pump stimulation induced by catecholamines and other β2-agonists (Flatman & Clausen, 1979). In four muscles the M wave area was 7.3 ± 0.7 mV ms and the tetanic force was 226 ± 20 mN measured in the standard KR buffer. When these muscles were exposed to 85 Na+/9 K+ buffer for 60 min, M wave area and tetanic force decreased to 16 ± 4 % and 34 ± 9 %, respectively, of the control level. Adding insulin (100 mU ml−1) induced a significant recovery of M wave area to 65 ± 13 % and of tetanic force to 81 ± 4 % of the control levels (paired t tests, P < 0.05 in both cases).
In separate experiments with field stimulation, where M waves were not recorded, the salbutamol-induced force recovery in muscles incubated in 85 Na+/9 K+ buffer was accompanied by a decrease in [Na+]i from 22.3 ± 0.5 to 8.8 ± 0.4 mM (P < 0.001, unpaired t test, n = 4vs. 4). Moreover, when 10−3 M ouabain was added to the bathing solution after 60 min in 85 Na+/9 K+ buffer the tetanic force decreased to below 1 % of the initial control value within 10 min of exposure (n = 4). The force also decreased to below 1 % of initial control value within 10 min when salbutamol was added at the same time as ouabain (n = 4). When muscles were then stimulated with a longer pulse duration (1 ms) the ouabain-treated muscles developed 11 % of initial tetanic force and the muscles where both ouabain and salbutamol were added developed 13 % of initial tetanic force (n = 2vs. 2). Thus these experiments demonstrated that ouabain entirely suppressed the salbutamol-induced force recovery.
Twitch force and propagation velocity
As shown in Table 1, muscles stimulated via the nerve and exposed for 60 min to 9 mM K+ or 85 mM Na+ buffer showed an increase in twitch force to 127 and 108 % of the control levels, respectively. It was interesting to note that in contrast to this, 60 min exposure to 85 Na+/9 K+ buffer decreased twitch force to 67 % of the control level. When salbutamol (10−5 M) or insulin (100 mU ml−1) was added after 60 min exposure to 85 Na+/9 K+ buffer, the twitch force recovered completely.
Table 1.
Twitch force and propagation velocity
| Twitch force (mN) | M wave velocity (m s−1) | |
|---|---|---|
| Control (n = 6) | 54 ± 3 | 2.18 ± 0.09 |
| Standard KR (60 min later) | 53 ± 4 n. s. | 2.21 ± 0.09 n. s. |
| Control (n = 6) | 46 ± 2 | 2.68 ± 0.37 |
| 9 mM K+ (60 min) | 59 ± 5* | 1.64 ± 0.30* |
| Control (n = 6) | 50 ± 3 | 2.18 ± 0.04 |
| 85 mM Na+ (60 min) | 54 ± 3* | 1.71 ± 0.04* |
| Control (n = 9) | 54 ± 3 | 2.21 ± 0.08 |
| 85 Na+/9 K+ (60 min) | 36 ± 5* | 0.96 ± 0.04* |
| + 10−5 M salbutamol (n = 6) | 60 ± 5† | 1.39 ± 0.06† |
| + 100 mU ml−1 insulin (n = 3) | 72 ± 7† | 1.43 ± 0.04† |
Muscles were initially equilibrated for 30 min in standard KR buffer and a series of 5 twitches was performed twice (Control). After this, each group of muscles was equilibrated in the indicated buffers for 60 min and the measurements repeated. In muscles equilibrated to 85 Na+/9 K+ buffer, salbutamol or insulin was then added and twitches were elicited again 10–15 min later. Significance of differences was estimated by paired 2-tailed t test.
Significantly different from corresponding control, P < 0.05
significantly different from 85 Na+/9 K+ buffer, P < 0.05; n. s., not significant.
As shown in Table 1, there was no change in the propagation velocity of the M wave after 60 min incubation in standard KR buffer. Incubation in 9 mM K+ buffer, however, produced a 40 % reduction, incubation in 85 mM Na+ buffer a 21 % reduction and incubation in 85 Na+/9 K+ buffer a 56 % reduction in propagation velocity. The propagation velocity recovered rapidly but only partially upon addition of salbutamol or insulin.
Effects of D-tubocurarine
To test if the changes in M wave area and tetanic force after incubation in 85 Na+/9 K+ buffer and upon subsequent addition of salbutamol (Figs 3 and 4) were influenced by changes in nerve conduction or neuromuscular transmission, the experiment depicted in Fig. 3 was repeated using direct electrical stimulation and with D-tubocurarine (10−6 M) present before and during the incubation in 85 Na+/9 K+ buffer. Ten to fifteen minutes after the addition of tubocurarine in standard buffer it was no longer possible to excite the muscle via the nerve, indicating that neuromuscular transmission was fully blocked. At this point, the M wave area and tetanic force elicited by direct stimulation were 43 ± 9 and 73 ± 3 %, respectively, of the values obtained with nerve stimulation before the addition of D-tubocurarine. From this it was evident that the field stimulation used in this set-up was less efficient than stimulation via the nerve (see Methods). In order to be able to compare the effects of reduced Na+/K+ gradients in field-stimulated muscles with those in nerve-stimulated muscles the values obtained for M wave area and tetanic force after addition of D-tubocurarine were defined as the ‘field-stimulated control level’ in the following experiments with field stimulation. Incubation of the tubocurarine-blocked muscles for 60 min in 85 Na+/9 K+ buffer led to a decrease in M wave area and tetanic force to 11 ± 2 % and 21 ± 4 % of the field-stimulated control levels, respectively. Subsequent addition of 10−5 M salbutamol resulted in a recovery of M wave area and tetanic force to 79 ± 5 % and 71 ± 4 % of the field-stimulated control levels, respectively, within 10 min (P < 0.001 and P < 0.01, respectively, paired t tests, n = 4). These results show that salbutamol can cause a substantial recovery of excitability and contractility even when the motor endplate is blocked.
Correlations between M wave area and tetanic force
To examine if the progressive loss of force upon exposure of muscles to 85 Na+/9 K+ buffer (Fig. 3) correlated with a simultaneous change in M wave area, a plot was made of corresponding data for M wave area and tetanic force obtained from individual muscles during the first 60 min of incubation in 85 Na+/9 K+ buffer and after addition of salbutamol (Fig. 5, top left). Linear regression analysis showed a correlation coefficient (r) of 0.92, P < 0.001, demonstrating a close correlation between the two parameters during the progressive loss of force in 85 Na+/9 K+ buffer and during the subsequent salbutamol-induced recovery of force. A similar correlation was obtained from the above-mentioned experiment with D-tubocurarine and 85 Na+/9 K+ (Fig. 5, top right) when plotting data as a percentage of the field-stimulated control level.
Figure 5. Correlations between M wave area and tetanic force.
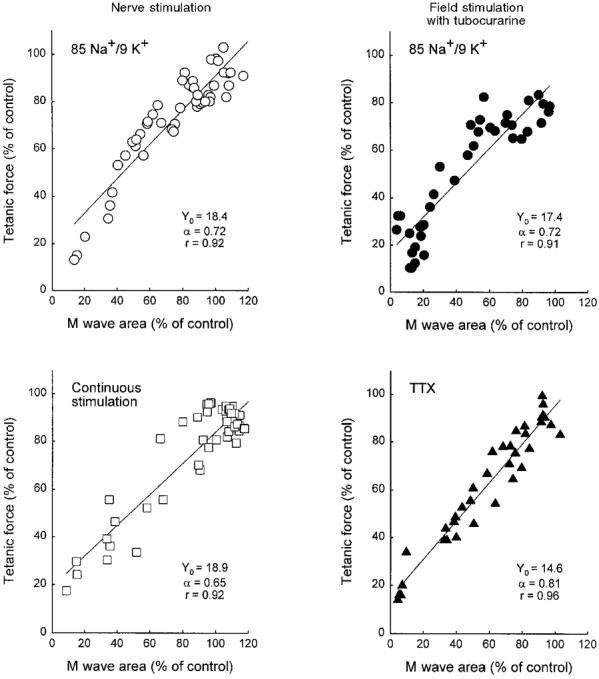
M wave area and tetanic force are shown as a percentage of the initial nerve-stimulated control value in standard KR buffer (left panels) or as a percentage of the field-stimulated control value in standard KR buffer with D-tubocurarine (right panels). Corresponding data points of M wave area and tetanic force were correlated by linear regression lines of the equation Y =Y0+αX. Top left, data points from 6 individual nerve-stimulated muscles during exposure to 85 Na+/9 K+ buffer and after addition of 10−5 M salbutamol. Data were sampled at the time points shown in Fig. 3. Top right, field-stimulated muscles during 60 min of exposure to 85 Na+/9 K+ buffer and after addition of 10−5 M salbutamol (n = 4). These data were sampled following a time course similar to that shown in Fig. 3. Bottom left, muscles stimulated via the nerve continuously for 120 s at 30 Hz. Data points are from the experiment shown in Fig. 6, sampled 5, 10, 20, 30, 45, 60, 90 and 120 s after start of stimulation (n = 6). Bottom right, muscles field-stimulated with brief trains (1.5 s, 30 Hz) every 5 min during 30 min incubation with 6 × 10⁻⁸ M TTX in standard KR buffer, and 5, 10, 15 and 20 min after a single washout with standard KR buffer (n = 4). In the panels on the right, D-tubocurarine was added (10−6 M) prior to incubation and stimulations through the nerve were done before and after the experiment to ascertain that there was no contribution from the endplate to the excitation of these muscles.
To examine whether the correlation between M wave area and tetanic force observed at reduced Na+/K+ gradients was a general feature of muscle function, a series of experiments was performed using a low concentration of TTX to partially block the voltage-gated Na+ channels and thereby reduce muscle membrane excitability. Preliminary experiments had shown that the nerve was much more sensitive to TTX than the muscle. Therefore the experiments with TTX were performed using field stimulation in the presence of D-tubocurarine to avoid an influence from the changes in the excitability of the nerve. When 6 × 10⁻⁸ M TTX was applied for 30 min to muscles in standard KR buffer containing D-tubocurarine, the M wave area decreased to 39 ± 15 % and tetanic force decreased to 43 ± 11 % of the field-stimulated control level (n = 4). A single wash with standard KR buffer increased the M wave area and tetanic force to 86 ± 4 % and 85 ± 3 %, respectively, of the field-stimulated control level within 10 min. Figure 5 (bottom right) shows that there was a tight positive correlation between M wave area and tetanic force in the experiments where excitability was decreased by TTX. This relation was closely similar to those obtained when excitability was decreased by 85 Na+/9 K+ buffer with or without D-tubocurarine. The slopes of the three regression lines shown in Fig. 5 (top panels and bottom right panel) did not differ significantly from each other.
Fatigue
To investigate the hypothesis that loss of excitability contributes to muscle fatigue during contractile activity, M waves and tetanic force were recorded from muscles that were stimulated continuously via the nerve at 30 Hz for 120 s in standard KR buffer.
As shown in Fig. 6, there was a 20 % decrease in tetanic force during the first 60 s of the fatiguing stimulation. This initial force decline could not be explained by a decrease in excitability of the sarcolemma, since the M wave area was not significantly decreased at this point. There was even an up to 8 % increase in the M wave area during the first 60 s of the stimulation. The relatively large M wave area was explained by a considerable broadening of the M wave. Thus the width of the M wave at half-maximal amplitude increased from 0.69 ± 0.03 to 1.23 ± 0.07 ms after 60 s and to 1.38 ± 0.17 ms after 120 s of stimulation. At the end of the recovery period the width of the M wave had returned to the control level (0.68 ± 0.03 ms). In the second minute of fatiguing stimulation there was a marked decrease in M wave area (from 0 to 70 % decrease) and tetanic force (from 20 to 70 % decrease). In the initial part of the recovery period tetanic force recovered faster than M wave area. The tetanic force after the 1440 s recovery period reached 85 ± 6 % of the control level, while M wave area attained a mean value of 73 ± 11 % of the control level. In two of the six muscles a particularly low recovery of M wave area after 1440 s was observed (to 36 and 41 % of control level), while their tetanic force at 1440 s was 77 and 60 % of control levels. This suggests that damage to the surface fibres could have occurred during the experiment in these muscles.
Figure 6. M wave area (○) and tetanic force (▾) during a fatigue protocol and recovery.
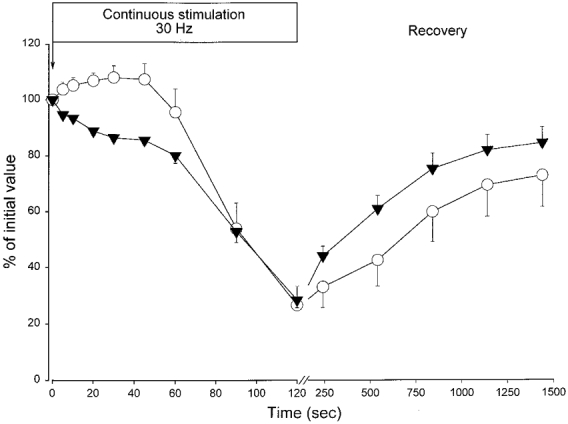
Muscles incubated in standard KR were stimulated continuously at 30 Hz for the first 120 s of the experiment. During recovery short tetani (1.5 s, 30 Hz) were elicited at 240, 540, 840, 1140 and 1440 s after the start of the experiment (means ± s.e.m, n = 6).
From the fatigue experiments (Fig. 6), corresponding data for M wave area and force from the 120 s stimulation period were plotted (Fig. 5, bottom left). Linear regression analysis showed a correlation coefficient of 0.92 (P < 0.001). The slope of the regression line was not significantly different from that of the experiments with 85 Na+/9 K+ buffer with or without tubocurarine (Fig. 5, top panels), but it was marginally lower than in the experiment with TTX shown in Fig. 5 (bottom right) (P < 0.05).
DISCUSSION
The main new findings of this study may be summarized as follows. Firstly, there appears to be a close relationship between muscle excitability (as represented by M wave area) and contractility (as represented by tetanic force). Secondly, activation of the Na+-K+ pump by, for example, salbutamol treatment can reverse the reduction in excitability and contractility evoked by reducing the transmembrane electrochemical gradients for Na+ and K+. It is noteworthy that the recovery of M wave area obtained by stimulating the Na+-K+ pump in muscles exposed to 85 Na+/9 K+ buffer was of a magnitude that was adequate to account for all of the observed force recovery.
Reduced excitability via reductions in Na+/K+ gradients or by addition of TTX
The reduction in M wave amplitude seen in muscles incubated in 9 mM K+ indicates some degree of decrease in excitability. Even though the increase in M wave width allows for some compensation, the M wave area was still about 25 % lower (although not significantly) than that in muscles exposed to 85 mM Na+. This shows that there is a safety factor involved which allows the excitability to decrease to some extent without affecting tetanic force.
Nevertheless, the M wave area and tetanic force after 60 min incubation in either 9 mM K+ or 85 mM Na+ buffers was not significantly different from the values from muscles incubated for the same period of time in standard KR. Therefore, from simple mathematical considerations, 60 min incubation in 85 Na+/9 K+ buffer would not be expected to have a large effect on M wave area or tetanic force. This is in contrast with the large decreases actually observed in both M wave area and tetanic force. It was previously reported that tetanic force was synergistically reduced by such changes in the Na+/K+ gradients (Bouclin et al. 1995; Overgaard et al. 1997a). We have now extended this finding to include M wave area, which strengthens the idea that the synergistic effect on force is caused by a reduction in excitability. Moreover, it underlines the importance of evaluating the effects on excitability of changes in both the Na+ and the K+ gradients simultaneously and not separately, when searching for factors causing muscle fatigue.
Since generation and propagation of action potentials depends on functional Na+ channels it was possible to reduce muscle membrane excitability by adding a submaximal concentration of TTX. The correlation between M wave area and tetanic force in these experiments was very clear and showed no difference to that of muscles depressed by reduced Na+/K+ gradients (Fig. 5, bottom right panel vs. top panels), indicating that the force-depressing effect of lowered Na+/K+ gradients could be attributed to a reduction in excitability as such. Taken together with the data from the fatigue experiment (Fig. 5, bottom left), the results indicate that there is a tight correlation between M wave area and tetanic force in a range of situations where excitability is altered by different means.
Increased excitability via activation of the Na+-K+ pump
Not surprisingly, there was a marked decrease in [Na+]i following activation of the Na+-K+ pump by salbutamol. Two other observations serve to verify that the effects of salbutamol on contractility and excitability were elicited via activation of the Na+-K+ pump. (i) Insulin, another agent known to stimulate the Na+-K+ pump but through a different intracellular pathway, also induced a marked recovery of M wave area and tetanic force in muscles incubated in 85 Na+/9 K+ buffer. (ii) The force recovery seen after addition of salbutamol to muscles incubated in 85 Na+/9 K+ buffer was abolished by addition of 10−3 M ouabain. In the D-tubocurarine-treated muscles the relative effects of reduced Na+/K+ gradients and the salbutamol-induced recovery of M wave area and tetanic force were similar to those of nerve-stimulated muscles. This indicates that the major part of the effects on excitability and contractility reported here arise postsynaptically, i.e. in the muscle fibres themselves.
Activation of the Na+-K+ pump directly improves the reduced chemical gradients for Na+ and K+ via a decrease in [Na+]i and an increase in [K+]i. In addition, activation of the Na+-K+ pump hyperpolarizes the muscle fibres through an increased electrogenic contribution to the resting membrane potential. Both these mechanisms may be involved in the improvement of muscle excitability. In a previous study (Overgaard et al. 1997a) it was shown that hyperpolarization of muscle fibres plays an essential role in force recovery induced by salbutamol or insulin in muscles depressed by exposure to a [Na+]o of 25 mM.
Twitch force and propagation velocity
Twitch potentiation is a well-known feature of muscles exposed to high [K+]o and it can occur even when [K+]o is high enough to reduce tetanic force (Bouclin et al. 1995). A possible explanation for the phenomenon is a decrease in resting membrane potential and a broadening of the action potential, which in frog muscle was shown to give twitch potentiation through an increased duration of the mechanical activation (Taylor et al. 1972). To our knowledge, twitch potentiation has not previously been described in muscles exposed to low [Na+]o. At a [Na+]o of 85 mM the M wave area and M wave amplitude were not significantly different from control values (Fig. 4), but twitch force was increased (Table 1). At present we have no explanation for the paradoxical observation that twitch force increases while the excitability (M wave area) remains constant. Whereas the exposure to either 85 mM Na+ or 9 mM K+ produced an increase in twitch force, the effect of combining 85 mM Na+ and 9 mM K+ was a decrease in twitch force (Table 1).
The decrease in propagation velocity in 85 Na+/9 K+ buffer was not larger than expected from the changes seen in the buffers with 9 mM K+ or 85 mM Na+ alone. The expected propagation velocity in 85 Na+/9 K+ buffer can be calculated by multiplying the relative values (calculated from Table 1) for 9 mM K+ and 85 mM Na+ buffers, respectively: 0.60 × 0.79 = 0.47 = 47 % of control level, which is close to the 44 % reached in 85 Na+/9 K+ buffer. Thus the effects of decreased [Na+]o and increased [K+]o on the propagation velocity can be described as additive, which contrasts with the synergistic effects on M wave area and force described above. The recovery of M wave area and force induced by Na+-K+ pump stimulation is accompanied by a recovery of propagation velocity. This may be interpreted as a consequence of an increased number of active Na+ channels in each action potential. The salbutamol- or insulin-induced recovery of propagation velocity adds to the general picture of a restoration of excitability after Na+-K+ pump stimulation.
Excitability and fatigue
The experiments in which muscles were exposed to 85 Na+/9 K+ buffer were intended to simulate the reductions in the Na+ and K+ gradients that can be expected during intense fatiguing muscle activation. In humans, plasma K+ concentrations of about 8 mM have been measured in the venous effluent from working muscles (Medbø & Sejersted, 1990), and the [K+] of the interstitial space can be expected to be even higher. Thus, Juel (1986) measured a doubling from 5 to 10 mM K+ in the extracellular space of mouse soleus muscles stimulated to fatigue. As for the transmembrane Na+ gradient, there is evidence that [Na+]i may be nearly doubled during stimulation of mouse soleus muscle in vitro (Juel, 1986). A similar reduction in the electrochemical Na+ gradient can be achieved by halving the [Na+]o. The change in [Na+]o used in the present experiments (from 147 to 85 mM) is less than a halving, and thus the reduction in the electrochemical Na+ gradient is within the physiological range. In addition to this, it is possible that the [Na+] may be lowered in the T-tubular lumen. This occurs due to the limited space and the diffusion limitations of the T-tubules, which causes exacerbated changes in T-tubular concentrations of Na+ and K+ compared with other extracellular compartments. Thus, from a model of action potentials in frog fibres it was calculated that a single action potential may cause a rise of 0.28 mM in [K+] and a fall of 0.5 mM in [Na+] in the T-tubules (Adrian & Peachey, 1973). Such changes will markedly affect the excitability of the T-tubular membranes, which is an important consideration since the major part of the contractile force depends on excitatory events in the T-tubules (Davey et al. 1980).
Compared with muscles exposed to 85 Na+/9 K+ buffer the results obtained from muscles exposed to the fatigue protocol were quite similar. The general impression gained from the experiments reported here is that there is a correlation between excitability measured as M wave area and peak tetanic force. This strengthens the hypothesis that loss of excitability caused by reduced Na+ and K+ gradients is a major factor in fatigue induced by high-frequency stimulation.
There is, however, an exception to this picture, namely the initial 30 s of the continuous 30 Hz stimulation to fatigue. In this period there was an 8 % increase in M wave area and a 14 % decrease in the tetanic force (Fig. 6). A similar potentiation of the M wave has been observed previously in vivo both in rat soleus muscles (Hicks & McComas, 1989) and in humans (Cupido et al. 1996) and is thought to occur as a result of increased electrogenic Na+-K+ pump activity. Thus, although the force decline in the initial 30 s of the fatigue protocol cannot be ascribed to a loss of excitability of the sarcolemma, it is possible that during this period some reduction in excitability takes place in the T-tubules caused by the reduction of Na+ and K+ gradients in this compartment (as described above). This would not be detected by surface recordings of M waves. A second possible explanation for the loss of force during the initial 30 s is metabolic factors. Thus, accumulation of, for example, inorganic phosphate could contribute during this phase of fatigue (Westerblad & Allen, 1991).
In conclusion, there is a correlation between M wave area and tetanic force under the different conditions used here. Furthermore, in muscles depressed by lowering the chemical Na+ and K+ gradients to a level within the physiological range, the excitability is improved by stimulation of the Na+-K+ pump, and consequently contractility is restored. Thus, stimulation of an electrogenic pump would delay fatigue development in muscles working at high intensities where Na+ and K+ gradients are expected to decrease.
Acknowledgments
We thank Ann Charlotte Andersen, Tove Lindahl Andersen, Ebba de Neergaard and Marianne Stürup-Johansen for technical assistance, and Dr Adrian Harrison for the development of M wave recording electrodes. This study was supported by grants from The Danish Biomembrane Research Centre and Aarhus Universitets Forskningsfond.
References
- Adrian RH, Peachey LD. Reconstruction of the action potential of frog sartorius muscle. The Journal of Physiology. 1973;235:103–131. doi: 10.1113/jphysiol.1973.sp010380. [DOI] [PMC free article] [PubMed] [Google Scholar]
- Bigland-Ritchie B. EMG and fatigue of human voluntary and stimulated contractions. In: Porter R, Whelan J, editors. Human Muscle Fatigue: Physiological Mechanisms, Ciba Foundation Symposium. Vol. 82. Chichester: Wiley; 1981. pp. 130–156. [DOI] [PubMed] [Google Scholar]
- Bigland-Ritchie B, Jones DA, Woods JJ. Excitation frequency and muscle fatigue: electrical responses during human voluntary and stimulated contractions. Experimental Neurology. 1979;64:414–427. doi: 10.1016/0014-4886(79)90280-2. [DOI] [PubMed] [Google Scholar]
- Bigland-Ritchie B, Woods JJ. Changes in muscle contractile properties and neural control during human muscular fatigue. Muscle and Nerve. 1984;7:691–699. doi: 10.1002/mus.880070902. [DOI] [PubMed] [Google Scholar]
- Bouclin R, Charbonneau E, Renaud JM. Na+ and K+ effect on contractility of frog sartorius muscle: implication for the mechanism of fatigue. American Journal of Physiology. 1995;268:C1528–1536. doi: 10.1152/ajpcell.1995.268.6.C1528. [DOI] [PubMed] [Google Scholar]
- Clausen T, Andersen SL, Flatman JA. Na+-K+ pump stimulation elicits recovery of contractility in K+-paralysed rat muscle. The Journal of Physiology. 1993;472:521–536. doi: 10.1113/jphysiol.1993.sp019960. [DOI] [PMC free article] [PubMed] [Google Scholar]
- Clausen T, Everts ME. K+-induced inhibition of contractile force in rat skeletal muscle: role of active Na+-K+ transport. American Journal of Physiology. 1991;261:C799–807. doi: 10.1152/ajpcell.1991.261.5.C799. [DOI] [PubMed] [Google Scholar]
- Cupido CM, Galea V, McComas AJ. Potentiation and depression of the M wave in human biceps brachii. The Journal of Physiology. 1996;491:541–550. doi: 10.1113/jphysiol.1996.sp021238. [DOI] [PMC free article] [PubMed] [Google Scholar]
- Davey DF, Dulhunty AF, Fatkin D. Glycerol treatment in mammalian skeletal muscle. Journal of Membrane Biology. 1980;53:223–233. doi: 10.1007/BF01868828. [DOI] [PubMed] [Google Scholar]
- Flatman JA, Clausen T. Combined effects of adrenaline and insulin on active electrogenic Na+-K+ transport in rat soleus muscle. Nature. 1979;281:580–581. doi: 10.1038/281580a0. [DOI] [PubMed] [Google Scholar]
- Hennig R, Lömo T. Firing patterns of motor units in normal rats. Nature. 1985;314:164–166. doi: 10.1038/314164a0. [DOI] [PubMed] [Google Scholar]
- Hicks AL, McComas AJ. Increased sodium pump activity following repetitive stimulation of rat soleus muscles. The Journal of Physiology. 1989;414:337–349. doi: 10.1113/jphysiol.1989.sp017691. [DOI] [PMC free article] [PubMed] [Google Scholar]
- Holmberg E, Waldeck B. The effect of insulin on skeletal muscle contractions and its relation to the effect produced by β-adrenoceptor stimulation. Acta Physiologica Scandinavica. 1980;109:225–229. doi: 10.1111/j.1748-1716.1980.tb06590.x. [DOI] [PubMed] [Google Scholar]
- Jones DA. Muscle fatigue due to changes beyond the neuromuscular junction. In: Porter R, Whelan J, editors. Human Muscle Fatigue: Physiological Mechanisms, Ciba Foundation Symposium. Vol. 82. Chichester: Wiley; 1981. pp. 178–196. [DOI] [PubMed] [Google Scholar]
- Juel C. Potassium and sodium shifts during in vitro isometric muscle contraction, and the time course of the ion-gradient recovery. Pflügers Archiv. 1986;406:458–463. doi: 10.1007/BF00583367. [DOI] [PubMed] [Google Scholar]
- Juel C. Muscle action potential propagation velocity changes during activity. Muscle and Nerve. 1988;11:714–719. doi: 10.1002/mus.880110707. [DOI] [PubMed] [Google Scholar]
- Kohn PG, Clausen T. The relationship between the transport of glucose and cations across cell membranes in isolated tissues. VI. The effect of insulin, ouabain, and metabolic inhibitors on the transport of 3-O-methylglucose and glucose in rat soleus muscles. Biochimica et Biophysica Acta. 1971;225:277–290. doi: 10.1016/0005-2736(71)90221-5. [DOI] [PubMed] [Google Scholar]
- Kossler F, Lange F, Caffier G, Kuchler G. External potassium and action potential propagation in rat fast and slow twitch muscles. General Physiology and Biophysics. 1991;10:485–498. [PubMed] [Google Scholar]
- Medbø JI, Sejersted OM. Plasma potassium changes with high intensity exercise. The Journal of Physiology. 1990;421:105–122. doi: 10.1113/jphysiol.1990.sp017935. [DOI] [PMC free article] [PubMed] [Google Scholar]
- Nielsen OB, Overgaard K. Ion gradients and contractility in skeletal muscle: the role of active Na+,K+ transport. Acta Physiologica Scandinavica. 1996;156:247–256. doi: 10.1046/j.1365-201X.1996.204000.x. [DOI] [PubMed] [Google Scholar]
- Overgaard K, Nielsen OB, Clausen T. Effects of reduced electrochemical Na+ gradient on contractility in skeletal muscle: Role of the Na+-K+ pump. Pflügers Archiv. 1997a;434:457–465. doi: 10.1007/s004240050421. [DOI] [PubMed] [Google Scholar]
- Overgaard K, Nielsen OB, Flatman JA, Clausen T. Na+-K+ pump stimulation induces recovery of M-wave and tetanic force in rat soleus muscles at reduced Na+/K+ gradients. The Journal of Physiology. 1997b;504.P:231–232P. [Google Scholar]
- Sjögaard G. Exercise-induced muscle fatigue: the significance of potassium. Acta Physiologica Scandinavica. 1990;593(suppl):1–63. [PubMed] [Google Scholar]
- Sreter FA, Woo G. Cell water, sodium, and potassium in red and white mammalian muscles. American Journal of Physiology. 1963;205:1290–1294. doi: 10.1152/ajplegacy.1963.205.6.1290. [DOI] [PubMed] [Google Scholar]
- Taylor SR, Presier H, Sandow A. Action potential parameters affecting excitation-contraction coupling. Journal of General Physiology. 1972;59:421–436. doi: 10.1085/jgp.59.4.421. [DOI] [PMC free article] [PubMed] [Google Scholar]
- Westerblad H, Allen DG. Changes of myoplasmic calcium concentration during fatigue in single mouse muscle fibers. Journal of General Physiology. 1991;98:615–635. doi: 10.1085/jgp.98.3.615. [DOI] [PMC free article] [PubMed] [Google Scholar]