

Abstract
The ether-à-go-go-related gene (erg)-like K+ current in rat lactotrophs from primary culture was characterized and compared with that in clonal rat pituitary cells (GH3/B6). The class III antiarrhythmic E-4031 known to block specifically erg K+ channels was used to isolate the erg-like current as the E-4031-sensitive current. The experiments were performed in 150 mM K+ external solution using the patch-clamp technique.
The erg-like K+ current elicited with hyperpolarizing pulses negative to -100 mV consisted of a fast and a pronounced slowly deactivating current component. The contribution of the slow component to the total current amplitude was potential dependent and varied from cell to cell. At -100 mV it ranged from 50 to 85 % and at -140 mV from 21 to 45 %.
The potential-dependent channel availability curves determined with 2 s prepulses were fitted with the sum of two Boltzmann functions. The function related to the slowly deactivating component of the erg-like current was shifted by more than 40 mV to more negative membrane potentials compared with that of the fast component.
In contrast to that of native lactotrophs studied under identical conditions, the erg-like K+ current of GH3/B6 cells was characterized by a predominant fast deactivating current component, with similar kinetic and steady-state properties to the fast deactivating current component of native lactotrophs.
Thyrotrophin-releasing hormone reduced the erg-like current in native lactotrophs via an intracellular signal cascade which seemed to involve a pathway independent from protein kinase A and protein kinase C.
RT-PCR studies on cytoplasm from single lactotrophs revealed the presence of mRNA of the rat homologue of the human ether-à-go-go-related gene HERG (r-erg1) as well as mRNA of the two other cloned r-erg cDNAs (r-erg2 and r-erg3) in different combinations. In GH3/B6 cells, only the transcripts of r-erg1 and r-erg2 were found.
In rat lactotrophs from primary culture an inward-rectifying K+ current is present which is characterized by sustained inward currents at membrane potentials more positive than -50 mV and by transient K+ currents at more negative membrane potentials, when measured in high KCl external solution (Corrette et al. 1996). This current is similar to the inward-rectifying K+ current (IK,IR) in clonal rat pituitary cells (GH3/B6 cells; Bauer et al. 1990). However, in contrast to GH3/B6 cells, the time course of current decay of the inward-rectifying K+ current in most native lactotrophs exhibited a considerable slowly deactivating current component at negative membrane potentials. Characteristically, the contribution of this slow inward current component varied from cell to cell. A quantitative analysis of this new property of the inward-rectifying K+ current was not possible because it could not be isolated from the other K+ currents present in these cells (Corrette et al. 1996).
The characteristic gating properties of IK,IR in GH3/B6 cells and its selective block by E-4031 and other class III antiarrhythmics (Weinsberg et al. 1997) indicated that it is mediated by K+ channels expressed by the rat homologue of the human ether-à-go-go-related gene (erg;Sanguinetti et al. 1995; Trudeau et al. 1995). Further experiments provided evidence that the erg-mediated current is indeed a direct correlate of IK,IR in GH3/B6 cells (Bauer et al. 1998). The pharmacological isolation of the inward-rectifying K+ current as the E-4031-sensitive current allowed measurement of this current in 5 mM external K+ and demonstrated that in GH3/B6 cells it provides an outward current with a maximum amplitude near -40 mV. This outward current was inhibited by thyrotrophin-releasing hormone (TRH) and this effect is involved in the TRH-induced depolarization characterizing the second phase of the TRH response in GH3/B6 cells (Bauer, 1998).
The experiments presented here show that the inward-rectifying K+ current of rat lactotrophs from primary culture is also selectively blocked by E-4031 and other substances known to block erg-mediated currents. In contrast to that in other preparations, the E-4031-sensitive current in native lactotrophs exhibits a pronounced slowly deactivating component at negative membrane potentials. This slow current component is a novel property of the erg-like current in rat lactotrophs, which is not present in GH3/B6 cells and has not been observed in other preparations with erg-like currents such as sino-atrial myocytes (Ho et al. 1996), Xenopus oocytes (Bauer et al. 1996) and microglia (Zhou et al. 1998a). It has also not been described in erg-mediated currents after heterologous expression of HERG (Snyders & Chaudhary, 1996; Zhou et al. 1998b) or the rat homologue of HERG (Bauer et al. 1998).
METHODS
Cell culture
Experiments were carried out according to the guidelines laid down by the animal welfare committee of the University Hospital Eppendorf. Primary cultures were prepared from pituitaries of female Wistar rats after 14-18 days of lactation. Rats were killed by stunning without anaesthesia followed by decapitation. Pituitary glands were removed, cut into small pieces and dissociated at 37°C for 30 min. The dispersion medium consisted of Hanks’ balanced salt solution containing 0·1 % bovine serum albumin, 10 mM Hepes and 10 mM glucose, adjusted to pH 7·4 with NaOH. Collagenase Type CLS II, 3 mg ml−1 (Biochrom KG, Berlin, Germany), was added to the dispersion medium just before use. The dispersed cells were sedimented and resuspended in 1 ml Dulbecco's modified Eagle's medium (Gibco/Life Technologies) containing 0·1 % bovine serum albumin. Samples of the suspension (100 μl) were pipetted into the centre of 35 mm plastic culture dishes (Nunc, Wiesbaden, Germany) which had been coated with poly-D-lysine. The dishes were placed in an incubator in a water-saturated atmosphere of 95 % air and 5 % CO2 at 37°C for 1 h. The dishes were then filled with culture medium consisting of Dulbecco's modified Eagle's medium containing 10 % fetal calf serum (Biother, Kelkheim, Germany), 1·8 mM L-glutamine and antibiotics (91 u ml−1 penicillin and 0·09 mg ml−1 streptomycin). The medium was changed every 3-4 days.
GH3/B6 cells were grown as monolayers in Ham's F10 medium supplemented with 15 % horse serum (Boehringer, Ingelheim, Germany) and 2·5 % fetal calf serum (Biother). Cells were maintained at 37°C in a water-saturated atmosphere of 95 % air and 5 % CO2. The medium was changed every 2-3 days and cells were passaged as they reached confluence, usually once a week. For the electrophysiological recordings cells were plated onto 35 mm plastic culture dishes (Nunc).
Electrophysiology
Membrane currents were recorded in the whole-cell configuration (Hamill et al. 1981) or the nystatin-perforated-patch configuration of the patch-clamp technique (Horn & Marty, 1988). An EPC9 patch-clamp amplifier was used in combination with PULSE stimulation and data acquisition software (HEKA Elektronik, Lambrecht, Germany). The patch electrodes were pulled from 1·5 mm diameter borosilicate glass capillaries (Science Products, Hofheim, Germany) and had resistances of 2·5-4 MΩ when filled with intracellular solution. Recordings were made from primary culture cells between 4 and 28 days after dissociation. Data were low-pass filtered at 3 kHz and compensated for both fast and slow capacity transients. Series resistance was compensated by 75-95 %. Current traces are shown without correction for leakage currents. All experiments were performed at room temperature (22-25°C).
Solutions
The high K+, low Ca2+ extracellular recording solution designed to increase the amplitude of the inward-rectifying K+ current and to reduce Ca2+ currents and activation of Ca2+-dependent K+ currents contained (mM): 140 KCl, 4 MgCl2, 1 CaCl2, 2·5 EGTA, 10 Hepes and 10 glucose. The free Ca2+ concentration was estimated to be 75 nM (EQCAL, Biosoft, Cambridge, UK). The pipette solution contained (mM): 140 KCl, 2 MgCl2, 1 CaCl2, 2·5 EGTA and 10 Hepes, and had an estimated free Ca2+ concentration of 66 nM, which is within the range of the resting intracellular free Ca2+ concentration in lactotrophs (Reid et al. 1996). Both solutions were titrated with KOH to pH 7·3, yielding a final K+ concentration of 150 mM. The dependence of the recorded currents on the external K+ concentration was investigated by reducing the K+ concentration in the extracellular solution from the normal 150 mM (isotonic KCl solution) to 40 and 16 mM by replacement of KCl with the appropriate amount of NaCl. Tetrodotoxin (500 nM) was added to the NaCl-containing extracellular solutions to block Na+ channels.
Chemicals
The following substances were generous gifts: E-4031 from Eisai (Tokyo, Japan), dofetilide from Pfizer (Sandwich, UK), sotalol from Bristol-Myers-Squibb (München, Germany), WAY-123,398 from Wyeth-Ayerst (Princeton, USA), MK-499 from Merck, Sharp and Dohme (Haar, Germany), and terfenadine from Mundipharma (Limburg, Germany). Desmethylastemizole, haloperidol and risperidone were purchased from Biotrend (Köln, Germany). Azimilide was a kind gift of Dr A. Busch (Frankfurt/Main, Germany). Stock 10 mM solutions were prepared from all substances. The external solution was changed by superfusion of the cell with the appropriate solution from a 100 μm diameter pipette tip (Microloader, Eppendorf-Netheler-Hinz, Hamburg, Germany) placed about 200 μm from the cell. Superfusion of solutions was driven by a gravity-fed system controlled by an electronic valve.
Phorbol 12-myristate 13-acetate (PMA), forskolin and bisindolylmaleimide I were purchased from Calbiochem (Bad Soden, Germany). All other chemicals were from Sigma.
Immunocytochemistry
After most recordings, the tip of the pipette was manipulated to scratch marks onto the bottom of the plastic culture dish to allow identification of the recorded cell following immunocytochemical staining for prolactin. The recording solution was then replaced with 50 mM Tris-HCl-buffered saline (TBS, pH 7·5); TBS was used as the basic solution for all steps of the staining procedure. The cells were fixed for 5 min in 10 % formaldehyde, washed with TBS and kept at 4°C. For the final staining, the cells were permeabilized with 0·1 % Triton X-100, washed, treated with 1 % hydrogen peroxide and washed again, each step being performed for 5 min at room temperature with agitation. The cells were incubated for 1 h with 8 % normal pig serum and then for 1 h with antibodies against rat prolactin (anti-rPRL-IC-5, provided by NIDDK, Baltimore, MD, USA) used at a final dilution of 1:10 000. Afterwards the cells were washed twice for 5 min. This step was followed by a 30 min incubation with a biotinylated secondary antibody (porcine anti-rabbit F(ab’)2 fragment; DAKO, Hamburg, Germany) at a dilution of 1:500, two washes and a 30 min incubation in the dark with a streptavidin-biotin-horseradish peroxidase complex (DAKO). Immunopositive cells were visualized through addition of a 3,3′-diaminobenzidine (0·7 mg ml−1; Sigma) and hydrogen peroxide (2 mg ml−1) solution.
RT-PCR
RNA was extracted from fresh GH3/B6 cell cultures (Chomczynski & Sacchi, 1987) using RNAzol B (AGS, Heidelberg, Germany). DNase digestion was performed before the preparation of cDNA. Oligo(dT)-primed reverse transcription was carried out on 1 μg of the total RNA using Moloney murine leukaemia virus (M-MLV) reverse transcriptase (GibcoBRL). The cDNA was amplified with 1·25 U of Taq DNA polymerase (Stratagene, Amsterdam, The Netherlands) in buffer containing 50 mM KCl, 10 mM Tris-HCl (pH 8·8), 0·001 % gelatin, 1·5 mM MgCl2 and 0·2 mM of each dNTP in 50 μl reaction assays using 5 pmol of forward and reverse oligonucleotide primers specific for the r-erg cDNAs (see below). For PCR amplification, a predenaturation step at 94°C for 1 min was followed by 40 temperature cycles consisting of three temperature steps, each of 1 min duration (1st step: 94°C; 2nd step different for each primer pair: 53°C (r-erg1), 55°C (r-erg2) or 59°C (r-erg3); 3rd step: 72°C), and the reaction was terminated by an elongation step at 72°C for 5 min. Amplified DNA fragments were analysed by agarose gel electrophoresis and sequenced.
Single-cell RT-PCR
After harvesting the cytoplasm of single lactotrophs, RT-PCR was performed as described by Monyer & Jonas (1995). Reverse transcription was carried out in a volume of 10 μl, and the whole volume of the reverse transcription mix was subsequently used in a multiplex PCR reaction. Negative controls were prepared in the same way without reverse transcriptase. PCR amplification was carried out as described above. For the amplification we used the following forward and reverse primer pairs. r-erg1 (GenBank accession no. Z96106): 5′-TGGTCTAGCCTGGAGATCA-3′ and 5′-AGGGGACGTGGAAGTGG-3′, first amplification; 5′-AACATGATTCCTGGCTCCC-3′ and 5′-GGGTTTCCAGCCTGTTCAG-3′, second amplification. r-erg2 (accession no. AF016192): 5′-TCTCCAGTCAACACCCCGAC-3′ and 5′-CTCTGGAACTCTAGCTGCTT-3′, first amplification; 5′-CCCCAGGCCACCAAGACCCC-3′ and 5′-AACTGAGCTGAGGTGTTCAG-3′, second amplification. r-erg3 (accession no. AF016191) 5′-TTCAATCATATGAAGTCAAGCC-3′ and 5′-AGAGAGCCAATCAACATGACA-3′, first amplification; 5′-ATCCCGCAACTCACTCTGAAC-3′ and 5′-GAAGGTAAAGTAAAGTGCCGTGAC-3′, second amplification.
For the first multiplex PCR amplification a predenaturation step at 94°C for 1 min was followed by 40 cycles consisting of three 1 min temperature steps (94°C, 45°C and 72°C) terminated by an elongation step at 72°C for 5 min. In the second amplification the same cycle protocol was used with different annealing temperatures for the individual nested primer pairs: r-erg1, 53°C; r-erg2, 55°C; and r-erg3, 59°C. Amplified DNA fragments were analysed by agarose gel electrophoresis and sequenced.
RESULTS
General description
K+ currents were recorded in rat lactotrophs from primary culture using high K+ external solution. The K+ currents shown in Fig. 1A were elicited with potential steps to membrane potentials between 40 and -120 mV from a holding potential of -40 mV, and exhibited the same cell-to-cell variability in the time course of current decay as previously reported for the same preparation (Corrette et al. 1996). Three different cells (a, b and c) were chosen to demonstrate this variability in the inward current decay. After application of 10 μM E-4031, a concentration that rapidly and totally blocked the erg-like current in GH3/B6 cells (Weinsberg et al. 1997), the current at the holding potential was reduced and the sustained and transient inward currents were blocked to a large extent (Fig. 1B). Upon hyperpolarization to potentials between -60 and -120 mV from the holding potential of -40 mV, tail currents were elicited which deactivated to small amplitudes. Subtraction of the E-4031-insensitive currents (Fig. 1B a-c) from the control currents (Fig. 1Aa-c) yielded the E-4031-sensitive currents (Fig. 1C a-c). The three sets of membrane currents of Fig. 1C showed sustained inward currents at membrane potentials between -60 and 0 mV. In the cell exhibiting the fastest current decay (Fig. 1C c), transient inward currents occurred at membrane potentials more negative than -60 mV. In this cell, the current recorded at -120 mV decayed to small values within the 1·5 s pulse duration, whereas in the cell of Fig. 1C a the current decay was very slow and clearly visible only at potentials negative to -100 mV. The current-potential curves of the peak currents and currents determined at the end of the 1·5 s pulses demonstrate the pronounced inward rectification of the E-4031-sensitive current (Fig. 1D). These initial experiments showed that the inward-rectifying K+ current in native lactotrophs could be isolated as the E-4031-sensitive current and it was assumed to be an erg-like current.
Figure 1. E-4031 blocks the inward-rectifying K+ current in lactotrophs from primary culture.
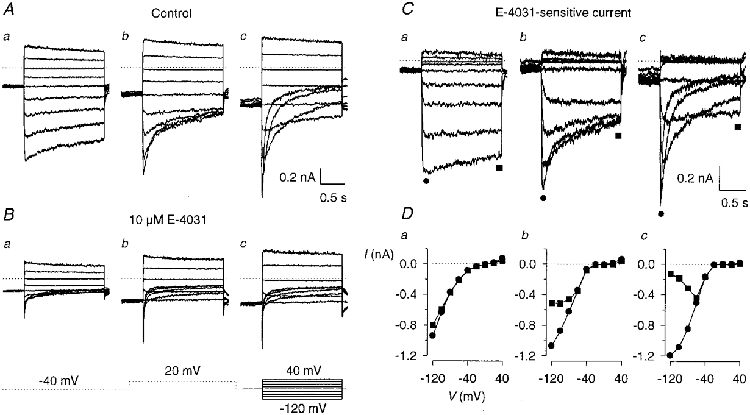
Membrane currents of three different lactotrophs (a-c) were recorded in 150 mM K+ external solution with the pulse protocol shown below the membrane currents in B. From a holding potential of -40 mV, the membrane potential was changed to between 40 and -120 mV in steps of 20 mV. Pulse duration, 1·5 s. To ‘fully activate’ erg channels, a 2 s prepulse to 20 mV was introduced and separated by a 0·5 s gap from the test pulse. This gap was used to avoid the registration of K+ tail currents mediated by K+ channels different from erg channels. Dotted lines in the current recordings denote zero current. A, control membrane currents selected for their different deactivation kinetics. B, membrane currents recorded in the same cells as in A in the presence of 10 μM E-4031. C, the E-4031-sensitive current, obtained by subtraction of the corresponding membrane current traces shown in B from those in A. D, current- potential relationship of the E-4031-sensitive currents shown in C. Peak current amplitudes (•) and current amplitudes at the end of the 1·5 s test pulses (▪) were plotted versus test pulse potential. Symbols are connected by straight lines.
Experiments performed in GH3/B6 cells using the same pulse protocol and pharmacological isolation of the E-4031-sensitive current as in native lactotrophs showed that at membrane potentials negative to -100 mV the time course of the deactivating E-4031-sensitive current was predominantly characterized by fast decay kinetics similar to those recorded previously (Weinsberg et al. 1997; Bauer et al. 1998).
The E-4031-insensitive, non-inactivating K+ current
The current remaining in the presence of E-4031 was measured in 150 mM external K+ with depolarizing potential steps of 14 s duration from a holding potential of -90 mV (Fig. 2A-C). A slowly activating inward current was elicited by depolarizing pulses to potentials between -70 and -40 mV, reaching a steady state after several seconds (Fig. 2Aa). Depolarization to potentials between -30 and -10 mV (Fig. 2Ab) activated unidentified K+ currents, but the currents at the end of the 14 s test pulses were regarded as representing a non-inactivating K+ current. The current-potential relationship of this current showed that it activated near -70 mV and exhibited a maximum inward current near -40 mV (Fig. 2B). Plotting the normalized conductance as determined from the steady-state currents measured at the end of the 14 s pulses against test pulse potential yielded the activation curve. The potential dependence and slope of the curve fitting the mean results from six cells were almost identical to the potential dependence and slope of the activation curve determined from the tail current amplitudes (Fig. 2C). This close similarity indicates that the maximal tail current amplitudes (Fig. 2A) represent instantaneous currents which do not contain a current component due to recovery from inactivation of erg-like channels. The time course of the tail current of the non-inactivating K+ current elicited by repolarization to -90 mV from a test pulse potential of -10 mV was best fitted with two time constants (30·2 ± 3·9 and 593·5 ± 83·1 ms; means ±s.e.m., n= 6).
Figure 2. Characteristics of the non-inactivating, E-4031-insensitive K+ current in rat lactotrophs.
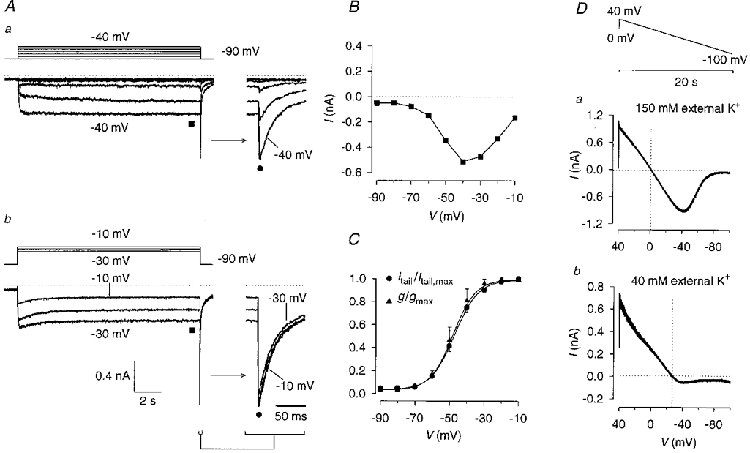
Aa and b, membrane currents were recorded in the presence of 10 μM E-4031 from a holding potential of -90 mV with 14 s depolarizing test pulses to membrane potentials between -80 and -10 mV in steps of 10 mV. B, steady-state inward currents shown in A (▪) plotted versus membrane potential. C, activation curves. Tail current amplitudes recorded upon repolarization to -90 mV (Aa and b) were normalized to the maximal tail current amplitude and plotted versus prepulse potential (•). Mean values were fitted with a Boltzmann function (V½= -47·0 mV, slope factor k= 6·8 mV). In addition, the conductance was calculated from the steady-state current amplitudes shown in B with the potassium equilibrium potential EK= 0 mV, normalized to the maximal conductance and plotted versus test pulse potential (▴; V½= -47·9 mV, k= 6·5 mV). Error bars denote s.e.m. (n= 6). D, determination of the reversal potential of the non-inactivating K+ current measured in 150 mM (a) and 40 mM (b) K+ external solution in the presence of 10 μM E-4031. Current recordings from two different cells. The pulse protocol consisted of a 20 s voltage ramp from 40 to -100 mV. Holding potential, 0 mV. Reversal potentials are indicated by vertical dotted lines.
To investigate the effect of thyrotrophin-releasing hormone (TRH) on the non-inactivating K+ current, membrane currents were recorded using the perforated-patch configuration with 14 s test pulses to -30 mV from a holding potential of -70 mV in the presence of E-4031. Application of 1 μM TRH neither reduced the steady-state current at the end of the test pulse nor reduced the amplitude of the tail current elicited upon repolarization to the holding potential (n= 4, data not shown).
The E-4031-insensitive, non-inactivating current was selective for K+ over Na+ as determined by measuring the reversal potential in different external K+ concentrations. Using a 20 s voltage ramp pulse from 40 to -100 mV (Fig. 2D), the reversal potential (Vrev) in 40 mM external K+ was determined to be -29·3 ± 1·8 mV (mean ±s.d., n= 7; corrected for a liquid junction potential of 2·8 mV). This reversal potential was close to the calculated Nernst potential of -33·3 mV. In 150 mM external K+, Vrev was 0·4 ± 1·1 mV (n= 7).
Although the non-inactivating K+ current was totally blocked by 10 mM Cs+ (data not shown), a similar Cs+ concentration also blocked the inward-rectifying K+ current (Bauer et al. 1990), and therefore Cs+ could not be used to isolate the inward-rectifying K+ current in lactotrophs as has been described for the erg-like current in neuroblastoma cells (Faravelli et al. 1996).
The erg-like K+ current is mediated by ionic channels selective for K+ over Na+
To determine the K+ selectivity of the E-4031-sensitive current, the reversal potential (Vrev) was measured in three different external K+ concentrations. The holding potential was -20 mV to ‘fully activate’ the erg channels (Shibasaki, 1987; Wang et al. 1997). The pulse protocol consisted of a voltage-ramp pulse preceded by a 10 ms pulse to -120 mV to allow the capacity transient to settle and most of the erg-like channels to recover from inactivation before the start of the ramp pulse. During the subsequent voltage ramp the membrane potential was changed from -120 to 40 mV within 70 ms (Fig. 3). The ramp potential changed fast enough to avoid significant current decrease due to deactivation. The E-4031-sensitive currents of Fig. 3A and B were obtained by subtraction of the membrane currents recorded after application of 10 μM E-4031 from the control currents. After correction for the liquid junction potential the measured reversal potentials were close to the potassium equilibrium potential (EK) values calculated from the Nernst equation, indicating that the E-4031-sensitive current is mainly carried by K+ (Fig. 3C).
Figure 3. The channels mediating the E-4031-sensitive current are selective for K+ over Na+.
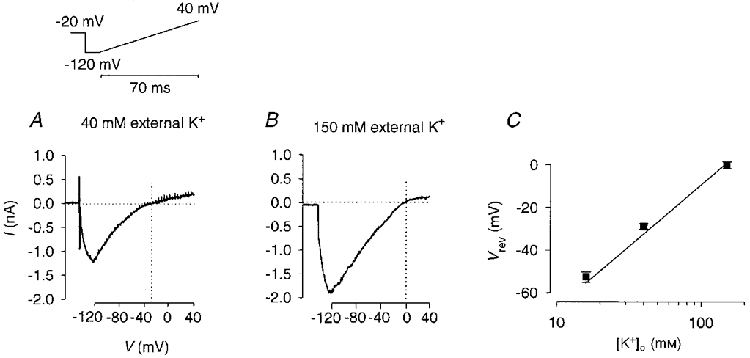
Measurement of the reversal potential of the E-4031-sensitive current in 40 mM (A) and 150 mM (B) K+ external solution. The pulse protocol consisted of a 10 ms pulse to -120 mV followed by a 70 ms voltage ramp to 40 mV. Holding potential, -20 mV. The E-4031-sensitive current was obtained from the difference between the membrane currents recorded before and after application of 10 μM E-4031. C, reversal potentials measured in 16, 40 and 150 mM K+ external solution were corrected for the liquid junction potential and plotted versus external K+ concentration (means ±s.d., 3-4 experiments for each concentration). The straight line was calculated from the Nernst equation with a steepness of 58 mV for a 10-fold change in the external K+ concentration.
Gating kinetics of the erg-like K+ current
The voltage-dependent properties of the E-4031-sensitive current shown in Fig. 1C are reminiscent of HERG-mediated currents (Sanguinetti et al. 1995; Trudeau et al. 1995). Characteristically, in high K+ external solution the outward current amplitude of HERG- or erg-mediated currents is small upon a strong depolarization, whereas upon a subsequent hyperpolarization large transient inward currents are elicited (Bauer et al. 1998). This characteristic inward rectification has been explained as a consequence of the peculiar gating kinetics of erg channels. The small outward current upon depolarization is due to erg K+ channels which inactivate much faster than they activate. The transient inward current elicited by a hyperpolarizing pulse following a strong depolarization is due to fast recovery from inactivation and subsequent slow deactivation (Shibasaki, 1987; Wang et al. 1997).
To determine the gating kinetics of the E-4031-sensitive current in lactotrophs from primary culture and, for comparison, in GH3/B6 cells, the current increase in response to a hyperpolarizing pulse was fitted with a single exponential function yielding potential-dependent time constants of similar magnitude in the two cell types (Fig. 4A). To obtain a satisfactory fit of current decay in the potential range negative to -100 mV, two exponential functions were necessary in native lactotrophs, whereas in most GH3/B6 cells one exponential function was sufficient. In native lactotrophs, the two current components could clearly be separated at membrane potentials more negative than -100 mV. In some GH3/B6 cells, a small slowly deactivating component of the E-4031-sensitive current was visible. This slow component could not exactly be attributed to the erg-like current due to changes in the amplitude of the Ih current, a hyperpolarization-activated K+ current (Simasko & Sankaranarayanan, 1997). The fast deactivating component of the E-4031-sensitive current of lactotrophs in primary culture could be described with almost the same potential-dependent time constants as the deactivation in GH3/B6 cells (Fig. 4B). The time constants of the slowly deactivating current component exhibited a less steep potential dependence and had values about 10 times larger than the time constants of the fast deactivating component in the potential range investigated (Fig. 4B). In contrast to the time constants, the relative amplitudes of the two deactivating current components varied considerably from cell to cell at a given potential. However, in a particular lactotroph the contribution of the fast deactivating component increased with more negative membrane potentials. In 11 lactotrophs, the contribution of the fast component varied between 15 and 50 % at -100 mV and increased to values between 26 and 70 % at -120 mV and 55 and 79 % at -140 mV.
Figure 4. Time constants of recovery from inactivation and of deactivation of the erg-like K+ current in native lactotrophs and GH3/B6 cells.
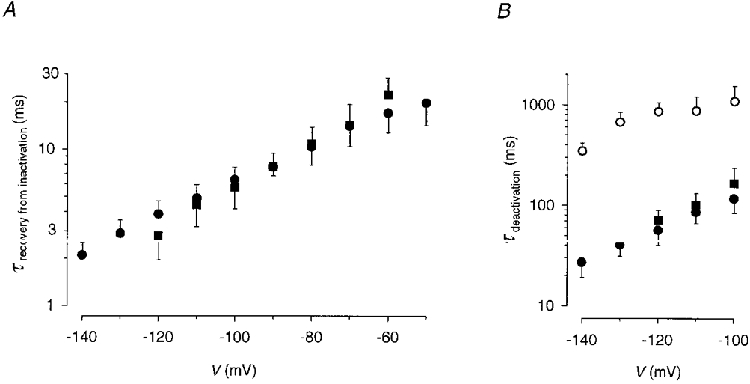
A, recovery from inactivation of the E-4031-sensitive current in lactotrophs from primary culture (n= 11; •) and GH3/B6 cells (n= 8; ▪) was fitted with a single exponential function. B, deactivation of the E-4031-sensitive current in native lactotrophs (n= 11) was fitted with the sum of two exponential functions (τfast, •; τslow, ○). In GH3/B6 cells (n= 7; ▪) a single exponential function was used. Time constants are given as means ±s.d.
To measure the potential dependence of erg channel availability, a constant test pulse to -120 mV was applied preceded by pulses of 2 s duration to membrane potentials between 0 and -140 mV from a holding potential of -20 mV. If the hyperpolarizing test pulse was preceded by a strong depolarization, a large transient current was elicited because all inactivated channels entered the open state due to fast recovery from inactivation. With more negative prepulses, the number of channels available to proceed into the open state decreased because more channels were deactivated at the end of the prepulse (Wang et al. 1997). Membrane currents were recorded before and after application of 10 μM E-4031. The E-4031-sensitive currents elicited with a constant test pulse were normalized to the current with the maximal amplitude and plotted versus prepulse potential. Membrane currents of two cells with either predominantly slow or predominantly fast deactivation kinetics are shown in Fig. 5A and B. The data points of the normalized peak inward currents during the test pulse plotted against prepulse potential were best fitted with the sum of two Boltzmann functions. The parameters of the fits performed in experiments on 11 lactotrophs are summarized in Table 1. The main result was that all Boltzmann functions relating to the fast deactivating current component had a V½ of about -74 mV and the Boltzmann functions relating to the slowly deactivating current component had a V½ that was shifted by more than 40 mV to more negative membrane potentials (-117 mV). As can be seen from the data in Table 1, the large variability in the potential-dependent channel availability curves, as exemplified by the two curves in Fig. 5C, can be explained by the variability in the relative amplitudes of the two Boltzmann functions. The relative contribution of the slowly deactivating component ranged from 17 to 76 %. There was a statistically significant correlation between the relative amplitude of the fast deactivating component of the erg-like current elicited with a 2 s pulse to -120 mV and the amplitude of the corresponding Boltzmann function (parameter f in Table 1; r= 0·83, P < 0·001).
Figure 5. Potential-dependent availability of the erg-like K+ current.
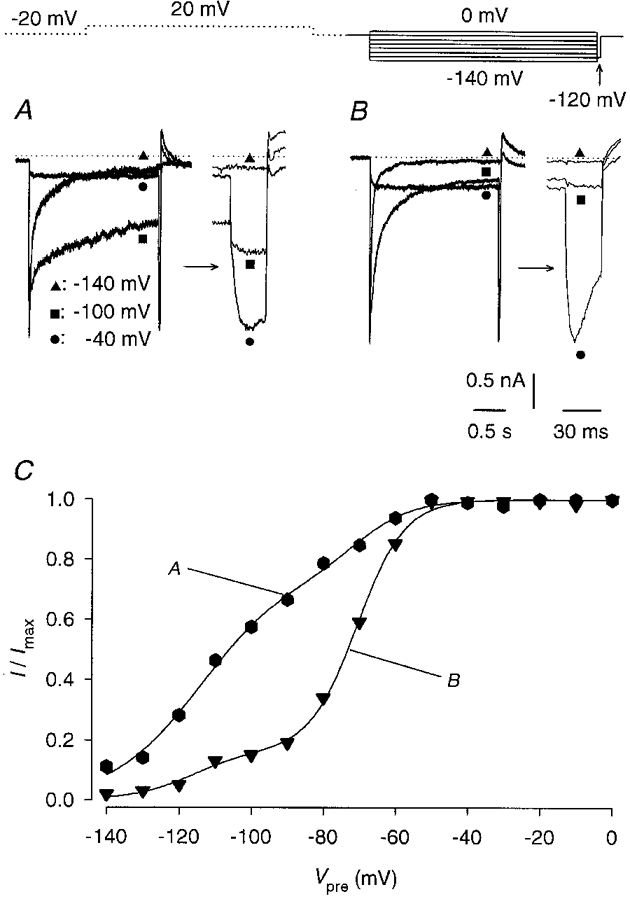
Membrane currents were recorded with a constant 30 ms test pulse to -120 mV preceded by 2 s pulses to membrane potentials between 0 and -140 mV in steps of 10 mV before and after application of 10 μM E-4031. A 2 s pulse to 20 mV preceded the differing prepulses to reduce the time interval necessary for measuring maximal inward currents. This pulse was separated by 0·5 s from the prepulses. The interval between the -120 mV test pulses was 20 s; the holding potential was -20 mV. Two experiments were selected where the E-4031-sensitive current exhibited a predominantly slow (A) or fast (B) time course of deactivation. Three current traces elicited with potential steps to -40, -100 and -140 mV are given. Membrane currents elicited by the hyperpolarizing test pulse are shown separately on an expanded time scale. C, potential-dependent availability curves from the experiments shown in A and B. Peak inward currents recorded during the test pulses were normalized to the maximum current (I/Imax) and plotted versus prepulse potential. Data points were fitted with the sum of two Boltzmann functions. The curves indicated by A and B represent experiments 1 and 11 given in Table 1.
Table 1.
Potential dependence of erg availability
| Experiment | f | s | kf(mV) | ks(mV) | V1/2,f(mV) | V1/2,s(mV) |
|---|---|---|---|---|---|---|
| 1 | 0.24 | 0.76 | 7.7 | 12.4 | −70.3 | −114.1 |
| 2 | 0.36 | 0.64 | 4.1 | 12.7 | −71.5 | −109.8 |
| 3 | 0.40 | 0.60 | 8.7 | 9.7 | −78.3 | −117.8 |
| 4 | 0.50 | 0.50 | 9.8 | 7.8 | −60.2 | −114.6 |
| 5 | 0.54 | 0.46 | 8.6 | 12.7 | −74.9 | −113.7 |
| 6 | 0.62 | 0.38 | 9.8 | 6.1 | −85.4 | −123.2 |
| 7 | 0.65 | 0.35 | 7.0 | 10.1 | −78.2 | −111.8 |
| 8 | 0.71 | 0.29 | 6.0 | 5.5 | −74.8 | −121.7 |
| 9 | 0.73 | 0.27 | 8.5 | 10.6 | −71.4 | −125.5 |
| 10 | 0.81 | 0.19 | 8.4 | 5.6 | −74.7 | −121.2 |
| 11 | 0.83 | 0.17 | 6.6 | 8.2 | −70.6 | −116.3 |
| Mean ±s.e.m. | 7.7 ± 0.5 | 9.2 ± 0.8 | −73.7 ± 1.9 | −117.2 ± 1.5 |
The potential dependence of erg-like channel availability was tested with a constant pulse to −120 mV preceded by 2 s prepulses to membrane potentials between 0 and −140 mV. The peak current amplitudes recorded with the test pulse were normalized, plotted against prepulse potential and fitted with the sum of two Boltzmann functions: f/(1 + exp(−(V−V1/2,f)/kf)) +s/(1 + exp(−(V−V1/2,s)/ks)). Abbreviations: f and s, relative amplitude of the fast and slow current component, respectively; kf and ks, slope factor of the Boltzmann function related to the fast and slow current component; V1/2,f and V1/2,s, prepulse potential at which 50% of the fast or slow current component is deactivated. Same experiments as those of Fig. 4.
The channel availability curves were determined using prepulses of 2 s duration. It is clear that this prepulse duration is too short to measure the true voltage dependence of the availability curve reflecting the steady-state activation especially of the slowly deactivating current component. The difference in the potential dependence of the availability curves for the fast and slowly deactivating current components might decrease with increasing prepulse duration. However, the pulse protocol used in these experiments allowed the recording of reproducible currents (see below) and the measurement of isochronal availability curves which clearly reflect the difference in the deactivation kinetics.
Availability curves measured in GH3/B6 cells under identical conditions to those for native lactotrophs could satisfactorily be fitted with a single Boltzmann function (V½, -72·2 ± 1·5 mV; steepness, 10·4 ± 0·8 mV; means ±s.e.m., n= 7). These data are similar to those of the Boltzmann function describing the curve relating to the fast deactivating current component determined in native lactotrophs (Table 1). These results also agree very well with the parameters of the Boltzmann function fitting the availability curve of the r-erg1-mediated current in Chinese hamster ovary (CHO) cells measured in isotonic KCl (V½= -74 mV; Bauer et al. 1998).
The two deactivating components of the erg-like K+ current interconvert
In another set of experiments the effects of long-lasting hyperpolarizing pulses needed to completely deactivate the erg-like current were studied. Fig. 6A demonstrates that the kinetics of current decay changed upon repetition of hyperpolarizing pulses. In the presence of E-4031, tail currents due to deactivation of the non-inactivating, E-4031-insensitive current were recorded. The deactivation kinetics of these tail currents did not change significantly (see insets of Fig. 6B). Isolation of the erg-like current revealed that after induction of almost complete current deactivation with a -120 mV pulse of 10 s duration, the E-4031-sensitive currents elicited with a second and third hyperpolarizing pulse were almost devoid of the slow component (Fig. 6C a). However, the slow component reappeared approaching its previous amplitude after a depolarizing pulse to 0 mV for 10 min (Fig. 6C b). Experiments using shorter depolarizations yielded a less complete restoration of the slow component. Three other experiments performed with the perforated-patch configuration as well as four experiments performed with the whole-cell configuration had the same result. The E-4031-sensitive currents shown in Fig. 6C also demonstrate that the amplitude of the fast current component was increased and that of the slow component was decreased in the currents elicited with the second and third pulse. In spite of these changes the peak amplitude of the sum of the two components remained almost constant. The value for the time constant of the fast component did not change considerably irrespective of the presence of the slow component. In all experiments the amplitude of the slow component which reappeared after the 10 min depolarization to 0 mV never exceeded the amplitude of the slow component elicited with the first pulse.
Figure 6. Potential-dependent disappearance and reappearance of the slowly deactivating erg-like K+ current component.
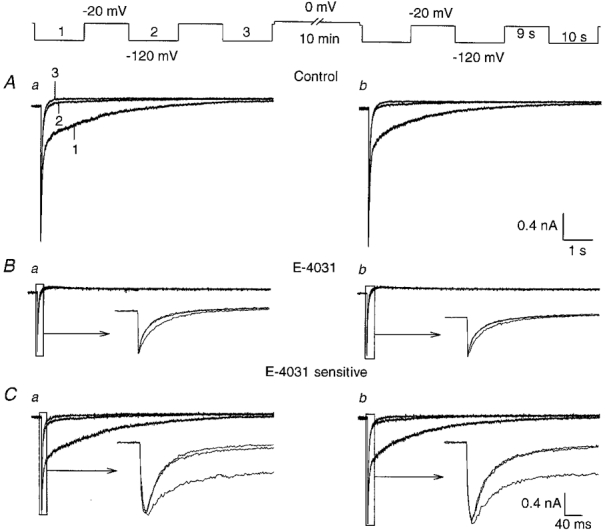
Membrane currents recorded in 150 mM K+ external solution with the nystatin-perforated-patch configuration. The complete pulse protocol is shown above the traces. From a holding potential of -20 mV, three 10 s hyperpolarizing pulses to -120 mV were applied with an interpulse interval of 9 s. The same pulse sequence was repeated after a 10 min depolarization to 0 mV. Aa and b, control currents. Ba and b, membrane currents recorded with the same pulse protocol as in A in the presence of 10 μM E-4031. The tail currents are due to deactivation of the non-inactivating, E-4031-insensitive K+ current. Ca and b, E-4031-sensitive currents obtained by subtracting the corresponding current traces shown in B from those in A.
Pharmacology of the erg-like K+ current
To measure the relationship between the concentration of E-4031 and the amount of erg-like current reduction, a constant 1·5 s test pulse to -120 mV from a holding potential of -20 mV was applied every 20 s. To test more than one concentration of E-4031 in a particular cell, the drug concentration was increased after every 9th test pulse. With this protocol up to five different concentrations of E-4031 were measured in a single cell (Fig. 7A). The concentration-dependent block was evaluated from the current elicited immediately before application of a new drug concentration. Although the application time of 180 s was too short to achieve a real steady-state block at low E-4031 concentrations (Weinsberg et al. 1997), we used this procedure because the experiments were aimed at finding differences between the two components of the E-4031-sensitive current. Only after application of 10 μM E-4031 was the inward-rectifying K+ current totally blocked as judged by the disappearance of the small inward current hook remaining at lower E-4031 concentrations. Subtraction of the appropriate currents yielded the various unblocked erg-like currents (see Fig. 7Cc). Their time course of deactivation was fitted with the sum of two exponential equations yielding the characteristic time constants for the fast and slow current component, which turned out to be independent of the E-4031 concentration. The amplitude of each exponential function was normalized to the maximal values derived from the 10 μM E-4031-sensitive current, plotted against the E-4031 concentration and fitted to Hill functions (Fig. 7B). The Hill coefficients of the dose-response curves were not significantly different from 1, and therefore they were set equal to 1 assuming a 1:1 drug:channel reaction. The fast component was blocked with a KD of 7·1 nM and the slow component with a KD of 25·1 nM. This slightly different sensitivity of the two current components to E-4031 was not statistically significant (P= 0·095, Mann-Whitney U test). The KD value of the fast component is almost identical to the KD (10 nM) previously obtained in GH3/B6 cells (Weinsberg et al. 1997). The dose-response curves showed the largest difference near 10 nM E-4031 (Fig. 7B). Accordingly, the 10 nM E-4031-sensitive current consisted predominantly of the fast current component (Fig. 7C b). Subtraction of the membrane current shown in Fig. 7C b from that in Fig. 7C a therefore yielded the current predominantly representing the slow component (Fig. 7C c).
Figure 7. Dose-response relationship between E-4031 and the two current components of the erg-like K+ current.
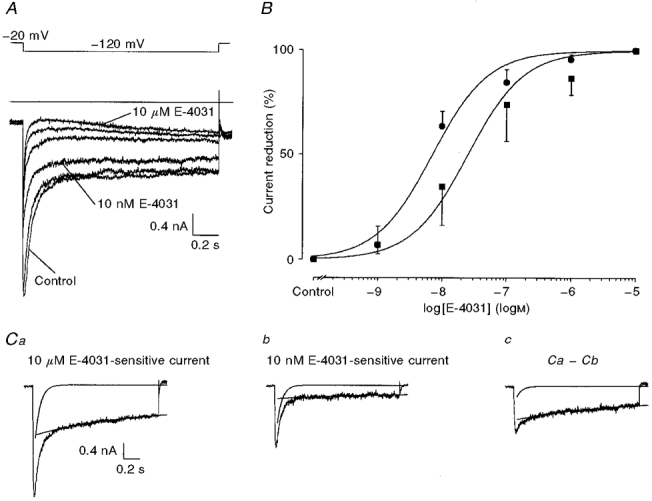
A, membrane currents elicited in 150 mM K+ external solution with a 1·5 s potential step to -120 mV from a holding potential of -20 mV. The test pulse was preceded by a 2 s pulse to 20 mV separated by a gap of 0·5 s. Test pulses were applied every 20 s and the E-4031 concentration was increased after every 9th test pulse. Membrane currents recorded in the presence of different E-4031 concentrations are superimposed. B, dose-response curve for E-4031. Membrane currents recorded in the presence of 10 μM E-4031 were subtracted from the last membrane currents recorded before increasing the E-4031 concentration. The deactivation of the resulting currents was fitted with the sum of two exponential functions. The amplitudes of the fast and slow components were related to the 10 μM E-4031-sensitive current; the drug-induced mean current reduction ±s.d. was plotted versus E-4031 concentration and fitted with the Hill function. The resulting KD values were 7·1 nM for the fast component (•) and 25·1 nM for the slow component (▪). Ca, 10 μM E-4031-sensitive current obtained by subtraction of the current recorded in the presence of 10 μM E-4031 from the control current. Cb, current sensitive to 10 nM E-4031 obtained by subtraction of the current recorded in the presence of 10 nM E-4031 from the control current. Cc, current obtained by subtraction of the current trace shown in Cb from that in Ca. The decay of all currents was fitted with the sum of two exponentials. The two exponential functions are plotted separately.
HERG currents and erg-like currents are not only blocked by class III antiarrhythmics (Snyders & Chaudhary, 1996; Spector et al. 1996) but also by neuroleptics (Suessbrich et al. 1997) and histamine receptor antagonists (Suessbrich et al. 1996). Different class III antiarrhythmics as well as neuroleptics and histamine receptor antagonists were tested to investigate their effects on the two components of the erg-like current (Table 2). Except for sotalol, which was almost ineffective, all substances induced a block of both components of the E-4031-sensitive current. The drug-induced current reductions were related to the maximal block induced by 10 μM E-4031. Table 2 shows that dofetilide and WAY-123,398 were as effective as E-4031; the other drugs tested were only slightly less effective.
Table 2.
Effect of class III antiarrhythmics, neuroleptics and histamine receptor antagonists on the erg-like current in rat lactotrophs
| Substance | Concentration(μM) | Percentage of full block(mean ± s.d.) | n |
|---|---|---|---|
| Class III antiarrhythmics | |||
| Dofetilide | 10 | 100 | 3 |
| Sotalol | 100 | 9 ± 4.2 | 2 |
| WAY-123,398 | 10 | 100 | 2 |
| MK-499 | 20 | 82 ± 8.5 | 4 |
| Azimilide | 30 | 71 ± 15.4 | 6 |
| Neuroleptics | |||
| Haloperidol | 30 | 85 ± 7.2 | 7 |
| Risperidone | 30 | 92.8 ± 2.7 | 4 |
| Histamine receptor antagonists | |||
| Terfenadine | 20 | 93.9 ± 1.9 | 3 |
| Desmethylastemizole | 30 | 89.8 ± 11.1 | 3 |
The reduction of the erg-like current was measured with a 1.5 s test pulse to −120 mV from a holding potential of −40 mV in 150 mM K+ external solution. The drug under investigation was applied at a supramaximal concentration. The block achieved was related to the complete block of the erg-like current obtained by subsequent application of 10 μM E-4031.
TRH inhibits both components of the erg-like K+ current
It has previously been shown that the inward-rectifying K+ current of native rat lactotrophs was inhibited by TRH in about 50 % of the cells investigated (Corrette et al. 1996). In the present study 18 out of 25 cells (i.e. 72 %) responded to TRH with a reduction of the erg-like current in whole-cell experiments. When the experiments were performed in the perforated-patch configuration, the erg-like current was reduced by TRH in all cells tested.
Membrane currents were measured with a 1·5 s test pulse to -120 mV from a holding potential of -20 mV to study the effect of TRH on the two components of the erg-like current (Fig. 8). TRH (1 μM) reduced the erg-like current by 61 ± 17 % (mean ±s.d., n= 7) and after additional application of E-4031 (10 μM) a total block was achieved. To compare the TRH-sensitive current and the total erg-like current (current blocked by TRH + E-4031; Fig. 8B), the time course of deactivation of both currents was fitted with the sum of two exponential functions. The time constants of the fast and slow components of the TRH-sensitive current (τfast= 57·8 ± 28·3 ms, τslow= 655 ± 134 ms; means ±s.d., n= 7) were similar to those of the total erg-like current measured in the same cells (τfast= 57·3 ± 15·1 ms, τslow= 648 ± 154 ms) indicating that TRH affected both components without considerably changing the time course of deactivation. The TRH-induced reduction of the fast component of the totally blocked current varied between 37 and 88 %, and that of the slow component between 45 and 98 %.
Figure 8. Effects of TRH on the erg-like K+ current.
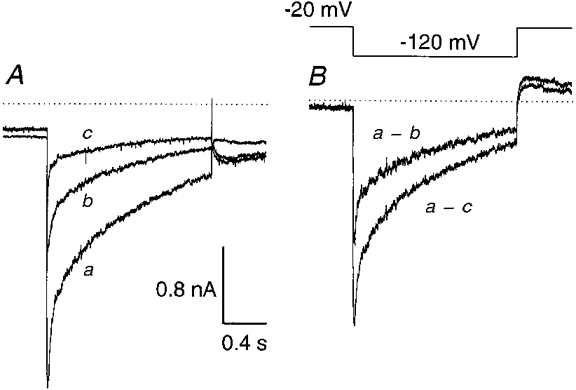
A, superimposed membrane currents elicited with 1·5 s potential steps to -120 mV from a holding potential of -20 mV (pulse interval, 20 s) in 150 mM K+ external solution: control current (a), current about 4 min after continuous application of 1 μM TRH (b) and current after application of 10 μM E-4031 in the continued presence of TRH (c). Recordings were made in the same cell in the whole-cell configuration. B, the current denoted a - c was obtained after subtraction of the current recorded in the presence of E-4031 + TRH (c) from the control current (a), and the TRH-sensitive current (a - b) was obtained after subtraction of the current recorded in the presence of TRH (b) from the control current (a).
Effects of activators of protein kinase A and C and TRH on the erg-like K+ current
Experiments were performed with the perforated-patch configuration to study the signal cascade underlying the TRH-induced reduction of the erg-like current. The effects of substances known to activate protein kinase A (PKA) and protein kinase C (PKC) on the erg-like current were investigated with a constant -120 mV test pulse of 40 ms duration applied from a holding potential of -20 mV every 15 s. Current reduction was expressed as a percentage of the total erg-like current. Figure 9A shows that TRH and subsequent application of a phorbol ester (PMA) induced a reduction of the erg-like current. To investigate whether TRH and PMA affected the time course of the deactivating erg-like current, test pulse duration was increased to 700 ms at the times indicated in Fig. 9A by a, b and c. Neither the deactivation time course nor the relative amplitude of the two deactivating current components was significantly changed by the two substances. The current reduction in these experiments and in experiments in which application of PMA was followed by application of TRH are summarized in Fig. 9B (1 and 2). The effects of TRH and phorbol ester were similar in magnitude independent of the order of application. Additional experiments showed that PMA and TRH reduced the erg-like current in spite of the presence of the PKC inhibitor bisindolylmaleimide I. Forskolin (400 μM) rapidly induced about a 50 % reduction of the erg-like current. However, subsequent application of TRH induced an additional reduction by about 20 %.
Figure 9. Effects of phorbol ester, forskolin and TRH on the erg-like K+ current.
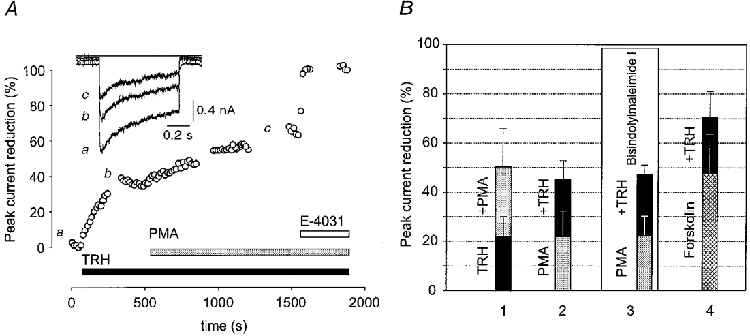
A, the erg-like current is reduced by TRH and PMA. Inward currents were recorded using the nystatin-perforated patch configuration every 15 s with a 40 ms test pulse to -120 mV from a holding potential of -20 mV to avoid substantial deactivation. At the breaks indicated by a, b and c, membrane currents were elicited with test pulses to -120 mV of 700 ms duration preceded by a 2 s prepulse to 20 mV. Application of TRH (1 μM) and subsequent application of PMA (1 μM) in the continued presence of TRH reduced the erg-like current. At the end of the experiment E-4031 (10 μM) was applied. The membrane currents shown in the inset were obtained by subtracting the E-4031-insensitive current from the currents recorded at the times indicated by a, b and c. B, summary of results obtained in experiments with similar protocols to that shown in A. Substances were applied in the following order: group 1 (n= 8): TRH (mean reduction of the erg-like current ±s.d., 22·2 ± 8·3 %), TRH + PMA (50·3 ± 15·5 %). Group 2 (n= 8): PMA (21·8 ± 10·3 %), PMA + TRH (44·9 ± 7·7 %). In group 3 (n= 3), experiments were performed in the presence of the PKC inhibitor bisindolylmaleimide I (1 μM). Cells were preincubated with the PKC inhibitor at 37 °C in the normal culture medium for 2·5 to 4 h. Sequence of application: PMA (22·5 ± 7·7 %), PMA + TRH (47·0 ± 4·0 %). Group 4 (n= 3): forskolin (400 μM; 47·8 ± 16 %), forskolin + TRH (71·3 ± 13 %).
The smaller TRH effect in this set of experiments compared with those related to Fig. 8 is presumably due to the presence of a 2 s prepulse to 20 mV (Bauer et al. 1990; Bauer, 1998). Taken together, these experiments suggest that the TRH-induced reduction of the erg-like current involves an as yet unidentified pathway which is independent of PKA and PKC.
r-erg genes are expressed in rat lactotrophs
The similarity of the time- and potential-dependent properties of the erg-like current in native lactotrophs to those in GH3/B6 cells suggested that the protein expressed by r-erg1 (Bauer et al. 1998) could also be involved in forming the K+ channel mediating the erg-like current in lactotrophs. RT-PCR performed with tissue from the whole pituitary showed that the transcripts of all three genes so far cloned (r-erg1, r-erg2 and r-erg3) were present in the pituitary, whereas in GH3/B6 cells only the transcripts of r-erg1 and r-erg2 were found (Fig. 10B). To investigate which erg channels are expressed in individual native lactotrophs, single-cell RT-PCR was performed using primers designed to detect transcripts of the three known members of the r-erg gene family (Shi et al. 1997; Bauer et al. 1998). Prior to collecting the cytoplasm, electrophysiological recordings of the cells were performed to establish the existence of an E-4031-sensitive current. In 16 cells mRNA transcripts of the three r-erg genes were found in the following combinations: r-erg1 (n= 2), r-erg2 (n= 6), r-erg1+r-erg2 (n= 5), r-erg1+r-erg3 (n= 1) and r-erg2+r-erg3 (n= 2). Transcripts of r-erg3 were only detected in combination with the transcripts of the other erg genes. Figure 10A shows the results obtained in two lactotrophs. One cell contained mRNA transcripts of both r-erg1 and r-erg2 and the other cell contained mRNA transcripts of r-erg2 and r-erg3. In control experiments mRNA for the three erg channels was not detected in the extracellular solution collected in the immediate vicinity of the lactotrophs. A correlation between the presence of the various combinations of r-erg transcripts and the relative amplitudes of the two components of the erg-like current was not obvious.
Figure 10. Transcripts of r-erg1, r-erg2 and r-erg3 are present in single lactotrophs in different combinations.
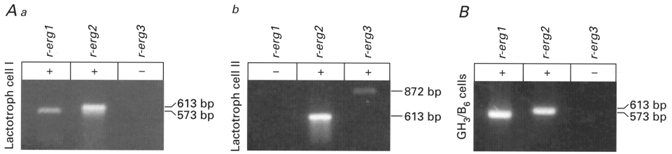
Aa and b, RT-PCR was performed with cytoplasm obtained from single lactotroph cells to detect transcripts of r-erg1, r-erg2 and r-erg3. Bars on the right indicate the size of the transcripts (base pairs, bp). Cell I contained mRNA transcripts of r-erg1 and r-erg2; cell II contained transcripts of r-erg2 and r-erg3. B, RT-PCR performed with GH3/B6 cells revealed mRNA transcripts of r-erg1 and r-erg2. Reactions performed with H2O and without reverse transcriptase served as negative controls.
DISCUSSION
The erg-like inward-rectifying K+ current in rat lactotrophs from primary culture was isolated as the E-4031-sensitive current and measured in high K+ external solution. At membrane potentials negative to -100 mV a fast and a pronounced slowly deactivating current component could be separated. The fast component of the erg-like current in native lactotrophs had similar time- and voltage-dependent properties to those of the erg-like current in GH3/B6 cells measured under identical experimental conditions. The slowly deactivating current component is a novel property of an erg-like current that has not been described before in other preparations, except for recent observations made in the rat lactotroph cell line MMQ (Rosati et al. 1998).
A slowly deactivating current component has also been described for heterologously expressed HERG channels (Snyders & Chaudhary, 1996; Spector et al. 1996; Zhou et al. 1998b) and for erg-like currents of microglia (Zhou et al. 1998a) and atrial myocytes (Yang et al. 1994). However, the erg currents in all of these reports almost completely deactivated at membrane potentials negative to -100 mV within about 1 s and a slowly deactivating current component was apparent only at membrane potentials more positive than -70 mV, where its relative amplitude increased from about 10 % at -70 mV to about 50 % at -40 mV (Snyders & Chaudhary, 1996). At a given potential, a relatively constant contribution of this slow component to the total erg current was found, whereas in native lactotrophs a characteristic cell-to-cell variability of the relative amplitude of the slow erg-like current component was observed ranging from 30 to 74 % at -120 mV. Nevertheless, the possibility cannot be excluded that with pulse protocols similar to those used in this study a slowly deactivating current component similar to that in native lactotrophs could be detected. The biexponential decay of the deactivating erg current of HERG channels heterologously expressed in human embryonic kidney (HEK) cells (Snyders & Chaudhary, 1996) or in Xenopus oocytes (Zhou et al. 1998b) was studied in a low external concentration of K+. In experiments using a high external K+ concentration the time course of deactivation of the erg-like current measured in microglia also exhibited only a small slow component at negative membrane potentials (Zhou et al. 1998a), or in rabbit sino-atrial node cells it could even be well fitted with a single exponential function within the potential range of -100 to -60 mV (Ho et al. 1996). These observations support the present results in GH3/B6 cells, where deactivation of the erg-like current recorded in a high external K+ concentration could be fitted with a single exponential function in clear contrast to the time course of deactivation in native lactotrophs.
Previous experiments have shown that the availability curve of the erg-like current in GH3/B6 cells has the same potential dependence as that of the current mediated by the rat homologue of HERG (r-erg1) heterologously expressed in CHO cells (Bauer et al. 1998). The same potential dependence of the availability curve of GH3/B6 cells was observed in the present results and it also agreed with that of the fast deactivating component in native lactotrophs.
The voltage dependence of the isochronal availability curve associated with the slow current component was shifted by more than 40 mV to more negative membrane potentials compared with that of the fast component. Similar observations have been made in MMQ cells (Rosati et al. 1998). However, the magnitude of the shift is clearly dependent on the test pulse duration. Nevertheless, even a small shift under steady-state conditions would lead to a more negative membrane potential in native lactotrophs possessing a pronounced slowly deactivating current component. In spontaneously active lactotrophs the slower deactivation kinetics of the erg current would decrease the frequency of action potential firing.
In the present study the erg-like current was isolated as the E-4031-sensitive K+ current and could be separated from a non-inactivating E-4031-insensitive K+ current, similar to the case in GH3/B6 cells (Weinsberg et al. 1997). Measured at a high external K+ concentration, this non-inactivating K+ current was activated at membrane potentials positive to -70 mV. Previously, membrane currents exhibiting slow gating kinetics have been described as an M-like current in native rat lactotrophs (Sankaranarayanan & Simasko, 1996). This current was reported to be reduced by TRH. However, in this study the non-inactivating current was not isolated from the erg-like current. Here we show that in contrast to the erg-like current, the non-inactivating current is not reduced by TRH. A more detailed characterization of the non-inactivating current was hampered by the difficulty of separating this current from the other outward-rectifying K+ currents activated at more positive membrane potentials.
The erg-like current is reduced by TRH in native lactotrophs (Corrette et al. 1996), GH3/B6 cells (Bauer et al. 1990) and GH3 cells (Barros et al. 1992). Several experimental observations suggest that this TRH-induced reduction of the erg-like current is of functional importance. Experiments on polynuclear GH3/B6 cells carried out in a low external concentration of K+ demonstrated that the erg-like current is reduced by TRH and that its reduction by either TRH or E-4031 induces a depolarization of the membrane potential (Bauer, 1998). Recently it has been shown in native lactotroph cells that E-4031 can depolarize the membrane potential and increase prolactin secretion (Bauer et al. 1999). These data indicate that in lactotroph cells the erg-like current contributes to the maintenance of the resting potential and that its reduction by TRH is probably involved in the cellular mechanisms underlying the second phase of prolactin secretion (reviewed by Corrette et al. 1995).
In native lactotrophs both components of the erg-like current are reduced by TRH. The signal cascade underlying this TRH-induced reduction is still unknown. The present experiments indicate that TRH exerts its effect independent of PKA and PKC, supporting previous experiments in GH3/B6 cells (Bauer et al. 1994). However, a phosphorylating step seems to be involved in the TRH-induced reduction of the erg-like current in GH3 cells (Barros et al. 1992). The present experiments show that a phorbol ester is able to reduce the erg-like current and that this effect seems not to be mediated by PKC, although a previously noted phorbol ester- and TRH-induced modulation of heterologously expressed HERG channel currents was assumed to be mediated by PKC (Barros et al. 1998). In contrast, in another study also using Xenopus oocytes as a heterologous expression system, Kiehn et al. (1998) reported that the effects of phorbol esters on HERG currents are independent of PKC activation and are at least in part mediated by activation of PKA. However, the present data show that the TRH-induced reduction of the erg-like current in lactotrophs cannot be explained by activation of PKA.
Both components of the erg-like current in native lactotrophs are blocked by E-4031 and other class III antiarrhythmics known to block erg channels. The class III antiarrhythmics used in this study (Table 2) have previously been shown to block either the rapidly activating K+ current (IKr) in the heart (Spinelli et al. 1993; Rees & Curtis, 1996; Spector et al. 1996; Nair & Grant, 1997) or heterologously expressed HERG-mediated membrane currents (Sanguinetti et al. 1995; Trudeau et al. 1995). Sotalol is the only substance that had no blocking effect on the erg-like current in native lactotrophs. A similar result was obtained in GH3/B6 cells (Weinsberg et al. 1997). The lack of a pronounced effect of sotalol on IKr has also been reported by Wettwer et al. (1992). The neuroleptic haloperidol which blocks HERG channels heterologously expressed in Xenopus oocytes (Suessbrich et al. 1997) also blocked the erg-like current in rat lactotrophs. The neuroleptic risperidone had the same effect as haloperidol. The elevated blood concentration of prolactin occurring as a side effect of haloperidol and other neuroleptics (Van Putten et al. 1991) can therefore be induced by two different mechanisms, by their action as dopamine antagonists and by their blocking effect on erg channels in native lactotrophs leading to a depolarization-induced increase in prolactin secretion (Bauer et al. 1999). The histamine receptor antagonists terfenadine and desmethylastemizole, which both blocked the erg-like current in lactotrophs, have also previously been shown to block HERG channels expressed in Xenopus oocytes (Suessbrich et al. 1996).
erg genes comprise a subfamily of the ether-à-go-go gene family (EAG;Warmke & Ganetzky, 1994). To date, three members of the erg gene subfamily have been cloned. r-erg1, the rat homologue of HERG, is probably the molecular correlate of the K+ channel mediating the erg-like current in GH3/B6 cells (Bauer et al. 1998). In addition, two other r-erg cDNAs have been cloned from a rat brain cDNA library, r-erg2 and r-erg3 (Shi et al. 1997). The peculiar time- and voltage-dependent properties of the inward-rectifying K+ current in native lactotrophs as well as its blockage by E-4031 and other class III antiarrhythmics indicate that this current is mediated by erg channels. Whereas in GH3/B6 cells only erg1 and erg2 are expressed, the transcripts of all three erg genes were found to be present in the whole pituitary. However, single-cell RT-PCR revealed that in individual lactotrophs the transcripts of the three genes are present in different combinations. As yet there is no obvious correlation between the occurrence of a defined combination of erg transcripts and a particular property of the erg-like current. For example, lactotrophs containing transcripts of erg3 exhibited no properties different from those lacking transcripts of erg3. The occurrence of transcripts for different erg channel subunits in a particular lactotroph indicates the possibility of the formation of heteromultimeric erg channels in these cells.
The observation that the slow current component disappears without changing the total current amplitude suggests the existence of two interconverting kinetic components of the erg-like current. After a long-lasting hyperpolarization (about 10 s) leading to complete erg current deactivation the slowly deactivating component was exchanged for a fast component and only after a depolarization lasting several minutes was the fraction of the slowly deactivating current component restored. The presence of ultra-slow time courses of channel gating has previously been assumed to explain very slow processes like the hysteresis of the availability curve in microglia (Pennefather et al. 1998; Zhou et al. 1998a). However, it is unclear, whether these ultra-slow processes are related to the slow kinetics described in this study. The relative amplitude of the slowly deactivating current component in lactotrophs never exceeded the amplitude at the beginning of an individual experiment suggesting that the erg channels mediating the fast component at the beginning of the experiment could not be converted into slowly deactivating erg channels. One explanation for this observation could be the existence of two different erg channel types, perhaps differing in their subunit composition. The molecular correlate for the slowly deactivating current is not known. The possibility that it could be mediated by the known splice variants is unlikely because they exhibit even faster deactivation kinetics (London et al. 1997). Another reason for the existence of two differently deactivating current components could be that the erg channels in native lactotrophs can be modified by an as yet unknown molecular mechanism or a modulating factor, whose concentration is limited within a particular cell. Obviously such a factor is not a freely diffusing cytoplasmic substance because there was no difference between measurements performed in the perforated-patch configuration and in the whole-cell configuration. An example for such a modifying substance is the Drosophilaβ-subunit hyperkinetic which has been shown to interact with HERG channels inducing a slowing of HERG channel deactivation (Wilson et al. 1998).
Acknowledgments
We would like to thank Dorrit Schiemann as well as Thorsten Homfeldt and Waltraud Krüger for expert technical help and the Deutsche Forschungsgemeinschaft for financial support (GRK 255, SFB 444). We thank Professor E. Wanke, Milano, for communicating unpublished results. Antibodies against rat prolactin were generously provided by NIDDK (Baltimore, MD, USA). The data presented here are part of the thesis of R. S.
References
- Barros F, Delgado LM, Del Camino D, De La Peña P. Characteristics and modulation by thyrotropin-releasing hormone of an inwardly rectifying K+ current in patch-perforated GH3 anterior pituitary cells. Pflügers Archiv. 1992;422:31–39. doi: 10.1007/BF00381510. [DOI] [PubMed] [Google Scholar]
- Barros F, Gómez-Varela D, Viloria CG, Palomero T, Giráldez T, De La Peña P. Modulation of human erg K+ channel gating by activation of a G protein-coupled receptor and protein kinase C. The Journal of Physiology. 1998;511:333–346. doi: 10.1111/j.1469-7793.1998.333bh.x. [DOI] [PMC free article] [PubMed] [Google Scholar]
- Bauer CK. The erg inwardly rectifying K+ current and its modulation by thyrotrophin-releasing hormone in giant clonal rat anterior pituitary cells. The Journal of Physiology. 1998;510:63–70. doi: 10.1111/j.1469-7793.1998.063bz.x. [DOI] [PMC free article] [PubMed] [Google Scholar]
- Bauer CK, Davison I, Kubasov I, Schwarz JR, Mason WT. Different G proteins are involved in the biphasic response of clonal rat pituitary cells to thyrotropin-releasing hormone. Pflügers Archiv. 1994;428:17–25. doi: 10.1007/BF00374747. [DOI] [PubMed] [Google Scholar]
- Bauer CK, Engeland B, Wulfsen I, Ludwig J, Pongs O, Schwarz JR. RERG is a molecular correlate of the inward-rectifying K current in clonal rat pituitary cells. Receptors and Channels. 1998;6:19–29. [PubMed] [Google Scholar]
- Bauer CK, Falk T, Schwarz JR. An endogenous inactivating inward-rectifying potassium current in oocytes of Xenopus laevis. Pflügers Archiv. 1996;432:812–820. doi: 10.1007/s004240050203. [DOI] [PubMed] [Google Scholar]
- Bauer CK, Meyerhof W, Schwarz JR. An inward-rectifying K+ current in clonal rat pituitary cells and its modulation by thyrotrophin-releasing hormone. The Journal of Physiology. 1990;429:169–189. doi: 10.1113/jphysiol.1990.sp018250. [DOI] [PMC free article] [PubMed] [Google Scholar]
- Bauer CK, Schäfer R, Schiemann D, Reid G, Hanganu I, Schwarz JR. A functional role of the erg-like inward-rectifying K+ current in prolactin secretion from rat lactotrophs. Molecular and Cellular Endocrinology. 1999;148:37–45. doi: 10.1016/s0303-7207(98)00241-x. [DOI] [PubMed] [Google Scholar]
- Chomczynski P, Sacchi N. Single-step method of RNA isolation by acid guanidinium thiocyanate-phenol-chloroform extraction. Analytical Biochemistry. 1987;162:156–159. doi: 10.1006/abio.1987.9999. [DOI] [PubMed] [Google Scholar]
- Corrette BJ, Bauer CK, Schwarz JR. Electrophysiology of anterior pituitary cells. In: Scherübl H, Hescheler J, editors. The Electrophysiology of Neuroendocrine Cells. Boca Raton, FL, USA: CRC Press; 1995. pp. 101–143. [Google Scholar]
- Corrette BJ, Bauer CK, Schwarz JR. An inactivating inward-rectifying K current present in prolactin cells from the pituitary of lactating rats. Journal of Membrane Biology. 1996;150:185–195. doi: 10.1007/s002329900043. [DOI] [PubMed] [Google Scholar]
- Faravelli L, Arcangeli A, Olivotto M, Wanke E. A HERG-like K+ channel in rat F-11 DRG cell line: pharmacological identification and biophysical characterization. The Journal of Physiology. 1996;496:13–23. doi: 10.1113/jphysiol.1996.sp021661. [DOI] [PMC free article] [PubMed] [Google Scholar]
- Hamill OP, Marty A, Neher E, Sakmann B, Sigworth FJ. Improved patch-clamp techniques for high-resolution current recording from cells and cell-free membrane patches. Pflügers Archiv. 1981;391:85–100. doi: 10.1007/BF00656997. [DOI] [PubMed] [Google Scholar]
- Ho WK, Earm YE, Lee SH, Brown HF, Noble D. Voltage- and time-dependent block of delayed rectifier K+ current in rabbit sino-atrial node cells by external Ca2+ and Mg2+ The Journal of Physiology. 1996;494:727–742. doi: 10.1113/jphysiol.1996.sp021528. [DOI] [PMC free article] [PubMed] [Google Scholar]
- Horn R, Marty A. Muscarinic activation of ionic currents measured by a new whole-cell recording method. Journal of General Physiology. 1988;92:145–159. doi: 10.1085/jgp.92.2.145. [DOI] [PMC free article] [PubMed] [Google Scholar]
- Kiehn J, Karle C, Thomas D, Yao X, Brachmann J, Kübler W. HERG potassium channel activation is shifted by phorbol esters via protein kinase A-dependent pathways. Journal of Biological Chemistry. 1998;273:25285–25291. doi: 10.1074/jbc.273.39.25285. [DOI] [PubMed] [Google Scholar]
- London B, Trudeau MC, Newton KP, Beyer AK, Copeland NG, Gilbert DJ, Jenkins NA, Satler CA, Robertson GA. Two isoforms of the mouse ether-à-go-go-related gene coassemble to form channels with properties similar to the rapidly activating component of the cardiac delayed rectifier K+ current. Circulation Research. 1997;81:870–878. doi: 10.1161/01.res.81.5.870. [DOI] [PubMed] [Google Scholar]
- Monyer H, Jonas P. Polymerase chain reaction analysis of ion channel expression in single neurons of brain slices. In: Sakmann B, Neher E, editors. Single-Channel Recording. New York and London: Plenum Press; 1995. pp. 357–373. [Google Scholar]
- Nair LA, Grant AO. Emerging class III antiarrhythmic agents: Mechanism of action and proarrhythmic potential. Cardiovascular Drugs and Therapy. 1997;11:149–167. doi: 10.1023/a:1007784814823. [DOI] [PubMed] [Google Scholar]
- Pennefather PS, Zhou W, DeCoursey TE. Idiosyncratic gating of HERG-like K+ channels in microglia. Journal of General Physiology. 1998;111:795–805. doi: 10.1085/jgp.111.6.795. [DOI] [PMC free article] [PubMed] [Google Scholar]
- Rees S, Curtis MJ. Which cardiac potassium channel subtype is the preferable target for suppression of ventricular arrhythmias. Pharmacology and Therapeutics. 1996;69:199–217. doi: 10.1016/0163-7258(95)02063-2. [DOI] [PubMed] [Google Scholar]
- Reid G, Bauer CK, Bunting R, Mason WT, Schwarz JR. Most lactotrophs from lactating rats are able to respond to both thyrotropin-releasing hormone and dopamine. Molecular and Cellular Endocrinology. 1996;124:121–129. doi: 10.1016/s0303-7207(96)03933-0. [DOI] [PubMed] [Google Scholar]
- Rosati B, Arcangeli A, Cuccuru D, Crociani O, Lecchi M, Olivotto M, Wanke E. Novel properties of erg K+ channels in pituitary cells. Society for Neuroscience Abstracts. 1998;24:1984. [Google Scholar]
- Sanguinetti MC, Jiang C, Curran ME, Keating MT. A mechanistic link between an inherited and an acquired cardiac arrhythmia: HERG encodes the IKr potassium channel. Cell. 1995;81:299–307. doi: 10.1016/0092-8674(95)90340-2. [DOI] [PubMed] [Google Scholar]
- Sankaranarayanan S, Simasko SM. Characterization of an M-like current modulated by thyrotropin-releasing hormone in normal rat lactotrophs. Journal of Neuroscience. 1996;16:1668–1678. doi: 10.1523/JNEUROSCI.16-05-01668.1996. [DOI] [PMC free article] [PubMed] [Google Scholar]
- Shi W, Wymore RS, Wang HS, Pan Z, Cohen IS, McKinnon D, Dixon JE. Identification of two nervous system-specific members of the erg potassium channel gene family. Journal of Neuroscience. 1997;17:9423–9432. doi: 10.1523/JNEUROSCI.17-24-09423.1997. [DOI] [PMC free article] [PubMed] [Google Scholar]
- Shibasaki T. Conductance and kinetics of delayed rectifier potassium channels in nodal cells of the rabbit heart. The Journal of Physiology. 1987;387:227–250. doi: 10.1113/jphysiol.1987.sp016571. [DOI] [PMC free article] [PubMed] [Google Scholar]
- Simasko SM, Sankaranarayanan S. Characterization of a hyperpolarization-activated cation current in rat pituitary cells. American Journal of Physiology. 1997;272:E405–414. doi: 10.1152/ajpendo.1997.272.3.E405. [DOI] [PubMed] [Google Scholar]
- Snyders DJ, Chaudhary A. High affinity open channel block by dofetilide of HERG expressed in a human cell line. Molecular Pharmacology. 1996;49:949–955. [PubMed] [Google Scholar]
- Spector PS, Curran ME, Keating MT, Sanguinetti MC. Class III antiarrhythmic drugs block HERG, a human cardiac delayed rectifier K+ channel - Open channel block by methanesulfonanilides. Circulation Research. 1996;78:499–503. doi: 10.1161/01.res.78.3.499. [DOI] [PubMed] [Google Scholar]
- Spinelli W, Moubarak IF, Parsons RW, Colatsky TJ. Cellular electrophysiology of WAY-123,398, a new class III antiarrhythmic agent: specificity of IK block and lack of reverse use dependence in cat ventricular myocytes. Cardiovascular Research. 1993;27:1580–1591. doi: 10.1093/cvr/27.9.1580. [DOI] [PubMed] [Google Scholar]
- Suessbrich H, Schönherr R, Heinemann SH, Attali B, Lang F, Busch AE. The inhibitory effect of the antipsychotic drug haloperidol on HERG potassium channels expressed in Xenopus oocytes. British Journal of Pharmacology. 1997;120:968–974. doi: 10.1038/sj.bjp.0700989. [DOI] [PMC free article] [PubMed] [Google Scholar]
- Suessbrich H, Waldegger S, Lang F, Busch AE. Blockade of HERG channels expressed in Xenopus oocytes by the histamine receptor antagonists terfenadine and astemizole. FEBS Letters. 1996;385:77–80. doi: 10.1016/0014-5793(96)00355-9. [DOI] [PubMed] [Google Scholar]
- Trudeau MC, Warmke JW, Ganetzky B, Robertson GA. HERG, a human inward rectifier in the voltage-gated potassium channel family. Science. 1995;269:92–95. doi: 10.1126/science.7604285. [DOI] [PubMed] [Google Scholar]
- Van Putten T, Marder SR, Mink J. Serum prolactin as a correlate of clinical response to haloperidol. Journal of Clinical Psychopharmacology. 1991;11:357–361. [PubMed] [Google Scholar]
- Wang S, Liu S, Morales MJ, Strauss HC, Rasmusson RL. A quantitative analysis of the activation and inactivation kinetics of HERG expressed in Xenopus oocytes. The Journal of Physiology. 1997;502:45–60. doi: 10.1111/j.1469-7793.1997.045bl.x. [DOI] [PMC free article] [PubMed] [Google Scholar]
- Warmke JW, Ganetzky B. A family of potassium channel genes related to eag in Drosophila and mammals. Proceedings of the National Acadamy of Sciences of the USA. 1994;91:3438–3442. doi: 10.1073/pnas.91.8.3438. [DOI] [PMC free article] [PubMed] [Google Scholar]
- Weinsberg F, Bauer CK, Schwarz JR. The class III antiarrhythmic agent E-4031 selectively blocks the inactivating inward-rectifying potassium current in rat anterior pituitary tumor cells (GH3/B6 cells) Pflügers Archiv. 1997;434:1–10. doi: 10.1007/s004240050356. [DOI] [PubMed] [Google Scholar]
- Wettwer E, Grundke M, Ravens U. Differential effects of the new class III antiarrhythmic agents almokalant, E-4031 and D-sotalol, and of quinidine, on delayed rectifier currents in guinea pig ventricular myocytes. Cardiovascular Research. 1992;26:1145–1152. doi: 10.1093/cvr/26.11.1145. [DOI] [PubMed] [Google Scholar]
- Wilson GF, Wang Z, Chouinard SW, Griffith LC, Ganetzky B. Interaction of the K channel β subunit, hyperkinetic, with eag family members. Journal of Biological Chemistry. 1998;273:6389–6394. doi: 10.1074/jbc.273.11.6389. [DOI] [PubMed] [Google Scholar]
- Yang T, Wathen MS, Felipe A, Tamkun MM, Snyders DJ, Roden DM. K+ currents and K+ channel mRNA in cultured atrial cardiac myocytes (AT-1 cells) Circulation Research. 1994;75:870–878. doi: 10.1161/01.res.75.5.870. [DOI] [PubMed] [Google Scholar]
- Zhou W, Cayabyab FS, Pennefather PS, Schlichter LC, DeCoursey TE. HERG-like K+ channels in microglia. Journal of General Physiology. 1998a;111:781–794. doi: 10.1085/jgp.111.6.781. [DOI] [PMC free article] [PubMed] [Google Scholar]
- Zhou Z, Gong Q, Ye B, Fan Z, Makielski JC, Robertson GA, January CT. Properties of HERG channels stably expressed in HEK 293 cells studied at physiological temperature. Biophysical Journal. 1998b;74:230–241. doi: 10.1016/S0006-3495(98)77782-3. [DOI] [PMC free article] [PubMed] [Google Scholar]