

Abstract
We recorded the a-wave of the human electroretinogram from subjects with normal vision, using a corneal electrode and ganzfeld (full-field) light stimulation. From analysis of the rising phase of rod-isolated flash responses we determined the maximum size (amax) of the a-wave, a measure of the massed circulating current of the rods, and the amplification constant (A) of transduction within the rod photoreceptors.
During light adaptation by steady backgrounds the maximal response was reduced, as reported previously. amax declined approximately as I0/(I0+IB), where IB is retinal illuminance and I0 is a constant. In different subjects I0 ranged from 40 to 100 trolands, with a mean of 70 trolands, corresponding to about 600 photoisomerizations s−1 per rod. (1 troland is the retinal illuminance that results when a surface luminance of 1 cd m−2 is viewed through a pupil area of 1 mm2.) The amplification constant A decreased only slightly in the presence of steady backgrounds.
Following a full bleach amax recovered along an S-shaped curve over a period of 30 min. There was no detectable response for the first 5 min, and half-maximal recovery took 13-17 min.
The apparent amplification constant decreased at early times after large bleaches. However, upon correction for reduced light absorption due to loss of pigment, with regeneration of rhodopsin occurring with a time constant of 9-15 min in different subjects, it appeared that the true value of A was probably unchanged by bleaching.
The recovery of amax following a bleach could be converted into recovery of equivalent background intensity, using a ‘Crawford transformation’ derived from the light adaptation results. Following bleaches ranging from 10 to > 99 %, the equivalent background intensity decayed approximately exponentially, with a time constant of about 3 min.
The time taken for amax to recover to a fixed proportion of its original level increased approximately linearly (rather than logarithmically) with fractional bleach, with a slope of about 12 min per 100 % bleach. Similar behaviour has previously been seen in psychophysical dark adaptation experiments, for the dependence of the ‘second component’ of recovery on the level of bleaching.
The underlying physiological basis of adaptation in the visual system has been a subject of interest for many years (for example: Stiles & Crawford, 1932; Hecht et al. 1937; Dowling, 1963; Rushton, 1965; Barlow, 1972; Pugh, 1975; Shapley & Enroth-Cugel, 1984; Lamb, 1990; Donner et al. 1998). For moderate changes in background intensity (within a decade or two), the adjustment of visual sensitivity occurs extremely rapidly (within a second or so), irrespective of whether the intensity is increasing or decreasing; this rapid phenomenon is known as ‘light adaptation’. But following extinction of an extremely intense background which has ‘bleached’ an appreciable fraction of the visual pigment in the photoreceptors, the adjustment of visual sensitivity occurs much more slowly; this slow recovery is known as ‘dark adaptation’ or ‘bleaching adaptation’. After a total bleach it can take almost an hour for an observer to regain his or her original dark-adapted sensitivity.
A substantial component of adaptation in the visual system is thought to be post-receptoral in origin, in part because adaptation begins at intensities so low that most photoreceptors will have received very few photon hits (Aguilar & Stiles, 1954), and in part because the magnitude of the scotopic sensitivity changes are substantially greater in the overall visual system than in individual rod photoreceptors (Kraft et al. 1993). But since the post-receptoral changes are likely to be dependent on photoreceptor activity, it seems clear that the adaptational state of the visual system will be determined ultimately by events in the photoreceptors.
Photoreceptor adaptation has been studied in the isolated retina, using intracellular techniques, and in individual isolated photoreceptors, using the suction pipette technique. It is not, however, straightforward to extrapolate these experiments to the living eye, because of the absence of the normal contact between the photoreceptors and the retinal pigment epithelium. In order to study adaptation of human photoreceptors in vivo, the only feasible approach is to measure the electroretinogram (ERG) (e.g. Fulton & Rushton, 1978; Frishman et al. 1996), but analysis of the ERG is complicated by the fact that it comprises the summed activity of many different retinal cell types (see Robson & Frishman, 1999, for a recent review). It has long been known that the initial component (the a-wave) of the ERG reflects photoreceptor activity, and in recent years strong evidence has emerged that the a-wave provides an accurate measure of the massed circulating current of the photoreceptors (see Hood & Birch, 1990, 1993, for evidence).
Recently it has become possible to extract the parameters of phototransduction from a-wave measurements, by fitting the predictions of the molecular model of phototransduction developed by Lamb & Pugh (1992). For a family of a-wave signals, recorded in response to flashes at a range of intensities, it is possible to determine two parameters that reflect respectively the massed circulating current and the gain of transduction in the rod outer segments (Breton et al. 1994; Hood & Birch, 1994; Cideciyan & Jacobson, 1996; Smith & Lamb, 1997). In this paper we extend that approach to recordings of the a-wave of the human ERG obtained during light adaptation and dark adaptation, in order to determine the changes in circulating current and gain that occur during photoreceptor adaptation. Some of our results have been presented in abstract form (Thomas & Lamb, 1997, 1998a, b).
METHODS
The subjects were eight adults with normal vision (apart from slight myopia in three, and slight hyperopia in one); their ages ranged from 21 to 49 years. Ethical approval was obtained from the Cambridge Human Biology Research Ethics Committee, and informed written consent was obtained from each subject following detailed explanation of the procedures and risks.
ERG recording
The corneal ERG was recorded with a DTL fibre electrode, using ganzfeld stimulation, generally as described by Smith & Lamb (1997). The main difference was that the pupil of the test eye was dilated (see below). ERG signals were recorded with a Cambridge Electronic Design (Cambridge, UK) system, comprising an interface (μ1401) with optically isolated preamplifier (1902) and data acquisition software (SigAvg). All responses were filtered DC to 1 kHz (2-pole), and were sampled at 5 kHz.
Ganzfeld illumination
The monocular ganzfeld stimulator was as described by Smith & Lamb (1997). The effective flash intensity was varied by controlling the duration of the xenon flash (Mecablitz 60CT4, Metz, Germany), using a digital pulse generator triggered by the computer. The colour of the stimulus was either ‘blue’ (450 nm peak, Lee 195, Lee Filters, Andover, Hampshire) or ‘red’ (610 nm long pass). Table 1 shows our default values of flash duration and flash intensity, together with typical values of stimulus interval and number of presentations used in compiling a standard family of responses.
Table 1.
Standard flash stimuli used to elicit rod-isolated response families
| Blue flashes | Photopically matched red flashes | |||||||
|---|---|---|---|---|---|---|---|---|
| Flash duration | Corneal luminance | Retinal illuminance | Flash interval | Number of repetitions | Corneal luminance | Retinal illuminance | Flash interval | Number of repetitions |
| t(μs) | Ct(scotopic cd m−2 s) | L(scotopic Td s) | (s) | Ct(photopic cd m−2 s) | L(photopic Td s) | (s) | ||
| 40 | 1.3 | 51 | 5 | 10 | 0.12 | 4.7 | 5 | 10 |
| 50 | 3.3 | 135 | 5 | 10 | 0.29 | 12 | 5 | 10 |
| 60 | 6.8 | 278 | 5 | 10 | 0.60 | 25 | 5 | 10 |
| 80 | 18.7 | 762 | 10 | 10 | 1.6 | 65 | 5 | 10 |
| 100 | 38.3 | 1560 | 10 | 5–10 | 3.2 | 128 | 5 | 10 |
| 200 | 243.7 | 9920 | 20 | 3–5 | 20 | 823 | 10 | 3–5 |
| 400 | 994.2 | 40500 | 60 | 3–5 | 83 | 3370 | 20 | 3–5 |
Retinal illuminance has been calculated for a pupil diameter of 7.2 mm.
Rod isolation
Methods for the isolation of rod signals have been described by many groups (see Hood & Birch, 1990; Cideciyan & Jacobson, 1996). In our experiments rod isolation was achieved by averaging the response to blue flashes (i.e. rod + cone signals), and subtracting an estimate of the cone response elicited by that stimulus. In most cases the residual cone signal was estimated by presenting photopically matched red flashes. The intensity adjustment required to obtain a photopic match was determined using the photopic filter of the photometer (IL-1700, International Light, Newburyport, MA, USA). Examples of the procedure are shown in Fig. 1 for a family of flash responses, and in Fig. 4 for a dark adaptation experiment.
Figure 1. Illustration of the method of rod isolation for an a-wave family.
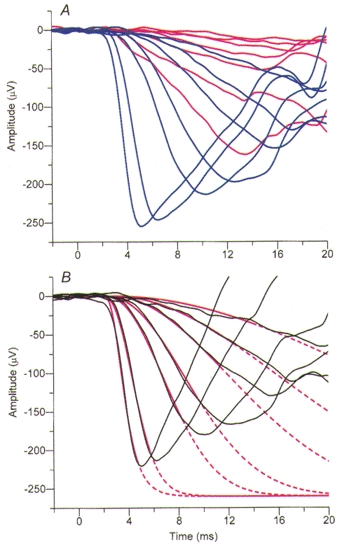
Rod isolation was achieved in the light adaptation experiments by recording responses to photopically matched blue and red flash stimuli and subsequently subtracting the red (cone) responses from the blue (rod + cone) responses. A, averaged responses for a standard family (Table 1) of photopically matched blue and red flashes, under dark-adapted conditions in subject FD. The trace colours correspond to the flash colour presented. B, subtraction of the red traces from the blue traces in A gives the rod-isolated family (black traces). The smooth red curves plot the best fitting ensemble of predicted responses for the full model of transduction; these curves are shown as continuous over the range of times for which the fitting was applied at each flash intensity, and are continued as dashed thereafter. The parameters used were: membrane time constant, τ= 0·9 ms; pure delay, td= 1·8 ms; maximal response, amax= -260 μV. The amplification constant obtained from the fitting was A= 5·8 s−2. For this subject the dilated pupil diameter was 7·2 mm.
Figure 4. Recovery of responses to bright and dim flashes following a full bleach.
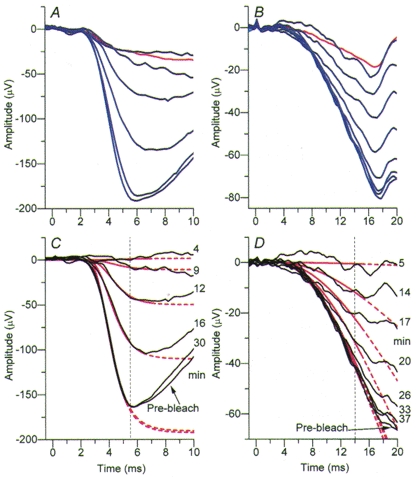
Superimposed responses to bright flashes (left) and dim flashes (right), at a succession of times following a full bleach, for subject TDL. The upper panels show the method of rod isolation, and illustrate averaged responses to blue flashes (blue traces), together with the mean cone signal obtained with red flashes (red traces). A, bright stimuli. The blue traces were obtained with single flashes (400 μs in duration) delivering 4·05 × 104 Td s, presented at intervals of roughly 4 min. The red trace is the mean response to five photopically matched red flashes delivered during the first 12 min following extinction of the bleaching exposure. B, dim stimuli. The blue traces are averaged from groups of 8-10 flashes (50 μs in duration) delivering 135 Td s, and presented at intervals of 5 s. The red trace is averaged from 34 responses to photopically matched red flashes presented throughout the recovery period. C and D, rod-isolated responses (black traces) to bright flashes and dim flashes, obtained by subtracting the red trace (in A or B) from each of the blue traces. The post-bleach time (min) is indicated to the right. The red traces plot the theory curves fitted using the first approach (iterative fitting; see Methods). The dashed vertical lines at 5·5 ms and 14 ms in the two panels indicate the respective times at which the bright and dim flash responses were measured using the second approach (measurement at fixed times). To avoid crowding, only representative traces are plotted in this figure, but in Fig. 5 the extracted parameters are plotted at all post-bleach times tested. For this subject the pupil diameter was 7·2 mm. The difference between the maximal dark-adapted response amplitude in this experiment and in the experiments of Fig. 2 (on the same subject) presumably arose from different positioning of the DTL electrode on different days.
In dark adaptation experiments the residual cone contribution to bright flashes was usually estimated using red flashes presented at early times after the bleach (e.g. during the first 8 min of recovery from a 99 % bleach), when the rods were saturated. For dim red flashes we found there was no change in the form of the response during the course of dark adaptation, presumably because the rod contribution to a dim red flash response is very small. Therefore the cone contribution was estimated as the mean response to dim red flashes presented throughout the recovery period. For both bright and dim flash stimuli, the estimated cone contribution was subtracted from the responses to the blue flashes (Fig. 4).
Intensity calibrations
It was pointed out to us by Dr J. G. Robson that the scotopic (‘Z-CIE’) filter of our IL-1700 photometer had substantially higher transmission than is appropriate for the CIE Vλ‘curve, at wavelengths in the region of 450 nm. We therefore measured the spectral composition of illumination within the ganzfeld, using a fibre optic spectrometer (S2000, Ocean Optics Inc., Dunedin, FL, USA). By integration of the emission spectra with the spectral sensitivity curves for (respectively) the Z-CIE filter of the IL-1700, and the CIE Vλ‘observer, we were able to determine the correction that was needed to the photometer readings (which were calibrated for tungsten light at 3215 K). For our standard blue filter, we found that the IL-1700 readings were higher than the true values by 19·3 % when using the xenon flash, and by 16·7 % when using the incandescent background source. The intensities of all scotopic flashes and backgrounds reported here have been corrected accordingly (i.e. decreased). This has had the effect of increasing the amplification constant A by almost 20 % from the uncorrected values.
Calculation of photoisomerizations
Denoting the luminance at the cornea as C (cd m−2), and the pupil area as P (mm2), then the resulting retinal illuminance I in trolands (Td) is defined as:
| (1a) |
Throughout this paper, all intensities will be given in scotopic units, so ‘Td’ will represent scotopic trolands. For a flash stimulus of duration t (s), it is convenient to define the integrated retinal illuminance L (i.e. the retinal illuminance × time product, in Td s) as:
| (1b) |
The number of photoisomerizations per rod, Φ, may then be found as:
| (2a) |
where K is an intensity conversion factor calculated by Breton et al. (1994) for the human eye as K= 8·6 photoisomerizations s−1 per rod per scotopic troland. This relation applies only in the case of negligible bleaching; i.e. when the test flash is not excessively bright, and when the retina has completely recovered from any previous bleach. Following a bleaching exposure, the number of photons absorbed will be affected by the reduced quantum catch, and (eqn 2a) should be replaced by:
| (2b) |
where Rh(T) is the fraction of rhodopsin present at post-bleach time, T.
Calculation of bleaching levels
When rhodopsin is bleached by a steady light of illuminance I, and it regenerates according to a first-order reaction with time constant τRh (of ∼7 min, see later), then the differential equation for the fraction of rhodopsin Rh remaining at time t is:
| (3) |
where the first term on the right side represents bleaching and the second term represents regeneration. In this expression LRh is a ‘bleaching constant’ (corresponding to the reciprocal of ‘photosensitivity’), which has been measured by retinal densitometry as in the range log10LRh= 6·8-7·0 log Td s (summarized by Rushton & Powell, 1972, p. 1075; Alpern & Pugh, 1974, p. 363). For the sake of round numbers, we shall initially take log10LRh= 7·0 log Td s.
Solving eqn (3) (see Hollins & Alpern, 1973, eqn 2a) yields the fractional bleach, B= 1 - Rh, at the end of an exposure of duration t and retinal illuminance I, as:
| (4) |
where the constant IRh is obtained as IRh=LRh/τRh.
Two special cases are of interest. First, for a steady-state exposure (where t→∞), we obtain:
| (5a) |
which shows that the constant IRh introduced above represents the steady intensity that bleaches half the pigment. Second, for a flashexposure, where the duration is short but the intensity is high (so that t < < τRh and I >> IRh), we obtain:
| (5b) |
When the flash bleach is small (L < < LRh), it may be seen that eqn (5b) reduces to eqn (2a), because the product LRhK represents the number of rhodopsin molecules per rod. It is therefore satisfying to discover that the product LRhK is equal to 8·6 × 107 molecules per rod, a figure very close to the value usually taken for the number of rhodopsin molecules, of 108 per rod, calculated from a rhodopsin concentration of 3 mM (Liebman, 1972) and an outer segment volume of 60 fl (length 25 μm, diameter 1·7 μm).
For bleaches obtained with multiple xenon flashes (see below), we employed an iterative calculation of the cumulative bleach, Bn after the nth flash presentation, as:
| (5c) |
where B0= 0, and where Trep represents the flash repetition interval.
Bleach delivery
Full-field bleaches were delivered either with a ‘mini-ganzfeld’ (Thomas & Lamb, 1998b) held over the eye of the subject (for total bleaches), or in the main ganzfeld (for all partial bleaches). The interior of the mini-ganzfeld was cylindrical in shape, approximately 4 cm diameter and 4 cm deep, and was painted with the same white coating as the main ganzfeld (6080 White Reflectance Coating, Kodak). Light from two incandescent sources (Flexilux 600, Schölly, Dentzlingen, Germany) was delivered via a pair of 13 mm diameter fibre optic cables, after passing through ‘yellow’ filters (GG475, Schott, Mainz, Germany) to reduce the transmission of short wavelengths. The luminance at the position of the cornea was set typically to 3 × 10⁴ cd m−2 (in scotopic units), and the duration of exposure was usually 60 s. For a dilated pupil, 7·5 mm diameter, eqn (1) indicates that the integrated retinal illuminance would be L= 8× 10⁷ Td s, and the fractional bleach may then be calculated from eqn (4) as B > 99 %. During presentation of the bleach the subject was asked to gaze around the interior of the mini-ganzfeld (rather than to fixate), and to try to keep his or her eyelids fully open.
Bleaching in the main ganzfeld was achieved by presenting one or more ‘white’ flashes (filtered by a heat filter and a UV filter: ‘Perspex’ VE Clear, ICI Acrylics, UK), with the duration of the xenon flash set to 1 ms, giving a corneal luminance × time product of C t= 2 × 10⁴ scotopic cd m−2 s. For a dilated pupil diameter of 7·5 mm, a single flash delivered 9 × 10⁵ Td s, calculated to bleach about 8 % of the rhodopsin. Larger bleaches were achieved by presenting multiple flashes, at intervals of 5 s; at this intensity the flash gun was fully recharged in 2·5 s. For very large bleaches (80-90 %), as many as 30 flashes were required, and the procedure lasted up to 2·5 min. (In one experiment we used 50 flashes at 2·5 s intervals; in another we used 24 flashes of 2 ms duration at 5 s intervals.) For 25 flashes each delivering 9 × 10⁵ Td s, and presented at 5 s intervals, substitution in eqn (5c) gives B25= 81 %, when the assumed parameter values are LRh= 107 Td s and τRh= 7 min. If regeneration of rhodopsin is ignored, then eqn (5b) gives B= 89%.
Experimental procedure
In order to permit accurate estimation of the flash and bleach levels, the pupil of the test eye was dilated with 1 % tropicamide, augmented on occasions by 2·5 % phenylephrine. The other eye was covered with a patch, and the subject was dark adapted for at least 15 min prior to the start of any recordings. An initial control family of rod-isolated responses was obtained (see Fig. 1), by delivering blue and photopically matched red flashes as indicated in Table 1. For subsequent control families the procedure was often shortened by delivering only 3 or 4 of the indicated intensities. In a given session, the remainder of the experiment consisted either of obtaining response families in the presence of a series of adapting background intensities, or of recording the recovery following one or more bleaching exposures.
When a bleach was delivered, post-bleach time was referenced to the end of the exposure. Responses to bright flashes (and usually also to dim flashes) were recorded for up to 50 min after the bleach. The bright blue flashes (∼4 × 10⁴ Td s) were delivered at intervals of at least 1 min. In experiments in which dim stimuli were presented, responses were recorded to sets of 10 dim blue flashes at intervals of 5 s, beginning at least 1 min after the preceding bright blue flash.
Theoretically expected shape of the rising phase of the a-wave response
In the terminology of Lamb & Pugh (1992) and Smith & Lamb (1997), the response r(t) at time t elicited by a brief flash at time zero is predicted to be:
| (6) |
where Φ is the number of photoisomerizations per rod, and td is a short delay time. As a simplification in this form of the equation, the capacitive time constant of the rod has been lumped into the overall delay td. For small responses (i.e. for sufficiently dim stimuli and/or early times after the flash), the term in square brackets in eqn (6) is small, and the equation simplifies to:
| (7) |
Hence the response at a fixed time after a dim flash is predicted (to a first approximation) to be proportional to the product amaxA, provided that the full complement of rhodopsin is present. When the quantum catch is reduced after a bleach, then Φ will be decreased as indicated in eqn (2b), and the dim-flash response will then be proportional to amaxA Rh. To avoid making assumptions about rhodopsin levels at the outset, we will initially take Φ to be unchanged after a bleach, so that we will measure an ‘apparent amplification constant’A‘. This will be related to the true amplification constant, A, by A′=A Rh.
Determination of amax and A
Responses were analysed using a custom program running under Matlab (The MathWorks Inc., Natick, MA, USA). The primary parameters to be determined were: the maximum a-wave response (amax), and the amplification constant (A) of transduction. During steady background illumination it was straightforward to determine these parameters (see Smith & Lamb, 1997), as families of responses could readily be obtained. A representative family is illustrated in Fig. 1 and sets of families at a range of background intensities are shown in Fig. 2.
Figure 2. Rod-isolated a-wave families in the presence of background illumination.

Each panel shows a family of rod-isolated a-wave responses (black traces), obtained at a series of flash intensities, for a single subject (TDL); the background intensity is given at the left of each panel. The same set of seven test flashes was used in each panel, and the flashes were presented at time zero. The flash durations and intensities were as listed in Table 1, except that in this experiment the duration of the dimmest flash was 35 μs rather than 40 μs. These flashes delivered from 29 to 3·4 × 104 Td s (slightly different from the values in Table 1 because the flash gun had been replaced); the pupil diameter was 7·3 mm. Red curves plot the best fitting ensembles of predicted responses when all parameters other than amax were held constant. The equation fitted was the full form of eqn (6), with explicit allowance for the membrane capacitive time constant, τ. The fixed parameters were: τ= 1·0 ms; pure delay td= 2·1 ms; amplification constant A= 4·3 s−2. The fitted values of amax in the seven panels were: -319, -238, -200, -125, -77, -33 and -14 μV.
During dark adaptation, conditions were non-stationary (i.e. the parameters of transduction were changing as time progressed), making it impossible to obtain averaged response families under fixed conditions. Instead we chose just two intensities - ‘bright’ (usually 400 μs duration, ∼4 × 10⁴ Td s), and ‘dim’ (50 or 60 μs duration, ∼200 Td s) - and measured responses to these stimuli presented at successive times during recovery from the bleach. We then estimated the time course of recovery of amax and A’ using two approaches: (1) by fitting theoretical curves to the onset phase of the responses; and (2) by measurements of response amplitude at fixed times.
Fitting the rising phase
In the first approach, theoretical curves were fitted to the rising phase of responses to bright and dim flashes. The equation used was the full version of eqn (6) above, with explicit allowance for the capacitive time constant, τ; see eqn (7) of Smith & Lamb (1997). Using a preliminary estimate for the time course of recovery of A’, we estimated the recovery of amax by least-squares fitting of the full equation to the individual bright flash responses. Next, we used this estimate for the recovery of amax to obtain a new estimate for the recovery of A’, by least-squares fitting of each averaged response to the dim flashes. Since the estimates of amax and A’ were determined at different post-bleach times (because the bright and dim test flashes could not be presented simultaneously) it was necessary, when estimating one parameter, to interpolate the other parameter using a smooth curve. The entire procedure was iterated, until we obtained a mutually consistent pair of recovery curves for the two parameters.
Several drawbacks of this approach should be mentioned. First, the iterated estimates for the recovery of A′ showed a bias towards the preliminary estimate of time course. Thus, if we used an initial estimate in which A′ was substantially reduced at early post-bleach times, then the procedure typically produced a next estimate for the recovery of A′ that was also reduced at early times. On the other hand, if our initial estimate for A′ was a constant, then the procedure typically produced a next estimate in which A′ was only slightly reduced at early times. Hence the procedure did not necessarily converge to a unique solution, and as a result this approach required care in its application. Although amax could be estimated quite consistently (based mainly on the bright flash responses), and the product amaxA′ could also be estimated fairly reliably (based mainly on the dim flash responses), the apparent amplification constant A′ could only be estimated with low reliability, since it was in essence determined by the ratio of these responses. Secondly, the approach was prone to error at early times after a full bleach, when amax was almost completely suppressed. Noise in the rising phase of the dim-flash response could then lead to a very large fitted value for the apparent amplification constant A′. We rejected points (for A′ and amaxA′) where the fitted value for A′ exceeded twice the dark-adapted level. The final drawback of this first procedure was that it was very tedious.
Measurements at fixed time
In order to avoid the need to assume a preliminary form for the recovery of A′ and then make repeated iterations, we developed an alternative and more objective approach, in which the responses were measured at fixed times. An estimate of amax was obtained by measuring the bright flash responses at a fixed early time, typically at 5-6 ms after the xenon flash, just before the peak of the saturating a-wave response (see Fig. 4C). The level measured at this time was taken to represent a constant proportion (typically 85-90 %) of the saturating a-wave level, giving amax as about 1·15 × the measured level. Then the responses to dim flashes were measured at a later fixed time (typically 13-15 ms, Fig. 4D) and, in accordance with eqn (7) above, these values were taken as proportional to the product amaxA′. The apparent amplification constant A′ was then estimated by dividing the values obtained for amaxA′ by a smooth curve fitted to the results for amax (see Fig. 5C).
Figure 5. Analysis of the recovery of amax and A’ using our two approaches.
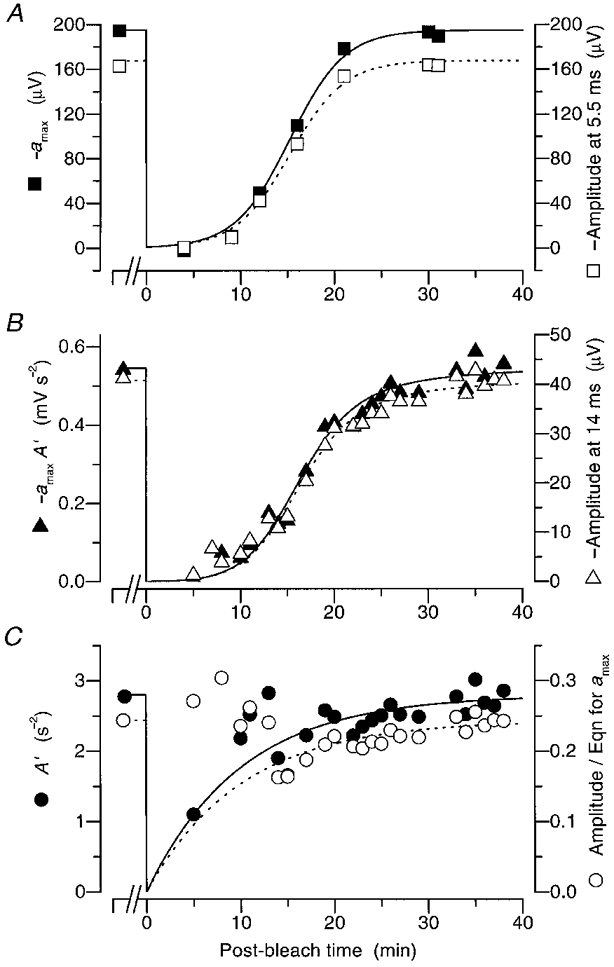
The results of Fig. 4, together with additional bright flash and dim flash responses recorded during that experiment, have been analysed using the two approaches presented in Methods. Filled symbols plot values extracted by the first approach (iterative fitting of the rising phase), while open symbols plot values extracted by the second approach (measurement at fixed times). A, estimates of amax (▪), determined by fitting the bright flash responses when A′ is assumed to follow the time course indicated by the continuous curve in C, together with measurements of the bright flash response amplitude at 5·5 ms (□). B, estimates of the product amaxA′ (▴), determined as the curve for amax in panel A multiplied by the points for A′ in C, together with measurements of the dim flash response amplitude at 14 ms (▵). C, estimates of A′ (•), determined by fitting the dim flash responses when amax is assumed to follow the time course indicated by the continuous curve in panel A, together with the result (○) obtained by dividing the measurements at fixed time in B (▵) by the curve for amax in panel A. The continuous curve in panel A plots eqn (9) with -amax(∞) = 195 μV, ca= 190 and τa= 2·9 min, giving a time to half-maximal recovery of 15·2 min; the dashed curve is scaled vertically by the factor 0·86. The continuous curve in C plots eqn (10) with A(∞) = 2·8 s−2, τRh= 10 min, and B= 1; the dashed curve is scaled vertically by the factor 0·087 s2. The curves in B plot the product of the respective curves in panels A and C, and exhibit a time to half-maximal recovery of 16·6 min.
RESULTS
Rod isolation
Figure 1 shows a family of flash responses obtained in dark-adapted conditions, and illustrates the method we used for isolation of rod signals. The blue traces in Fig. 1A show averaged responses to blue flashes at a series of intensities, and the red traces show averaged responses to photopically matched red flashes. Their differences (blue - red) are plotted as the black traces in Fig. 1B. The smooth red curves in Fig. 1B plot the predictions of the full model of transduction, with amax set to -260 μV and with A varied automatically to obtain the ensemble best fit (by minimizing the sum-of-squares error over the range where the theory curves are shown as continuous); this yielded A= 5·8 s−2. The time over which the fitting was performed was set by the operator, so as to end just prior to the point at which each individual experimental trace appeared to deviate from the rising-phase theory. Note that, for each intensity, the correction obtained by subtracting the response to the red flash (Fig. 1A) never exceeded 30 μV, at the latest time up to which the respective theory traces were fitted.
Steady background illumination
Response families in the presence of steady illumination
Figure 2 illustrates families of a-wave responses obtained from another subject, under dark-adapted conditions (top panel), and during exposure to backgrounds of progressively higher intensity in the subsequent panels. In each case the black traces are rod-isolated flash responses obtained using the stimulus parameters set out in Table 1, while the red traces are the predictions of the full model of rod transduction.
In performing the fitting, we allowed only a single parameter to vary. We either chose a value for the maximal response amax and then determined the ensemble best fit for the amplification constant A, or vice versa. The remaining parameters of the model were held constant, at td= 2·1 ms and τ= 1·0 ms in the experiment of Fig. 2. The procedure of choosing amax and fitting A yielded values for A of 4·3, 4·0, 4·0, 3·9, 3·4, 3·2 and 4·1 s−2 for the seven families, suggesting that A changed at most only slightly in the presence of backgrounds. We therefore set A constant for all the panels in Fig. 2, at its dark-adapted value of 4·3 s−2, and the illustrated traces plot the best-fitting ensembles of model curves when amax was allowed to vary between panels.
Comparable families of a-wave responses in the presence of backgrounds were obtained for each of our eight subjects, in a total of ten sessions (two subjects were tested twice). In the analysis, we set the parameters td and τ for each subject constant over all backgrounds, and the values we used are given in Table 2. For seven of the ten experiments we found negligible change in A during background illumination. Thus, when amax was set by eye for each background, we found that the values of A extracted by the least-squares fitting procedure deviated by less than 20 % from the dark-adapted level, for backgrounds that suppressed up to three-quarters of amax. In the remaining three experiments the extracted values of A declined by 30-55 % for backgrounds that were approximately half-saturating; these experiments are identified by an asterisk in Table 2. However, we doubt the reliability of this apparent change, because in one subject who was tested twice, there was a decline in A of 55 % in one session but no significant change (< 15 %) in another session. Overall our results indicate that, in human rods, the amplification constant of transduction changes only slightly from its dark-adapted value in the presence of background illumination.
Table 2.
Parameters used in fitting responses for different subjects
| Subject | Symbols used in Fig. 3Fig. 10 | td(ms) | τ(ms) | −αmax(μV) | A(s−2) | I0(Td) | τequiv(min) | τRh(min) | |
|---|---|---|---|---|---|---|---|---|---|
| MMT | • | • | 1.8 | 0.9 | 242 | 4.4 | 42 | 2.8 | 13 |
| • | 2.0 | 0.9 | 200 | 5.1 | 53 | — | — | ||
| TDL | ⋄ | ⋄ | 2.1 | 1.0 | 319 | 4.3 | 42 | 2.9 | 10 |
| GW | ▪ | — | 2.1 | 1.0 | 301 | 4.1 | 80 | — | — |
| CF | ▾ | ▾ | 2.0 | 0.9 | 278 | 3.6 | 82 | 4 | 15 |
| ▾ | 2.0 | 0.9 | 200 | 5.2 | 100* | — | — | ||
| FD | ▵ | ▵ | 1.8 | 0.9 | 260 | 5.8 | 80 | 2.25 | 9.5 |
| AH | ▿ | — | 2.0 | 0.9 | 335 | 3.3 | 100* | — | — |
| CC | ○ | ○ | 2.0 | 0.9 | 275 | 4.8 | 55 | 3 | 13 |
| GS | ⋄ | ⋄ | 2.0 | 1.0 | 340 | 5.4 | 60* | 3 | 9 |
| Mean ± S.D. | — | — | 275 ± 51 | 4.6 ± 0.8 | 69 ± 7 | 3.0 ± 0.6 | 11.6 ± 2.4 | ||
Identification of symbols used in Figs 3 and 10, together with values of parameters used in fitting curves. td is the pure delay, and γ is the membrane time constant, used in the full equivalent of eqn (6). amax is the maximal amplitude, and A is the amplification constant obtained under dark-adapted conditions. I0 is the background intensity required to halve amax in light adaptation experiments.(For experiments marked
Dependence of amax on background intensity
From this analysis we also extracted amax as a function of background intensity for each subject. For the seven experiments that showed no evidence for a change in A, we extracted amax exactly as described above. For the other three experiments we estimated amax in two ways: with A fixed at its dark-adapted value, and with A decreasing at the higher backgrounds. The two methods differed only slightly in the values of amax extracted. We chose to plot the estimates derived from the second method, where A was allowed to change, because the overall fit of the set of traces was better.
The dependence of amax on background intensity IB is plotted in Fig. 3 for the ten experiments. For four of the subjects (two of whom were tested twice) we obtained measurements over a reasonably wide range of intensities, and these results are denoted by the filled symbols. For the other four subjects we did not make measurements at dim backgrounds, and these results are indicated by open symbols. For each subject, the values of amax have been normalized to the mean amplitude obtained with no background; i.e. we have plotted amax(IB)/amax(0).
Figure 3. Dependence of maximal response amax on background intensity.
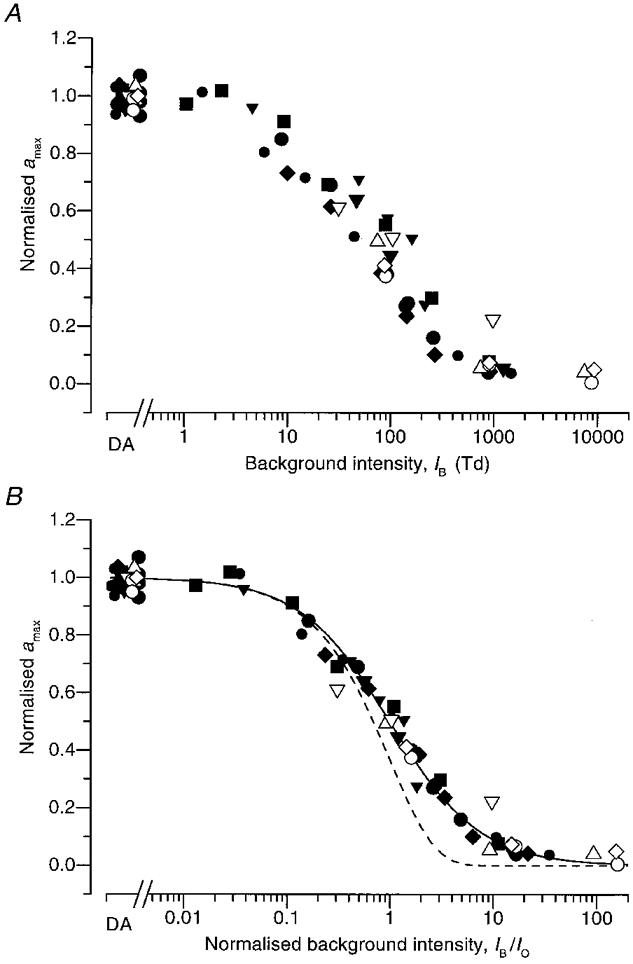
The maximal response, amax, determined by the fitting procedure explained in the text and illustrated in Fig. 2, has been normalized to its dark-adapted value, DA (mean of up to four measurements for each subject), and is plotted against background intensity. Collected results from eight subjects, identified by the symbols in Table 2; two of the subjects were tested on two separate occasions. A, the results are plotted against background intensity IB in raw units of Td; note the slight horizontal shifts between the symbols for different subjects. B, the background intensity axis has been normalized, as IB/I0, to provide the best fit of the results for each subject to the continuous curve, which plots eqn (8); in that equation, I0 represents the background intensity at which amax is reduced to half. For the different subjects the values of I0 determined by this fitting varied between 42 and 100 Td (see Table 2). The dashed curve plots the exponential saturation function amax(IB)/amax(0) = exp(-IB/I0), that would be expected in the absence of adaptation.
In the upper panel (Fig. 3A), where the intensity axis IB is in raw units of trolands, there appears to be a certain amount of horizontal shifting of the sets of points for the different subjects. Therefore, in the lower panel (Fig. 3B), we have re-scaled the intensity axis to normalized units, IB/I0, where I0 is the intensity found to halve amax. The continuous curve plotted in Fig. 3B is the hyperbolic function:
| (8) |
which is the complement of the Michaelis-Menten (or Naka-Rushton) saturation function, IB/ (I0+IB). The normalization parameter, I0, for each subject was chosen by eye so that the points fell as close as possible to eqn (8). The collected results in Fig. 3B show that eqn (8) provides a very good description of the behaviour. Also plotted for comparison, as the dashed curve, is the exponential saturation function exp(-IB/I0) (Lamb et al. 1981) which would be expected to apply in the absence of any adaptation; it is clear that the experimental results decline less steeply than this curve.
Table 2 sets out the parameters obtained for the eight subjects tested. td and τ are the two fixed delay parameters that were used in fitting all the response families for a given subject. The values of amax and A are those obtained under dark-adapted conditions, from analysis of the type illustrated in Fig. 2. The values of I0 are those determined in Fig. 3B, and the asterisks indicate the three experiments in which A was allowed to decrease at high intensities. Table 2 shows that I0, the intensity that halved the maximal response, varied between subjects by a factor of about 2·5, ranging from 42 to 100 Td, and that its mean was 69 Td, corresponding to about 600 photoisomerizations s−1 per rod.
Recovery from bleaching exposures
Bright and dim flash responses following a bleach
Figure 4 illustrates a-wave responses obtained from the same subject as in Fig. 2, during recovery from a full bleach. After a dark-adapted family had been recorded, a full bleach was delivered using the mini-ganzfeld, and thereafter responses to blue and red test flashes were recorded for 40 min. Representative traces obtained at a range of times during recovery are illustrated in Fig. 4A and B, for bright and dim flashes respectively, while the resultant rod-isolated signals are shown in Fig. 4C and D.
Very little response was measured with the bright (4·05 × 104 Td s) flashes at 4 and 9 min after the bleach, but at later times the response steadily recovered, until at 30 min it had reached a size very similar to that recorded before the bleach. Interspersed between the bright flashes we delivered sets of dim (135 Td s) flashes. For those delivered 5 min after the bleach, the signal obtained was very small, but at later times the response recovered progressively, until after 33 min it had recovered virtually to the pre-bleach level.
Time course of recovery of amax and A′ following the bleach
Approach 1: fitting of the rising phase kinetics
One approach to estimating the recovery of the parameters amax and A′ is to fit the rising phase of the flash responses with the Lamb & Pugh (1992) model of transduction, as described in the Methods. This approach is iterative. It uses an initial estimate for the recovery of A′ in order to determine the values of amax that best fit the rising phase of each of the bright flash responses. The resulting time course for amax is then used in the subsequent fitting of the dim flash responses, in order to determine A′ as a function of time. The procedure is repeated until the estimates for the recovery of amax and A′ are self-consistent.
The fitted rising phases obtained by this procedure are shown by the red curves in Fig. 4C and D, and the corresponding estimates for amax and A′ are plotted in Fig. 5A and C. Thus, the filled symbols in Fig. 5A are the estimates of amax obtained when the recovery of A′ was assumed to follow the continuous curve in Fig. 5C, while the filled symbols in Fig. 5C are estimates of A′ obtained when the recovery of amax was assumed to follow the continuous curve in Fig. 5A. Finally, in Fig. 5B, the filled symbols show the estimates of the product amaxA′, obtained by multiplying the data points for the apparent amplification constant in Fig. 5C by the curve for amax in Fig. 5A.
This method is subjective, in that it requires (i) an initial estimate for the time course of recovery of one of the parameters, and (ii) the subsequent fitting of arbitrary curves to the points obtained at each iteration. Nevertheless, it led ultimately to a pair of curves in Fig. 5A and C that are internally consistent, since in both cases the points obtained for the one parameter are described quite well by the curve that was used to derive the other parameter. Furthermore, each of the rod-isolated responses in Fig. 4C and D is described to a satisfying accuracy by the respective theory trace.
Approach 2: measurement at fixed time
In order to avoid the subjective nature of the first approach, we obtained a second estimate for the time course of recovery by measuring the responses at fixed times after the flash. The measurement time was set to just before the point at which the experimental traces clearly deviated from the rising phase theory; i.e. at 5·5 ms for bright flashes, and at 14 ms for dim flashes, as indicated by the dashed vertical lines in Fig. 4C and D. The results of these measurements are plotted as the open symbols in Fig. 5.
In Fig. 5A the amplitudes of the bright flash responses measured at 5·5 ms are indicated by the open squares. As in the case of the filled symbols, the recovery of response amplitude measured in this way follows an S-shaped time course. Under dark-adapted conditions prior to the bleach, the amplitude of the response at 5·5 ms was about 168 μV, or 86 % of the value of -amax= 195 μV that we used in fitting the family (compare the open and filled squares prior to time zero in Fig. 5A). Accordingly, the dashed curve in Fig. 5A is plotted as the continuous curve scaled vertically by 0·86.
Figure 5B (open triangles) plots the measured amplitudes of the dim flash responses for all the trials presented (rather than just for the representative traces illustrated in Fig. 4D), at the fixed time of 14 ms after the flash. The recovery of the dim-flash response amplitude also follows an S-shaped time course, but it is delayed by about 2 min relative to the recovery of the bright flash response amplitudes. Thus, the time to half-recovery is approximately 17 min in Fig. 5B, compared with approximately 15 min in Fig. 5A. According to eqn (7), the response amplitude measured at a fixed time after flashes of constant dim intensity ought to be approximately proportional to the product amaxA′. Therefore, we have divided the values shown as open symbols in Fig. 5B (proportional to amaxA′) by the values plotted as the dashed curve fitted in Fig. 5A (proportional to amax), to provide estimates that we expect should be proportional to A′, and these results are shown as the open symbols in Fig. 5C.
It should be noted that the vertical scalings for the filled and open symbols in Fig. 5 differ. In Fig. 5A the open symbols were measured at a fixed time of 5·5 ms, and therefore represent about 86 % of amax, plotted as the filled symbols. And in panels B and C the open symbols have been plotted on separate co-ordinate scales, because we have not explicitly incorporated the factor ½Φ (t - td)2 from eqn (7); for the 50 μs flash measured at t= 14 ms, this factor would equal 0·087 s2.
After allowance for the different vertical scalings, comparison of the filled and open symbols in Fig. 5 indicates that the two methods generate closely similar estimates for the time course of recovery of maximal response amax (in Fig. 5A), and of the product amaxA′ (in Fig. 5B). The respective estimates of A′ (in Fig. 5C) are less reliable, but the two methods again generate a broadly similar time course. The overall correspondence in the three panels indicates that the simpler and more objective approach of Method 2 achieves results closely comparable with those obtained by the much more time consuming (but arguably more rigorous) approach of Method 1. The simpler approach does, however, suffer the minor shortcoming that without further scaling (by the factor ½Φ (t - td)2) it provides measures which are only proportional to, rather than equalto, the product amaxA′ and apparent amplification constant A′.
Equations for the recovery of transduction parameters
The curves plotted in Fig. 5 (and subsequently in Figs 6–9) use the equations:
| (9) |
and
| (10) |
The terms amax(∞) and A(∞) denote the dark-adapted values of the two variables, and T denotes post-bleach time. For amax in eqn (9), the constant ca specifies the degree of reduction immediately after the bleach, and τa is the time constant of recovery; a theoretical basis for this equation will be presented later. The expression for A′ in eqn (10) is based on the simplest assumption that the true amplification constant A is unchanged, but that its apparent value is reduced by the lowered quantum catch, which will be proportional to the fractional quantity of rhodopsin, Rh; τRh is the regeneration time constant for rhodopsin, and B is the size of the bleach. Curves plotted for amaxA′ are the product of eqns (9) and (10). The values of parameters used for the curves in each figure are given in the respective legends.
Figure 6. Recovery of normalized parameters following a full bleach.
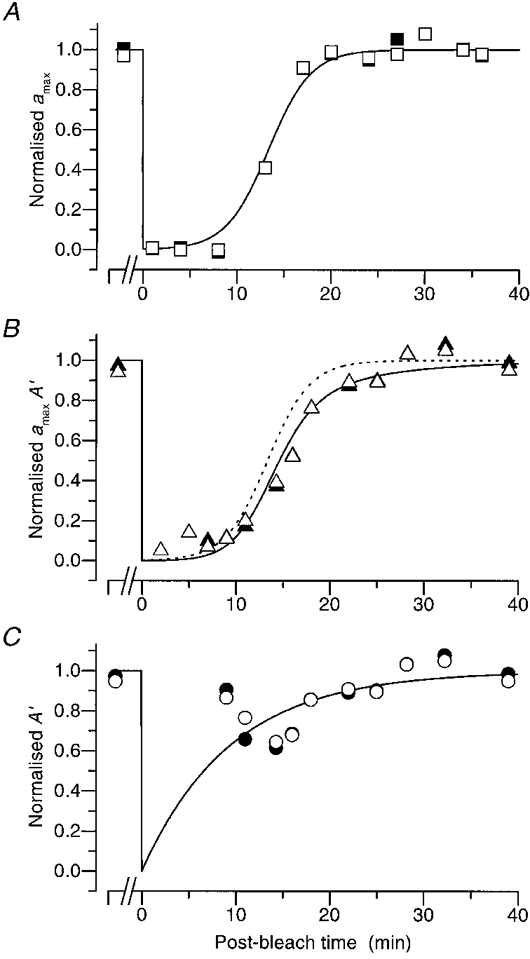
Normalized values of the parameters of transduction, estimated using our two approaches, are plotted for another subject (FD) following a full bleach, using the same symbols as in Fig. 5. A, ▪, amax; B, ▴, product amaxA′; C, •, apparent amplification constant A′; each was determined from the first approach (iterative fitting of the rising phases). The corresponding open symbols are the estimates obtained by the second approach (measurement at fixed time). The continuous curves are as Fig. 5, with ca= 375, τa= 2·25 min, and τRh= 9·5 min. In order to make apparent the delay between the recovery of amax and of the product amaxA′, the curve from panel A has been redrawn in panel B as the dashed curve. In this experiment the pre-bleach estimates were based on measurements made between 10 and 12 min prior to delivery of the bleach.
Figure 9. Conversion to ‘equivalent background intensity’.
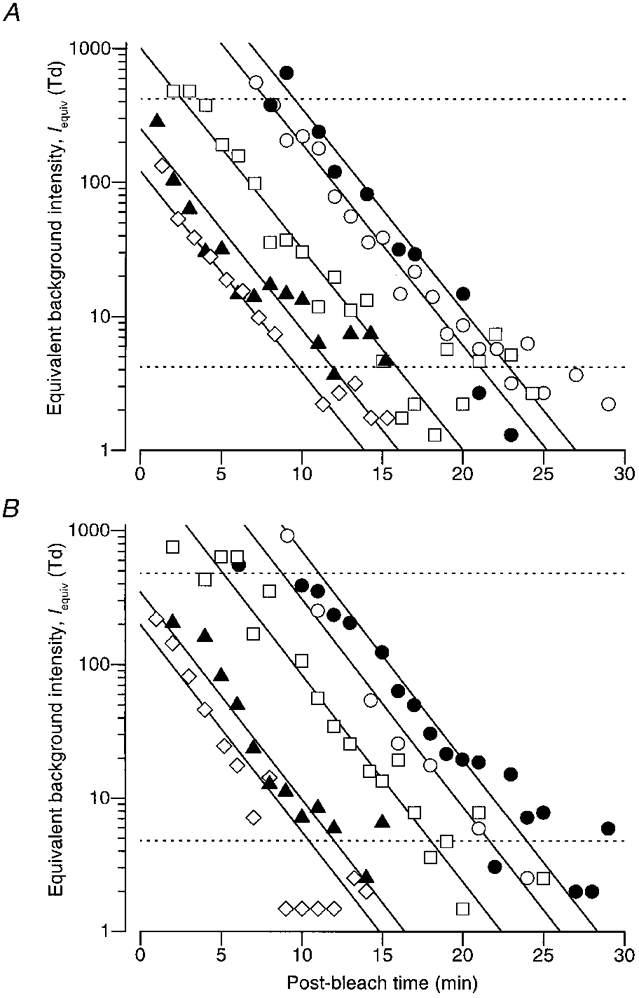
The results from panels B and C of Fig. 8 have been converted to ‘equivalent background intensity’ using the measured light adaptation results for the same subjects; i.e. the ‘Crawford transformation’ has been applied to them. The dashed horizontal lines indicate levels of 1 log unit above and below the value of I0 for the two subjects, and delineate the range within which the results will be most reliable. The continuous straight lines plot eqn (11), using the parameters tabulated in the legend to Fig. 8.
Normalized plots
The recovery of transduction parameters following a full bleach is plotted in Fig. 6 for another subject. In this figure the vertical scales have been normalized, in order to aid comparison of the results obtained by the two approaches. Equations (9) and (10) were fitted to the raw results, to obtain the scaling parameters amax(∞) and A(∞), which were then used in the normalization. (Since this fitting was done over the full range of times, from pre-bleach to full recovery, the normalization does not necessarily set the pre-bleach points to unity.)
The recovery of amax (panel A) and of the product amaxA′ (panel B) each follow an S-shaped curve. However, the recovery of the product is delayed by about 2 min from that of amax, as may be seen from the dashed curve in Fig. 6B, which reproduces the continuous curve from Fig. 6A. As in Fig. 5, the results obtained by the two approaches (filled and open symbols) are very similar to each other, and are about equally well described by the curves. All the bleaching recovery results in this paper were analysed using both methods, and the agreement was close.
Collected results for recovery after full bleaches
Figure 7 plots the normalized recovery of amax, of the product amaxA′, and of the apparent amplification constant A′, obtained from three subjects, following ten full bleaches. The open symbols are for subject TDL tested with five full bleaches, one of which was shown in Fig. 5; the filled symbols are for subject MMT tested with three full bleaches; and the × and + are for subject FD tested with two full bleaches, one of which was shown in Fig. 6. Not surprisingly, the estimates for A′ show the greatest variability, as they are derived essentially from the ratio of responses to dim and bright flashes. For each subject the recoveries of amax and amaxA′ appear fairly reproducible, following a similar time course in the different bleaching trials. Across the three observers the kinetics of recovery are broadly similar. The three curves in each panel are representative of the recoveries for the three subjects, and the parameters of these curves are given in the legend. The curves reached 50 % recovery at 13·3, 15·4 and 16·3 min for amax, and at 14·6, 16·8 and 18·2 min for the product amaxA′. Thus, the curves in panel B lagged behind those in panel A by 1·3, 1·4 and 1·9 min.
Figure 7. Recovery of amax, A′, and their product, for three subjects following full bleaches.
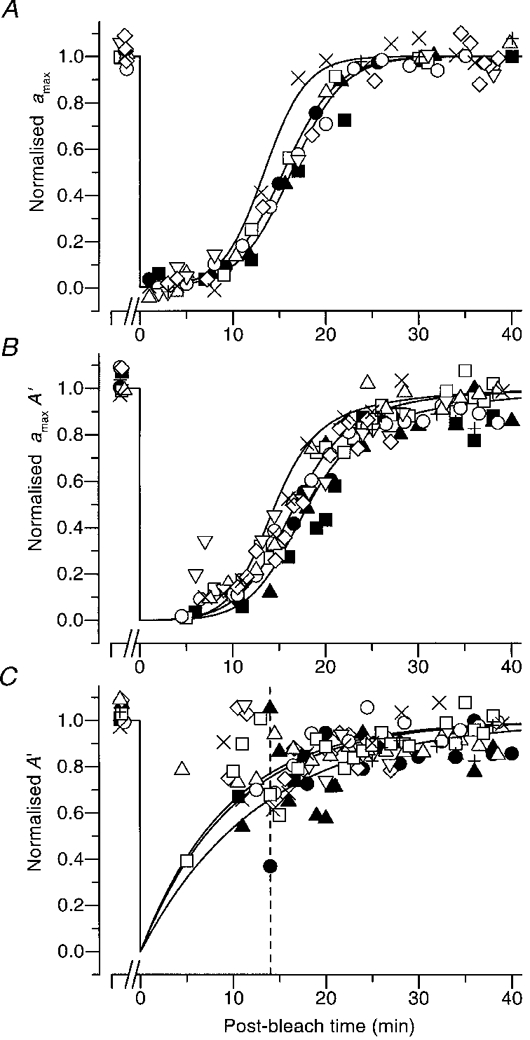
Collected estimates of normalized amax, amaxA′ and A′ for three subjects following full bleaches, in a total of 10 experiments. The subjects were: FD, ×, +; TDL, five open symbols; MMT, three filled symbols. In all cases the first approach (iterative fitting of the rising phase) was used. The measurements in panel C are unreliable at early times (e.g. to the left of the dashed vertical line at 14 min), when amax in panel A is small. The curves in each panel are representative recoveries for the three subjects. The curves in panel A plot eqn (9), and have times to half-maximal recovery of 13·3, 15·4 and 16·3 min. The curves in panel B plot the product of eqn (10) and the respective curve in panel A, and have times to half-maximal recovery of 14·6, 16·8 and 18·2 min. The curves in panel C plot eqn (10). The values of ca, τa and τRh used for the three cases were: FD: 375, 2·25 min, 9·5 min; TDL: 202, 2·9 min, 10 min; MMT: 333, 2·8 min, 13 min.
In considering the collected results for the apparent amplification constant A′ in Fig. 7C, it is important to bear in mind that the estimates have very low reliability prior to 13-15 min of recovery, because of the dramatic reduction in amax at early post-bleach times. However, by discounting the measurements prior to 14 min (dashed vertical line), it does appear that A′ is significantly reduced following a bleach. Thus, at 15 min post-bleach (when amax is roughly half-recovered in Fig. 7A), the measurements of A′ are around 70-80 % of the pre-bleach level. Furthermore, in the region subsequent to 14 min of recovery, there is no reason to rule out the fit of eqn (10) shown for each of the three subjects, although clearly the magnitudes of the extracted time constants can only be regarded as approximate. Hence, our main findings with respect to the amplification constant are, firstly, that A′ appears to be reduced somewhat at post-bleach times sufficiently late that it can be measured with reasonable accuracy and secondly, that our results are consistent with our null hypothesis that the true value of A is unchanged and that the apparent size simply follows the time course of regeneration of rhodopsin. Collected estimates for the recovery time constants τa and τRh are given in Table 2.
Recovery following a range of bleaches
The recovery of normalized amax following a range of intense exposures is plotted in Fig. 8, for the same three subjects as in Fig. 7. Each subject was tested with a total bleach (•) using the mini-ganzfeld, and with a range of partial bleaches in the main ganzfeld. In order to obtain frequent measurements of amax, most of the results in panels B and C were obtained in experiments where dim flashes were not presented, and instead bright flashes were delivered at 1 min intervals. Accordingly the results in these panels have been analysed using the second approach: measurement at a fixed time.
Figure 8. Recovery of amax for the three subjects following a range of bleaches.
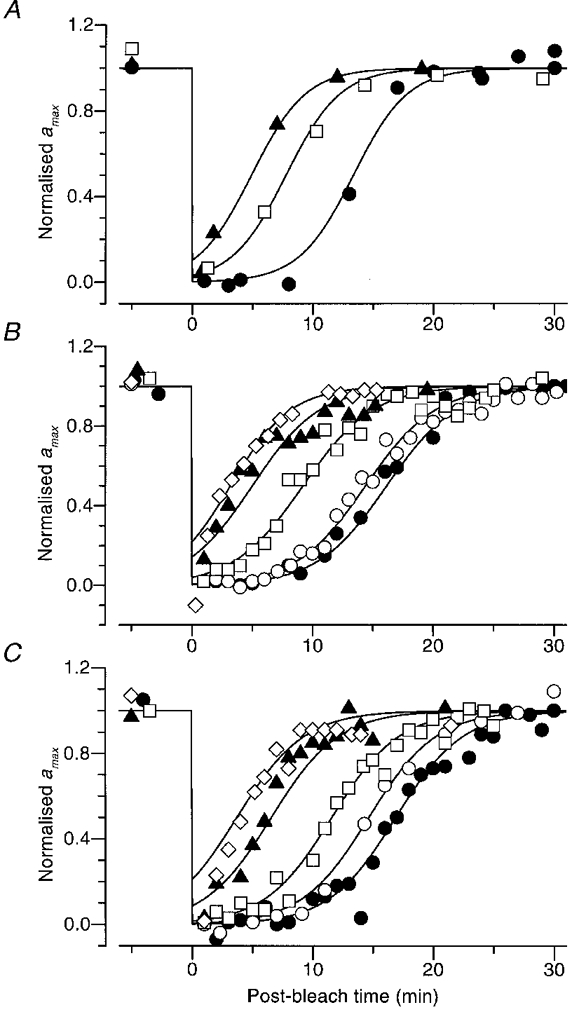
Each panel plots the normalized recovery of amax for a different subject at a range of bleaches; the subjects were the same as in Fig. 7. In all cases the curves plot eqn (9), obtained by substitution of eqn (11) into eqn (8); the parameter ca in eqn (9) is then equal to Iequiv(0)/I0, where Iequiv(0) is the initial magnitude of the equivalent background intensity and I0 is the half-saturating intensity for steady backgrounds. For the three observers, we had previously obtained I0= 80, 42 and 48 Td for panels A, B and C, respectively (see Table 2). A, recovery for subject FD, determined in two sessions following bleaches estimated as 16, 47 and 100 %. In panel A dim flashes were also presented during recovery, and amax was determined using the first approach (iterative fitting). B, recovery for subject TDL, following bleaches estimated as 8, 15, 47 and 91 %, and two bleaches of 100 %. C, recovery for subject MMT, following bleaches estimated as 8, 15, 46, 69 and 100 %. In panels B and C the results were analysed using the second approach (measurement at fixed time). Symbols, bleach levels and parameters of the curves for the three subjects were: 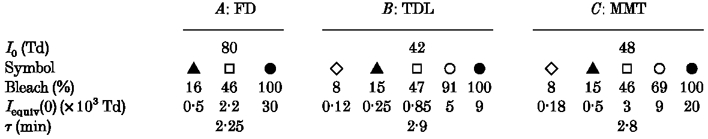
As expected, the recovery of maximal response occurred more rapidly as the size of the bleach declined. After small bleaches (less than 15 %), amax began recovering with negligible delay, but once the bleaching level exceeded about 40 % the recovery became distinctly S-shaped, with an early period of nearly complete suppression of the a-wave responses. The curves drawn near the points are each described by eqn (9), and the parameters are given in the legend.
Equivalent background intensity
The results of Fig. 8 can be converted to ‘equivalent background intensity’ by applying what has become known in the psychophysical literature as the ‘Crawford transformation’ (Crawford, 1947; Blakemore & Rushton, 1965; Barlow, 1972). By taking the inverse of the relationship that we found to relate background intensity to maximal response in the light-adaptation experiments of Fig. 3, we can convert the values of amax in Fig. 8 to the equivalent levels of real light that would have caused the observed response, had the eye remained unbleached. Inversion of eqn (8) gives the relation:
| (11) |
where the equivalent background intensity, Iequiv, now replaces the real background intensity, IB. This transformation has been applied to the results for amax from the lower two panels of Fig. 8, to generate the equivalent background intensities Iequiv in Fig. 9.
Due to the presence of significant noise in the recordings, this procedure is only reliable for values of amax between about 10 and 90 % of the dark-adapted level, which transform to equivalent intensities within a range of roughly a decade above and below I0, as indicated by the dashed horizontal lines in Fig. 9. Within this range, the points obtained after each bleach decay roughly as parallel straight lines in the semi-logarithmic co-ordinates of Fig. 9, indicating approximately first-order decay with a fixed time constant. The straight lines plot:
| (12) |
where Iequiv(T) is the equivalent background intensity at post-bleach time T, Iequiv(0) is its level at the instant the bleaching light was extinguished, and τequiv is the time constant of its decline. Within the range indicated by the dashed horizontal lines, these exponential decays provide a reasonable description of the equivalent backgrounds obtained by transformation from the maximal response, amax. The time constant τequiv was held constant at 2·9 min in the upper panel (for TDL) and at 2·8 min in the lower panel (for MMT). In four other subjects we obtained time constants between 2·25 and 4 min (Table 2).
Basis for the choice of eqn (9)
The exponential decline of equivalent background intensity observed in the experiments of Fig. 9 provided the basis for our choice of the form of eqn (9), which was used in the previous figures for the recovery of amax(T). Substitution of the expression for Iequiv(T) from eqn (12), as the background intensity IB in eqn (8), yields the expression for amax(T) presented in eqn (9), with the constant ca given by ca=Iequiv(0)/I0 and with τa=τequiv.
Dependence of recovery time on size of bleach
From the plots of Figs 8 or 9, it is possible to examine the dependence of recovery time on the size of the bleach. By setting a criterion level, at some defined value of amax (or at the corresponding value of equivalent background), one can measure the time taken for the response to recover to that extent, as a function of the size of the bleach. To minimize the influence of noise in the recordings, it is desirable to set the criterion level at a point where the slope of recovery is reasonably large; e.g. for amax between, say, 25 and 75 % of its dark-adapted amplitude.
We made measurements of bleaching recovery in seven of the eight subjects listed in Table 2 (AH was only studied in light-adaptation experiments). In Fig. 10 we have plotted recovery time, at a criterion level of 50 % restoration of amax, as a function of the estimated size of the bleach, for six of these seven subjects. For each of these subjects the observed behaviour was broadly similar, with recovery time increasing with increasing bleach, at least for estimated bleaching levels of up to about 70 %. We have omitted the results from one subject (GW), for whom we were unable to obtain reproducible results. For this subject, very substantial a-wave responses were obtained as soon as the bleaching light was extinguished, and we suspect a problem with the bleach delivery.
Figure 10. Dependence of time to 50 % recovery on magnitude of the bleach.
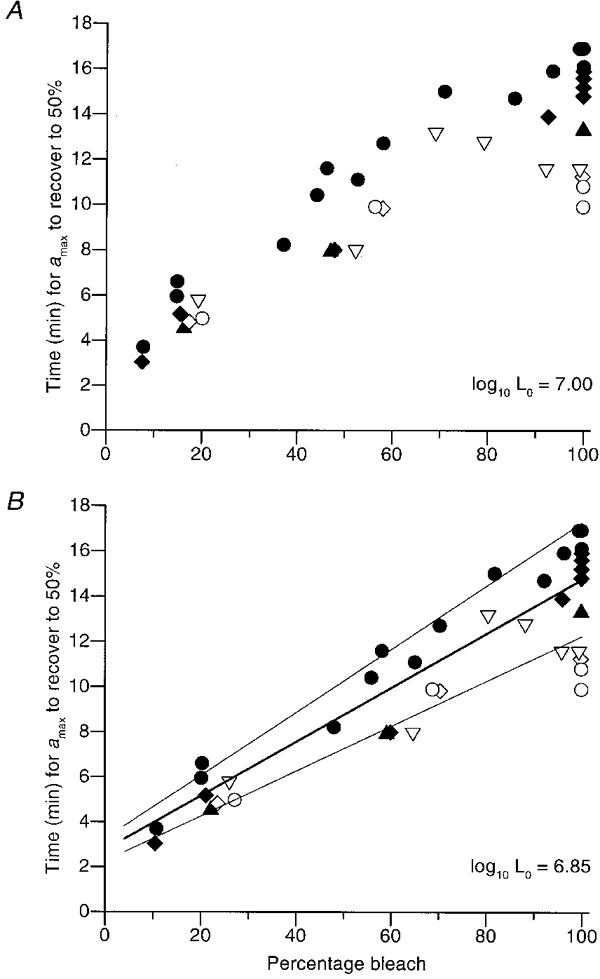
The time taken for amax to recover to 50 % of its original level is plotted as a function of the estimated size of the bleach. These results were obtained from six subjects (identified by symbols in Table 2), following 40 separate bleaching exposures. All the points very close to 100 % estimated bleach were obtained in the mini-ganzfeld using steady exposures of 60 s duration, whereas all the fractional bleaches were obtained in the main ganzfeld using flash exposures (see Methods). The calculation of bleach magnitude was made using eqn (4) for steady lights, and using eqn (5c) for flashes. The bleaching constant was taken as LRh= 107 Td s in panel A, and 106·85 Td s in panel B. In both panels the points are plotted for a regeneration time constant of τRh= 10 min, but the precise value had little effect. Altering τRh from 7 min (the value in the densitometry literature) to 15 min (the maximum value that we found for the recovery of A′) caused the estimated bleaching level to change by a maximum of ± 2 % (and by a mean of ± 0·5 %) from the value plotted with τRh= 10 min for each point. Thus, the ‘error range’ was less than the symbol width for most points, and has not been plotted. The lines in panel B have slopes of 10, 12 and 14 min per 100 % bleach.
The relationship between recovery time and estimated bleaching level in Fig. 10A appears curved, whereas psychophysical measures of recovery time as a function of bleach yield a relationship that is close to linear (Pugh, 1975; Lamb, 1981). However, the horizontal accuracy of the points in Fig. 10A depends strongly on the value we have assumed for the bleaching constant in eqn (4), and also to a lesser extent on the value assumed for the rhodopsin regeneration time constant. For the sake of round numbers, we adopted the upper end of the range of log10LRh= 6·8-7·0 log Td s reported by Rushton & Powell (1972) and Alpern & Pugh (1974). Those values were obtained in the parafovea (∼10 deg), whereas the a-wave signals in our experiments are dominated by rods in the peripheral retina (because the periphery occupies such a large area). Since the diameter of rod inner segments is larger in the peripheral retina than in the parafovea (Polyak, 1941), light collection is likely to be greater, and the bleaching constant is therefore expected to be smaller. In Fig. 10B we have examined the effect of reducing our assumed value of log10LRh slightly, to 6·85 log Td s (still within the range reported in the parafovea). The points for the different observers then appear to exhibit an almost linear relation between recovery time and estimated bleaching level. The thick line plots a slope of 12 min per 100 % bleach, while the two narrower lines plot slopes of 10 and 14 min per 100 % bleach.
DISCUSSION
By measuring the a-wave of the human electroretinogram during light adaptation and dark adaptation, we have been able to monitor the changes that occur in two parameters: amax, the maximal amplitude of the a-wave, which represents a measure of the massed circulating current of the rod photoreceptors; and A, the amplification constant of transduction within the rod outer segments. (In the bleaching experiments, the amplification constant was an apparent one, A′, because we did not have an independent measure of the rhodopsin content.)
Light adaptation
During light adaptation, we found that amax decreased steadily as the intensity of the background was increased. The suppression of circulating current followed a hyperbolic relation as a function of intensity (eqn (8), often referred to as a Naka-Rushton relation). Such a relation is significantly shallower than the exponential saturation expected in the absence of photoreceptor adaptation, and this finding coincides closely with results for steady backgrounds in suction pipette recordings from isolated rods of various mammalian species (Tamura et al. 1989, 1991, in cat and primates; Kraft et al. 1993, in human) and also with results of ERG a-wave recordings from mouse by Lyubarsky et al. (1999).
We found that the steady intensity needed to halve amax averaged 70 scotopic Td, corresponding to about 600 photoisomerizations s−1 per rod. This is similar to the value of about 100 Td that can be extracted for one subject from Fig. 7B of Pepperberg et al. (1997). It also compares reasonably closely with the range of 100-400 photoisomerizations s−1 per rod reported by Tamura et al. (1991) for isolated primate rods, and with the value of 250 photoisomerizations s−1 per rod found recently by Lyubarsky et al. (1999) in mouse a-wave experiments. It is also close to the single value that we were able to extract from Fig. 8 of Kraft et al. (1993), of about 500 photoisomerizations s−1 per rod, in experiments on isolated human rods. Thus it seems that there is a close correspondence between the suppression of circulating current measured in isolated mammalian rods and the suppression of amax in the ERG, not only in the form of the relation but also in the absolute level of intensity required.
In the light adaptation experiments, we also measured the amplification constant of transduction in the outer segments. In seven of ten experiments we found negligible change in A, in the presence of background illumination that reduced amax to as little as a quarter of its dark-adapted level. In the other three experiments the extracted values of A declined by 30-55 % for backgrounds that were approximately half-saturating. Hence our results indicate that, in human rods, the amplification constant of transduction changes relatively little in the presence of background illumination. These observations agree with the findings of Hood & Birch (1993) who analysed the human rod a-wave under two levels of background illumination and found that any change in the gain of rod phototransduction was small, even when the response amplitude was reduced by about 45 % from its dark-adapted level.
Our measure of the gain of phototransduction (defined by the ‘amplification constant’A), differs from the ‘sensitivity’ of the response: sensitivity is usually defined in terms of the amplitude measured at the time-to-peak of the response to a dim flash, rather than in terms of the rising phase of the response. But since only the earliest phase of the ERG represents the photoreceptor signal free from b-wave intrusion, we are unable to determine the rod sensitivity at the peak using our single-flash protocol. It would be interesting to extend our a-wave measurements, by using the double-flash technique of Pepperberg et al. (1997), in order to examine the dependence of sensitivity on background intensity, in vivo. In their study Pepperberg et al. reported a severalfold reduction in sensitivity at backgrounds of 32-50 Td, and a 5-fold reduction at 630 Td. In suction pipette experiments on isolated primate rods, Tamura et al. (1991) reported that the sensitivity declined to half at a background intensity of 30-50 photoisomerizations s−1 per rod, corresponding to about 5 Td.
We can summarize the changes in rod activity that occur in steady light as follows. Suppression of the rod's circulating current is half-maximal at about 70 scotopic Td, which corresponds well with the intensity at which the Weber- Fechner fraction of the scotopic visual system begins to rise, as saturation approaches (Aguilar & Stiles, 1954). At this intensity, little change has occurred in the amplification constant determined from the early rising phase of the rod's response. From work on isolated rods, desensitization of the peak of the flash response (at 100-200 ms) is half-maximal at an intensity about an order of magnitude lower, at around 5 scotopic Td. In the overall visual system the difference is even more striking, since much of the adaptation is post-receptoral, and Weber-law desensitization sets in at extremely low intensities, of around 10−3 scotopic Td (Aguilar & Stiles, 1954).
Dark adaptation: methodology
In order to measure the changes in amax and A that occur during the period of dark adaptation following bleaching exposures, we applied procedures similar in principle to those used with backgrounds, but modified to cope with the continually changing conditions; i.e. the non-stationarity. We chose two standard flash intensities, one bright and one dim, which we presented at intervals during recovery. If the bright flashes had been made extremely bright, they would have provided an accurate estimate of the instantaneous values of amax, but they would have perturbed the experiment by causing additional bleaching. Similarly, if the dim flashes had been made extremely dim, they would have provided a measure that was directly proportional to the product amaxA′, but the signals would have been completely submerged in noise. We were therefore obliged to compromise, by choosing a high intensity that caused minimal bleaching (typically 0·3 %) but that elicited a rapidly saturating response, and a low intensity that elicited a reliably measurable response that remained broadly within the linear range.
We then applied two methods of analysis: fitting predicted equations to the onset phase of the responses, and measurement at fixed times. In practice, we found the second of these approaches to be much simpler, yet it extracted values for amax and amaxA′ that were closely similar to those obtained by the more complicated first method, which required iterative attempts at fitting. Having found a close correspondence between the two sets of extracted results we are confident that they provide a reasonably accurate measure of the underlying parameters. For families of a-wave responses, Hood et al. (1993) similarly concluded, under dark-adapted conditions, that measurement at a fixed time (10 ms) provided a simple and accurate method of extracting the parameters of transduction.
Recovery of amax and A′ following bleaches
After full bleaches the recovery of amax followed a similar time course for each of three subjects who were examined on a number of occasions (Fig. 7A). The recovery was S-shaped, reaching half its maximum after 14-17 min, and achieving almost total recovery within 25-30 min. The recovery could be described by an equation based on the notion that the equivalent background intensity declines exponentially with time, and that this equivalent background suppresses the circulating current in the same way that real light does (eqn (9)).
Measurements of the time course of recovery of the apparent amplification constant A′ were less reliable, because this parameter was derived from the ratio of dim-flash to bright-flash responses, and was therefore subject to greater noise. The problem was particularly acute at early times after large bleaches, when the maximal response (amax) was almost completely suppressed. However, we consistently found that, at about 15 min after a full bleach, when substantial recovery of amax had occurred, the estimates of A′ were reduced to about 70-80 % of their dark-adapted level, and that full recovery of A′ appeared to take at least 25 min (Fig. 7C). Measurements of the product amaxA′ could be made more accurately, and following full bleaches these showed a recovery that was delayed by roughly 2 min from the recovery of amax (Fig. 7B), consistent with a delay in the recovery of A′.
An apparent reduction in amplification constant is not surprising, but is in fact expected from the reduced quantum catch that results from pigment depletion following a bleach. Therefore, in our analysis we made the simplest assumption - that the true amplification constant A is unchanged, so that the apparent reduction and subsequent recovery result solely from lowered pigment levels. We presumed that rhodopsin is regenerated according to first-order kinetics with a time constant τRh (see Rushton, 1965; Alpern, 1971), which led to the expression for A′ in eqn (10). For each of the six subjects studied, we found that eqn (10) provided an adequate description of the results, although there was a high level of noise in these measurements. The values that we extracted for the regeneration time constant τRh were somewhat longer than previously reported in the literature on densitometry. Thus, we obtained values of 13, 10, 15, 9·5, 13 and 9 min (mean 11·6 min) for the six individuals, whereas the generally accepted value obtained by retinal densitometry is around 7 min (Alpern, 1971). We suggest that part of the reason for the discrepancy may relate to ‘self-screening’ of visual pigment. In the double pass of light through the receptor outer segments in reflection densitometry, the final (high) pigment density is likely to be underestimated, whereas the initial (low) changes in density are more likely to be recorded accurately. This would lead to an underestimate of the regeneration time constant by densitometry.
Comparison with psychophysical recovery
The families of a-wave recoveries illustrated in Fig. 8 bear a striking resemblance to families of recovery of visual threshold measured psychophysically in human observers (e.g. Hecht et al. 1937, Fig. 2; Pugh, 1975, Fig. 3; Jacobson et al. 1996, Fig. 4), where the psychophysical threshold curves are plotted on a logarithmic ordinate scale. Furthermore, the dependence of recovery time upon bleach level is similar in the two cases. Thus, the behaviour plotted in Fig. 10, for the time taken for 50 % recovery of the maximal a-wave, is closely similar to the time taken for visual sensitivity to recovery to a level of about 2·5 log units above absolute threshold (see Fig. 3 of Pugh, 1975, redrawn as Fig. 6 of Lamb, 1981). In both situations, the relationship between recovery time and bleaching level is roughly linear, with a slope of around 12 min per 100 % bleach.
These similarities are consistent with the idea that the recovery of sensitivity in the overall scotopic visual system is dependent on events within the rod photoreceptors. However, we are not proposing that the reduction in circulating current in the rods actually causes the elevation of visual threshold. Instead, it seems likely that residual activation of transduction, generated by the presence of photoproducts of bleaching, leads both to the suppression of circulating current in the photoreceptors and also to the elevation of threshold for the detection of stimuli by the overall visual system. For a recent review of the molecular mechanisms thought to be involved in the residual activation of transduction, see Leibrock et al. (1998).
In fitting the time course of decay of the equivalent background intensity in the two subjects for whom we obtained extensive results, we found exponential decays with time constants of 2·8 and 2·9 min (Fig. 9); in four other subjects the values ranged from 2·25 to 4 min. These time constants, obtained from recovery of the a-wave, are somewhat larger than the time constant of 1·8 min (105 s) obtained by Lamb (1981, Fig. 2) for the exponential decay of the ‘second component’ of equivalent background in psychophysical recovery. But given the differences in methodology, these values are not too dissimilar. Thus, these two very different manifestations of recovery from bleaching exhibit kinetics that are broadly comparable with each other. In the future, we would hope that the dark-adaptation recovery results for a-wave responses and for psychophysics could be tied together even more closely, with the aim of providing a comprehensive description of bleaching recovery.
Acknowledgments
We wish to thank Ms Katie Gilkes for help with early experiments, and Drs Samuel G. Jacobson and Artur V. Cideciyan for sharing unpublished data. We are very grateful to Christine Couldrey, Fiona Duncan, Christoph Friedburg, Annette Harsch, Garth Smith and Gary Whitlock for their continual good humour and patience, as subjects. Supported by grants from The Wellcome Trust (034792) and the Human Frontiers Science Program (RG-62/94).
References
- Aguilar M, Stiles WS. Saturation of the rod mechanism of the retina at high levels of stimulation. Optica Acta. 1954;1:59–65. [Google Scholar]
- Alpern M. Rhodopsin kinetics in the human eye. The Journal of Physiology. 1971;217:447–471. doi: 10.1113/jphysiol.1971.sp009580. [DOI] [PMC free article] [PubMed] [Google Scholar]
- Alpern M, Pugh EN., Jr The density and photosensitivity of human rhodopsin in the living retina. The Journal of Physiology. 1974;237:341–370. doi: 10.1113/jphysiol.1974.sp010485. [DOI] [PMC free article] [PubMed] [Google Scholar]
- Barlow HB. Dark and light adaptation: psychophysics. In: Jameson D, Hurvich LM, editors. Handbook of Sensory Physiology. VII/4. Berlin: Springer; 1972. pp. 1–28. [Google Scholar]
- Blakemore CB, Rushton WAH. Dark adaptation and increment threshold in a rod monochromat. The Journal of Physiology. 1965;181:612–628. doi: 10.1113/jphysiol.1965.sp007786. [DOI] [PMC free article] [PubMed] [Google Scholar]
- Breton ME, Schueller AW, Lamb TD, Pugh EN., Jr Analysis of ERG a-wave amplification and kinetics in terms of the G-protein cascade of phototransduction. Investigative Ophthalmology and Visual Science. 1994;35:295–309. [PubMed] [Google Scholar]
- Cideciyan AV, Jacobson SG. An alternative phototransduction model for human rod and cone ERG a-waves: normal parameters and variation with age. Vision Research. 1996;36:2609–2621. doi: 10.1016/0042-6989(95)00327-4. [DOI] [PubMed] [Google Scholar]
- Crawford BH. Visual adaptation in relation to brief conditioning stimuli. Proceedings of the Royal Society of London. 1947;B 134:283–302. doi: 10.1098/rspb.1947.0015. [DOI] [PubMed] [Google Scholar]
- Donner K, Hemilä S, Koskelainen A. Light adaptation of cone photoresponses studied at the photoreceptor and ganglion cell levels in the frog retina. Vision Research. 1998;38:19–36. doi: 10.1016/s0042-6989(97)00144-2. [DOI] [PubMed] [Google Scholar]
- Dowling JE. Neural and photochemical mechanisms of visual adaptation in the rat. Journal of General Physiology. 1963;46:1287–1301. doi: 10.1085/jgp.46.6.1287. [DOI] [PMC free article] [PubMed] [Google Scholar]
- Frishman LJ, Reddy MG, Robson JG. Effects of background light on the human dark-adapted electroretinogram and psychophysical threshold. Journal of the Optical Society of America. 1996;A 13:601–612. doi: 10.1364/josaa.13.000601. [DOI] [PubMed] [Google Scholar]
- Fulton AB, Rushton WAH. The human rod ERG; correlation with psychophysical responses in light and dark adaptation. Vision Research. 1978;18:793–800. doi: 10.1016/0042-6989(78)90119-0. [DOI] [PubMed] [Google Scholar]
- Hecht S, Haig C, Chase AM. The influence of light adaptation on subsequent dark adaptation of the eye. Journal of General Physiology. 1937;20:831–850. doi: 10.1085/jgp.20.6.831. [DOI] [PMC free article] [PubMed] [Google Scholar]
- Hollins M, Alpern M. Dark adaptation and visual pigment regeneration in human cones. Journal of General Physiology. 1973;62:430–447. doi: 10.1085/jgp.62.4.430. [DOI] [PMC free article] [PubMed] [Google Scholar]
- Hood DC, Birch DG. A quantitative measure of the electrical activity of human rod photoreceptors using electroretinography. Visual Neuroscience. 1990;5:379–387. doi: 10.1017/s0952523800000468. [DOI] [PubMed] [Google Scholar]
- Hood DC, Birch DG. Light adaptation of human rod receptors: the leading edge of the human a-wave and models of rod receptor activity. Vision Research. 1993;33:1605–1618. doi: 10.1016/0042-6989(93)90027-t. [DOI] [PubMed] [Google Scholar]
- Hood DC, Birch DG. Rod phototransduction in retinitis pigmentosa: estimation and interpretation of parameters derived from the rod a-wave. Investigative Ophthalmology and Visual Science. 1994;35:2948–2961. [PubMed] [Google Scholar]
- Hood DC, Shady S, Birch DG. Heterogeneity in retinal disease and the computational model of the human-rod response. Journal of the Optical Society of America. 1993;A 10:1624–1630. doi: 10.1364/josaa.10.001624. [DOI] [PubMed] [Google Scholar]
- Jacobson SG, Cideciyan AV, Kemp CM, Sheffield VC, Stone EM. Photoreceptor function in heterozygotes with insertion or deletion mutations in the RDS gene. Investigative Ophthalmology and Visual Science. 1996;37:1662–1674. [PubMed] [Google Scholar]
- Kraft TW, Schneeweis DM, Schnapf JL. Visual transduction in human rod photoreceptors. The Journal of Physiology. 1993;464:747–765. doi: 10.1113/jphysiol.1993.sp019661. [DOI] [PMC free article] [PubMed] [Google Scholar]
- Lamb TD. The involvement of rod photoreceptors in dark adaptation. Vision Research. 1981;21:1773–1782. doi: 10.1016/0042-6989(81)90211-x. [DOI] [PubMed] [Google Scholar]
- Lamb TD. Dark adaptation: a re-examination. In: Hess RF, Nordby K, Sharpe LT, editors. Night Vision. Cambridge: Cambridge University Press; 1990. pp. 177–222. [Google Scholar]
- Lamb TD, McNaughton PA, Yau K-W. Spatial spread of activation and background desensitization in toad rod outer segments. The Journal of Physiology. 1981;319:463–496. doi: 10.1113/jphysiol.1981.sp013921. [DOI] [PMC free article] [PubMed] [Google Scholar]
- Lamb TD, Pugh EN., Jr A quantitative account of the activation steps involved in phototransduction in amphibian photoreceptors. The Journal of Physiology. 1992;449:719–758. doi: 10.1113/jphysiol.1992.sp019111. [DOI] [PMC free article] [PubMed] [Google Scholar]
- Leibrock CS, Reuter T, Lamb TD. Molecular basis of dark adaptation in rod photoreceptors. Eye. 1998;12:511–520. doi: 10.1038/eye.1998.139. [DOI] [PubMed] [Google Scholar]
- Liebman PA. Microspectrophotometry of photoreceptors. In: Dartnall HJA, editor. Handbook of Sensory Physiology. VII/1. Berlin: Springer; 1972. pp. 481–528. [Google Scholar]
- Lyubarsky AL, Falsini B, Pennesi ME, Valentini P, Pugh EN., Jr UV- and midwave-sensitive cone-driven retinal responses of the mouse: a possible phenotype for co-expression of cone photopigments. Journal of Neuroscience. 1999;19:442–455. doi: 10.1523/JNEUROSCI.19-01-00442.1999. [DOI] [PMC free article] [PubMed] [Google Scholar]
- Pepperberg DR, Birch DG, Hood DC. Photoresponses of human rods in vivo derived from paired-flash electoretinograms. Visual Neuroscience. 1997;14:73–82. doi: 10.1017/s0952523800008774. [DOI] [PubMed] [Google Scholar]
- Polyak SL. The Retina. Chicago: University of Chicago Press; 1941. [Google Scholar]
- Pugh EN., Jr Rushton's paradox: rod dark adaptation after flash photolysis. The Journal of Physiology. 1975;248:413–431. doi: 10.1113/jphysiol.1975.sp010982. [DOI] [PMC free article] [PubMed] [Google Scholar]
- Robson JG, Frishman LJ. Dissecting the dark-adapted electroretinogram. Documenta Ophthalmologica. 1999. in the Press. [DOI] [PubMed]
- Rushton WAH. The Ferrier Lecture, 1962. Visual adaptation. Proceedings of the Royal Society. 1965;B 162:20–46. doi: 10.1098/rspb.1965.0024. [DOI] [PubMed] [Google Scholar]
- Rushton WAH, Powell DS. The rhodopsin content and the visual threshold of human rods. Vision Research. 1972;12:1073–1081. doi: 10.1016/0042-6989(72)90098-3. [DOI] [PubMed] [Google Scholar]
- Shapley R, Enroth-Cugell C. Visual adaptation and retinal gain controls. Progress in Retinal Research. 1984;3:263–346. [Google Scholar]
- Smith NP, Lamb TD. The a-wave of the human electroretinogram recorded with a minimally invasive technique. Vision Research. 1997;37:2943–2952. doi: 10.1016/s0042-6989(97)00094-1. [DOI] [PubMed] [Google Scholar]
- Stiles WS, Crawford BH. Equivalent adaptational levels in localized retinal areas. In: Stiles WS, editor. Report of a Joint Discussion on Vision. Cambridge: Physical Society of London, Cambridge University Press; 1932. pp. 194–211. [Google Scholar]
- Tamura T, Nakatani K, Yau K-W. Light adaptation in cat retinal rods. Science. 1989;245:755–758. doi: 10.1126/science.2772634. [DOI] [PubMed] [Google Scholar]
- Tamura T, Nakatani K, Yau K-W. Calcium feedback and sensitivity regulation in primate rods. Journal of General Physiology. 1991;98:95–130. doi: 10.1085/jgp.98.1.95. [DOI] [PMC free article] [PubMed] [Google Scholar]
- Thomas MM, Lamb TD. Kinetics of post-bleach recovery of maximal response and amplification constant in human rod photoreceptors. The Journal of Physiology. 1997;504.P:30P. [Google Scholar]
- Thomas MM, Lamb TD. Dark adaptation recovery of human rod photoreceptors following partial bleaches. The Journal of Physiology. 1998a;506.P:87P. [Google Scholar]
- Thomas MM, Lamb TD. Measurement of human rod photoreceptor function during dark adaptation following bleaches. Investigative Ophthalmology and Visual Science. 1998b;39:S975. [Google Scholar]