

Abstract
Calcium sparks were examined in enzymatically dissociated mouse cardiac ventricular cells using the calcium indicator fluo-3 and confocal microscopy. The properties of the mouse cardiac calcium spark are generally similar to those reported for other species.
Examination of the temporal relationship between the action potential and the time course of calcium spark production showed that calcium sparks are more likely to occur during the initial repolarization phase of the action potential. The latency of their occurrence varied by less than 1·4 ms (s.d.) and this low variability may be explained by the interaction of the gating of L-type calcium channels with the changes in driving force for calcium entry during the action potential.
When fixed sites within the cell are examined, calcium sparks have relatively constant amplitude but the amplitude of the sparks was variable among sites. The low variability of the amplitude of the calcium sparks suggests that more than one sarcoplasmic reticulum (SR) release channel must be involved in their genesis. Noise analysis (with the assumption of independent gating) suggests that > 18 SR calcium release channels may be involved in the generation of the calcium spark. At a fixed site, the response is close to ‘all-or-none’ behaviour which suggests that calcium sparks are indeed elementary events underlying cardiac excitation-contraction coupling.
A method for selecting spark sites for signal averaging is presented which allows the time course of the spark to be examined with high temporal and spatial resolution. Using this method we show the development of the calcium spark at high signal-to-noise levels.
Calcium sparks are microscopic calcium release events from the sarcoplasmic reticulum (SR) which are produced by the gating of ryanodine receptors (RyRs) (Cheng et al. 1993). In cardiac muscle, Ca2+ sparks are associated with an approximate doubling of fluo-3 fluorescence intensity and their diameter at half-maximum amplitude (FWHM) is about 2·0 μm (Cheng et al. 1993). They occur at Z-lines (Shacklock et al. 1995; Cleeman et al. 1998) and can be evoked by the activation of L-type Ca2+ channels during action potentials or voltage clamp pulses (Cannell et al. 1994, 1995; López-López et al. 1995). Although Ca2+ sparks were originally detected in quiescent heart cell preparations, it is now apparent that the electrically evoked Ca2+ transient (which activates contraction) can be explained by the spatio-temporal summation of individual Ca2+ sparks (Cannell et al. 1994, 1995; López-López et al. 1995). Analysis of the relationship between the probability of evoking a Ca2+ spark and the sarcolemmal Ca2+ current showed that a single L-type Ca2+ channel can evoke a Ca2+ spark (Cannell et al. 1995; Santana et al. 1996). Moreover, the probability of evoking a Ca2+ spark depends on the amplitude of the unitary L-type Ca2+ channel current (López-López et al. 1995; Santana et al. 1996; Gómez et al. 1997). However, there is considerable uncertainty as to the number of RyRs involved in the genesis of a single Ca2+ spark. Estimates of the SR Ca2+ release flux underlying a Ca2+ spark suggest that the SR provides a Ca2+ flux equivalent to about 4 pA for 10 ms (Cheng et al. 1993; Blatter et al. 1997). Although this is somewhat larger than estimates of RyR single channel currents, the difference could be explained by uncertainties in the composition of the intracellular electrolytes. Arguments against the idea that the Ca2+ spark arises from the gating of a single RyR have been based on anatomical data which show that RyRs generally occur in clusters in the dyadic junction (see Bers, 1991, for review). However, there is no a priori reason to suppose that all RyRs in the junction are functional. More direct evidence against the idea that a single RyR generates a Ca2+ spark may be provided by the observation of even smaller Ca2+ release events (termed ‘Ca2+ quarks’ in Lipp & Niggli, 1996) whose existence would imply that a number of RyRs must gate in concert to produce the larger Ca2+ spark. Whether ‘Ca2+ quarks’ occur during normal excitation-contraction (E-C) coupling is, at present, unclear.
A major problem in studying the properties of Ca2+ sparks arises from uncertainties in their time of occurrence and position within the cell. In addition, when large numbers of Ca2+ sparks occur, the loss of imaging contrast makes it more difficult to identify and quantify their properties (Cannell et al. 1994). The probability of spark activation can be reduced by using Ca2+ channel antagonists or by limiting the voltage range over which they are recorded, which can mitigate problems associated with their detection (Cannell et al. 1994, 1995; López-López et al. 1995). However, such manoeuvers preclude examination of the relationship between Ca2+ sparks and the normal action potential.
In this study we have recorded Ca2+ sparks evoked by action potentials at 23°C and at low stimulation frequencies in mouse ventricular myocytes. In this preparation, Ca2+ sparks are readily detected and by limiting the period of data acquisition we can obtain large numbers of sequential line scan images to enable characterization of Ca2+ spark properties at fixed sites. Analysis of our data shows that Ca2+ sparks in mouse ventricular myocytes are very similar to sparks recorded in other species. In addition, Ca2+ sparks evoked by action potentials have a modal amplitude distribution which is consistent with the idea that a Ca2+ spark arises from the gating of more than one RyR. Some of these results have been presented in abstract form (Bridge et al. 1998).
METHODS
Animals and cell isolation
We used wild-type C57 adult mice weighing between 10 and 20 g for all experiments. All experiments were carried out in accordance with guidelines laid down by the animal welfare committee. To obtain dissociated myocytes we used a modification of the method described by Su et al. (1998). Briefly, hearts were removed from mice anaesthetized with an intraperitoneal injection of 0·5 ml sodium pentobarbital (64·8 mg ml−1) and immediately attached to an aortic cannula. The heart was then perfused with a Ca2+-free modified Tyrode solution (see below) for 5 min. Next the hearts were digested by perfusing for 8-9 min with a modified Tyrode solution (see below) containing 1·0 mg ml−1 collagenase (Worthington Biochemical) to which 100 μM Ca2+ was added. The heart was then perfused with the modified Tyrode solution containing 100 μM Ca2+ to wash out the enzymes. The ventricular portion of the heart was cut into small pieces into a Petri dish containing modified Tyrode solution and was then transferred to a conical flask, placed in a tissue bath at 37°C and shaken for 10 min. The flask was then removed and cells were allowed to settle for 2 min. Finally, most of the solution was aspirated and replaced with modified Tyrode solution containing 1·0 mM Ca2+. The basic modified Tyrode solution contained (mM): 126 NaCl, 4·4 KCl, 1·0 MgCl, 22 dextrose, 5 pyruvate, 5 creatine, 20 taurine, 1 NaH2PO4.H2O, 24 Hepes. The pH was adjusted to 7·4 with 1 M NaOH.
Bathing solution
The cell superfusion solution had the following composition (mM): 138 NaCl, MgCl 1·0, KCl 4·4, dextrose 11, 24 Hepes; pH 7·4 (with NaOH). Between 0·5 and 2·0 mM CaCl2 was added to this solution depending on the experiment.
Electrophysiological measurements
Cells were placed in a perfusion chamber and superfused with the bathing solution containing 1·0 mM Ca2+ and viewed through an inverted phase contrast microscope (Diaphot, Nikon). Whole-cell voltage recording was obtained with 2-3 MΩ patch pipettes filled with a solution containing (mM): 130 KCl, 5·5 dextrose, 5·0 K2ATP, 0·02 EGTA, 0·05 MgCl2, 10 Hepes and 15 NaCl; adjusted to a pH of 7·1 with KOH. Action potentials were recorded with an Axoclamp 2A voltage clamp operating in bridge mode (Axon Instruments). Action potentials were elicited with 2 ms current pulses. Data were acquired with the pCLAMP suite of programs (Axon Instruments).
Confocal imaging
Cells were loaded with 10 μM fluo-3 AM (Molecular Probes) for 30 min at room temperature. They were then placed in a laminin-coated perfusion chamber for a further 30 min to allow de-esterification of the dye. We measured Ca2+ transients in mouse ventricular myocytes with a BioRad MRC 1024 laser scanning confocal microscope operating in line scan mode using a × 100 oil immersion objective. To measure spontaneous Ca2+ spark production, cells were superfused with dialysing solutions containing 5 mM Ca2+. This significantly increased the probability of observing spontaneous Ca2+ sparks. These Ca2+ sparks were measured over the entire cell with the confocal microscope operating in x-y imaging mode. In those experiments designed to measure the frequency distribution of spark amplitudes, the following procedure was adopted. Dye-loaded mouse cells were field stimulated at 0·33 Hz in the bathing solution containing 0·5 mM Ca2+. This low concentration of Ca2+ reduced the probability of evoking sparks and therefore made it possible to measure the size of Ca2+ sparks at given sites repeatedly. The fluo-3 was excited at a wavelength of 488 nm and emission intensity was measured at 530 nm. A total of 40 line scans were triggered during each field stimulation. Action potentials were triggered after the initial 20 line scans and local Ca2+ transients were recorded during the remaining 20 line scans. Thus the period of exposure to laser light was reduced to approximately 80 ms which permitted us to obtain approximately 200 line scan images without obvious cell damage (cell damage was usually accompanied by an increase in resting fluorescence and the development of spontaneous activity). Spatial resolution for these experiments was set to 0·15 μm pixel−1. Background fluorescence was measured from the scan lines prior to field stimulation.
Data analysis
Data were analysed with custom routines written in IDL (Research Systems Inc., Boulder, CO, USA) running on SGI O2 work stations and O200 server (Silicon Graphics Inc.). We first measured the timing of the stimulus which was recorded on one channel of the transmitted light detector. Next the confocal line scan images were aligned on the basis of the timing data so that ‘jitter’ in the timing of the initiation of the confocal scan was removed. The removal of the jitter resulted in the loss of ∼9 confocal lines and reduced the pre-stimulus recording period to 16 ms. The fluorescence intensity during the pre-stimulus period was averaged and used to construct self ratio images (Cheng et al. 1993). To average sparks at given sites, the complete data set was displayed which allowed manual selection of well-separated spark sites. Typically, only 0-3 spark sites could be found in a line scan sequence that were sufficiently well separated to prevent contamination of spark signals by Ca2+ release from an adjacent site.
RESULTS
Figure 1 shows six sequential confocal images of a resting mouse cardiac myocyte, which were loaded with fluo-3 and superfused with a modified Tyrode solution containing 5·0 mM Ca2+. As reported by Cheng et al. (1993), we observed spontaneous elevations in fluorescence (Ca2+ sparks) which changed position from image to image. Treating the cell with ryanodine or thapsigargin prevented these events (not shown), confirming the idea that they are due to spontaneous SR Ca2+ release (Cheng et al. 1993).
Figure 1. Confocal images of a mouse ventricular myocyte stained with fluo-3.

This figure shows 6 sequential images of the distribution of Ca2+ in a quiescent mouse ventricular cell. Note the local regions of elevated fluorescence (Ca2+ sparks) that vary position between images.
We examined the temporal relationship between the action potential and the time course of spark occurrence with confocal line scan imaging in conjunction with conventional intracellular voltage recording. Figure 2A shows the time course of the action potential (upper panel), a line scan image of Ca2+ changes (middle panel) and the spatially averaged Ca2+ transient (lower panel). The action potential was characterized by an overshoot to approximately +45 mV followed by a rapid repolarization to a plateau potential of -50 mV. The entire action potential lasted about 130 ms. The line scan image displayed considerable spatial non-uniformity in the pattern of fluorescence intensity in agreement with the idea that Ca2+ release only occurs at discrete sites (Cheng et al. 1995; Shacklock et al. 1995). The temporal relationship between the time course of the action potential and the whole-cell Ca2+ transient is shown at a higher time resolution in Fig. 2B. It is apparent that the Ca2+ transient starts to rise during the upstroke of the action potential. The maximum rate of rise of this transient occurred 8 ms after its initiation and the time to the peak (when dCa/dt returns to zero) was ∼18 ms. The derivative of the Ca2+ transient should, therefore, reflect the time course of the evolution of the release events as well as the time course of Ca2+ removal. Since the decline of the Ca2+ transient was quite slow, the derivative of the upstroke of the Ca2+ transient will be dominated by the time course of Ca2+ spark production. Comparison of the derivative of the Ca2+ transient and the action potential suggests that Ca2+ sparks occur when the membrane is depolarized to potentials positive to about -30 mV. Since this corresponds to the range of potentials over which L-type Ca2+ channels are activated, these data support the idea that Ca2+ sparks are evoked by the activation of L-type Ca2+ channels.
Figure 2. Line scan imaging during the action potential.

A, fluorescence changes evoked by the mouse action potential. i, the action potential was elicited by a brief current injection. A stimulus artifact is apparent just before the upstroke of the action potential. The peak value for membrane potential (ordinate) is about +50 mV and the duration of the action potential is approximately 130 ms (abscissa). ii, a line scan plot of the change in fluorescence intensity that was activated by the action potential. Position along the line scan is plotted on the ordinate and time on the abscissa. The colour bar on the right indicates the fluorescence ratio (F/F0). F0 is the background intensity obtained by measuring fluorescence intensity before the stimulus. iii, the time course of the spatially averaged fluorescence change (F/F0) during the action potential. B, an expanded view of the relationship between the action potential and the spatially averaged Ca2+ transient depicted in A. The panel shows the time course of the action potential (i), the spatially averaged Ca2+ transient (ii), and the derivative of the upstroke of the Ca2+ transient which reaches a peak approximately 8 ms after the onset of the Ca2+ transient (iii). The dashed vertical lines delineate the period over which the majority of Ca2+ release takes place. Note the temporal relationship between the action potential and the upstroke of the calcium transient.
By reducing external Ca2+ to 0·5 mM, the pattern of Ca2+ release in response to field stimulation could be more clearly resolved. Figure 3A shows 39 sequential line scan images (out of a total of 180), and each line scan image lasts 60 ms. Examination of these data shows that the pattern of Ca2+ release was highly variable between stimuli with large variations in the strength of the response at various points along the scan line. Nevertheless, it is apparent that there are discrete sites that repeatedly release Ca2+ although there are variations in the magnitude of the response between various sites. Figure 3B shows the probability of observing a normalized fluorescence signal greater than 1·5 at every point along the scan line. From these data it is apparent that the probability of observing such a florescence change was also highly variable along the scan line. Nevertheless, the highest probabilities occurred at a minimum spacing of 1·82 μm which was the sarcomere spacing apparent in light micrographs (not shown) although there were some gaps in release sites at this spacing. These data are consistent with recent imaging experiments of spark release sites which show that sparks do not occur with perfect uniformly in the longitudinal direction although they are generally aligned with Z-lines (Cleeman et al. 1998). The variation in probability of observing an evoked spark along the scan line may be related to the reported variation in the probability of observing spontaneous Ca2+ sparks at fixed sites in rat cardiac myocytes which was explained by spatial heterogeneity in the activity of RyRs (Parker et al. 1996). However, the Ca2+ sparks shown in Fig. 3 were tightly linked to the timing of the stimulus and therefore cannot be explained by differences in the probability of RyR activation alone. Instead the spatial variation in the probability of evoking Ca2+ release must also reside in either spatial non-uniformities in the distribution and activation of L-type Ca2+ channels and/or the ability of the L-type Ca2+ channel to activate SR Ca2+ release.
Figure 3. Line scan images of repeated stimuli.
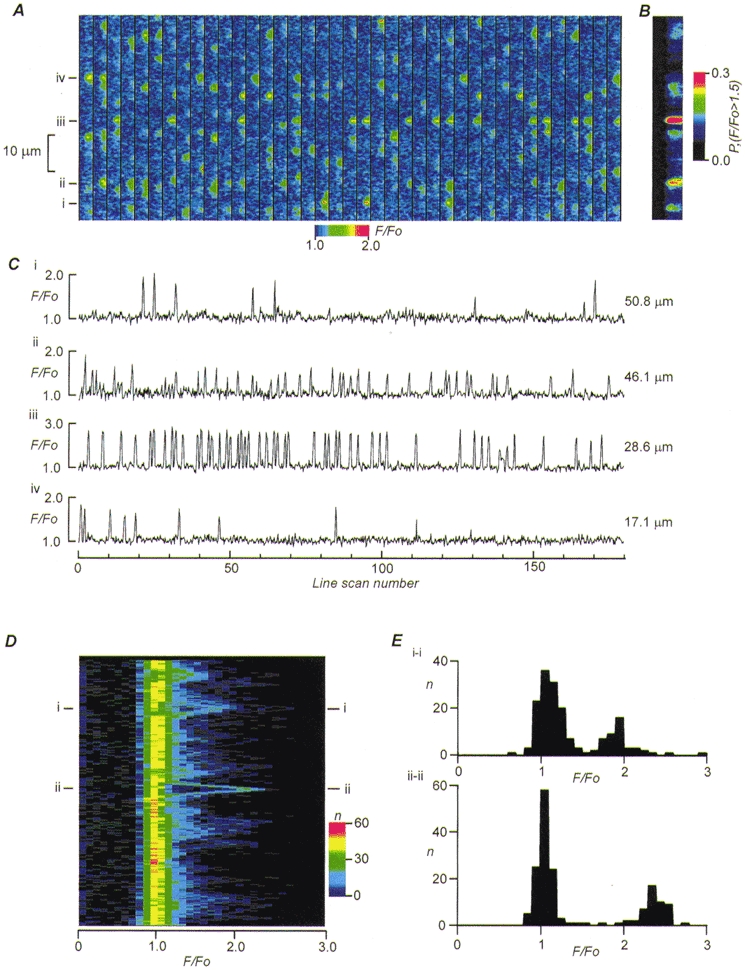
A, the panel shows 39 sequential line scan images (from a total of 180) taken during electrical stimulation. Each ‘strip’ (lasting 60 ms) shows the pattern of fluorescence change resulting from electrical stimulation, and the relative fluorescence change (F/F0) along the scan line is coded in colour (scale shown below the panel). Note that sparks occur at varying positions along the line scan and that every spark site does not respond to each stimulus. B, the plot indicates the probability of measuring a relative fluorescence intensity greater than 1·5 at each point along the scan line. C, traces of the fluorescence change for 180 images at the positions indicated in A. D, histogram analysis of fluorescence changes 8 ms after stimulation. Position along the scan line is plotted on the ordinate and relative fluorescence on the abscissa. The colour bar on the right indicates the number of times that a particular fluorescence ratio was measured. Most observations occur at F/F0=≈ 1·0 (which is background, implying no release took place). Chevron-like structures are particularly apparent at positions i and ii which point to regions that should be closest to spark centres (see text). E, two dimensional histograms of fluorescence intensities at position i and ii in D. In both histograms there are two distinct modal distributions of relative fluorescence intensity.
Figure 3C shows the changes in Ca2+ produced by electrical stimulation in all the line scan images at the points indicated in Fig. 3A. It is apparent that not every stimulus results in the activation of a Ca2+ spark and with some stimuli there was no response, even at the site with the highest probability of activation (site iii). Overall the pattern of response looked stochastic in nature as might be expected if the probability of activating a Ca2+ spark depends on the stochastic gating of Ca2+ channels in the sarcolemma (Cannell et al. 1994, 1995). At other positions along the scan line a similar stochastic pattern of response was observed but the amplitude and the probability of SR Ca2+ release was not the same as that observed at site iii. The simplest explanation for these observations is that there is spatial heterogeneity in the distribution and properties of the dyadic complexes responsible for E-C coupling along the scan line. It is also notable that the amplitude of the evoked Ca2+ sparks was quite constant at each spark site examined although there was variability in the absolute magnitude of the Ca2+ spark between sites.
Most studies on Ca2+ sparks have used a threshold detection algorithm to locate the position and occurrence of Ca2+ sparks. However, with a data set of the type illustrated in Fig. 3 we can examine the amplitude of evoked SR Ca2+ release at any point along the scan line without a priori assumptions as to what comprises a Ca2+ spark or even where along the scan line it occurs. The maximum rate of change of fluorescence occurred (Fig. 2) 8 ms after the upstroke of the action potential and this time should correspond to the most likely time at which to detect a spark. We therefore constructed a fluorescence amplitude histogram for every point along the 8 ms scan line from the entire set of 180 line scan images (Fig. 3D). In this 3-dimensional histogram, the number of times a particular fluorescence ratio was observed is coded in colour, with the position along the scan line displayed on the ordinate and the ratio on the abscissa. It is clear that the most frequently observed fluorescence ratio is about 1·0, which indicates a lack of Ca2+ release (at 8 ms). However, there are observations at all points along the scan line where the fluorescence ratio is greater than 1·0. In addition, there is some structure detectable in this histogram that takes the form of chevrons pointing to higher fluorescence ratios. This is particularly clear at the points marked i and ii. Since the Ca2+ associated with a Ca2+ spark diffuses from the site of release, the chevron shape can be explained by the reduced fluorescence intensity at sites more distant from the release point. Therefore the apex of the chevron corresponds to the point which is nearest to the centre of the Ca2+ spark. Extraction of conventional histograms of fluorescence intensities (F/Fo) at positions i and ii in Fig. 3D reveals two discrete distributions of fluorescence intensity at each of these positions. The peak of one distribution is near to 1·0, corresponding to a lack of Ca2+ release in some line scan images. The peak to the right at approximately 1·9 (position i) and 2·5 (position ii) corresponds to the amplitude of the evoked Ca2+ sparks 8·0 ms after the stimulus. It appears that Ca2+ sparks occur at a given site with approximately normally distributed amplitudes. This supports the impression gained from Fig. 3 where the amplitude of fluorescence change during the transient at most points appeared to exhibit ‘all-or-none’ behaviour.
The Ca2+ sparks at site ii (Fig. 3A) followed the stimulus with a latency of 10·7 ± 1·4 ms (mean ±s.d., n= 79, measured as the time from the stimulus to the fluorescence ratio exceeding 1·5). Since the variation in time of occurrence of the spark at this site was low, such well-defined spark sites may be signal averaged without major concerns arising from uncertainties in their timing and position (Fig. 4A). From this average spark we can extract the spatio-temporal properties of a mouse Ca2+ spark with high fidelity. Figure 4B shows that the time to peak of the spark (when the derivative returns to zero) is approximately 12 ms. This is slightly faster than the time course of the whole cell transient (see above) but this difference is probably due to variations in the time of spark activation throughout the cell (see above). Figure 4C shows the fluorescence profiles associated with the development of the Ca2+ spark and the spark grew in width from a value of 0·9 μm (FWHM) at 2·0 ms to 1·3 μm at 8 ms. Figure 4D shows the time course of fluorescence change at various distances from the centre of the Ca2+ spark. As already suggested on theoretical grounds (Pratusevitch & Balke, 1996), the time course of the Ca2+ spark becomes slower and of lower amplitude as the distance from the centre of release increases.
Figure 4. Signal-averaged Ca2+ spark.

A, 20 sparks signal averaged from a fixed position and confocal plane. Sparks for averaging were selected by assuming that they were associated with a relative fluorescence change of > 1·5. B shows the derivative with respect to time of the fluorescence intensity of the spark depicted in A. Note the temporal similarity of the derivative of the spark to that of the whole-cell transient. C, profiles of relative fluorescence at various times (indicated on the traces) after the beginning of the spark. D, profiles of fluorescence intensity at various distances (indicated on the traces) from the centre of the spark. As the distance from the spark centre increases, the amplitude decreases and the time of rise increases.
DISCUSSION
The results presented here confirm that Ca2+ sparks occur in mouse ventricular myocytes (Santana et al. 1997). The size and amplitude of these Ca2+ sparks are similar to those of the sparks observed in other cardiac ventricular myocytes. By using low rates of stimulation and reduced superfusing Ca2+ concentrations we were able to observe single Ca2+ sparks elicited by action potentials. As reported previously, (Cannell et al. 1995) Ca2+ sparks elicited by depolarization appear to be essentially the same as those occurring spontaneously. However, an important aspect of the present study is that we were able to record Ca2+ sparks at fixed sites in response to a large number of sequential action potentials. This allowed us to examine the nature of Ca2+ release at any desired point along a scan line. Furthermore since the latency of occurrence of the Ca2+ sparks was quite constant it was possible to analyse the amplitude distribution of the Ca2+ sparks at these fixed sites.
Time course of Ca2+ spark production during the action potential
The mouse action potential exhibits a relatively rapid upstroke to a potential of about 45-50 mV followed by rapid repolarization to a plateau potential of about -50 mV. The rate of change of fluorescence showed that essentially all of the Ca2+ release occurred during the initial spike of the action potential. The simplest explanation for this observation is that Ca2+ sparks are triggered by L-type Ca2+ channels which opened during the spike of the action potential. However, the timing of Ca2+ spark production during the action potential showed much less variation than reported for voltage clamp depolarizations in rat myocytes (Cleeman et al. 1998) and occurred primarily during the repolarization phase of the action potential. This result may be explained by the interaction of the time course of L-type Ca2+ gating with the voltage changes during the action potential. L-type Ca2+ channels open with a latency of a few milliseconds once the membrane potential exceeds about -40 mV. However, this latent period is associated with the rapid upstroke of the action potential when the membrane potential reaches potentials > +40 mV in < 2 ms. Therefore as the L-type Ca2+ channels open stochastically during the upstroke of the action potential there is very little driving force for Ca2+ entry. As the action potential undergoes the initial rapid phase of repolarization, the driving force for Ca2+ entry rapidly increases and this results in synchronous Ca2+ entry via L-type Ca2+ channels that opened during the first part of the action potential. We therefore conclude that SR Ca2+ release is activated during the repolarization phase of the action potential. This arises from the finite latency for L-type Ca2+ channel activation coupled with the increasing driving force for Ca2+ entry during action potential repolarization. It is intriguing to speculate that this effect may reduce stochastic variation in the time course of SR Ca2+ release and thereby improve the uniformity of sarcomere activation. In connection with this point, we note that a related result has been observed in voltage clamped myocytes (Barcenas-Ruiz & Wier, 1987; Cannell et al. 1987) where no SR Ca2+ release occurred until the cell was repolarized after depolarization to very positive potentials.
Calcium influx via the Na+-Ca2+ exchange may contribute to the production of a Ca2+ trigger (see Levi et al. 1994). In connection with this point, a recent estimate of the time course of exchanger current suggested that peak exchanger current occurs about 10 ms after the start of the action potential in guinea-pig (Grantham & Cannell, 1996). Such timing would also be consistent with the time course of Ca2+ spark evolution since the peak rate of Ca2+ spark occurrence corresponds to the peak rate of release (which is about 8 ms after the start of the action potential). However, evaluation of this possibility will require future experiments that carefully examine the possible non-linear summation of Ca2+ triggers produced by both L-type Ca2+ channels and the exchanger (Litwin et al. 1998). Nevertheless, both mathematical modelling (Cannell & Soeller, 1997) and experimental data (e.g. López-López et al. 1995; Santana et al. 1996; Cleeman et al. 1998) suggest that the local Ca2+ trigger produced by L-type Ca2+ channel gating is a potent trigger for SR Ca2+ release.
Properties of the mouse Ca2+ spark
The spatio-temporal properties of mouse Ca2+ sparks appear to be very similar to those of other species. However, we have been able to examine the distribution of spark amplitudes at fixed sites which shows that Ca2+ sparks appear to exhibit an almost ‘all-or-none’ behaviour. Previous analyses of spark amplitude distributions suggest either an exponential amplitude distribution (Song et al. 1997) or a wide range of spark amplitude (Cheng et al. 1999). However, previous studies depended upon spark detection algorithms that are based upon the amplitude and/or spatial extent of local regions of elevated fluorescence. Any spark occurring some distance from the scan line will show a reduced amplitude (see Figs 3D and 4D and Pratusevitch & Balke, 1996). Since it is more likely that a spark will occur some distance from the scan line than on the scan line, one anticipates that the previous observations should yield a broad distribution of amplitudes. In this study we were able to examine the amplitude distribution of Ca2+ sparks at fixed sites which removes variations introduced by the detection of sparks at sites distant from the scan line. The 3-dimensional amplitude histogram showed ‘chevron patterns’ whose apices will occur at the point which is closest to the centre of the Ca2+ spark. This allowed us to examine spark amplitudes at their site of occurrence on the scan line and showed that Ca2+ sparks at fixed sites have relatively constant amplitude. If a Ca2+ spark were due to the opening of a single Ca2+ release channel the flux through that channel should be exponentially distributed since single channel open times are exponentially distributed. Therefore our result is inconsistent with the idea that the Ca2+ spark arises from the gating of a single RyR.
How many RyRs are involved in spark production?
As pointed out above, the fact that the spark amplitudes are not exponentially distributed suggests that more than one RyR must be involved in their genesis. The gating of multiple ion channels is associated with variance whose mean flux amplitude is: σI2=Ni2Po (1 - Po) where N is the number of channels, i is the single channel flux and Po their open probability (Hille, 1992, assuming independent gating). The mean flux is I = NiPo. Therefore the variance in the mean amplitude of the spark should contain information about the number of RyRs involved in spark production. However, not all the variance in spark amplitude arises from the variance associated with channel gating since the photon collection statistics add Poisson noise, and Ca2+ binding by fluo-3 is a binomial process. The poor photon collection efficiency of the confocal system results in the majority of noise in the spark record being Poisson in nature and a reasonable estimate of the expected noise during a spark can be obtained by assuming that the minor noise contribution from fluo-3 calcium binding statistics is either negligible or behaves as a Poisson process also. The validity of this approximation resides in the fact that the number of fluorescing dye molecules in the confocal volume (∼0·1 fl) is much larger than the number of detected photons. For example, at 0·1 mM dye concentration there will be about 1200 dye molecules fluorescing in the confocal volume (20 % of the total) which will provide a signal with ∼2·6 % noise (s.d./mean) which will decrease to 1·6 % if the dye signal doubles. It is therefore apparent that the contribution of the variance in the number of fluorescing dye molecules to the overall noise in the signal is (essentially) negligible compared with the noise in the recorded fluorescence signal which has a signal-to-noise ratio of only ∼6 due to the much smaller number of detected photons (∼40). Therefore noise during the spark due to calcium binding statistics and photon noise can be predicted from Poisson behaviour which should provide a slight overestimate of the combined noise from these sources. For the large spark shown in Fig. 4C the mean background fluorescence signal was 93 with a variance of 138 (instrument units). (Note the background signal includes noise arising from fluctuations in the number of fluorescent molecules in the confocal volume as well as fluctuations in the number of detected photons.) The fluorescence associated with the spark site being activated had a mean amplitude of 216 with a variance of 361 units. From Poisson behaviour and the background signal, we would expect a variance of about 320 units during the spark. If we ascribe the excess variance during the spark to RyR gating then, from the above equations, N = I2(1 - Po)/σI2Po, and so if Po of the RyRs during the spark were 0·5 then N≈ 370. However, if RyR gating is fast then the variance associated with RyR gating will be reduced by the (slower) kinetics of the fluo-3 response. For example, if the mean open time of the RyR were 1 ms and fluo-3 responded with a time constant of 4 ms the variance in fluorescence arising from RyR gating would be reduced by a factor of about 20 and N would be 20-fold smaller (implying N≈ 18). We consider the latter figure to be a lower limit estimate because recent measurements suggest that Po < 0·5 (Zahradníková & Zahradnik, 1996) and it is possible that the RyRs may not gate independently (which would also reduce the variance).
Elementary nature of evoked Ca2+ sparks
The data presented in this study show that Ca2+ sparks evoked by electrical stimulation have a relatively constant amplitude when fixed, well-separated sites are examined. It is therefore apparent that sparks are indeed ‘elementary’ events underlying E-C coupling even though our data suggest that many RyRs are involved in their genesis. However, there is significant variation in the amplitude of the response between sites. If less-well-separated sites were examined, the calcium flux from the adjacent site would cause the amplitude histogram to spread in width and there is evidence to suggest that at some positions along the Z-line this can be a significant problem (Parker et al. 1996). A related problem has been discussed in detail by Izu et al. (1998) where the amplitude distribution of spontaneous Ca2+ sparks can form a continuum of Ca2+ spark amplitudes (even if the underlying events are stereotypical). By examining fixed sites we avoided the problem of random sampling of spark sites, and found that spark amplitudes are modal. Although Cheng et al. (1999) have argued that a modal distribution of spark amplitudes can arise from detection bias after applying a threshold to images (and the random nature of spark sampling), there was no possibility of detection bias in the present study because the change in fluorescence associated with every stimulus was plotted in the amplitude histograms and no threshold for detection was involved. By selecting clear chevron patterns in the line scan histograms, well-separated sites can be selected for further analysis, and by limiting the number of scan lines collected after each stimulus sufficient data can be obtained for analysis of spark properties at high signal-to-noise ratios.
Conclusions
The data obtained in this study support the idea that Ca2+ sparks are elementary events underlying normal cardiac E-C coupling (Cheng et al. 1993). At fixed sites and at steady stimulation frequencies, each SR ‘functional release unit’ (Cannell et al. 1994) releases a relatively constant amount of Ca2+ in response to an action potential and produces Ca2+ sparks with relatively constant amplitude. The low variance associated with this release suggests that many (N > 18) RyRs are activated to produce each Ca2+ spark. We found no evidence for much smaller Ca2+ sparks (or ‘quarks’, Lipp & Niggli, 1996) either in resting cells or in response to electrical stimulation (as shown by the clear separation of background and spark peaks in the amplitude histograms). Our failure to detect ‘Ca2+ quarks’ raises questions as to their origin and whether they bear any relationship to normal E-C coupling. Nevertheless, not all junctional regions release the same quantity of Ca2+ during an action potential with some regions releasing much more Ca2+ than others. At higher probabilities of Ca2+ spark activation, the Ca2+ contribution associated with each spark will sum with others and produce a higher and more uniform Ca2+ level. We therefore suggest that more isolated release sites will tend to release greater quantities of Ca2+ than sites which are close together, a hypothesis that should be directly testable in the future with the methods described here.
Acknowledgments
This work was supported by awards from the Nora Eccles Treadwell Foundation and the Richard A. and Nora Eccles Harrison Fund for Cardiovascular Research; and grant HL42357 from the National Institutes of Health (Heart, Lung and Blood Institute), The Wellcome Trust and the British Heart Foundation.
References
- Barcenas-Ruiz L, Wier WG. Voltage dependence of intracellular Ca2+ transients in guinea pig vetricular myocytes. Circulation Research. 1987;61:148–154. doi: 10.1161/01.res.61.1.148. [DOI] [PubMed] [Google Scholar]
- Bers DM. Excitation-Contraction Coupling and Cardiac Contractile Force. Dordrecht: Kluwer; 1991. [Google Scholar]
- Blatter LA, Huser J, Rios E. Sarcoplasmic reticulum Ca2+ release flux underlying Ca2+ sparks in cardiac muscle. Proceedings of the National Academy of Sciences of the USA. 1997;94:4176–4181. doi: 10.1073/pnas.94.8.4176. [DOI] [PMC free article] [PubMed] [Google Scholar]
- Bridge JHB, Li J, Ershler PR, Razusova Z, Cannell MB. Calcium sparks and evoked local calcium transients in mouse ventricular myocytes. Biophysical Journal. 1998;74:A118. [Google Scholar]
- Cannell MB, Berlin JR, Lederer WJ. Effect of membrane potential changes on the calcium transient in single rat cardiac muscle cells. Science. 1987;238:1419–1423. doi: 10.1126/science.2446391. [DOI] [PubMed] [Google Scholar]
- Cannell MB, Cheng H, Lederer WJ. Spatial non-uniformities in [Ca2+]i during excitation-contraction coupling in cardiac myocytes. Biophysical Journal. 1994;67:1942–1956. doi: 10.1016/S0006-3495(94)80677-0. [DOI] [PMC free article] [PubMed] [Google Scholar]
- Cannell MB, Cheng H, Lederer WJ. The control of calcium release in heart muscle. Science. 1995;268:1045–1050. doi: 10.1126/science.7754384. [DOI] [PubMed] [Google Scholar]
- Cannell MB, Soeller C. Numerical analysis of ryanodine receptor activation by L-type channel activity in the cardiac muscle diad. Biophysical Journal. 1997;73:112–122. doi: 10.1016/S0006-3495(97)78052-4. [DOI] [PMC free article] [PubMed] [Google Scholar]
- Cheng H, Lederer WJ, Cannell MB. Calcium sparks: elementary events underlying excitation-contraction coupling in heart muscle. Science. 1993;262:740–744. doi: 10.1126/science.8235594. [DOI] [PubMed] [Google Scholar]
- Cheng H, Lederer WJ, Cannell MB. Partial inhibition of calcaium current by D600 reveals spatial non-uniformities in [Ca2+]i during excitation-contraction coupling in cardiac myocytes. Circulation Research. 1995;76:236–241. doi: 10.1161/01.res.76.2.236. [DOI] [PubMed] [Google Scholar]
- Cheng H, Song LS, Shirokova N, Gonzalez A, Lakatta EG, Rios E, Stern MD. Amplitude distribution of calcium sparks in confocal images: theory and studies with an automatic detection method. Biophysical Journal. 1999;76:606–617. doi: 10.1016/S0006-3495(99)77229-2. [DOI] [PMC free article] [PubMed] [Google Scholar]
- Cleeman L, Wang W, Morad M. Two dimensional confocal images of organization, density and gating of focal Ca2+ release sites in rat crdiac myocytes. Proceedings of the National Academy of Sciences of the USA. 1998;95:10984–10989. doi: 10.1073/pnas.95.18.10984. [DOI] [PMC free article] [PubMed] [Google Scholar]
- Gomez AM, Valdivia HH, Cheng H, Lederer MR, Santana LF, Cannell MB, McCune SA, Altschuld RA, Lederer WJ. Defective excitation-contraction coupling in experimental cardiac hypertrophy and heart failure. Science. 1997;276:800–806. doi: 10.1126/science.276.5313.800. [DOI] [PubMed] [Google Scholar]
- Grantham CJ, Cannell MB. Calcium influx during the cardiac action potential in guinea-pig ventricular myocytes. Circulation Research. 1996;79:194–200. doi: 10.1161/01.res.79.2.194. [DOI] [PubMed] [Google Scholar]
- Hille B. Ionic Channels of Excitable Membranes. 2. Sunderland, MA, USA: Sinauer Associates; 1992. p. 322. [Google Scholar]
- Izu LT, Wier WG, Balke CW. Theoretical analysis of the Ca2+ spark amplitude distribution. Biophysical Journal. 1998;75:1144–1162. doi: 10.1016/s0006-3495(98)74034-2. [DOI] [PMC free article] [PubMed] [Google Scholar]
- Levi AJ, Spitzer KW, Bridge JHB, Kohmoto O. Depolarization-induced Ca2+ entry via Na-Ca exchange triggers SR release and phasic contraction in guinea pig cardiac myocytes. American Journal of Physiology. 1994;26:H1422–1433. doi: 10.1152/ajpheart.1994.266.4.H1422. [DOI] [PubMed] [Google Scholar]
- Lipp P, Niggli E. Submicroscopic calcium signals as fundamental events of excitation-contraction coupling. The Journal of Physiology. 1996;492:31–38. doi: 10.1113/jphysiol.1996.sp021286. [DOI] [PMC free article] [PubMed] [Google Scholar]
- Litwin SE, Li J, Bridge JHB. Na-Ca exchange and the trigger for sarcoplasmic reticulum Ca2+ release: studies in adult rabbit ventricular myocytes. Biophysical Journal. 1998;75:359–371. doi: 10.1016/S0006-3495(98)77520-4. [DOI] [PMC free article] [PubMed] [Google Scholar]
- López-López JR, Shacklock PS, Balke CW, Wier WG. Local calcium transients triggered by single L-type calcium channel currents in cardiac cells. Science. 1995;268:1042–1045. doi: 10.1126/science.7754383. [DOI] [PubMed] [Google Scholar]
- Parker I, Zang W-J, Wier WG. Ca2+ sparks involving multiple Ca2+ release sites along Z-lines in rat heart cells. The Journal of Physiology. 1996;497:31–38. doi: 10.1113/jphysiol.1996.sp021747. [DOI] [PMC free article] [PubMed] [Google Scholar]
- Pratusevitch VR, Balke CW. Factors shaping the confocal image of the calcium spark in cardiac muscle cells. Biophysical Journal. 1996;71:2942–2957. doi: 10.1016/S0006-3495(96)79525-5. [DOI] [PMC free article] [PubMed] [Google Scholar]
- Santana LF, Gomez AM, Cheng H, Cannell MB, Lederer WJ. Relationship between sarcolemmal Ca2+ current and Ca2+ sparks and local control theories for cardiac excitation-contraction coupling. Circulation Research. 1996;78:166–171. doi: 10.1161/01.res.78.1.166. [DOI] [PubMed] [Google Scholar]
- Santana LF, Kranias EG, Lederer WJ. Calcium sparks and excitation-contraction coupling in phospholamban-deficient mouse ventricular myocytes. The Journal of Physiology. 1997;503:21–29. doi: 10.1111/j.1469-7793.1997.021bi.x. [DOI] [PMC free article] [PubMed] [Google Scholar]
- Shacklock PS, Wier WG, Balke CW. Local Ca2+ transients (Ca2+ sparks) originate at transverse tubules in rat heart cells. The Journal of Physiology. 1995;487:601–608. doi: 10.1113/jphysiol.1995.sp020903. [DOI] [PMC free article] [PubMed] [Google Scholar]
- Song LS, Stern MD, Lakatta EG, Cheng H. Partial depletion of sarcoplasmic reticulum calcium does not prevent calcium sparks in rat ventricular myocytes. The Journal of Physiology. 1997;505:665–675. doi: 10.1111/j.1469-7793.1997.665ba.x. [DOI] [PMC free article] [PubMed] [Google Scholar]
- Su Z, Zou A, Nonaka A, Zubair I, Sanguinetti MC, Barry WH. Influence of prior Na+ pump activity on pump and Na+/Ca2+ exchange currents in mouse ventricular myocytes. American Journal of Physiology. 1998;275:H1808–1817. doi: 10.1152/ajpheart.1998.275.5.H1808. [DOI] [PubMed] [Google Scholar]
- Zahradníková A, Zahradnik I. Description of modal gating of the cardiac calcium release channel in planar lipid bilayers. Biophysical Journal. 1996;69:1780–1788. doi: 10.1016/S0006-3495(95)80048-2. [DOI] [PMC free article] [PubMed] [Google Scholar]