

Abstract
The droplet technique was used in this study to measure total calcium loss from pancreatic acinar cells due to calcium extrusion. The calcium binding capacity of the cytosol (kc) was measured as the ratio of the decrease in the total calcium concentration of the cytosol of the cell (Δ[Ca]c) and the synchronously occurring decrease in the free calcium ion concentration in the cytosol (Δ[Ca2+]c). The calcium dependency of the calcium binding capacity was determined by plotting values of kc against the corresponding [Ca2+]c. The rise in the cytosolic Ca2+ concentration of pancreatic acinar cells was triggered by stimulation with a supramaximal dose of cholecystokinin (CCK). The recovery of [Ca2+]c during continued exposure to the agonist was due to calcium extrusion from the cell.
The calcium binding capacity was about 1500-2000 for the [Ca2+]c range 150-500 nM. The mechanism of buffering was not investigated in this study. The calcium binding capacity of the cytosol did not vary significantly with [Ca2+]c in this range. The CCK-evoked decrease in the total calcium concentration in the lumen of the endoplasmic reticulum (ER) can be estimated from our data, taking into account previously published values for the volume of the ER in pancreatic acinar cells. Comparing the decrease in the total ER calcium concentration with our recently reported values for agonist-induced reductions in the free Ca2+ concentration inside the ER, we estimate that the calcium binding capacity of the ER is approximately 20. In pancreatic acinar cells we have therefore found a difference of two orders of magnitude in the efficiency of calcium buffering in the cytosol and the ER lumen.
The majority of calcium ions (Ca2+) added to the cytosol become bound to buffers and only a small proportion remain free to serve as second messengers in a broad variety of Ca2+-dependent reactions. Cytosolic Ca2+ buffering allows cells to regulate the rate and amplitude of Ca2+ signals. This property of the cytosol allows Ca2+ to work as a short range ‘local’ second messenger (Kasai & Petersen, 1994). Buffering is also essential for protection against Ca2+ toxicity. The ability of the cytosol to buffer Ca2+ can be numerically characterized as the calcium binding capacity (kc). The calcium binding capacity is the ratio of the differentials of the buffered and free Ca2+ concentrations (Neher & Augustine, 1992):
| (1) |
where [CaB]c is the concentration of buffered calcium and [Ca2+]c is the concentration of free Ca2+ in the cytosol.
For small changes in total and free cytosolic calcium, eqn (1) can be substituted by the approximation:
| (2) |
where [Ca]c is the total (buffered and free) calcium concentration in the cytosol. This approximation takes into account that kc is much higher than 1 (in other words most of the calcium added to the cytosol becomes buffered; this is the case for practically all cell types). The calcium binding capacity describes the fate of Ca2+ added to the cytosol (e.g. as a result of Ca2+ influx through Ca2+ channels in the plasma membrane or due to Ca2+ release from the endoplasmic reticulum (ER)). A calcium binding capacity of 100, for example, means that out of 100 calcium ions added to the cytosol only one ion will remain free and the others will become bound to buffers.
The cytosolic calcium binding capacity in different cell types varies over a broad range. The lowest values were probably those reported for oocytes, where they are close to 10 (Albritton et al. 1992). Values in the range 10-100 were described for chromaffin cells (Neher & Augustine, 1992; Zhou & Neher, 1993), cardiac myocytes (Berlin et al. 1994) and axons of invertebrates (Al-Baldawi & Abercrombie, 1995). Values between 100 and 1000 were reported for neurones of invertebrates (Muller et al. 1993; Belan et al. 1993; Schwiening & Thomas, 1996). The calcium binding capacity was reported to be very high in cerebellar Purkinje cells (2000; Fierro & Llano, 1996), neutrophils (approximately 3000; Al-Mohanna & Hallett, 1988) and in N1E-115 mouse neuroblastoma cells (approximately 4000; Bolsover, 1986). So far there have been no reports of measurements of the calcium binding capacity in pancreatic acinar cells (or indeed other types of non-excitable secretory cells).
The aim of the present study was to characterize the calcium buffering properties of the pancreatic acinar cytosol and the calcium dependency of calcium buffering. This was achieved using the droplet technique for measurements of the amount of calcium extruded from cells and simultaneous measurements of the free cytosolic Ca2+ concentration. In other words, the loss of total calcium was compared with the corresponding decrease in the free cytosolic Ca2+ concentration.
METHODS
Pancreata were obtained from adult male mice (CD1) killed by cervical dislocation. Isolated small clusters of acinar cells (3-11 cells) were obtained using collagenase digestion. The cells were loaded with fura-2. The procedures of cell isolation and fluorescent probe loading have been described previously (Toescu et al. 1992). Following loading, cells were washed by centrifugation and maintained in a physiological solution with 1 mM CaCl2 prior to the beginning of the experiment. All experiments were performed at room temperature. The detailed procedures for measurements of the free cytosolic Ca2+ concentration and calcium extrusion using the droplet technique have been described before (Tepikin et al. 1994). Briefly, a large drop (1-5 μl) of extracellular solution containing a few cellular clusters was placed on the surface of a siliconized coverglass. Siliconization prevents spreading of droplets and was performed by immersing coverglasses in Sigmacote solution (Sigma) for 5 min. The drop containing the cells was immediately covered by oil (Paraffin oil from Fluka) to prevent evaporation. All the following manipulations were performed on drops under oil. A suitable cell cluster was chosen for the experiment. The remainder of the cells and most of the extracellular solution were removed using small plastic pipettes. This was followed by infusion of extracellular solution containing the calcium indicator fluo-3 (Molecular Probes). The volume of infused solution was much larger (approximately 100 times) than the volume of the droplet before infusion. After that the droplet size was reduced again to typically 100-150 μm in diameter using small plastic pipettes mounted on a hydraulic manipulator. The volume of the final droplet was typically 20-50 times larger than the combined volume of the cells in the cluster inside the droplet. The cells in the droplets were stimulated by cholecystokinin (CCK) added from siliconized micropipettes (tip diameter, 1-2 μm) using pressure injection. A pneumatic PicoPump (model PV830, WPI) was used in our experiments. The parameters of injection were adjusted (using injections into oil) to create a concentration of CCK in the droplets of approximately 1 nM. The volume of injected solution was approximately 1 % of the droplet volume. Cells can survive in oil-covered droplets for many tens of minutes and produce measurable changes in the extracellular calcium concentration. The extracellular physiological solution contained (mM): NaCl, 140; MgCl2, 1·1; KCl, 4·7; Hepes, 10; glucose, 10; pH 7·2 (adjusted with NaOH). The extracellular solution was nominally calcium free and it contained 100 μM fluo-3 so that the intracellular (using fura-2) and extracellular concentrations of calcium could be monitored simultaneously. Measurements of fluorescence intensity in the cells and the droplet solution were performed using a microspectrofluorimeter (SPEX, Glen Spectra, Stanmore, Middlesex, UK). Fluorescence was excited at 340, 380 and 490 nm. The emission filter was centred at 530 nm.
At the end of each experiment the fluo-3 in the extracellular droplet solution was saturated with calcium using iontophoretic injection through a microelectrode filled with 0·2 M CaCl2. Calculation of intracellular and extracellular calcium concentrations was performed as described previously (Tepikin et al. 1994). Droplet and cell volumes were calculated from measurements made using calibrated oculars. The volume measurements were performed at the end of each experiment. The diameter of individual cells in small clusters was measured using a calibrated ocular. The droplet was taken into the plastic pipette and thereafter released over the surface of the coverglass. The droplet forms a perfect sphere whilst it slowly floats down towards the surface of the coverglass. The diameter of the droplet was determined at the moment when the droplet touched the surface of the coverglass (Tepikin et al. 1994). Changes in the total calcium concentration inside the cells were calculated from the measured changes in the extracellular calcium concentration and the ratio of the volumes of droplet and cells (Tepikin et al. 1994).
Estimations of the fura-2 concentration in the pancreatic acinar cells, attained as a result of loading with fura-2 AM (Molecular Probes; 1 μM fura-2 AM for 40 min at room temperature), were made by adding fura-2 to the extracellular solution and comparing the fluorescence of the cells with that of the neighbouring regions of extracellular solution. We used an excitation wavelength of 360 nm, which is close to the isobestic point for fura-2, for evaluation of the concentration of fura-2 inside the cells. When the concentration of fura-2 added to the extracellular solution was 10 μM, the intensity of cellular fluorescence was higher (in all 4 cells tested) than the fluorescence of the neighbouring regions of extracellular solution. When 100 μM fura-2 was added to the extracellular solution, the intensity of cellular fluorescence was (in all 4 cells tested) lower than that in the extracellular solution. This allowed us to conclude (see Results and Discussion) that, with our protocol of fura-2 loading, fura-2 only makes a small contribution to the endogenous calcium buffering in the pancreatic acinar cells.
RESULTS
Figure 1A shows the typical protocol for the droplet technique measurements. Synchronous measurements of the cytosolic Ca2+ concentration and the total extracellular calcium concentration are presented. Injection of CCK into the droplet solution evoked an immediate (on the time scale shown) and sharp, but transient, rise in the cytosolic Ca2+ concentration and also an immediate, but much less steep, rise in the total extracellular calcium concentration. As the cytosolic Ca2+ concentration declined, the steepness of the rise in the extracellular calcium concentration decreased and finally, when the cytosolic Ca2+ concentration reached the pre-stimulation resting level, there was no further rise in the extracellular calcium level (Fig. 1A) (Tepikin et al. 1992a, b, 1994; Camello et al. 1996).
Figure 1. Droplet technique measurements of calcium binding capacity in pancreatic acinar cells.

A, synchronous measurements of the cytosolic Ca2+ concentration and the calcium concentration in the extracellular droplet solution. The upper trace shows the total calcium concentration in the extracellular droplet solution ([Ca]dr) measured with fluo-3 fluorescence. The lower trace shows the cytosolic Ca2+ concentration ([Ca2+]c). The arrow indicates the time of CCK application to the extracellular droplet solution. The reduction in [Ca2+]c (Δ[Ca2+]c) is due to Ca2+ extrusion and the amount of Ca2+ extruded can be calculated from Δ[Ca]dr and the ratio of the volumes of the cell(s) and droplet. The dashed horizontal line in the lower panel indicates the middle of the [Ca2+]c interval relevant to the particular Δ[Ca2+]c and Δ[Ca]dr values highlighted. B, Ca2+ dependence of the calcium binding capacity. The points shown are derived from the data of the single experiment shown in A.
The extracellular solution contained a low calcium concentration and was also buffered by the calcium indicator. It has been shown that a decrease in the extracellular free Ca2+ concentration from 2 mM to 50 μM (this value is still more than 10 times higher than that in our experiments) results in elimination of Ca2+ influx in this cell type (Muallem et al. 1988). We therefore feel justified in assuming that there was no Ca2+ influx in our experiments. Direct measurements of the ER Ca2+ concentration have shown that a major part of the calcium is lost from the internal store in pancreatic acinar cells within a few seconds after the start of supramaximal agonist stimulation and that virtually all Ca2+ is released within 20 s (Mogami et al. 1998). We have also shown that, after supramaximal agonist stimulation, thapsigargin is capable of releasing only a very small amount of calcium and that a mitochondrial inhibitor (antimycin A) is incapable of releasing substantial amounts of calcium after agonist-induced discharge of internal stores (Camello et al. 1996). Taken together, these data strongly indicate that [Ca2+]c recovery after an agonist-evoked rise, under conditions of continued agonist stimulation and no Ca2+ entry, is due to Ca2+ extrusion across the plasma membrane. The decrease in the total cytosolic calcium concentration can be calculated from the measured changes in the droplet calcium concentration (Δ[Ca]dr) (Fig. 1A, upper trace) and the ratio of the volumes of droplet and cells. The calcium binding capacity of the cytosol can be determined from:
| (3) |
where Vdr is the volume of the droplet and Vc is the volume of the cell(s).
The advantage of these types of measurements is that we can determine not only the average calcium binding capacity, but also the calcium dependency of the calcium binding capacity. The calcium dependency was determined by plotting the calculated values of kc against the free cytosolic Ca2+ concentration at which these values were determined. Examples of such calculations for the traces in Fig. 1A are shown in Fig. 1B. The very high degree of scattering at small, close to resting, values of [Ca2+]c was typical for our experiments. This is due to the large contribution of noise in the measurements of Δ[Ca2+]c at close to resting calcium level (where Δ[Ca2+]c fluctuates around 0). The experimental points obtained during the first 20-30 s after the beginning of the response were not used for these calculations (in this period the smooth continuous decline in [Ca2+]c had not yet been established) and this determined the upper limit of [Ca2+]c for which kc could be obtained in our experiments.
Figure 2 shows the combined results of the eight experiments carried out. To decrease the error of measurement, all results obtained for 50 nM intervals of [Ca2+]c were pooled together (e.g. all kc values for [Ca2+]c from 150 to 200 nM were averaged for individual experiments. Thereafter the values of kc averaged from different experiments with appropriate standard errors of the mean were plotted against the mid-point of the [Ca2+]c intervals; in this example against a [Ca2+]c value of 175 nM).
Figure 2. Ca2+ dependence of calcium binding capacity.
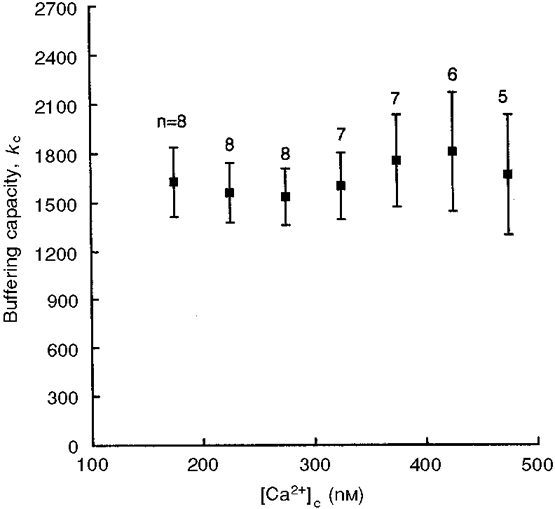
Calcium binding capacity plotted as a function of [Ca2+]c. The values shown represent means ±s.e.m. (n= number of experiments).
The kc values were mostly in the range 1500-2000. We did not find statistically significant changes in kc over the range of [Ca2+]c evaluated in our experiments. The amount of calcium lost from the cells as a result of supramaximal CCK stimulation in this set of experiments corresponded to a reduction of the total cellular calcium concentration of 1·1 ± 0·2 mM.
DISCUSSION
Our results show that the calcium binding capacity in the cytosol of pancreatic acinar cells is relatively high compared with that of many other cell types (see Introduction). A high cytosolic calcium binding capacity is essential for any small cell that needs to generate local Ca2+ signals, so that Ca2+ spreading from the place of its release or entry into the cytosol could be quenched by the calcium buffer that surrounds such a ‘hot spot’. Localized non-propagating Ca2+ signals in the secretory granule region have been reported for this cell type (Thorn et al. 1993; Kasai et al. 1993) and these are regarded as an essential feature of stimulus- secretion coupling in the acinar cells (Petersen et al. 1994). Very large and relatively long lasting cytosolic Ca2+ gradients have also been described in these cells (Gerasimenko et al. 1996). A large calcium binding capacity is probably essential for such forms of Ca2+ signalling.
In this study we have not investigated the mechanism of calcium buffering in the cytosol. Calcium binding cytosolic proteins (e.g. calmodulin), small calcium binding molecules (e.g. phosphate) and non-ER organelles (e.g. mitochondria) could contribute to this combined total calcium binding capacity. Most probably the binding capacity is distributed non-uniformly through the cytosol of these polarized secretory cells. Elucidating the mechanisms and intracellular distribution of calcium buffering in this and other cell types is one of the important tasks for the calcium signalling research field. Irrespective of the mechanism of buffering, the combined binding capacity that was estimated in this study is the buffering that calcium ions released from the ER face in the cytosol. This combined calcium binding capacity determines the amplitude of secretagogue-induced [Ca2+] signals in the cytosol of pancreatic acinar cells.
The calcium indicator present inside the cells could make some contribution to the calcium binding capacity (Neher & Augustine, 1992; Neher, 1995). Assuming a dissociation constant for fura-2 of 150 nM, one can calculate (for formula see Neher & Augustine, 1992) that 100 μM fura-2 should increase the calcium binding capacity by 240 at a [Ca2+]c of 100 nM. This contribution should decrease sharply with increasing values of [Ca2+]c. In our experiments the calcium indicator therefore only makes a very small contribution to the total cytosolic calcium binding capacity. It may seem surprising that we have not found a considerable decrease in the calcium binding capacity with increasing [Ca2+]c. This would be expected if buffering was produced by high affinity buffers. Our results could suggest a substantial contribution of low affinity buffers to the calcium binding capacity in the cytosol of this cell type.
The ER in pancreatic acinar cells comprises 22 % of the cellular volume (Bolender, 1974). This means that the decrease in the total ER calcium concentration evoked by supramaximal CCK stimulation should be approximately five times larger than the change in total cellular calcium concentration. From our measurements of total cellular calcium concentration changes, one can estimate that the decrease in the total calcium concentration in the ER induced by supramaximal agonist stimulation should be approximately 5 mM. The free Ca2+ concentration changes inside the ER that occurred as a result of supramaximal agonist stimulation were measured in pancreatic acinar cells by Mogami et al. (1998). When Ca2+ in the cytosol was buffered using a BAPTA-calcium mixture, clamping [Ca2+]c at approximately 100 nM (a value very close to the normal resting cytosolic level in intact cells), application of a supramaximal agonist dose resulted in a decrease in the Ca2+ concentration inside the ER of approximately 250 μM (Mogami et al. 1998). This means that the calcium binding capacity of the lumen of the ER is approximately 20, i.e. two orders of magnitude less than the calcium binding capacity of the cytosol.
The relatively low calcium buffering in the ER should allow fast Ca2+ release from this store and fast Ca2+ diffusion (Ca2+‘tunnelling’) through the luminally continuous ER (Mogami et al. 1997). Tunnelling Ca2+ through the cell also avoids the potential problem of initiating Ca2+-induced Ca2+ release in the cytosol, if Ca2+ had to move in this way to fill up the stores specializing in the local Ca2+ signal generation. Taking into account the considerable difference in the degree of Ca2+ buffering in the ER lumen and the cytosol, tunnelling should also provide a much faster mode of Ca2+ transport than propagation through the cytosol. This is important for delivering Ca2+ to regions specialized for release, far removed from the entry sites. In this way Ca2+ diffusion through the ER can replenish regions of the ER participating in local Ca2+ signalling.
References
- Al-Baldawi NF, Abercrombie RF. Cytoplasmic calcium buffer capacity determined with Nitr-5 and DM-nitrophen. Cell Calcium. 1995;17:409–421. doi: 10.1016/0143-4160(95)90087-x. [DOI] [PubMed] [Google Scholar]
- Allbritton NL, Meyer T, Stryer L. Range of messenger action of calcium ion and inositol 1,4,5-trisphosphate. Science. 1992;258:1812–1815. doi: 10.1126/science.1465619. [DOI] [PubMed] [Google Scholar]
- Al-Mohanna FA, Hallett MB. The use of fura-2 to determine the relationship between cytoplasmic free Ca2+ and oxidase activation in rat neutrophils. Cell Calcium. 1988;9:17–26. doi: 10.1016/0143-4160(88)90034-6. [DOI] [PubMed] [Google Scholar]
- Belan P, Kostyuk P, Snitsarev V, Tepikin A. Calcium clamp in isolated neurones of the snail Helix pomatia. The Journal of Physiology. 1993;462:47–58. doi: 10.1113/jphysiol.1993.sp019542. [DOI] [PMC free article] [PubMed] [Google Scholar]
- Berlin JR, Bassani JWM, Bers DM. Intrinsic cytosolic calcium buffering properties of single rat cardiac myocytes. Biophysical Journal. 1994;67:1775–1787. doi: 10.1016/S0006-3495(94)80652-6. [DOI] [PMC free article] [PubMed] [Google Scholar]
- Bolender RP. Stereological analysis of the guinea pig pancreas. Journal of Cell Biology. 1974;61:269–287. doi: 10.1083/jcb.61.2.269. [DOI] [PMC free article] [PubMed] [Google Scholar]
- Bolsover SR. Two components of voltage-dependent calcium influx in mouse neuroblastoma cells: measurement with Arsenazo III. Journal of General Physiology. 1986;88:149–165. doi: 10.1085/jgp.88.2.149. [DOI] [PMC free article] [PubMed] [Google Scholar]
- Camello P, Gardner J, Petersen OH, Tepikin AV. Calcium dependence of calcium extrusion and calcium uptake in mouse pancreatic acinar cells. The Journal of Physiology. 1996;490:585–593. doi: 10.1113/jphysiol.1996.sp021169. [DOI] [PMC free article] [PubMed] [Google Scholar]
- Fierro L, Llano I. High endogenous calcium buffering in Purkinje cells from rat cerebellar slices. The Journal of Physiology. 1996;496:617–625. doi: 10.1113/jphysiol.1996.sp021713. [DOI] [PMC free article] [PubMed] [Google Scholar]
- Gerasimenko OV, Gerasimenko JV, Petersen OH, Tepikin AV. Short pulses of acetylcholine stimulation induce cytosolic Ca2+ signals that are excluded from the nuclear region in pancreatic acinar cells. Pflügers Archiv. 1996;432:1055–1061. doi: 10.1007/s004240050234. [DOI] [PubMed] [Google Scholar]
- Kasai H, Li Y, Miyashita Y. Subcellular distribution of Ca2+ release channels underlying Ca2+ waves and oscillations in exocrine pancreas. Cell. 1993;74:669–677. doi: 10.1016/0092-8674(93)90514-q. [DOI] [PubMed] [Google Scholar]
- Kasai H, Petersen OH. Spatial dynamics of second messengers: IP3 and cAMP as long-range and associative messengers. Trends in Neurosciences. 1994;17:95–101. doi: 10.1016/0166-2236(94)90112-0. [DOI] [PubMed] [Google Scholar]
- Mogami H, Nakano K, Tepikin AV, Petersen OH. Ca2+ flow via tunnels in polarized cells: Recharging of apical Ca2+ stores by focal Ca2+ entry through basal membrane patch. Cell. 1997;88:49–55. doi: 10.1016/s0092-8674(00)81857-7. [DOI] [PubMed] [Google Scholar]
- Mogami H, Tepikin AV, Petersen OH. Termination of cytosolic Ca2+ signals: Ca2+ reuptake into intracellular stores is regulated by the free Ca2+ concentration in the store lumen. EMBO Journal. 1998;17:435–442. doi: 10.1093/emboj/17.2.435. [DOI] [PMC free article] [PubMed] [Google Scholar]
- Muallem S, Beeker T, Pandol SJ. Role of Na+/Ca2+ exchange and the plasma membrane Ca2+ pump in hormone-mediated Ca2+ efflux from pancreatic acini. Journal of Membrane Biology. 1988;102:153–162. doi: 10.1007/BF01870453. [DOI] [PubMed] [Google Scholar]
- Muller TH, Partridge LD, Swandulla D. Calcium buffering in bursting Helix pacemaker neurons. Pflügers Archiv. 1993;425:499–505. doi: 10.1007/BF00374877. [DOI] [PubMed] [Google Scholar]
- Neher E. The use of fura-2 for estimating Ca buffers and Ca fluxes. Neuropharmacology. 1995;34:1423–1442. doi: 10.1016/0028-3908(95)00144-u. [DOI] [PubMed] [Google Scholar]
- Neher E, Augustine GJ. Calcium gradients and buffers in bovine chromaffin cells. The Journal of Physiology. 1992;450:273–301. doi: 10.1113/jphysiol.1992.sp019127. [DOI] [PMC free article] [PubMed] [Google Scholar]
- Petersen OH, Petersen CCH, Kasai H. Calcium and hormone action. Annual Review of Physiology. 1994;56:297–319. doi: 10.1146/annurev.ph.56.030194.001501. [DOI] [PubMed] [Google Scholar]
- Schwiening CJ, Thomas RC. Relationship between intracellular calcium and its muffling measured by calcium iontophoresis in snail neurons. The Journal of Physiology. 1996;491:621–633. doi: 10.1113/jphysiol.1996.sp021244. [DOI] [PMC free article] [PubMed] [Google Scholar]
- Tepikin AV, Llopis J, Snitsarev VA, Gallacher DV, Petersen OH. The droplet technique: measurements of calcium extrusion from single isolated mammalian cells. Pflügers Archiv. 1994;428:664–670. doi: 10.1007/BF00374591. [DOI] [PubMed] [Google Scholar]
- Tepikin AV, Voronina SG, Gallacher DV, Petersen OH. Acetylcholine-evoked increase in the cytoplasmic Ca2+ concentration and Ca2+ extrusion measured simultaneously in single mouse pancreatic acinar cells. Journal of Biological Chemistry. 1992a;267:3569–3572. [PubMed] [Google Scholar]
- Tepikin AV, Voronina SG, Gallacher DV, Petersen OH. Pulsatile Ca2+ extrusion from single pancreatic acinar cells during receptor-activated cytosolic Ca2+ spiking. Journal of Biological Chemistry. 1992b;267:14073–14076. [PubMed] [Google Scholar]
- Thorn P, Lawrie AM, Smith PM, Gallacher DV, Petersen OH. Local and global cytosolic Ca2+ oscillations in exocrine cells evoked by agonists and inositol triphosphate. Cell. 1993;74:661–668. doi: 10.1016/0092-8674(93)90513-p. [DOI] [PubMed] [Google Scholar]
- Toescu EC, Lawrie AM, Petersen OH, Gallacher DV. Spatial and temporal distribution of agonist-evoked cytoplasmic Ca2+ signals in exocrine acinar cells analysed by digital image microscopy. EMBO Journal. 1992;11:1623–1629. doi: 10.1002/j.1460-2075.1992.tb05208.x. [DOI] [PMC free article] [PubMed] [Google Scholar]
- Zhou Z, Neher E. Mobile and immobile calcium buffers in bovine adrenal chromaffin cells. The Journal of Physiology. 1993;469:245–273. doi: 10.1113/jphysiol.1993.sp019813. [DOI] [PMC free article] [PubMed] [Google Scholar]