

Abstract
The discharge patterns of 117 lateral cerebellar neurones were studied in cats during visually guided stepping on a horizontal circular ladder. Ninety per cent of both nuclear cells (53/59) and Purkinje cells (53/58) showed step-related rhythmic modulations of their discharge frequency (one or more periods of ‘raised activity’ per step cycle of the ipsilateral forelimb).
For 31 % of nuclear cells (18/59) and 34 % of Purkinje cells (20/58) the difference between the highest and lowest discharge rates in different parts of the step cycle was > 50 impulses s−1.
Individual neurones differed widely in the phasing of their discharges relative to the step cycle. Nevertheless, for both Purkinje cells and nuclear cells population activity was significantly greater in swing than in stance; the difference was more marked for the nuclear population.
Some cells exhibited both step-related rhythmicity and visual responsiveness (28 of 67 tested, 42 %), whilst others were rhythmically active during locomotion and increased their discharge rate ahead of saccadic eye movements (11 of 54 tested, 20 %). The rhythmicity of cells that were visually responsive was typical of the rhythmicity seen in the whole locomotor-related population. The step-related rhythmicity of cells that also discharged in relation to saccades was generally below average strength compared with the cortical and nuclear populations as a whole.
The possibility is discussed that the rhythmicity of dentate neurones acts as a powerful source of excitatory locomotor drive to motor cortex, and may thereby contribute to establishing the step-related rhythmicity of motor cortical (including pyramidal tract) neurones. More generally, the activity patterns of lateral cerebellar neurones provide for a role in the production of visually guided, co-ordinated eye and body movements.
Many previous reports (reviewed in Armstrong, 1986) have established that during locomotion rhythmic activity is widely distributed across populations of neurones in numerous cerebellar compartments. In the cortex, these compartments include the vermal B zone (Udo et al. 1981) and the paravermal C1, C2 (Armstrong & Edgley, 1984b) and C3 zones (Edgley & Lidierth, 1988; Armstrong & Marple-Horvat, 1996) of the anterior lobe, and the paramedian lobule (Apps & Lidierth, 1989); indeed the majority of Purkinje cells (P cells) that have been recorded in all regions have strongly rhythmic simple spike discharge patterns. Among the deep cerebellar nuclei, nucleus fastigialis (Orlovsky, 1972) and nucleus interpositus (Armstrong & Edgley, 1984a) both contain a high proportion of cells that exhibit step cycle-related modulation of their discharges. In both nucleus and cortex, therefore, rhythmicity is not only widespread (even prevalent) but often profound.
Rhythmic activity in motor cortex during walking has been well documented (Armstrong & Drew, 1984), and is strongest during visually controlled walking (Beloozerova & Sirota, 1993). The activity of motor cortical neurones provides an important control signal for such behaviour because pyramidal tract section makes visually guided walking on a horizontal ladder impossible (Liddell & Phillips, 1944). Motor cortical rhythmicity is reduced by lesions in the ventrolateral thalamus (Beloozerova & Sirota, 1988), suggesting that the cerebellum may be an important source of rhythmic drive. Some of the rhythmicity in the motor cortex may be due to rhythmic driving inputs from nucleus interpositus and nucleus fastigialis (see references above). However, it is not known whether dentate nucleus is also involved. By recording neuronal activity in dentate nucleus (and of P cells from the D zones of the cerebellar hemisphere) in awake, behaving animals, we therefore sought to test the hypothesis that the lateral cerebellum contributes to the establishment of the rhythmicity and control function of motor cortex during visually guided stepping.
Visual, visuomotor and saccade-related activities have been presented elsewhere (Marple-Horvat et al. 1998). This report establishes the extent of rhythmic neuronal activity in lateral cerebellar neurones and the phase relationships of individual and pooled discharges to the step cycle, and on this basis assesses the level of contribution to motor cortical rhythmicity provided by lateral cerebellar outflow.
METHODS
Task
The horizontal ladder has been described in detail in Amos et al. (1987). In brief, four purpose-bred adult cats were trained to walk on the rungs of a horizontal circular ladder for a fish reward given at rest platforms after each half-circuit. Rung spacing was such that a comfortable stride length was achieved by placing each forefoot onto alternate rungs. All rungs were energized with a high frequency carrier signal to indicate (see below) when each forelimb was in contact with a rung or swinging between rungs. The cats were also trained to sit quietly on a rest platform while a careful search was made (by brushing or tapping the skin, or moving joints) for a peripheral (somatic afferent) receptive field of the cell being recorded. Flash visual stimuli were delivered whilst the cats sat on one of the rest platforms. In addition, the ladder incorporated two rungs which could be made to move upwards (up to 6 cm) as a cat approached. Details of the neuronal activity generated by such encounters with a visible obstacle have been provided elsewhere (Marple-Horvat et al. 1998). No aversive techniques were employed. Before surgery, animals appeared to enjoy the task and surgery resulted in no behavioural change either during or between recording sessions.
Surgery
The surgical procedures to prepare the cats for single unit recording have been described in a recent report (Marple-Horvat et al. 1998). In brief, at an initial aseptic operation under full general anaesthesia (sodium pentobarbitone, Sagatal, BDH; 40 mg kg−1i.p., with supplementary intravenous doses as required) a titanium chamber was positioned over a craniotomy which exposed part of the left cerebellar hemisphere, including lobulus simplex and crus I of the ansiform lobule. The centre of the recording chamber was placed in each cat ca 7 mm away from the mid-line and 1 mm behind the fissura prima, permitting exploration of the hemispheral cortex and underlying lateral cerebellar nucleus with microelectrodes. A bipolar stimulating electrode was implanted into contralateral (right) brachium conjunctivum to permit antidromic identification of cerebellar nuclear cells projecting rostrally towards the thalamus. Electromyographic (EMG) leads were implanted into the lateral head of the triceps brachii muscle in both forelimbs. Unipolar leads implanted subcutaneously (just proximal to the wrist) were used to record the carrier (or ‘contact’) signals applied to the rungs to monitor footfall patterns. A small opening was made into each frontal sinus and a miniature Ag-AgCl pellet electrode fixed in place using dental acrylic cement in a shallow groove made in the bone as far lateral as possible on each post-orbital surface in order to record the electro-oculogram (EOG) generated by horizontal eye movements. The subminiature terminal strips connected to the EMG, EOG and contact signal leads were incorporated (with the recording chamber and a small T-bolt anchored to the skull) into a dental acrylic headpiece. Cats were given one or two doses of an opiate analgesic (Temgesic, Reckitt and Colman; 30 μg i.m.) during the post-operative recovery period. Antibiotic cover was provided throughout under appropriate veterinary direction.
Following a period of productive single-unit recording (up to 9 weeks) each cat was killed painlessly by anaesthetic overdose and the cerebellum removed and prepared for histological processing. Microelectrode tracks were seen (as lines of gliosis) in a cortical region centred around 7 mm and covering the range 5-9 mm from the mid-line. At the level of the cerebellar nuclei, the majority of tracks passed through the dentate nucleus but a minority were visible in the more medial region where the medial margin of dentate nucleus and the lateral margin of nucleus interpositus posterior overlap, so that in part these tracks were within nucleus interpositus. For this reason, a partitioned analysis of lateral vs. medial recordings was carried out (see Results).
Recording procedures
Extracellular recordings of cerebellar unitary activity were made daily (for up to 1 h) whilst the cat walked around the ladder, during exposure to visual stimuli and whilst eating on the rest platforms. Whenever possible (cells were sometimes lost whilst accumulating a sufficient number of steps) a careful search was made whilst the cat sat quietly to identify a peripheral receptive field for the neurone. Each cell was also tested for an antidromic response to stimulation of brachium conjunctivum with 0·2 ms pulses (constant current stimulator Grass S88). These stimuli evoked no movements and the animals seemed unaware of their delivery. In addition to the neuronal discharges, EMG and EOG signals were recorded, together with the rung contact carrier signals after decoding via tuned filters to produce a signal that was zero when a limb was in swing, and 1 V during contact with a rung.
Neuronal recordings were categorized as cortical on the basis of (1) presence of complex spikes in the single unit recording or nearby; (2) depth beneath the cerebellar surface (less than 5 mm was considered to be too superficial for nuclear cells). Nuclear cells were identified by the presence of a substantial white matter gap dorsal to the recording site followed by the absence of complex spike activity; and/or by antidromic excitation of the cell from the brachium conjunctivum. Thirty-seven (of 58) cortical recordings were identified by their complex spike activity as Purkinje cells; 21 were categorized as P cells on the basis of their simple spike shape and interspike interval distribution (so as to exclude mossy fibres and Golgi cells) - see Marple-Horvat et al. (1998).
Analysis
All signals were recorded on a digital tape recorder, unitary activity sampled at 44 kHz and other signals sampled at 3·75 kHz each. Analysis was carried out off-line after digitization using a CED 1401 analog-to-digital converter (Cambridge Electronic Design Ltd, Cambridge, UK). Neuronal action potentials were converted to logic pulses (5 V) using a time-voltage window analyser, and all other signals were digitized with a 5 ms sampling interval (i.e. at 200 Hz). Peri-event histograms (bin width 5 ms) of the step-related discharge patterns together with averages of EMG, EOG and contact signals were constructed using onset of EMG activity in triceps brachii (identified automatically as described in Marple-Horvat & Gilbey, 1992) and/or the rising edge of the contact signal (moment of footfall) as triggers (the former usually preceding the latter by ca 40 ms). In addition to these high-resolution histograms, neuronal activity was also represented at the lower resolution of 20ths of a step cycle (35 ms for a typical step duration of around 700 ms) to permit comparison with other recent studies of locomotor-related discharge patterns in other cerebellar compartments during flat surface or ladder walking; our analysis follows the precedent set by Edgley & Lidierth (1988) who divided the step cycle into 20ths. The same statistics were used to describe discharge patterns. Peak and minimum firing rates were taken to be the highest and lowest values, respectively, in any 20th of the step cycle, and modulation intensity was defined as the difference between the two.
A cell's activity was defined as step cycle modulated, or rhythmic, if in any part (20th) of the step cycle the criterion for ‘raised activity’ was exceeded. Periods of ‘raised activity’ of the neuronal discharge were 20ths in which firing rate was more than 14·1 % above the mean rate over the step cycle - equivalent to the 10 % criterion in any step 10th used in earlier studies (Orlovsky, 1972; Armstrong & Edgley, 1984a,b - see Edgley & Lidierth, 1988, for derivation). We also identified all cells whose modulation intensity exceeded 50 impulses s−1. In addition to establishing whether or not a cell's activity was rhythmic, and the extent of that rhythmicity, we determined the number of ‘raised activity’ portions of the step cycle, the phase(s) of the step cycle where they occurred, and the particular 20th in which discharge rate peaked.
All of the above measures were obtained for each cell, permitting firstly comparison of their individual discharge patterns and secondly pooling of results to obtain profiles of the step-related activity of the whole cortical and nuclear region sampled (a procedure used in most previous studies). A partitioned analysis was also carried out for both nuclear and cortical cells using a dividing line 7 mm from the mid-line. Cells more lateral than this were pooled, and cells more medial than this were pooled separately to permit comparison between the two. Such pooled profiles represent the activity patterns of ‘typical’ or ‘average’ cortical and nuclear cells within the region covered and are of utility in revealing common features (at the expense of individual differences) in the discharge patterns of cells that have been brought together.
RESULTS
Distribution and intensity of rhythmic neuronal activity during visually guided stepping
Extracellular recordings were obtained during visually guided stepping from a total of 117 cells, 58 cortical, categorized as Purkinje cells (see Methods), and 59 nuclear; Fig. 1 shows their locations in stereotaxic co-ordinates. A line has been drawn through each distribution at a laterality of 7 mm; in each case the majority of cells lies to the left of this line (i.e. more than 7 mm from the mid-line). Electrophysiological (Miles & Wiesendanger, 1975) and anatomical studies (Voogd & Bigare, 1980) indicate that the 49 cortical recordings more than 7 mm from the mid-line are drawn from the cerebellar D zones (since this is safely beyond the lateral margin of the C3 zone) whereas the nine recordings medial to this divide are best viewed as potentially either D or C3. For this reason, in the descriptions that follow of the individual and pooled discharges of P cells, the population has been partitioned into lateral and medial subgroups which have been statistically compared. Similarly, reference to standard atlases (e.g. Berman, 1968) and to the electrode tracks visible in the cerebellar sections both indicate that the 40 nuclear recordings obtained more than 7 mm from the mid-line are certainly drawn from the dentate nucleus, whereas the 19 recordings made more medially should best be considered as either from the most medial part of dentate nucleus or from nucleus interpositus, with the probability of the latter increasing medially. Lateral and medial subpopulations have therefore again been analysed separately and statistically compared.
Figure 1. The locations in stereotaxic co-ordinates of 58 cortical cells (A) and 59 nuclear cells (B) studied during visually guided stepping.

Cells whose activity had a modulation intensity > 50 impulses s−1 are indicated by filled squares, other rhythmic cells are indicated by filled circles and those that were not rhythmically active are represented by open circles. The large filled circles indicate two rhythmic cells recorded at the same location.
For all aspects of discharge pattern studied (mean rate during stepping, peak rate and modulation intensity) statistical comparison of the lateral and medial subgroups in both cortex and nuclei showed no significant difference between the two (at the 5 % level, Student's unpaired t test).
Values for the mean discharge rate (± 1 s.d.) during stepping for the 58 P cells and for the lateral and medial subgroup are presented in Table 1, together with values for the 59 nuclear cells and their lateral and medial subgroups. The frequency distribution of mean rates is shown in Fig. 2A (P cells) and B (nuclear cells) in each of which the medial subgroup is separately identified.
Table 1.
Measures of neuronal activity during visually guided stepping
| Mean rate(impulses s−1) | Peak rate(impulses s−1) | Modulation intensity (impulses s−1) | ||
|---|---|---|---|---|
| P cells | Lateral (n= 49) | 52 ± 39 | 80 ± 56 | 48 ± 44 |
| Medial (n= 9) | 41 ± 20 | 67 ± 33 | 44 ± 34 | |
| Combined (n= 58) | 51 ± 36 | 75 ± 54 | 46 ± 42 | |
| Nuclear cells | Lateral (n= 40) | 58 ± 26 | 89 ± 48 | 55 ± 51 |
| Medial (n= 19) | 63 ± 38 | 89 ± 55 | 46 ± 41 | |
| Combined (n= 59) | 59 ± 30 | 89 ± 50 | 52 ± 48 |
Figure 2. Frequency distribution histograms.
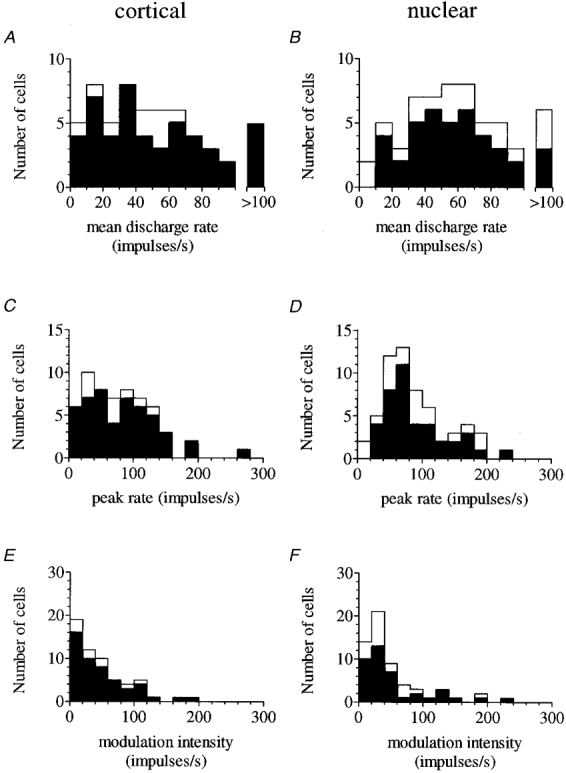
Mean discharge rates for 58 P cells and 59 nuclear cells during visually guided stepping are shown in A and B, respectively; peak rates for the same cells are shown beneath (C and D); and modulation intensity in E and F. In each plot, the filled area represents cells in the lateral subgroup (> 7 mm from mid-line). Note that all distributions except nuclear mean rates (B) are positively skewed so that the modal values are less than the means of Table 1.
Fifty-three P cells (91 %) and 53 nuclear cells (90 %) were judged to be rhythmic (see Methods). In every case, a cell's discharge pattern was consistent from step to step. Among cortical recordings, similar proportions were rhythmic laterally as medially (45/49 and 8/9 respectively); and the same was true for nuclear recordings (36/40 and 17/19, respectively). Of these rhythmically active neurones, 20 P cells (34 %) and 18 nuclear cells (31 %) exhibited modulation intensities in excess of 50 impulses s−1. For these cells, numbers are small (P cells 18/49 and 2/9 laterally and medially, respectively; nuclear cells 13/40 and 5/19, respectively), but there is certainly no evidence of lower proportions of such cells laterally than medially.
Peak rate and modulation intensity were calculated for each cell. Mean values (± 1 s.d.) for P cell and nuclear populations and their lateral and medial subgroups are presented in Table 1 (columns 2 and 3). The distributions of peak rate and modulation intensity are shown for P cell and nuclear recordings in Fig. 2C-F (in which cells from the medial subgroup are separately identified).
The measures presented in Table 1, and the absence of any significant difference in lateral vs. medial comparisons have important implications when put alongside information about the step phasing of the rhythmicity in P cells and nuclear cells and within their medial and lateral subgroups (see below and Discussion).
Twenty-nine of 53 P cells and 25 of 53 nuclear cells, roughly half in each case, possessed a single period of raised activity per step cycle. Thirteen P cells (one-quarter) and 18 nuclear cells (one-third) had two such periods. In the remaining cases for which a third (or occasionally fourth) period of raised activity could be distinguished, it always involved an isolated 20th of a step cycle.
Phasing of individual and pooled rhythmicity
A particularly striking finding was the wide diversity of phase relationships to the step cycle exhibited by different members of either the P cell or nuclear populations (in contrast to the tight phase relationship invariably maintained by an individual neurone throughout the period of its recording). The variation between cells is apparent in Fig. 3, which illustrates two example Purkinje cells (Fig. 3A and B) from the lateral subgroup (both recorded 7·4 mm from the mid-line), and two dentate cells (Fig. 3C and D) with rather disparate patterns of activity.
Figure 3. High resolution discharge histograms of two example Purkinje cells from the lateral subgroup (A and B) and two dentate cells (C and D).
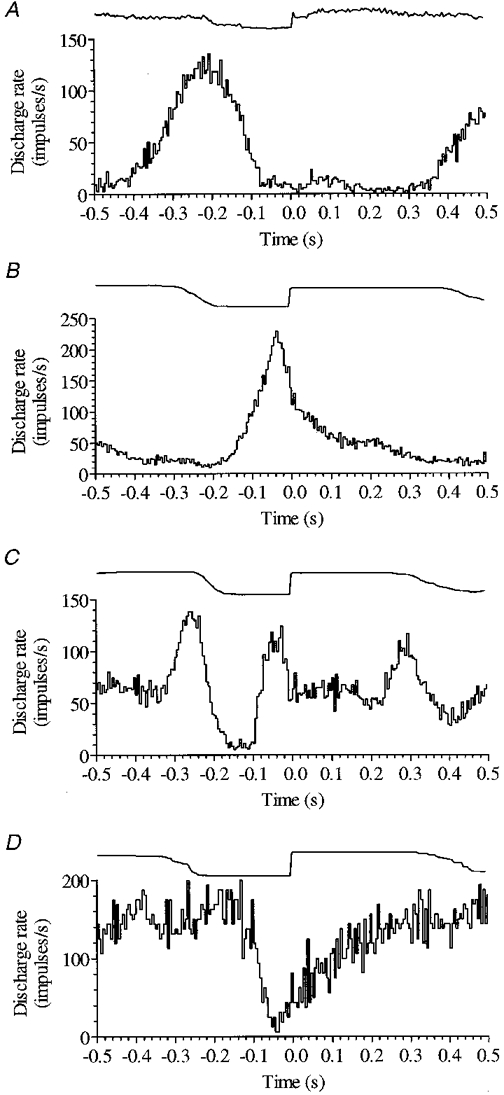
Cell illustrated in A is most active around the onset of swing (cessation of activity in triceps shown above). Cell in B fires at peak rate just prior to footfall indicated by the rising contact signal (above) used to trigger averages, and maintains a raised level of activity throughout much of stance. The dentate cell in C had two active periods per step cycle, one in late stance and a second in late swing. The cell shown in D maintained a high discharge rate throughout much of the step cycle but its activity was suppressed in late swing. Histograms A-D composed of 127, 186, 142 and 32 trials, respectively; bin width 5 ms.
The percentages of cells that had raised activity in each 20th of the step cycle were calculated. The highest percentage of P cells with raised activity, 39 %, occurred in mid-swing, whereas the lowest percentage, 15 %, occurred in late stance; i.e. two and a half times more cells had raised activity in mid-swing than in late stance. For nuclear cells, a maximum of 37 % had raised activity in early and mid-swing, again two and a half times more than the minimum value of 14 % a third of the way into stance.
The diversity of step phase relationships between cells might relate to differences in location of any somatic afferent receptive field (localized as described in Methods), but we could identify no clear distinction between the step-related rhythmicity of groups of cells that had peripheral receptive fields confined to different parts of the ipsilateral forelimb as against those that were restricted to the face and neck, or those that included both limb and neck (though numbers were often small).
In order to obtain profiles of P cell or nuclear activity as a whole (and to permit comparison with other studies), the individual discharge patterns within each population and within the lateral and medial divisions of each population were pooled. Figure 4A shows the discharge rate in each 20th of the step averaged across all P cells (continuous line) and across the medial and lateral subdivisions (dotted lines); and Fig. 4B shows the corresponding profiles for nuclear cells. Despite the individual diversity evident in Fig. 3, the overall discharge rate nevertheless reveals in both cortex and nucleus an uneven distribution of activity during the different phases of the step cycle. Net modulation of activity in all P cells resulted in the average (pooled) discharge rate peaking at 56 impulses s−1 in mid-swing of the ipsilateral forelimb, and falling to a minimum value of 49 impulses s−1 in stance. Statistical comparison (Student's paired t test) confirms that this difference between maximum and minimum rates in different phases of the step cycle is significant (at the 5 % level). Net activity in all nuclear cells had a broadly similar phase relationship; but overall discharge rates were higher, peaking at 67 impulses s−1 in mid-swing, and falling to 54 impulses s−1 in earliest stance. Again, the maximum and minimum rates in swing and stance, respectively, are significantly different (P < 0·05, paired t test). The range covered by the pooled discharge rate across the step cycle is 7 impulses s−1 for all P cells and 13 impulses s−1 for all nuclear cells - roughly double.
Figure 4. Phase relationship between activity of Purkinje cells and nuclear cells, and the step cycle.
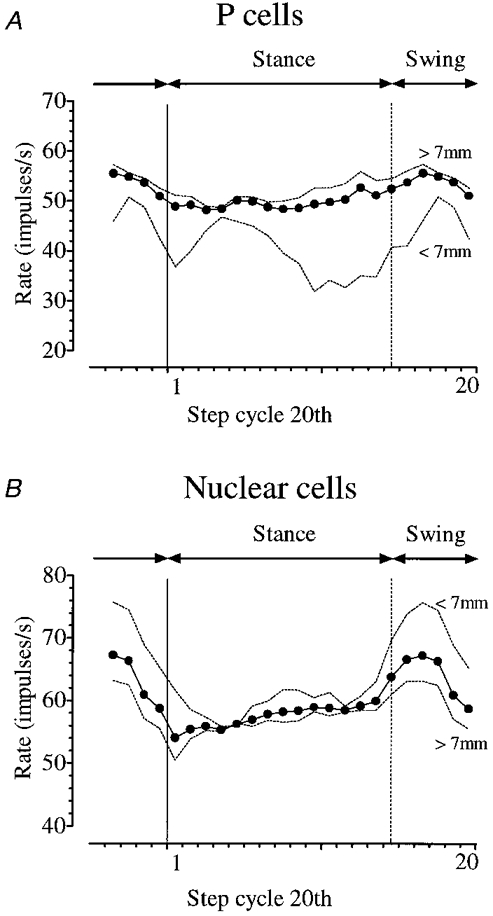
A, the mean discharge rate in each 20th of the step averaged across all Purkinje cells (continuous line), and across the medial and lateral subgroups separately (dotted lines). B, the pooled rate profile for all nuclear cells (continuous line) and for the medial and lateral subgroups (dotted lines). Onset of stance in each plot is indicated by the continuous vertical line at the moment of footfall (leading edge of first step cycle 20th). The dotted vertical line indicates onset of the swing phase.
There are visible differences between lateral and medial subgroups in Fig. 4. For P cells the pooled rate profile of cells more than 7 mm from the mid-line (hemispheral D zones) covers a range of 9 impulses s−1 and lies above the profile for more medial recordings (and for the whole P cell population) throughout the step cycle. For nuclear recordings the pooled rate profile of cells more than 7 mm from the mid-line (i.e. dentate cells) covers a range of 13 impulses s−1 and lies below the profile for more medial recordings (and for the whole nuclear population). Finally (but importantly), for both P cell and nuclear populations the range covered by the pooled rate is greater medially than laterally (for P cells it is double, and for the nuclear cells 50 % greater). This is despite the fact that the proportion of rhythmic cells, the peak rates achieved and the modulation intensities all indicate that the degree of rhythmicity is the same for the lateral subgroup of each population as it is for the medial subgroup. The significance of these findings is dealt with in the Discussion, though it should be noted here that the small sample of medial cells in each case (19 and 9 cells in nucleus and cortex, respectively) means that only tentative inferences can be made.
Saccade-related activity and visual reponsiveness in cells with step-related rhythmicity
Twenty-six of the rhythmic P cells were tested for saccade-related modulation (spontaneous saccades made whilst the cat was on the rest platforms), and nine cells (35 %) altered their discharge in relation to, and usually just before, saccades having a horizontal component; only two dentate neurones of 28 tested (7 %) were saccade related as well as rhythmically active during locomotion. Figure 5 illustrates the best example of both saccade-related activity and step-related rhythmicity in a single neurone. In general, the step-related rhythmicity of cells that also discharged in relation to saccades was below average strength: mean modulation intensity for these cells was 34 impulses s−1, compared with 46 and 52 impulses s−1 for the entire cortical and nuclear populations, respectively.
Figure 5. Step-related rhythmicity and saccade-related bursting in the same cell.
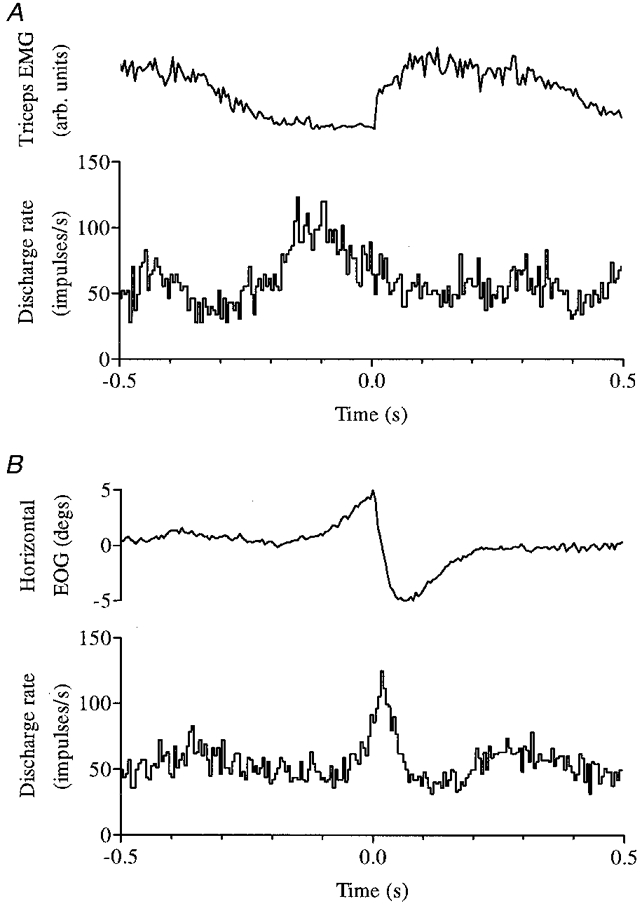
Rhythmic modulation of activity in relation to the step cycle of the ipsilateral forelimb is illustrated (together with rectified triceps EMG) in A for a Purkinje cell that also exhibited a high frequency burst just before and during rightwards saccadic eye movements (B). Histograms A and B are composed of 65 and 133 trials, respectively; bin width 5 ms in both cases.
Thirty-six of the 53 P cells exhibiting step-related rhythmicity were also investigated for responsiveness to visual stimuli (see Methods and Marple-Horvat et al. 1998) delivered during ladder walking or at rest. Sixteen cells (44 %) were visually responsive. Twelve of 31 rhythmic dentate cells tested (39 %) could be driven by visual stimuli. These cells have been described in a previous report (Marple-Horvat et al. 1998).
DISCUSSION
This is the first study in which single unit recordings have been obtained from the lateral cerebellum in an animal performing visually guided stepping, and is the first demonstration of step-related rhythmicity, often seen in combination with visual responsiveness and less often with saccade-related bursts. There are previous studies against which the strength of rhythmicity encountered in the present investigation can be measured in order to assess whether rhythmic excitatory drive from the lateral cerebellum is likely to contribute significantly to the rhythmic drive of cerebellar origin which Beloozerova & Sirota (1988, 1993) have identified as important in establishing the rhythmicity of motor cortex neurones during visually guided stepping (and without which cats are unable to perform such a task).
The strength of rhythmic driving inputs to motor cortex from dentate nucleus (compared with those from nucleus interpositus)
Beloozerova & Sirota (1988, 1993) demonstrated that rhythmicity in the motor cortex is much stronger during precision stepping in which accuracy of footfall is essential, and that inputs of cerebellar origin are important in establishing this rhythmicity. How much of the powerful step-related modulation in motor cortex under such conditions reflects rhythmic driving inputs from nucleus interpositus? Comparison of the activity of interpositus cells in animals performing treadmill walking (Armstrong & Edgley, 1984a) with activity in the nucleus interpositus during ladder walking (albeit a small sample of 15 cells; Armstrong & Marple-Horvat, 1996) fails to identify any increase in the strength of rhythmicity during precision stepping: the pooled activity of interpositus neurones rises and falls over a smaller range during ladder walking. There is therefore no evidence that outflow from the nucleus interpositus can account for the increased depth of modulation of motor cortical cells during precision stepping - rhythmic drive from that source is if anything less potent. Could the source of increased motor cortical rhythmicity be rhythmic driving inputs from the lateral cerebellum via the dentate nucleus?
Unfortunately, a comparison of dentate activity for treadmill and ladder walking is not available, but the present study certainly establishes that rhythmicity is both widespread and often strong during precision stepping. During such behaviour, rhythmic driving inputs to the motor cortex from the lateral cerebellum do therefore exist, and estimates of their potency can be made.
As in the nucleus interpositus (Armstrong & Edgley, 1984a), ca 90 % of dentate cells discharge rhythmically during locomotion. Intensity of modulation yields identical mean values for the two nuclei: 52 impulses s−1 (though the value for interpositus would probably be higher were the analysis at a resolution of step cycle 20ths). Comparison of the medial and lateral divisions within the present study (though limited by the small size of the medial subgroup - only 19 cells) yields no suggestion that cells lateral enough to be certainly from the dentate nucleus are individually less rhythmic than more medial cells, but it appears that phase relationships are spread more widely so that population activity in the dentate nucleus frequency modulates less deeply than in the medial subgroup, in which raised activity (in this admittedly small sample) is tied more tightly to the swing phase of the step cycle.
A clear answer to the question whether the dentate nucleus contributes a significant proportion of the rhythmic cerebellar drive to the motor cortex emerges when the pooled rate profile for the lateral (dentate) subgroup is compared with that for nucleus interpositus. The latter ranges over 20 impulses s−1 across the step cycle during treadmill locomotion (Armstrong & Edgley, 1984a) and over 14 impulses s−1 during ladder walking (Armstrong & Marple-Horvat, 1996). The range for the dentate nucleus during precision stepping is 13 impulses s−1. In ‘global’ terms this suggests that rhythmic excitatory drive to the motor cortex from the lateral cerebellum via dentate nucleus has about two-thirds the potency of the drive from the paravermal cerebellum via nucleus interpositus during overground (treadmill) locomotion, and is equal to the rhythmic drive from interpositus during ladder walking; but this is only part of the story, and perhaps not the greater part.
In addition to the estimate based on total nuclear output, there is evidence from individual discharge histograms which provides not only a second estimate of the degree of rhythmic drive but also an indication that the potency of rhythmic drive exerted by individual cerebellar neurones on individual motor cortex neurones may well be much greater than the pooled description would lead us to expect. The freedom to vary more widely in terms of phase relationship, whilst maintaining a strong individual rhythmicity, seen for dentate cells compared with more medial recordings in the present study, is probably significant; it means at the very least that the dentate population cannot be reduced to a two-word description such as ‘swing related’ and indicates a greater diversity in dentate nucleus than in nucleus interpositus. But perhaps most importantly, it means that if the pathway from dentate nucleus to motor cortex preserves separate channels for the output from cells that are most active at different times in the step cycle (the projection is clearly highly organized; see Rispal-Padel, 1979), rather than mixing them altogether (as implied by pooling), then dentate cells with particular phase relationships and strong rhythmicity may well be coupled to motor cortical cells with the same (or similar) phase relationships whose own strong rhythmicity (Beloozerova & Sirota, 1993) in part reflects the strongly rhythmic excitatory cerebellar drive. Furthermore, if such a level of organization exists, since the individual rhythmicity of dentate cells equals that of interpositus cells (see Results) then the potency of rhythmic drive from the lateral cerebellum at the level of individual (or small groups of) neurones is also estimated as equal to that from the paravermal cerebellum.
Our conclusion is therefore that the output from dentate nucleus probably plays a part equal to that of interpositus output in shaping the patterns of activity in motor cortex during precision stepping. If rhythmic activity in the dentate nucleus is absent (or much less) during overground locomotion (which has unfortunately not been studied), then increased rhythmic drive from the lateral cerebellum provides a straightforward explanation for the increased rhythmicity in motor cortex during precision stepping.
The significance of rhythmic activity in D zone Purkinje cells
Purkinje cells in lobule V lateral C2 and C3 zones have been studied during treadmill walking by Edgley & Lidierth (1988), and during visually guided ladder walking by Armstrong & Marple-Horvat (1996). In both studies data were represented in terms of 20ths of a step cycle, and analyses identical to those used in the present study were undertaken so that results can be directly compared.
The profiles of the general level of activity in the two regions during locomotion of either type are virtually identical. The rhythmicity in hemispheral cortex during ladder walking is not as strong as the rhythmicity in anterior lobe paravermal cortex during either ladder or treadmill locomotion. Three measures - the overall average of peak rates, the percentage of peak rates exceeding 100 impulses s−1 and the mean overall intensity of modulation - are lower by between a quarter and a third in the present study; though some uncertainty resides in these comparisons, since different animals were involved (perhaps walking at different speeds), and in one case a different locomotor task, so that differences in the various measures are not subject to unequivocal interpretation. The comparison of medial and lateral subdivisions within the present study suffers from none of these drawbacks, but is unfortunately made on the basis of a small medial sample of only nine cells, and consequently only tentative inferences can be drawn. This division yields no evidence of reduced rhythmicity laterally in individual cells from the hemispheral D zones compared with individual cells more medially whose zonal identity is uncertain, but perhaps suggests (as for nuclear cells) that the phase relationships of individual cells (that are as rhythmic as more medial counterparts) are spread more uniformly across the step cycle, so that the population activity profile for the lateral group varies within a narrower range than that of the medial group and than the profiles obtained in the other studies.
Relationship of locomotor-related rhythmicity to visual, visuomotor and saccade-related discharge patterns in hemispheral cortex and dentate nucleus
Twenty-eight (42 %) rhythmically active cortical and nuclear cells that were tested against a rung that moved on approach, or a flash of light, proved to be visually responsive. These findings have been presented and discussed elsewhere (Marple-Horvat et al. 1998) in terms of a likely role for the lateral cerebellum in producing visually guided, co-ordinated eye and body movements. At the level of the cerebellar cortex (there being only 2 nuclear examples) the step-related rhythmicity of nine cells that also discharged in relation to saccades was generally less than average strength. Perhaps the main difference between the lateral cerebellar neurones described in this report and those of the paravermal cortex and nucleus interpositus is that individual rhythmicity is less tightly tied to a restricted phase of the step cycle so that lateral cerebellar neurones can respond to a greater diversity of inputs, generated at any time during stepping, importantly those contributed by vision, which clearly provides for a broader role for lateral cerebellar neurones in co-ordinating visually guided eye and body movements.
Acknowledgments
This work was supported by a Wellcome Trust Programme Grant (D.E.M.-H.) and a visiting fellowship from the Spanish Ministry of Education and Science (J.M.C.).
References
- Amos AJ, Armstrong DM, Marple-Horvat DE. A ladder paradigm for studying skilled and adaptive locomotion in the cat. Journal of Neuroscience Methods. 1987;20:323–340. doi: 10.1016/0165-0270(87)90064-1. [DOI] [PubMed] [Google Scholar]
- Apps R, Lidierth M. Simple spike discharge patterns of Purkinje cells in the paramedian lobule of the cerebellum during locomotion in the awake cat. Neuroscience Letters. 1989;102:205–210. doi: 10.1016/0304-3940(89)90079-7. [DOI] [PubMed] [Google Scholar]
- Armstrong DM. Supraspinal contributions to the initiation and control of locomotion in the cat. Progress in Neurobiology. 1986;26:273–361. doi: 10.1016/0301-0082(86)90021-3. [DOI] [PubMed] [Google Scholar]
- Armstrong DM, Drew T. Discharges of pyramidal tract and other motor cortical neurones during locomotion in the cat. The Journal of Physiology. 1984;346:471–495. doi: 10.1113/jphysiol.1984.sp015036. [DOI] [PMC free article] [PubMed] [Google Scholar]
- Armstrong DM, Edgley SA. Discharges of nucleus interpositus neurones during locomotion in the cat. The Journal of Physiology. 1984a;351:411–432. doi: 10.1113/jphysiol.1984.sp015253. [DOI] [PMC free article] [PubMed] [Google Scholar]
- Armstrong DM, Edgley SA. Discharges of Purkinje cells in the paravermal part of the cerebellar anterior lobe during locomotion in the cat. The Journal of Physiology. 1984b;352:403–424. doi: 10.1113/jphysiol.1984.sp015300. [DOI] [PMC free article] [PubMed] [Google Scholar]
- Armstrong DM, Marple-Horvat DE. Role of the cerebellum and motor cortex in the regulation of visually controlled locomotion. Canadian The Journal of Physiology and Pharmacology. 1996;74:443–455. [PubMed] [Google Scholar]
- Beloozerova IN, Sirota MG. Role of motor cortex in control of locomotion. In: Gurfinkel VS, Ioffe ME, Massion J, Roll JP, editors. Stance and Motion, Facts and Concepts. New York: Plenum Press; 1988. pp. 163–176. [Google Scholar]
- Beloozerova IN, Sirota MG. The role of the motor cortex in the control of accuracy of locomotor movements in the cat. The Journal of Physiology. 1993;461:1–25. doi: 10.1113/jphysiol.1993.sp019498. [DOI] [PMC free article] [PubMed] [Google Scholar]
- Berman AL. The Brain Stem of the Cat. A Cytoarchitectonic Atlas with Stereotaxic Coordinates. Madison, WI, USA: University of Wisconsin Press; 1968. [Google Scholar]
- Edgley SA, Lidierth M. Step-related discharges of Purkinje cells in the paravermal cortex of the cerebellar anterior lobe in the cat. The Journal of Physiology. 1988;401:399–415. doi: 10.1113/jphysiol.1988.sp017169. [DOI] [PMC free article] [PubMed] [Google Scholar]
- Liddell EGT, Phillips CG. Pyramidal section in the cat. Brain. 1944;67:1–9. [Google Scholar]
- Marple-Horvat DE, Criado JM, Armstrong DM. Neuronal activity in the lateral cerebellum of the cat related to visual stimuli at rest, visually guided step modification, and saccadic eye movements. The Journal of Physiology. 1998;506:489–514. doi: 10.1111/j.1469-7793.1998.489bw.x. [DOI] [PMC free article] [PubMed] [Google Scholar]
- Marple-Horvat DE, Gilbey SL. A method for automatic identification of periods of muscular activity from EMG recordings. Journal of Neuroscience Methods. 1992;42:163–167. doi: 10.1016/0165-0270(92)90095-u. [DOI] [PubMed] [Google Scholar]
- Miles TS, Wiesendanger M. Organisation of climbing fibre projections to the cerebellar cortex from trigeminal cutaneous afferents and from the SI face area of the cerebral cortex in the cat. The Journal of Physiology. 1975;245:409–424. doi: 10.1113/jphysiol.1975.sp010853. [DOI] [PMC free article] [PubMed] [Google Scholar]
- Orlovsky GN. Work of the neurones of the cerebellar nuclei during locomotion. Biophysics. 1972;17:1177–1185. [Google Scholar]
- Rispal-Padel L. Functional characteristics of the cerebello-thalamo-cortical pathway in the cat. In: Massion J, Sasaki K, editors. Cerebro-Cerebellar Interactions. Amsterdam: Elsevier; 1979. pp. 67–103. [Google Scholar]
- Stein JF, Glickstein M. Role of the cerebellum in visual guidance of movement. Physiological Reviews. 1992;72:967–1017. doi: 10.1152/physrev.1992.72.4.967. [DOI] [PubMed] [Google Scholar]
- Udo M, Matsukawa K, Kamei H, Minoda K, Oda Y. Simple and complex spike activities of Purkinje cells during locomotion in the cerebellar vermal zones of decerebrate cats. Experimental Brain Research. 1981;41:292–300. doi: 10.1007/BF00238886. [DOI] [PubMed] [Google Scholar]
- Voogd J, Bigare F. Topographical distribution of olivary and cortico-nuclear fibres in the cerebellum: a review. In: Courville J, de Montigny C, Lamarre Y, editors. The Inferior Olivary Nucleus. New York: Raven Press; 1980. pp. 207–234. [Google Scholar]