

Abstract
In the non-steady state of moderate intensity exercise, pulmonary O2 uptake (V̇p,O2) is temporally dissociated from muscle O2 consumption (V̇m,O2) due to the influence of the intervening venous blood volume and the contribution of body O2 stores to ATP synthesis. A monoexponential model of V̇p,O2 without a delay term, therefore, implies an obligatory slowing of V̇p,O2 kinetics in comparison to V̇m,O2.
During moderate exercise, an association of V̇m,O2 and [phosphocreatine] ([PCr]) kinetics is a necessary consequence of the control of muscular oxidative phosphorylation mediated by some function of [PCr]. It has also been suggested that the kinetics of V̇p,O2 will be expressed with a time constant within 10 % of that of V̇m,O2.
V̇p,O2 and intramuscular [PCr] kinetics were investigated simultaneously during moderate exercise of a large muscle mass in a whole-body NMR spectrometer. Six healthy males performed prone constant-load quadriceps exercise. A transmit-receive coil under the right quadriceps allowed determination of intramuscular [PCr]; V̇p,O2 was measured breath-by-breath, in concert with [PCr], using a turbine and a mass spectrometer system.
Intramuscular [PCr] decreased monoexponentially with no delay in response to exercise. The mean of the time constants (τPCr) was 35 s (range, 20–64 s) for the six subjects.
Two temporal phases were evident in the V̇p,O2 response. When the entire V̇p,O2 response was modelled to be exponential with no delay, its time constant (τ′V̇p,O2) was longer in all subjects (group mean = 62 s; range, 52–92 s) than that of [PCr], reflecting the energy contribution of the O2 stores.
Restricting the V̇p,O2 model fit to phase II resulted in matching kinetics for V̇p,O2 (group mean τV̇p,O2= 36 s; range, 20–68 s) and [PCr], for all subjects.
We conclude that during moderate intensity exercise the phase II τV̇p,O2 provides a good estimate of τPCr and by implication that of V̇m,O2 (τV̇m,O2).
The steady-state aerobic cost of a given work rate in humans is not appreciably different among subjects differing in age, gender, physical fitness or state of training (Hagberg et al. 1980; Babcock et al. 1994). Consequently, the clues to the control of muscular oxygen consumption (V̇m,O2), and pulmonary oxygen uptake(V̇p,O2), reside in their non-steady-state response profiles with respect to potential intramuscular controllers (Kushmerick et al. 1992). During the kinetic phase of a rest-moderate-work transition, [ATP] is maintained by phosphocreatine (PCr) breakdown via the creatine kinase reaction and also by oxidative phosphorylation. While it is generally agreed that V̇m,O2 is controlled by features of this high energy phosphate bond splitting, the precise mechanisms by which the stressed muscle avoids what Chance et al. (1985) have termed ‘metabolic catastrophe’ remain to be elucidated.
The number of alternative mechanisms proposed for this control is great, and includes: control by the concentration of ADP (or inorganic phosphate; Pi) through Michaelis- Menten enzyme kinetics (Chance & Williams, 1956) or via a ‘higher order’ model (Jeneson et al. 1996), and thermodynamic control through the ‘phosphorylation potential’ ([ATP]/[ADP][Pi]) (see Brown, 1992) and the changes in Gibbs free energy of cytosolic ATP hydrolysis (ΔGATP) (Kushmerick, 1983; Meyer, 1989; for a review see also Meyer & Foley, 1996). A small number of investigators have performed experiments to determine the dynamic profiles of both PCr and V̇p,O2 in order to gain insight into these control mechanisms in humans. Barstow et al. (1994a, b) reported similar time constants for a fall in [PCr] and an increase in V̇p,O2 during the non-steady state of muscular exercise. However, due to methodological constraints, these authors utilized different muscle groups operating over a different range of metabolic rates to obtain these results: plantar flexion to determine the time constant for [PCr] (τPCr), and cycle ergometry during a different session to determine the time constant for V̇p,O2 (τV̇p,O2). Other investigators (McCreary et al. 1996) used identical modes of exercise when they compared τPCr, measured by 31-phosphorus magnetic resonance spectroscopy (31P-MRS) from the muscle (m.) lateralis gastrocnemius and m. soleus during plantar flexion, with τV̇p,O2, which was, again, performed outside the magnet. However, the confidence of parameter estimation of τV̇p,O2 is highly dependent on the steady-state increment attained during the exercise (Lamarra et al. 1987). Plantar flexion, in the study of McCreary et al. (1996), produced only an ∼100 ml min−1 increment in V̇p,O2. The confidence limits of the parameter estimation with such small increments in V̇p,O2 (ΔV̇p,O2,ss) are consequently poor, making differences in τ values difficult to discern with adequate confidence. Therefore, while both of these studies imply that τPCr and τV̇p,O2 are equal, further study of the issue is warranted.
The present study, therefore, was designed to compare the kinetics of [PCr] and V̇p,O2 measured simultaneously during moderate intensity m. quadriceps exercise in a whole-body NMR magnet, with special reference to different strategies for discerning τV̇p,O2.
METHODS
Six healthy male volunteers aged between 21 and 59 years provided informed consent (as approved by the Institutional Ethics Committee for Human Experimentation) to participate in the study, and were cleared to exercise inside the bore of the MR scanner. All subjects were healthy and physically active but were not in competitive training, apart from one subject (subject 1) who competed at University level sport.
Each subject performed a series of habituation tests in the Laboratory of Human Physiology before progressing to the Magnetic Resonance Unit for data collection. During the habituation studies, work rates were determined for each subject that were moderate in intensity (i.e. a work rate that was below the estimated lactate threshold (θL)). This was determined both from the profile of oxygen uptake at constant work rate (Whipp, 1996), and by the V-slope method (Beaver et al. 1986), defined as the slope change in pulmonary carbon dioxide output (V̇p,CO2) relative to V̇p,O2. The work rate for each subject was chosen to produce the largest possible subthreshold increment in V̇p,O2.
The subjects lay prone inside the bore of the MR scanner with their feet suspended in rubber stirrups that formed an integral part of a custom-designed plastic insert into the magnet bore (Fig. 1). The rubber stirrups provided a resistance against which the subject could perform rhythmic knee extension exercise of constant amplitude (i.e. the height extent of the magnet bore, approximately 30 cm) and constant frequency (32 pulses min−1) (Whipp et al. 1999). The subjects received an audible cue at 32 pulses min−1, such that the contraction of the quadriceps of the non-dominant leg occurred in unison with the interrogation of the quadriceps of the dominant leg by magnetic resonance, i.e. the muscles that are sampled are stationary during the sampling and contracting between each sample acquisition. 31P-MRS free induction decay (FID) signals were obtained every 1875 ms throughout the entire 16 min square wave exercise test protocol. Data were averaged over eight acquisitions (a 31P spectrum every 15 s), which was the optimal compromise between spectral signal-to-noise and temporal resolution. Pulmonary oxygen uptake was determined breath-by-breath using algorithms described by Beaver et al. (1981).
Figure 1. Schematic representation of exercise in the NMR system.

The 31P surface coil is placed under the quadriceps of the dominant leg and the subject breathes through the mouthpiece containing the tip of the extended sampling line and the non-ferrous turbine volume sensor. The output from the turbine passes through a low-pass filter, which is earthed to the Faraday cage, and into the volume measuring module (VMM).
The subject was ‘strapped down’ to the NMR scanner table by means of a non-distensible strap placed over the hips in order to minimize any extraneous movement (Fig. 1). Each subject performed a square wave exercise protocol: 240 s at rest, 360 s of constant-load exercise, and 360 s recovery. In order to increase the confidence of parameter estimation (see below), each subject repeated the exercise test twice with at least 6 min recovery between each subsequent test. One subject repeated the test three times. The work rate increments varied between approximately 30 and 80 W depending on the limits of moderate work for each subject. Work rate approximations were determined as the product of the amplitude of deflection of the exercising limbs, the frequency of deflection and the elastic coefficient of the rubber stirrups, which had been previously calculated over this length of deflection.
Measurement of breath-by-breath gas exchange
Pulmonary gas exchange was measured using a computer and the algorithms of Beaver et al. (1981) (CaSE, Gillingham, UK; Whipp et al. 1999). Expired volume was measured by a volume measuring module (VMM) with non-magnetic custom-built turbine with stainless-steel mountings and extended cable (Interface Associates, Laguna Nigel, CA, USA), and calibrated with a 3 l syringe (Hans Rudolph, Kansas City, MO, USA). Respired gas concentrations (O2, CO2 and N2) were measured every 20 ms using a QP9000 quarupole mass spectrometer (CaSE) calibrated against precision-analysed gas mixtures. Gas was drawn continuously from the mouthpiece along the extended 45 ft sampling capillary line, which had a 5-95 % rise time of < 80 ms and a delay of 2680 ms.
Intramuscular high-energy phosphates determined by 31P-MRS
The experiments were carried out in a 1.5 T super-conducting magnet (Signa Advantage, GE, Milwaukee, USA) with a 0.5 m bore using a one-pulse 31P NMR acquisition. A surface coil (8 in transmit and 5 in receive), tuned to a frequency of 25.85 MHz for phosphorus, was placed under the quadriceps of the dominant leg (in all cases the right leg) midway between the knee and hip joint (Fig. 1). The coil was securely fastened to the table, and displacement of the leg over the coil was prevented by the broad non-elastic strap over the hips. This allowed knee extensor exercise to be performed with the volume of interest (VOI) always stationary with the leg in the relaxed position.
Prior to the data acquisition, a series of axial gradient recalled echo (GRE) images of the thigh were acquired to help optimize the radio frequency (RF) coil position. Shimming was then performed on the VOI using an automated shimming package provided by the manufacturers. The homogeneity of the magnetic field was optimized by shimming to the proton signal of muscle water. The 31P RF excitation pulse was set at a level to give maximum [PCr] signals at a 5 s repetition rate from an 80 mm thick axial slice of muscle. FIDs for 31P spectra were collected every 1875 ms with a spectral width of 2500 Hz and 512 data points. Data were averaged every eight acquisitions and the dynamic signals for the three ATP peaks (α, β and γ), PCr and Pi could be determined every 15 s during the rest-exercise-rest transition. This maximized the signal-to-noise ratio of the spectra and the time resolution of the data set. Signal intensities of each resonance were calculated (as a batch job) by means of the time-domain VARPRO fitting program (van der Veen et al. 1988), using the appropriate prior knowledge of the ATP multiplets (Stubbs et al. 1996).
As in the studies of Barstow et al. (1994a, b), Evans et al. (1997) and McCreary et al. (1996), the T1 (longitudinal relaxation time) saturation factor was assumed to remain constant for each resonance throughout the experiment, and all phosphate metabolite levels are presented relative to their pre-exercise control values.
Analysis of [PCr] kinetics
Having established the areas of the three ATP peaks and the Pi and PCr peaks (Fig. 2) using the VARPRO fitting program, the data were converted to relative changes (%Δ) as determined by their percentage relationships, using the average during the 240 s of controlled rest to establish the 100 % level. Each rest-work transition was time aligned such that time zero was the onset of the constant-load exercise. The data set was then edited, such that any point that lay outside four standard deviations of the moving mean was considered to represent non-Gaussian ‘noise’ and deleted for kinetic analysis purposes. However, before any point was removed it was rechecked by re-running the VARPRO fitting program with the spectrum in question as a single task. The data set was then interpolated on a second-by-second basis and then corresponding data sets were superimposed and averaged. The [PCr] responses were then averaged over 10 s to give a mean value over the two or three exercise bouts performed for each subject.
Figure 2. The ‘stack plot’ of phosphorus metabolites in the exercising quadriceps from one representative subject (subject 2).
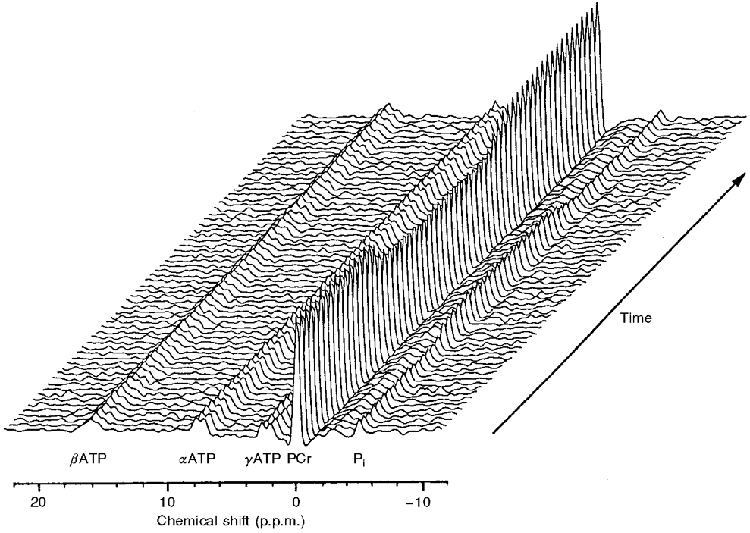
The reference peak, PCr, is set to 0 p.p.m. and each spectrum represents 15 s. The figure has been produced with the x-axis inverted such that the Pi peak may be visible in front of the large PCr peak.
The [PCr] response to the constant-load exercise was modelled as a monoexponential decline from the baseline to a new steady state in the form:
| (1) |
where [PCr]0 is the value of [PCr] at t = 0, and Δ[PCr]ss is the value to which the [PCr] declines below [PCr]0. All data from time zero to the end of the exercise period (360 s) were included in the fitting process. This describes a first order response with Δ[PCr]ss, τ and δ (delay) as the three defining parameters. In the case of the determination of [PCr] kinetics, the process was expected to begin with no delay and therefore δ was constrained to zero, i.e. the start of exercise. When left unconstrained, however, the estimated δ value was not significantly different from zero, varying by less than ± 5 s in all cases.
Analysis of V̇p,O2 kinetics
The corresponding measurements of V̇p,O2 were initially treated in the same way. Each data set was edited, as described above. However, no data points were removed from the phase I (φI) region (i.e. that region associated with a ‘cardiodynamic’ increase in V̇p,O2; Whipp et al. 1982). The data set was then interpolated on a second-by-second basis and then averaged every 10 s to provide a mean value for V̇p,O2 for comparison with the simultaneously collected [PCr] data. The data were modelled in two ways. Firstly (model 1), the ‘traditional’ monoexponential response beginning at t = 0 (i.e. δ= 0), where the whole data set was considered, thus:
| (2) |
This allows two parameters to be estimated, ΔV̇p,O2,ss (change in steady-state V̇p,O2) and τ′, where τ′ is also termed the mean response time for V̇p,O2.
For the second fitting procedure (model 2), the data were again modelled as a single exponential but in this case the exponential component of the response was considered to begin at the phase I-phase II transition (φI-φII transition). The φI-φII transition was determined both by inspection (see Fig. 3) and by maximizing the prediction of τ and its confidence limit. This means that the fitting field was moved around the expected φI-φII transition and any change in τ, or its associated confidence limit, was considered. As the fitting field was moved to include more ‘non-exponential’ data (moved closer to t = 0), the confidence limits of the prediction of τ would be expected to increase. That is, if φI data were included in the fitting field, the predicted τ would become greater and the confidence of the estimation would be reduced (i.e. the 95 % confidence limits would increase). Thus, the φI-φII transition could be determined to within the time resolution of the measurements, and the model 2 fit for the V̇p,O2 response to constant-load exercise can then be given by:
| (3) |
The confidence limits for parameter estimation of V̇p,O2 and [PCr] can be described by eqn (6) (see Discussion). This gives us the ability to calculate the 95 % confidence limits of each estimation of τ, as described by Lamarra et al. (1987). The ‘goodness-of-fit’, however, is not characterized in the equations of Lamarra et al. (1987). The confidence limits for the prediction of τ, therefore, will be expected to be within the limits described by eqn (6) only if the underlying process is a ‘true’ exponential. In order to determine how well the imposed function fitted the data, the residuals were considered both with respect to their flatness throughout the transient and by minimizing the sum squared errors (i.e. χ2).
Figure 3. The responses of one representative subject (subject 1) to a constant-load change in work rate of a moderate intensity of V̇p,O2 and [PCr].
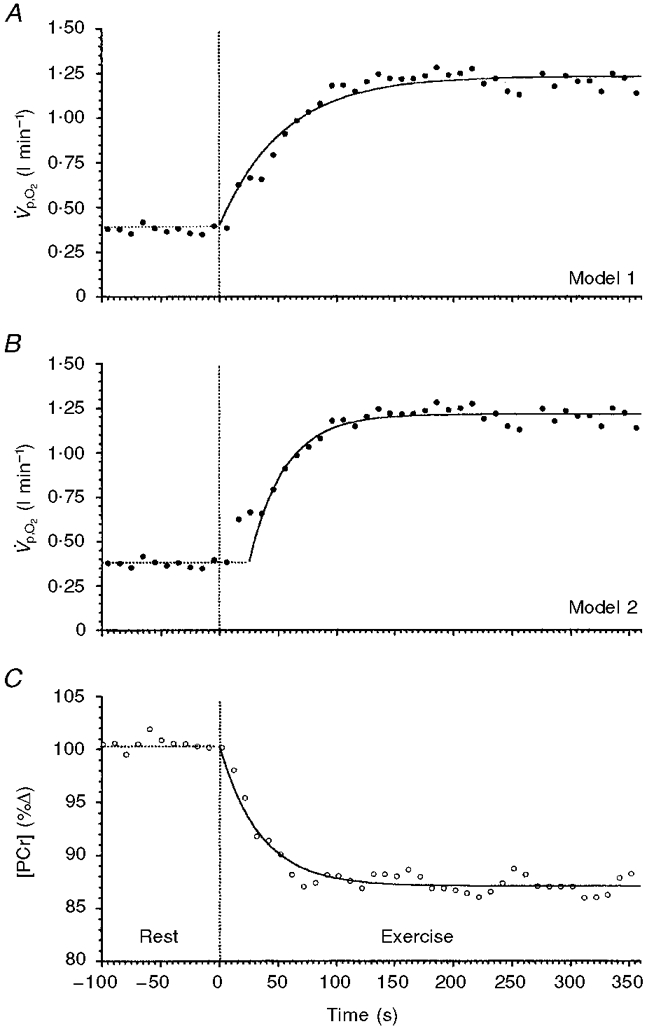
A and B show the same V̇p,O2 data modelled with different strategies; C shows the simultaneously determined [PCr]. The data in A are fitted with a monoexponential function beginning at the onset of exercise (model 1). The data in B are fitted with a monoexponential function that begins after the φI-φII transition and does not include the φI response in the fitting procedure (model 2). The data in C are fitted with a monoexponential function constrained to begin at the onset of exercise.
The functions were fitted to a non-linear least-squares regression using commercially available software (Microcal Origin). The predicted confidence limits of parameter estimation, considering the steady-state standard deviation of the noise, were determined by the equations of Lamarra et al. (1987). The actual confidence intervals associated with the imposed function were determined by the fitting program; confidence was set at 95 % and tolerance at 5 % (i.e. P < 0.05). The magnitude of the residuals was determined quantitatively by the χ2 value. τPCr for each subject was compared with τ‘V̇p,O2 and τV̇p,O2 as determined by the model 1 and model 2 functions, respectively. Values are given as means and standard deviations, or individual values and 95 % confidence intervals, where indicated.
RESULTS
Intramuscular high-energy phosphate metabolism and [PCr] kinetics
An example of the ‘stack plot’ of the sequential spectra for subject 2 is given in Fig. 2. The areas under the peaks represent the relative concentrations of the three isoforms of ATP (α, β and γ), PCr and Pi. The integrated relative concentration of all peaks of ATP did not change significantly at any point during the rest-exercise-rest protocol. An example of the response profile of [PCr] is shown in Fig. 3C. The response to the constant-load exercise was well described by a monoexponential (eqn (1)) with δ= 0 (i.e. with no delay).
The values for work rate approximation, τPCr and Δ[PCr]ss for all six subjects are given in Table 1. The mean Δ[PCr]ss was -11.4 % (± 1.5 s.d.); the mean τPCr was 35 s (± 15.2). All subjects expressed similar kinetic responses of [PCr] in response to the exercise apart from subject 3, who had a [PCr] response with a time constant significantly longer than that of other subjects.
Table 1.
Comparison of the kinetic responses of V̇p,O2 and [PCr] to moderate intensity exercise
| A | |||||||
|---|---|---|---|---|---|---|---|
| Subject no | No. of transitions (n) | ∼Work rate(W) | τ[PCr]ss(%Δ) | τPCr(s) | KnτPCr(s) | Residual** (absolute %) | |
| 1 | 2 | 80 | 13.3 | 35 | 3.1 | 0.786 | |
| 2 | 3 | 30 | 12.3 | 27 | 2.1 | 0.349 | |
| 3 | 2 | 30 | 8.8 | 64 | 4.6 | 0.454 | |
| 4 | 2 | 30 | 12.0 | 33 | 5.1 | 2. 418 | |
| 5 | 1 | 30 | 11.0 | 20 | 3.5 | 2.081 | |
| 6 | 2 | 60 | 11.1 | 31 | 6.3 | 1.371 | |
| Mean | 2.0 | 43 | 11.4 | 35.0 | 4.1 | 1.2 | |
| s.d. | 0.6 | 22 | 1.5 | 15.2 | 1.5 | 0.86 | |
| B. | Model 1 | Model 2 | ||||||
|---|---|---|---|---|---|---|---|---|
| Subject no | ΔV̇p,O2,ss(ml min−1) | τ′V̇p,O2(s) | Kntau;′(s) | Residual**(absolute ml) | ΔV̇p,O2(s) | Knτ(s) | Residual**(absolute ml) | ΔV̇p,O2*(s) |
| 1 | 820 | 54 | 2.5 | 0.0035 | 30 | 2.5 | 0.0016 | 25 |
| 2 | 320 | 54 | 1.8 | 0.0007 | 29 | 1.8 | 0.0002 | 6 |
| 3 | 530 | 92 | 4.6 | 0.0013 | 68 | 4.6 | 0.0008 | 15 |
| 4 | 260 | 52 | 3.1 | 0.0004 | 28 | 3.1 | 0.0003 | 29 |
| 5 | 220 | 57 | 4.7 | 0.0026 | 20 | 4.7 | 0.0012 | 33 |
| 6 | 650 | 64 | 3.0 | 0.0013 | 39 | 3.0 | 0.0010 | 22 |
| Mean | 467 | 62.2 | 3.28 | 0.0016 | 35.7 | 3.3 | 0.0085 | 25 |
| S.D. | 240 | 15.2 | 1.15 | 0.0012 | 17.0 | 1.2 | 0.0054 | 6.2 |
A, parameter estimates for [PCr] fall using eqn (1). B, parameter estimates for V̇p,O2 increase using model 1 (eqn (2)) and model 2 (eqn (3)).
Delay (δ) for model 2 V̇p,O2 only.
Residuals expressed are X2 values. ∼Work rate, work rate approximation (for calculation of work rate see Methods); Δxss, relative or absolute change in steady-state intramuscular [PCr] and V̇p,O2δV̇p,O2, delay from start of exercise to the onset of the extrapolated exponential increase in V̇p,O2; τx, time constant of intramuscular [PCr] decrease and φII V̇p,O2 increase; τ′V̇p,O2, mean response time for V̇p,O2; Knτx and Knτ′, 95% confidence limits for the predictions of τ and τ′ as defined by Lamarra et al. (1987).
τPCr for all subjects, except subject 3, lay within the range 20-35 s. τPCr for subject 3, however, was significantly longer at 64 s. The monoexponential function provided a good description in all cases.
V̇p,O2 kinetic responses to moderate work
The V̇p,O2 response to moderate work was, as expected, characterized by two temporal phases. The initial φI response contributed a small proportion of the entire response (range, 0-46 %) and lasted between 15 and 33 s (Table 1). The subsequent φII response formed the majority of the response. In four of the subjects V̇p,O2 increased during φI; no increase was observed in two subjects (3 and 5).
The ΔV̇p,O2,ss was, as expected, significantly dependent on the imposed work rate approximation, with the subjects who were able to maintain the highest subthreshold work rate also reaching the highest V̇p,O2, as shown in Table 1. It is salient to note, however, that subject 3 showed a greater than expected increase in V̇p,O2 considering the work rate performed, presumably reflecting a low mechanical efficiency of accomplishing the exercise task.
The use of model 1 to estimate the mean response time for V̇p,O2 resulted in estimates of τ‘V̇p,O2 that ranged from 52 to 92 s (Table 1). The expected 95 % confidence intervals (Knτ‘) for parameter estimations for each subject are also given in Table 1. An example of the model 1 exponential fit, for the data set of subject 1, is shown in Fig. 3A. The monoexponential function with δ = 0 clearly did not provide a good description of the actual V̇p,O2 response (Fig. 3A), particularly the early component. The systematic overestimation near the onset of exercise followed by the systematic underestimation of the subsequent response (in this case after approximately 75 s) is typical of the least-squares fitting of a two-compartment response with a single-compartment model (Whipp et al. 1982). This still allowed determination of the total O2 deficit, however, as the iterative process overestimated and underestimated the response to equal extents, and hence:
| (4) |
The values for the O2 deficit are given in Table 2.
Table 2.
The oxygen deficit and estimated change in oxygen stores during the non-steady state of moderate exercise
| Subject no. | ∼Work rate(W) | ΔV̇p,O2,ss(ml min−1) | O2 deficit ΔV̇p,O2,ssτ′(ml) | Delta;[O2 stores]†ΔV̇p,O2,ss (τ′—τ)(ml) |
|---|---|---|---|---|
| 1 | 80 | 820 | 738 | 328 |
| 2 | 30 | 320 | 277 | 123* |
| 3 | 30 | 530 | 822 | 221* |
| 4 | 30 | 260 | 225 | 104* |
| 5 | 30 | 220 | 216 | 143* |
| 6 | 60 | 650 | 704 | 282 |
Similar to predicted values, as calculated from Whipp & Ward (1982).
For estimation of Δ[O2 stores] see eqn (5) and Results. ∼Work rate, work rate approximation (for calculation of work rate see Methods). ΔV̇p,O2,ss, absolute change in steady-state V̇p,O2; τ′, mean response time for V̇p,O2; τ, time constant for φII V̇p,O2 response.
The second model, model 2, gave systematically smaller time constants for V̇p,O2. The τV̇p,O2 for φII only ranged between 20 and 39 s for all except subject 3 who, as with τPCr, had a longer time constant of 68 s. The model 2 exponential fit to the data set of subject 1 is shown in Fig. 3B. This function provided a good description of the φII response, as it did in all cases.
In order to compare the kinetics of the two variables, we phase-aligned the data. Firstly, the axes for [PCr] were inverted allowing us to compare the [PCr] fall with the V̇p,O2 increase. In the case of the model 1 fit, the start of exercise functioned as the start of the exponential for both [PCr] and V̇p,O2. The two responses and their fitting functions for one representative subject are superimposed in Fig. 4A. Even by inspection, it is apparent that the two processes do not follow the same kinetic responses. For the model 2 fit (Fig. 4B), the data set first had to be phase aligned by moving the V̇p,O2 data set back in time such that the exponential functions began at the same point in time, i.e. ‘ignoring’ the φI data. This phase aligning of the [PCr] and φII V̇p,O2responses to exercise allowed direct comparison of the simultaneously measured pulmonary and intramuscular variables. The two variables clearly follow the same time course. The original [PCr] fall and V̇p,O2 rise to their new steady-state levels for each subject are shown in Fig. 5A and B. The subsequent superimposition of the kinetic changes of [PCr] and V̇p,O2 (with the [PCr] axes inverted and the V̇p,O2‘phase shifted’) for all six subjects are shown in Fig. 5C. The two variables appeared to follow the same dynamic response profile in all cases, and it is pertinent to point out that, even in the case of subject 3 who showed such slow V̇p,O2 kinetics, the time course of [PCr] was not discernibly different.
Figure 4. The responses of V̇p,O2 and [PCr] to a step change in work rate of moderate intensity for one subject (subject 1).
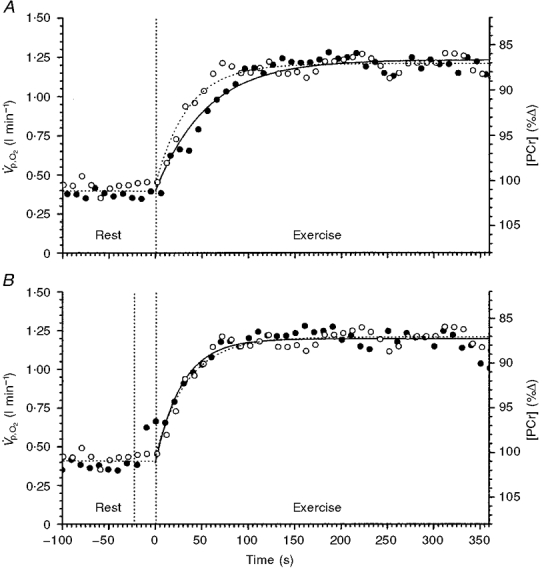
The responses are superimposed to show the dissimilarity, in the case of A, and similarity, in the case of B, of the kinetic responses of the two variables. A shows the V̇p,O2 (•) fitted by a model 1 exponential. B shows the V̇p,O2 (•) phase shifted and fitted by a model 2 exponential. The model 2 fit of V̇p,O2 closely represents the kinetic response of [PCr] (^) to the exercise (B).
Figure 5. The kinetic responses of V̇p,O2 and [PCr] to a constant-load change in work rate in six subjects.
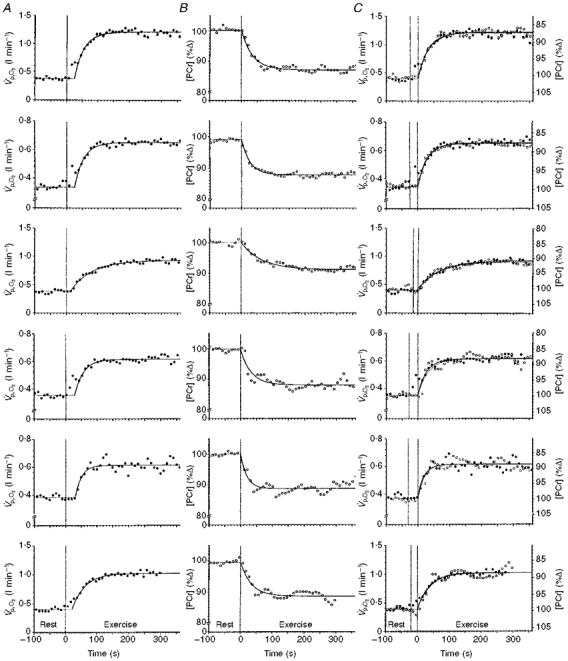
A shows V̇p,O2 with the φII response fitted by a monoexponential. B shows the simultaneously determined [PCr] response. C shows the identity of φII V̇p,O2 (•) and [PCr] (^) kinetics determined simultaneously during quadriceps exercise. The [PCr] scale has been inverted to facilitate kinetic comparisons. Graphs from top to bottom show data from subjects 1 to 6, respectively.
As shown in Fig. 6A, the time constants for φII V̇p,O2lay very close to the line of identity with τPCr. The error bars describe the 95 % confidence limits of the estimation for the time constant for both variables. This suggested that φII τV̇p,O2 closely reflected (i.e. to within 10 %) the kinetics of muscular oxygen utilization (V̇m,O2) as previously proposed by Barstow et al. (1990) based on their computer modelling and by Grassi et al. (1996) using direct measurements of V̇m,O2. The τ‘V̇p,O2 given by model 1, however, systematically lengthened the estimated time constant for V̇p,O2 with respect to that of [PCr] (Fig. 6B).
Figure 6. Comparisons of the time constants estimated by model 1 (τ‘) and model 2 (τ) with the simultaneously determined τPCr.
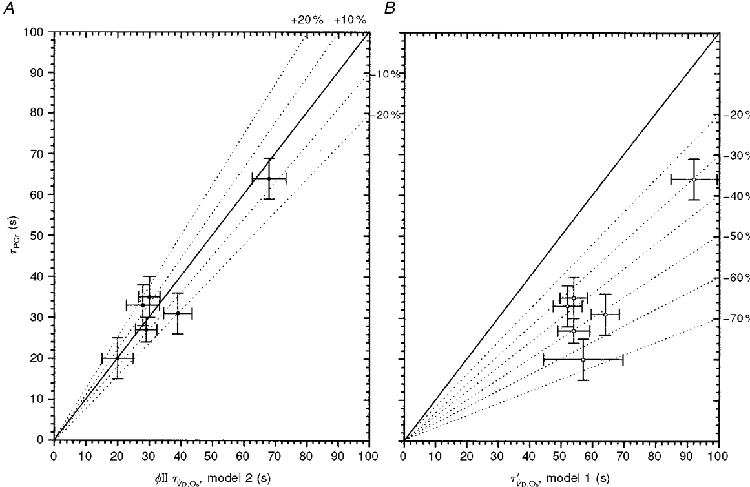
A, the time constants (τ) of φII V̇p,O2 (model 2) and [PCr] lie within ≈10 % of identity. The error bars give the 95 % confidence intervals of the prediction of τ for each subject. B, the mean response time of V̇p,O2, τ′ (model 1), systematically overestimates the time constant for the fall in muscle [PCr].
Having determined the [PCr] kinetic response, it was possible to consider the sources of oxidative energy utilized during the transition. The difference in the mean response time for V̇p,O2 (τ‘, reflecting the entire oxygen consumption throughout the transient) and the φII time constant (τ, reflecting muscular O2 utilization; Grassi et al. 1996) can be used to estimate the change in the oxygen stores, predominantly reflecting the change in muscular venous oxygen content (ΔCv,O2). Any reduction in oxygen dissolved in the muscle tissue water or from combination with myoglobin is likely to be minimal. Therefore, because cardiac output (Q̇) and V̇p,O2 have a highly linear relationship in the steady state (Grimby et al. 1966; Rowell, 1969; Whipp et al. 1996) and with the assumptions that: (i) τPCr is a surrogate of the time constant of V̇m,O2 (τV̇m,O2; at these moderate work rates), (ii) τPCr=φII τV̇p,O2, and (iii) the muscle blood flow and its distribution in prone exercise are comparable to those for upright cycling exercise, the change in oxygen stores (Whipp & Ward, 1982) can be estimated as:
| (5) |
The values for the change in oxygen stores are given in Table 2. The values lay between 104 and 328 ml of O2. The prediction for Δ[O2 stores] using this relationship would be expected to range from approximately 90 to 180 ml of O2, considering the work rates performed. Our estimates appear reasonable for the lower work rates but appear to be underestimates at the higher work rates (see Table 2). This is presumably due to the fact that our subjects were performing exercise transitions from rest. The assumption inherent in the equation of Whipp & Ward (1982) is that the relationship between V̇p,O2 and cardiac output is linear (with a positive intercept). However, this may not be the case when resting values are included. Furthermore, a greater contribution from transient increases in lactate (Δ[La]) at the higher absolute work rates is also possible.
DISCUSSION
When measured over the relevant region, the kinetics of the V̇p,O2 and [PCr] responses lie within the expected equivalence bounds, i.e. ±∼10 % (Figs 5C and 6, Table 1). That is, the τ for V̇p,O2 during moderate exercise is likely to reflect the average response of a heterogeneous ‘pool’ of muscle fibres with different contractile and biochemical characteristics (Kushmerick et al. 1992). The determination of the [PCr] fall in a relatively large section (approximately a hemisphere of diameter 5 in) of this exercising muscle (when compared with biopsy techniques, for example) effectively homogenizes the intramuscular response in an analogous sense to that for V̇m,O2 and V̇p,O2 measurements. Consequently, V̇p,O2 can be directly related to the ‘homogeneous’[PCr] fall in the muscles performing the exercise. The temporal dissociation of V̇p,O2 from the intramuscular [PCr] fall, and by implication V̇m,O2, is a necessary consequence of the size of the intervening venous volume and its blood flow dynamics. Studies by Mahler (1985) have shown a direct proportionality between the kinetics of [PCr] fall and V̇m,O2 in frog muscle, suggesting that our use of [PCr] as a proxy variable for the kinetics of muscle V̇O2 is justified, at least at moderate work rates. Furthermore, our results cohere well with those of Grassi et al. (1996) who demonstrated that the τ of V̇m,O2 was not significantly different from that of V̇p,O2 at the same moderate intensity exercise; however, they did not measure [PCr]. It seems reasonable to assume, therefore, that the φII V̇p,O2 response does indeed reflect that of intramuscular [PCr] fall, and by implication that of V̇m,O2, during the transition from rest to moderate work in humans - at least to the limits of confidence provided by our data. While both McCreary et al. (1996) and Barstow et al. (1994a, b) have also made this point, the small amplitude of the ΔV̇p,O2 response (∼100 ml min−1) in the former, and the different muscle groups operating over different ranges of ΔV̇p,O2 in the latter (neither making comparisons of simultaneously acquired data), did not make these studies ideal for the purpose of inferring control mechanisms. The present study was designed to exercise a sufficiently large muscle mass to produce large changes in ΔV̇p,O2,ss and Δ[PCr]ss and for the two variables to be measured simultaneously (as have Evans et al. (1997) although not with reference to parameter estimation). These are important requirements which enable parameter estimation with the relevant level of confidence (approximately 10 %; as discussed in Whipp et al. 1999). A further confounding influence on the parameter estimation is that of the breath-to-breath noise. This has previously been shown to be part of an uncorrelated Gaussian stochastic process thereby allowing parameter estimation to within known bounds of confidence. By increasing the number of exercise bouts performed, Lamarra et al. (1987) showed that the 95 % confidence limits (Kn) for the estimation of τ can be increased. The limits of confidence can be described by the equation:
| (6) |
where x is either [PCr] or V̇p,O2, assuming that the [PCr]‘noise’ is similarly stochastic, as previously described for V̇p,O2. ^L is a constant depending on the value of the underlying τ and therefore the number of data points through the early part of the transition. S0 is the standard deviation of the point-to-point fluctuation in the steady state (i.e. -240 to 0 s at rest and approximately 180 to 360 s during exercise). n is the number of independent identical rest-work transitions that have been superimposed to minimize the influence of the stochastic noise process. The Kn for all predictions of τPCr was within the limits of acceptability needed to make comparisons with the kinetic responses of V̇p,O2.
The biphasic V̇p,O2 model proposed by Whipp et al. (1982), which has been used in the modelling of the V̇p,O2 responses in the present study, has important physiological implications, when compared with the more traditional models of Cerretelli & di Prampero (1987), Hill & Lupton (1923) and Whipp (1970). These authors describe the increase in pulmonary V̇O2 as a simple monoexponential function beginning at the onset of exercise. [PCr] breakdown, and any transient lactate production (as reflected in Δ[La]) (Cerretelli et al. 1979; Scheuermann et al. 1998), provides a buffer to the shortfall of oxygen uptake at the muscle. This traditional model of V̇p,O2 assumes that the contribution of the O2 stores to the energy transfer will result in an obligatory slowing of the V̇p,O2 kinetics relative to that of V̇m,O2. The time constant for V̇m,O2 (and by implication [PCr]) is, in this model, obligatorily faster than the time constant of V̇p,O2, as transient lactate production and a fall in venous oxygen stores causes a dissociation of the pulmonary and muscle V̇O2. The greater the increment in work rate (i.e. the greater the increment in V̇p,O2) the more pronounced is this dissociation.
The model of pulmonary oxygen uptake developed by Whipp et al. (1982), however, is based on the demonstration by Krogh & Lindhard (1913) that an initial phase of pulmonary V̇O2 is induced by the increase in blood flow through the lung (Q̇l). This is followed by a subsequent, usually predominant, phase that is related to that of the muscle oxygen uptake to blood flow ratio (V̇O2/Q̇m) increase throughout the transient, resulting in a reduction of the muscle venous, and therefore mixed venous, oxygen content. Here the [PCr] change (or some function thereof), directly responsible for the characteristics of V̇m,O2, will be closely reflected by the φIIV̇p,O2kinetics. Thus all three functions should manifest similar kinetics, i.e. to within approximately 10 %, if the predictions of Barstow et al. (1990) are valid under these conditions. The provision of oxygen to the exercising muscle at the onset of exercise seems not to be a limiting factor at this moderate work intensity (Gerbino et al. 1996; Grassi et al. 1998), although Hughson and his associates (Hughson & Morrisey, 1982) have disputed this.
Having identified the relevant parameters and variables for comparison, a further complication is apparent. This is the potential of cardiodynamic ‘distortion’ of the V̇m,O2 kinetics on reaching the lung (Barstow et al. 1990). This potential distortion may interfere with the determination of any relationship between τPCr and τV̇p,O2. For example, if at the onset of exercise cardiac output and muscle blood flow increased in precise proportion to V̇m,O2, then no change in the O2 content of the venous effluent from the exercising muscle would be evident at any point during the transient. This increase would be immediately reflected in V̇p,O2 (i.e. entirely Q̇ dependent). It would therefore be identical to V̇m,O2. In contrast, if Q̇ is constrained not to change throughout the transition, the increase in V̇p,O2 would only occur at a point in time after the onset of exercise, when the ‘hypoxic’ venous effluent reaches the lung. In this case, there would be an appreciable contribution of the O2 stores during the transient (see Fig. 2 of Whipp, 1994). The normal situation, where Q̇ does increase at the onset of exercise (Cummin et al. 1986), may confound any comparison of τV̇p,O2 and τPCr. The fall of [PCr] to a new steady-state level is expected to begin at the onset of exercise, but the blood flow associated with that fall also changes with its own kinetic response to exercise. This degree of the change in blood flow between the muscle and, some time later, the lung will be determined in large part by the kinetics of the increase in Q̇. Consequently, if the kinetics of φIIV̇p,O2are determined by the kinetics of intramuscular [PCr] fall (or some function thereof), then any estimation of τPCr would be expected to reflect φII τV̇p,O2 only to within approximately 10 % (Barstow et al. 1990).
The initial region (φI) of the V̇p,O2 kinetics is dominated by the increase in blood flow at the onset of exercise (Whipp et al. 1982). The extent of the change in oxygen stores (i.e. ΔCv,O2, Δ[oxy-myoglobin] and the O2 equivalent of Δ[La]) during the transient is related to the blood flow kinetics. More rigorously, the extent of the muscle oxygen stores utilization is directly proportional to the mean V̇O2/Q̇m ratio at the exercising muscle. The immediacy of the fall of [PCr] at the onset of exercise suggests a similarly rapid increase in V̇m,O2. This is contrary to the findings of Grassi et al. (1996, 1998) who suggest a pure delay dissociating the onset of an increase in V̇m,O2 from the onset of exercise. However, Q̇m does not increase in the same proportion as V̇m,O2 (or [PCr] fall), i.e. V̇O2/Q̇m increases throughout the transient. The consequence of this is that the [PCr] decrement (or some function thereof), muscle oxygen consumption and φII pulmonary oxygen uptake can all have approximately the same kinetics despite a fall in the body oxygen stores during the transition. The findings of this study, that φII V̇p,O2 and [PCr] kinetics are identical (to within ∼10 %), agree with the suggestions of this model. The differences in the necessary inferences between the model suggested by Whipp and colleagues (Whipp et al. 1982) (implying that the responses of [PCr], V̇m,O2 and φII V̇p,O2will all have the same kinetics at moderate work rates) and those of the models of Hill (1926) and Cerretelli and colleagues (Cerretelli & di Prampero, 1987) (that necessitate different kinetics for these variables) relate directly to the model assumptions.
All subjects in the current study showed a biphasic response in V̇p,O2 to exercise, as expected. Subjects 1, 2, 4 and 6 all showed an increase in V̇p,O2 during the φI region, as expected, but subjects 3 and 5 appeared to have what would be better described as a pure delay in the V̇p,O2 response. Subject 3 also had very slow kinetics for V̇p,O2 and [PCr]; however, τV̇p,O2 and τPCr still agreed to within 10 %. These two factors, slow kinetics and little or no V̇p,O2 increase during φI, combine to create a large O2 deficit. Furthermore, the φI profile is suggestive of a large contribution from the O2 stores to the energy transfer. The total O2 deficit of 822 ml is much greater than would be expected for an ∼30 W increase in work rate, presumably requiring a significant contribution from transient lactate production (Cerretelli et al. 1979). The long delay in V̇p,O2 for subject 5 gives rise to a large contribution of the O2 stores to the total O2 deficit. Using eqn (5), approximately 65 % of the total O2 deficit appears to be due to the contribution from the O2 stores, reflecting the ‘normal’ oxygen uptake kinetics but a relatively long delay from the onset of exercise until the expression of increased muscle O2 extraction is evident at the lung (i.e. O2 store contribution to ATP synthesis would be greater). This value for the stored oxygen utilization is plausible considering the work rates and the kinetics of V̇p,O2.
The results from the present study, that φII τV̇p,O2 and τPCr cohere to within ∼10 %, are in agreement with those suggested by Barstow et al. (1990) from their computer modelling, and also with those of Grassi et al. (1996) who made direct measurements of muscle blood flow and muscle oxygen consumption during exercise. However, the assumptions of the Barstow model were related to upright exercise; we used prone exercise. We know of no data to confirm the model assumptions for this mode of exercise, i.e. the size and constancy of the venous volume and the dynamics of the increases in Q̇ and Q̇m. The present results demonstrate that τ‘V̇p,O2, estimated by model 1, systematically overestimates the time constant for V̇p,O2 or [PCr] due to the influence of the φI component on the fitting procedure. Consequently, the conclusion that V̇p,O2 kinetics are necessarily slower than V̇m,O2 kinetics is, we believe, incorrect. However, this model 1 time constant, i.e. the mean response time (τ‘V̇p,O2), is physiologically useful; it can be validly used to establish the magnitude of the O2 deficit. The difference between τ and τ‘, therefore, reflects the relative contribution of the O2 stores and any transient lactate production to ATP synthesis during the non-steady state.
Acknowledgments
This study was supported by the MRC (UK), grant number G9536012. F. A. H. and J. R. G. are supported by the Cancer Research Campaign. The authors gratefully acknowledge Dr Marion Stubbs for her insightful comments.
References
- Babcock MA, Paterson DH, Cunningham DA, Dickenson JR. Exercise on-transient gas exchange kinetics are slowed as a function of age. Medicine and Science in Sports and Exercise. 1994;26:440–446. [PubMed] [Google Scholar]
- Barstow TJ, Buchthal S, Zanconato S, Cooper DM. Muscle energetics and pulmonary oxygen uptake kinetics during moderate exercise. Journal of Applied Physiology. 1994a;77:1742–1749. doi: 10.1152/jappl.1994.77.4.1742. [DOI] [PubMed] [Google Scholar]
- Barstow TJ, Buchthal S, Zanconato S, Cooper DM. Changes in the potential controller of human skeletal muscle respiration during incremental calf exercise. Journal of Applied Physiology. 1994b;77:2169–2176. doi: 10.1152/jappl.1994.77.5.2169. [DOI] [PubMed] [Google Scholar]
- Barstow TJ, Lamarra N, Whipp BJ. Modulation of muscle and pulmonary O2 uptakes by circulatory dynamics during exercise. Journal of Applied Physiology. 1990;68:979–989. doi: 10.1152/jappl.1990.68.3.979. [DOI] [PubMed] [Google Scholar]
- Beaver WL, Lamarra N, Wasserman K. Breath-by-breath measurement of true alveolar gas exchange. Journal of Applied Physiology. 1981;51:1662–1675. doi: 10.1152/jappl.1981.51.6.1662. [DOI] [PubMed] [Google Scholar]
- Beaver WL, Wasserman K, Whipp BJ. A new method for detecting anaerobic threshold by gas exchange. Journal of Applied Physiology. 1986;60:2020–2027. doi: 10.1152/jappl.1986.60.6.2020. [DOI] [PubMed] [Google Scholar]
- Brown GC. Control of respiration and ATP synthesis in mammalian mitochondria and cells. Biochemical Journal. 1992;284:1–13. doi: 10.1042/bj2840001. [DOI] [PMC free article] [PubMed] [Google Scholar]
- Cerretelli P, di Prampero PE. Gas exchange in exercise. In: Farlin LE, Tenney SM, editors. Handbook of Physiology, section 3, The Respiratory System, Gas Exchange. IV. Bethesda, MD, USA: American Physiological Society; 1987. pp. 297–340. chap. 16. [Google Scholar]
- Cerretelli P, Pendergast DR, Paganelli WC, Rennie DW. Effects of specific muscle training on V̇O2 on-response and early blood lactate. Journal of Applied Physiology. 1979;47:761–769. doi: 10.1152/jappl.1979.47.4.761. [DOI] [PubMed] [Google Scholar]
- Chance B, Leigh JS, Jr, Clark BJ, Marvis J, Kent J, Nioka S, Smith D. Control of oxidative metabolism and oxygen delivery in human skeletal muscle: A steady-state analysis of the work/energy cost transfer function. Proceedings of the National Academy of Sciences of the USA. 1985;82:8384–8388. doi: 10.1073/pnas.82.24.8384. [DOI] [PMC free article] [PubMed] [Google Scholar]
- Chance B, Williams CM. The respiratory chain and oxidative phosphorylation. Advances in Enzymology. 1956;17:65–134. doi: 10.1002/9780470122624.ch2. [DOI] [PubMed] [Google Scholar]
- Cummin AR, Iyawe VI, Mehta N, Saunders KB. Ventilation and cardiac output during the onset of exercise, and during voluntary hyperventilation, in humans. The Journal of Physiology. 1986;370:567–583. doi: 10.1113/jphysiol.1986.sp015951. [DOI] [PMC free article] [PubMed] [Google Scholar]
- Evans AB, Al-Himyary AJ, Hrovat MI, Pappagianopoulos P, Wain JC, Ginns LC, Systrom DM. Abnormal skeletal muscle oxidative capacity after lung transplantation by 31P-MRS. American Journal of Respiratory and Critical Care Medicine. 1997;155:615–621. doi: 10.1164/ajrccm.155.2.9032203. [DOI] [PubMed] [Google Scholar]
- Gerbino A, Ward SA, Whipp BJ. Effects of prior exercise on pulmonary gas-exchange kinetics during high-intensity exercise in humans. Journal of Applied Physiology. 1996;80:99–107. doi: 10.1152/jappl.1996.80.1.99. [DOI] [PubMed] [Google Scholar]
- Grassi B, Gladden LB, Samaja M, Stary CM, Hogan MC. Faster adjustment of O2 delivery does not affect V̇O2 on-kinetics in isolated in situ canine muscle. Journal of Applied Physiology. 1998;85:1394–1403. doi: 10.1152/jappl.1998.85.4.1394. [DOI] [PubMed] [Google Scholar]
- Grassi B, Poole DC, Richardson RS, Knight DR, Erickson BK, Wagner PD. Muscle O2 uptake kinetics in humans: implications for metabolic control. Journal of Applied Physiology. 1996;80:988–998. doi: 10.1152/jappl.1996.80.3.988. [DOI] [PubMed] [Google Scholar]
- Grimby G, Nilsson NJ, Saltin B. Cardiac output during submaximal exercise in active middle-aged athletes. Journal of Applied Physiology. 1966;21:1150–1156. doi: 10.1152/jappl.1966.21.4.1150. [DOI] [PubMed] [Google Scholar]
- Hagberg JM, Hickson RC, Ehsani AA, Holloszy JO. Faster adjustment to and recovery from submaximal exercise in the trained state. Journal of Applied Physiology. 1980;48:218–224. doi: 10.1152/jappl.1980.48.2.218. [DOI] [PubMed] [Google Scholar]
- Hill AV. Muscular Activity: The Herter Lectures for 1924. Baltimore, USA: Williams & Wilkins Co.; 1926. pp. 87–111. chap. III-IV. [Google Scholar]
- Hill AV, Lupton H. Muscular exercise, lactic acid and the supply and utilisation of oxygen. Quarterly Journal of Medicine. 1923;16:135–171. [Google Scholar]
- Hughson RL, Morrisey M. Delayed kinetics of respiratory gas exchange in the transition from prior exercise. Journal of Applied Physiology. 1982;52:921–929. doi: 10.1152/jappl.1982.52.4.921. [DOI] [PubMed] [Google Scholar]
- Jeneson JAL, Wiseman RW, Westerhoff HV, Kushmerick MJ. The signal transduction function for oxidative phosphorylation is at least second order in ADP. Journal of Biological Chemistry. 1996;271:27995–27998. doi: 10.1074/jbc.271.45.27995. [DOI] [PubMed] [Google Scholar]
- Krogh A, Lindhard J. The regulation of respiration and circulation during the initial stages of muscular work. The Journal of Physiology. 1913;47:112–136. doi: 10.1113/jphysiol.1913.sp001616. [DOI] [PMC free article] [PubMed] [Google Scholar]
- Kushmerick MJ. Energetics of muscle contraction. In: Peachey LD, Adrian RH, Gieger SR, editors. Handbook of Physiology, section 10, Skeletal Muscle. Bethesda, MD, USA: American Physiological Society; 1983. pp. 189–236. chap. 7. [Google Scholar]
- Kushmerick MJ, Meyer RA, Brown TR. Regulation of oxygen consumption in fast and slow-twitch muscle. American Journal of Physiology. 1992;263:C598–606. doi: 10.1152/ajpcell.1992.263.3.C598. [DOI] [PubMed] [Google Scholar]
- Lamarra N, Whipp BJ, Ward SA, Wasserman K. Effect of interbreath fluctuations on characterising exercise gas exchange kinetics. Journal of Applied Physiology. 1987;62:2003–2012. doi: 10.1152/jappl.1987.62.5.2003. [DOI] [PubMed] [Google Scholar]
- McCreary CR, Chilibeck PD, Marsh GD, Paterson DH, Cunningham DA, Tompson RT. Kinetics of pulmonary oxygen uptake and muscle phosphates during moderate-intensity calf-exercise. Journal of Applied Physiology. 1996;81:1331–1338. doi: 10.1152/jappl.1996.81.3.1331. [DOI] [PubMed] [Google Scholar]
- Mahler M. First-order kinetics of muscle oxygen consumption, and an equivalent proportionality between Q̇O2 and phosphorylcreatine level. Implications for the control of respiration. Journal of General Physiology. 1985;86:135–165. doi: 10.1085/jgp.86.1.135. [DOI] [PMC free article] [PubMed] [Google Scholar]
- Meyer RA. Linear dependence of muscle phosphocreatine kinetics on total creatine content. American Journal of Physiology. 1989;257:1076–1081. doi: 10.1152/ajpcell.1989.257.6.C1149. [DOI] [PubMed] [Google Scholar]
- Meyer RA, Foley JM. Cellular processes integrating the metabolic response to exercise. In: Rowell LB, Shepherd JT, editors. Handbook of Physiology, section 12, Exercise: Regulation and Integration of Multiple Systems. Bethesda, MD, USA: American Physiological Society; 1996. pp. 841–869. chap. 18. [Google Scholar]
- Rowell LB. Circulation. Medicine and Science in Sports and Exercise. 1969;1:15–22. [Google Scholar]
- Scheuermann BW, Kowalchuk JM, Paterson DM, Cunningham DA. O2 uptake kinetics after acetazolamide administration during moderate- and heavy-intensity exercise. Journal of Applied Physiology. 1998;85:1384–1393. doi: 10.1152/jappl.1998.85.4.1384. [DOI] [PubMed] [Google Scholar]
- Stubbs M, Van den Boogaart A, Bashford CL, Miranda PMC, Rodrigues LM, Howe FA, Griffiths JR. 31P-Magnetic resonance spectroscopy studies of nucleated and non-nucleated erythrocytes; time domain data analysis (VARPRO) incorporating prior knowledge can give information on the binding of ADP. Biochimica et Biophysica Acta. 1996;1291:143–148. doi: 10.1016/0304-4165(96)00058-x. [DOI] [PubMed] [Google Scholar]
- van der Veen JWC, de Beer R, Luyten PR, Ormnidt D. Accurate quantification of in vivo31P NMR signals using the variable projection method and prior knowledge. Magnetic Resonance in Medicine. 1988;6:92–98. doi: 10.1002/mrm.1910060111. [DOI] [PubMed] [Google Scholar]
- Whipp BJ. The rate constant for the kinetics of oxygen uptake during light exercise. Journal of Applied Physiology. 1970;30:261–263. doi: 10.1152/jappl.1971.30.2.261. [DOI] [PubMed] [Google Scholar]
- Whipp BJ. The slow component of O2 uptake kinetics during heavy exercise. Medicine and Science in Sports and Exercise. 1994;26:1319–1326. [PubMed] [Google Scholar]
- Whipp BJ. Domains of aerobic function and their limiting parameters. In: Steinacker JM, Ward SA, editors. The Physiology and Pathophysiology of Exercise Tolerance. New York: Plenum Press; 1996. pp. 83–89. chap. 12. [Google Scholar]
- Whipp BJ, Higgenbotham MB, Cobb FC. Estimating exercise stroke volume from asymptotic oxygen pulse in humans. Journal of Applied Physiology. 1996;81:2674–2679. doi: 10.1152/jappl.1996.81.6.2674. [DOI] [PubMed] [Google Scholar]
- Whipp BJ, Rossiter HB, Ward SA, Avery D, Doyle VL, Howe FA, Griffiths JR. Simultaneous determination of muscle 31phosphate and O2 uptake kinetics during whole-body NMR spectroscopy. Journal of Applied Physiology. 1999;86:742–747. doi: 10.1152/jappl.1999.86.2.742. [DOI] [PubMed] [Google Scholar]
- Whipp BJ, Ward SA. Cardiopulmonary coupling during exercise. Journal of Experimental Biology. 1982;100:175–193. doi: 10.1242/jeb.100.1.175. [DOI] [PubMed] [Google Scholar]
- Whipp BJ, Ward SA, Lamarra N, Davis JA, Wasserman K. Parameters of ventilatory and gas exchange dynamics during exercise. Journal of Applied Physiology. 1982;52:1506–1513. doi: 10.1152/jappl.1982.52.6.1506. [DOI] [PubMed] [Google Scholar]