

Abstract
Mechanically skinned skeletal muscle fibres from the twitch region of the iliofibularis muscle of cane toads were used to investigate the relationship between fibre glycogen content and fibre capacity to respond to transverse tubular (T-) system depolarization.
A large proportion of total fibre glycogen remained in mechanically skinned muscle fibres exposed to aqueous solutions. This glycogen pool (about 80 % of total fibre glycogen) was very stable when the preparation was incubated in a rigor solution (pH 7.0) but decreased gradually at a rate of 0.59 ± 0.20 % min−1 in a relaxing solution (200 nm [Ca2+]). The rate was considerably higher (2.66 ± 0.38 % min−1) when the preparations were exposed to 30 μm [Ca2+]. An even greater rate of glycogen loss was found after T-system depolarization-induced contractions. The Ca2+-dependent loss of fibre glycogen was caused by endogenous glycogenolytic processes.
Silver stained SDS gels of components eluted into relaxing solution from single skinned fibres revealed a rapid (2 min) loss of parvalbumin and at least 10 other proteins varying in molecular mass between 10 and 80 kDa but there was essentially no loss of myosin heavy and light chains and actin. Subsequent elution for a further 30 min in either relaxing or maximally Ca2+-activating solution did not result in additional, appreciable detectable loss of fibre protein.
Depletion of fibre glycogen was associated with loss of fibre ability to respond to T-system depolarization even though the bathing solutions contained high levels of ATP (8 mm) and creatine phosphate (10 mm).
The capacity of mechanically skinned fibres to respond to T-system depolarization was highly ositively correlated (P < 0.0001) with initial fibre glycogen concentration.
In conclusion, the results show that (i) the capacity of skeletal muscle to respond to T-system depolarization is related directly or indirectly to the non-washable glycogen pool in fibres, (ii) this relationship holds for conditions where glycogen is not required as a source of energy and (iii) the mechanically skinned fibre preparation is well suited to study the regulation of endogenous glycogenolytic enzymes.
There are consistent observations that depletion of intracellular glycogen stores in muscle is associated with reduced muscle performance (Bergström et al. 1967; Galbo et al. 1979; Vøllestad et al. 1988; Fitts, 1994; Chin & Allen, 1997), but the cellular mechanisms responsible for the glycogen depletion-related impairment of muscle function are not understood (Fitts 1994; Chin & Allen, 1997). So far, all studies on the role of glycogen in muscle have involved the depletion of the muscle glycogen pool by inducing a state of muscle fatigue. Therefore, from these studies it is not possible to draw unequivocal conclusions concerning the nature of the relationship between glycogen content and muscle contractility because in addition to glycogen depletion, many other factors, known to affect excitation-contraction (E-C) coupling (Stephenson et al. 1998), would have been altered in the myoplasm of the fatigued muscle fibres.
Further advances can be made if the relationship between glycogen and muscle contractility is investigated in single fibres containing different concentrations of glycogen under conditions where the ionic composition of the myoplasmic environment is kept constant and similar to that in a rested muscle. The mechanically skinned single muscle fibre preparation is particularly well suited for such a task because the ionic composition of the myoplasmic environment can be directly controlled under conditions where the normal signal transduction mechanism remains functional (Lamb & Stephenson, 1990). Furthermore, individual fibres from freshly dissected skeletal muscles exhibit a broad range of glycogen concentrations (Hintz et al. 1982; Nguyen et al. 1998b) and this allows preparation of mechanically skinned single fibres with a variety of naturally occurring glycogen concentrations.
The aim of this study was to use single muscle fibres from the cane toad to determine the stability of glycogen in mechanically skinned fibre preparations under various conditions used in physiological experiments and to investigate whether there is a relationship between fibre glycogen content and E-C coupling under conditions of high [ATP] and creatine phosphate in the myoplasmic environment. The results show that mechanically skinned fibre preparations exposed to aqueous solutions retain a large proportion of the initial glycogen in the intact fibre for a considerable period of time, that this pool of glycogen becomes depleted when contractions are elicited by the depolarization of the transverse tubular system (T-system), that fibre capacity to respond to T-system depolarization is related to glycogen content, and that this relationship is not based on the role of glycogen as an energy store.
Some of the results obtained in this study have been presented to The Physiological Society (Nguyen et al. 1997).
METHODS
Animals
Cane toads (Bufo marinus) were collected by the supplier (Peter Krauss, Mareeba, Queensland, Australia) either on the North Queensland Coast (summer toads: November to April) or on the coast of the Gulf of Carpentaria (winter toads: May to October). The animals were killed by double pithing after inducing a comatose state by 1 h exposure to 4°C in accordance with the procedure approved by the Animal Experimentation and Ethics Committee at Victoria University.
The mechanically skinned fibre preparation
The iliofibularis muscles were carefully dissected and blotted dry on Whatman no. 1 filter paper and were then placed under paraffin oil on a layer of Sylgard 184 (Corning, Medfield, PA, USA). Single fibres were dissected randomly from the twitch region of the iliofibularis muscle under a dissecting microscope and were then mechanically skinned with fine forceps as previously described (Lamb & Stephenson, 1990). After skinning, the fibre was normally divided into two segments and the dimensions of the segments (length and width in at least three places along their length) were measured with a video-camera/monitor system (Olympus) attached to the dissecting microscope. The volume of the fibre segments expressed as litre (l) fibre was calculated assuming them to be cylinders with a diameter equal to the mean value of the width of the fibre segments.
When no force recordings were made, both segments of a pair were used to measure glycogen content under various conditions as described later in the text. When force recordings were made, the first segment of a pair was mounted on the force recording apparatus and the other segment was used to estimate the glycogen concentration in the skinned fibre at the beginning of an experiment (‘initial glycogen’). The first fibre segment was tied at one end with 10.0 (Deknatel) braided silk to the peg of a Sensonor 802 force transducer whilst the other end was clamped between the jaws of a fine pair of platform (Barcroft) forceps as previously described (Lamb & Stephenson, 1990). All experiments were performed at 23–25°C.
T-system depolarization experiments
In the mechanically skinned muscle fibre, the T-system seals off uniformly along the entire length of the preparation (Lamb et al. 1995). Under the action of the Na+-K+ pump, the normal K+ and Na+ gradients are re-established across the T-system when the preparation is bathed in the K-HDTA repriming solution (Table 1) and the sealed T-system becomes polarized as in an intact muscle fibre at rest (Lamb & Stephenson, 1990). The T-system can then be rapidly depolarized by transferring the fibre segment to a similar solution where all K+ is replaced by Na+ (depolarizing solution, Table 1). Since the sarcoplasmic reticulum (SR) is almost equally permeable to Na+ and K+, we do not expect any significant swelling of the SR compartment when switching from a K+-based (repriming) solution to a Na+-based (depolarizing) solution (Lamb & Stephenson, 1990). The depolarization of the sealed T-system in a skinned fibre preparation initiates the normal sequence of events occurring in E-C coupling and elicits a transient force response (Fig. 1) analogous to a K+ contracture in an intact muscle fibre (Lamb & Stephenson, 1990). In all T-system depolarization experiments, the skinned fibre segments were initially adjusted to slack length and were then stretched by 20 % to provide optimum conditions for observation of force responses (Lamb & Stephenson, 1990). The preparations were then equilibrated for 2 min in the repriming solution before being subjected to the series of successive cycles of depolarization-repolarization of the T-system. Prior to depolarization of the T-system, the preparations were incubated in the repriming solution for a sufficiently long period of time (normally 1 min) to ensure that the height of the response was not dependent on the time in the repriming solution. Note that after a certain number of T-system depolarization-induced responses, the E-C coupling mechanism becomes impaired and the size of the T-system depolarization-induced force responses declines. This is known as fibre ‘run-down’ and cannot be reversed (Lamb & Stephenson, 1990). As illustrated in Fig. 1, 50 % run-down is reached when the T-system depolarization-induced force response becomes less than 50 % of the maximum depolarization-induced force response in that preparation and similarly, 90 % run-down is attained when the response to T-system depolarization decreases below 10 % of the maximum depolarization-induced response.
Table 1.
Composition of solutions used in physiological experiments (mm)
| K+ | Na+ | Mg2+ | HDTA | EGTAtotal | Ca2+ | |
|---|---|---|---|---|---|---|
| Repriming solution | 117 | 36 | 1 | 49.95 | 0.05 | 0.0002 |
| T-system depolarizing solution | — | 153 | 1 | 49.95 | 0.05 | 0.0002 |
| Relaxing solution | 117 | 36 | 1 | — | 50 | <10−6 |
| Maximally Ca2+-activating solution | 117 | 36 | 1 | — | 50 | 0.03 |
| Low-Mg2+ solution | 117 | 36 | 0.015 | 49.95 | 0.05 | 0.0001 |
All solutions also contained 8 mm ATP, 10 mm creatine phosphate and 60 mm Hepes pH buffer (pH 7.10 ± 0.01). Note that even without specific addition of inorganic phosphate to solutions, there was contaminating inorganic phosphate in solutions estimated at about 0.15 mm and that this concentration increased to 0.3 mm in maximally Ca2+-activated fibres (see Fryer et al. 1995 for more details). HDTA, hexamethylene diamine N,N,N′,N′-tetraacetate.
Figure 1. The run-down of force responses induced by the depolarization of the sealed T-system in a mechanically skinned muscle fibre segment.
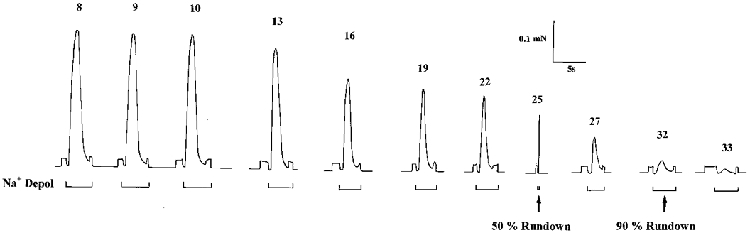
The preparation was successively equilibrated in the repriming solution to ensure maximal repriming of the voltage sensors in the T-system and was then transferred to the depolarizing solution. This caused T-system depolarization by ionic substitution, activation of the voltage sensors, Ca2+ release from the SR and activation of the contractile apparatus followed by voltage sensor inactivation, Ca2+ reuptake by the SR and force relaxation (see Lamb & Stephenson, 1990). In the fibre shown, 50 % and 90 % run-down occurred after the 25th and the 32nd response to T-system depolarization, respectively. The fibre segment diameter was 57.7 μm and the initial glycogen concentration estimated from the paired segment (see text) was 96 mmol glucosyl units (l fibre)−1. The 5 s time scale applies for the time in the Na+ depolarization solution as indicated by the bars under the traces, with the exception of the 25th response where the time scale was 75 s. Numbers above traces refer to response number. Note that the fibre capacity to T-tubule depolarization was estimated to be12.2 in this fibre (see text).
The most important parameter determining the loss of capacity to respond to T-system depolarization is the preceding number of T-system depolarization-induced responses and it has been suggested that the run-down is caused by the use-dependent loss of some factor from the preparation (Lamb & Stephenson, 1990). In this study, ‘fibre response capacity’ to T-system depolarization is defined as the equivalent number of maximum Ca2+-activated force responses that can be elicited in that preparation by successive T-system depolarization until the response declines to 50 % of its highest level. This parameter is obtained by dividing the sum of amplitudes of the depolarization-induced force responses to 50 % run-down by the maximum Ca2+-activated force response normally obtained at the end of an experiment. Therefore, fibre response capacity is always smaller than the number of depolarization-induced responses to run-down. Note that the ability of the contractile apparatus to develop maximum Ca2+-activated force decreases only marginally for the duration of an experiment. Control experiments with three freshly dissected mechanically skinned muscle fibres activated successively by rapidly raising [Ca2+] to 4 μM and then decreasing it to below 0.1 μM (Moisescu, 1976; Moisescu & Thieleczek, 1978) have shown that the maximal Ca2+-activated force obtained at 30 μM [Ca2+] decreased by only 6.6 ± 0.2 % after 35 activation-relaxation cycles lasting 4–6 s where the average force response was 85.5 ± 3.0 % of the maximum Ca2+-activated force. Both the duration of the activation and the force level attained during activation were considerably higher than the corresponding averages for the depolarization-induced force responses to 50 % run-down. Therefore, no specific correction was made to take into consideration the rather small deterioration in the ability of the skinned fibre to develop maximum Ca2+-activated force that may be caused by successive depolarization-induced responses.
The method used for expressing fibre response capacity takes into consideration the integrity of the coupling mechanism upon T-system depolarization in a particular fibre segment until the 50 % run-down is instated, because it is based on the premise that full coupling should result in sufficient Ca2+ release from the SR to elicit near maximal Ca2+-activated force responses (see for example Lamb & Stephenson, 1990).
Glycogen analysis
Fibre glycogen concentration was determined with the microfluorometric technique described previously (Nguyen et al. 1998a; b). The technique is based on a two-step enzymatic breakdown of glycogen. Step 1: glycogen → glucose (amylo-α-1,4-α-1,6-glucosidase), using a reagent of the following composition: 100 mM sodium acetate buffer, pH 5.0, 2.5 mM Tris, 0.002 % BSA, 10 μg ml−1 amylo-α-1,4-α-1,6-glucosidase (Boehringer Mannheim). Step 2: glucose + ATP → glucose-6-P + ADP (hexokinase) and glucose-6-P + NADP+→ 6-P-gluconate + NADPH + H+ (glucose-6-phosphate dehydrogenase), using a reagent of the following composition: 676 mM Tris-HCl pH 8.8, 5 mM MgCl2, 0.8 mM NADP, 0.8 mM ATP, 0.1 mM dithiothreitol (DTT), 2.4 μg ml−1 hexokinase (Boehringer Mannheim), 1.6 μg ml−1 glucose-6-P dehydrogenase (Boehringer Mannheim). The stoichiometric production of NADPH was measured microfluorometrically. To determine glycogen concentration in a mechanically skinned fibre segment after it had been exposed to an aqueous solution, the fibre segment was subjected to the two-step enzymatic reactions to convert the glycogen in the fibre into NADPH and the fluorescence signal was expressed in millimoles glucosyl units per litre fibre using commercial glycogen standards (Nguyen et al. 1998a).
A different protocol was used to measure the total glycogen concentration in a fibre segment before it was exposed to an aqueous solution (Nguyen et al. 1998b). First, the concentration of the diffusible, non-glycogen fluorogenic material in the fibre segment was measured. This was achieved by placing the freshly skinned fibre segment for 2 min in 1.5 μl of washing buffer and measuring the fluorescence signal in a small aliquot (0.5 μl). This fluorescence signal was then converted into millimoles equivalent NADPH per litre fibre (NGlyc). The remaining 1 μl of the washing buffer was then subjected to the two-step enzymatic reactions to convert all glycogen into 6-P-gluconate with stoichiometric production of NADPH. The fluorescence signal produced by the sample was converted to the amount of washed fluorogenic material (WFluo) and was expressed in millimoles equivalent NADPH per litre fibre. The difference between WFluo and NGlyc represents the concentration of glycogen, which was washed from the fibre (WGlyc). The washed fibre segment was then subjected to the two-step enzymatic reactions to convert the amount of non-washed glycogen (NWGlyc) in the fibre into 6-P-gluconate with stoichiometric production of NADPH and the fluorescence signal was expressed in mmoles glucosyl units per litre fibre. The total glycogen in the fibre was then calculated as WGlyc + NWGlyc (Nguyen et al. 1998a).
The protocol used to determine glycogen in fibre segments washed in different solutions and in the washout solutions was essentially the same as described above.
Glycogen analysis in fibres mounted in the force recording apparatus
The method of fibre segment attachment to the force recording apparatus (which involves tying one end of the fibre segment to the force transducer and clamping the other end between platform forceps) prevents about 30 % of the volume of the fibre segment used for force recording from being accessible to the bathing solutions. Therefore, a correction can be made to estimate the glycogen concentration in the part of the fibre segment that was exposed to solutions. In performing this correction it was assumed that all glycogen lost from the fibre segment originated from 70 % of the fibre volume and that the glycogen concentration in the remaining 30 % of the fibre volume, which was not accessible to the bathing solution, was the ‘initial glycogen concentration’, measured in its paired ‘control’ segment.
Analysis of muscle proteins by SDS-PAGE
Muscle proteins in single fibre segments or solutions to which single fibre segments were exposed for various lengths of time were solubilized at room temperature for 24 h in 10–20 μl SDS-PAGE solubilizing buffer (62.5 mM Tris, 2.3 % w/v SDS, 710 mM 2-mercaptoethanol, 10 mM DTT, 12.5 % v/v glycerol, 13.6 % w/v sucrose, 0.01 % w/v Bromophenol Blue, 0.1 mM phenylmethylsulfonyl fluoride (PMSF), 0.002 mM leupeptin and 0.001 mM pepstatin). The samples were subsequently boiled for 3 min and were then subjected to SDS-PAGE as described in Bortolotto et al. (1999). The separating gel contained acrylamide/bis-acrylamide (T = 12 % and C = 2.6 %, where T represents the total concentration (grams per 100 ml) of acrylamide + bis-acrylamide, and C is the concentration of bis-acrylamide, expressed as a percentage by weight of the total monomer), 750 mM Tris-HCl, pH 9.3, 20 % v/v glycerol, 0.1 % SDS, 0.04 % ammonium persulfate and 0.1 % v/v TEMED (Bio-Rad) and was allowed to set at room temperature overnight. The stacking gel contained acrylamide/bis-acrylamide (T = 4 %; C = 4.76 %), 125 mM Tris-HCl, pH 6.8, 10 % v/v glycerol, 0.1 % w/v SDS, 0.1 % w/v ammonium persulfate and 0.1 % v/v TEMED, and was allowed to set at room temperature for 30 min. The running buffer contained 0.1 % SDS, 50 mM Tris and 380 mM glycine and gels were run at constant current (10 mA per gel) for 4.5 h at room temperature. A 10 μl sample aliquot containing 4 nl fibre volume or a volume of solution in which a 4 nl fibre segment was washed/incubated for an appropriate time was loaded for each electrophoretic well. The gels were stained using the Hoefer silver staining protocol and protein bands corresponding to major muscle proteins (such as myosin heavy and light chains, tropomyosin, actin and parvalbumin) were identified based on their migration velocity using as reference commercially purified rabbit muscle proteins.
Data presentation and statistical analyses
All data are presented as means ± s.e.m. and statistical significance was assessed with Student's paired and unpaired t tests, as appropriate. Linear regression analysis was done using the software package GraphPad Prism (GraphPad Software, Inc., San Diego, CA, USA).
RESULTS
Glycogen stability in mechanically skinned muscle fibre preparations
In a previous study we found that toad skeletal muscle fibres contain a washable and a non-washable glycogen pool (Nguyen et al. 1998b). The non-washable glycogen pool, representing about 74–85 % of the total glycogen in intact fibres, did not decline in mechanically skinned muscle fibre segments after exposure to solutions lacking MgATP at pH 5.0 for up to 40 min (Nguyen et al. 1998b). Raising the pH to more physiological levels (pH 7.0) produced similar results to those obtained at pH 5.0. Thus, after 30 min exposure to a 100 mM sodium acetate solution of pH 7.0 without added Ca2+ or MgATP, the fraction of initial total glycogen remaining in the fibre was 83.9 ± 3.3 % and this value was not significantly different from the fraction of glycogen remaining in the skinned fibre preparation after only a 5 min wash (Fig. 2). These results were obtained with paired segments from the same fibre whereby the first segment was used to estimate the total initial glycogen concentration in the fibre and the second segment was used to estimate the glycogen remaining in the fibre after the respective period of incubation in the rigor solution. By using paired segments from the same fibre, where one segment acted as control, it was possible to avoid the large variability in glycogen concentration between fibres in the same muscle and between fibres in different toads (Nguyen et al. 1998a). The experimental point for zero wash time in Fig. 2 was obtained by measuring the total glycogen concentration in 12 pairs of fibre segments which were not exposed to the rigor solution and by calculating the ratio between total glycogen concentrations in the second and the first segment belonging to a pair. This ratio (1.09 ± 0.09, n = 12) was not statistically significantly different from 1.00.
Figure 2. Fraction of total glycogen remaining in mechanically skinned fibres after exposure to a rigor solution containing 100 mM sodium acetate at pH 7.0.
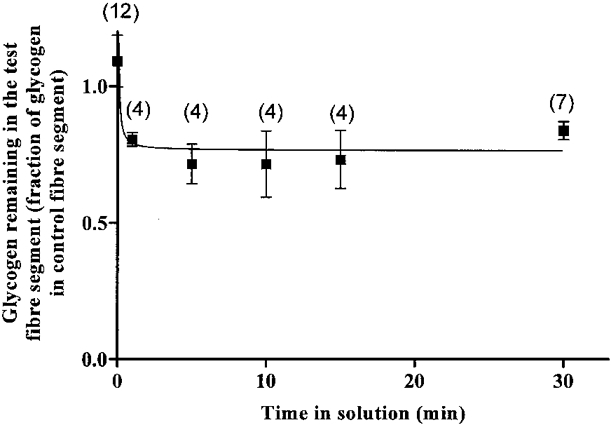
The results were obtained with paired segments from the same fibre, where the first segment was used to estimate total initial glycogen in the fibre and the second segment was used to estimate the glycogen concentration remaining in the fibre after the respective period of incubation. Numbers above data points indicate the number of pairs of fibre segments used. The data point at time zero was obtained from total glycogen measurements in 12 pairs of segments which were not exposed to the rigor solution. The points were fitted by a hyperbola.
The high retention of glycogen in skinned fibres exposed to MgATP-lacking solutions could be due to the formation of rigor cross-bridges between myofilaments, rendering the myofibrils rather stiff, which would prevent glycogen particles from being washed away from the preparation under rigor conditions. Therefore, for the present study it was important to examine the fate of the glycogen pool in mechanically skinned fibre segments exposed to a relaxing solution, which mimics the intracellular ionic composition of the myoplasmic environment when the fibre is at rest. Such a solution is the repriming solution (Table 1) used in the T-system depolarization-induced responses and results obtained with this solution are shown in Fig. 3. All results in Fig. 3 were obtained with paired segments from the same fibre. In these experiments the control segment in each pair was washed for 2 min in the repriming solution to mimic the conditions used in the T-system depolarization-induced experiments where the skinned fibre segments are washed for 2 min in the repriming solution prior to being subjected to the first depolarization. The test segment was also initially incubated for 2 min in the repriming solution and this was normally followed by further treatment. No further treatment of the test segment was necessary for the zero time wash where the data point represents the ratio between fibre glycogen in 12 test segments and their paired control segments when both were washed for 2 min in the repriming solution. As illustrated in Fig. 3, exposure of the test skinned fibre segments to repriming solution caused a steady, time-dependent loss of fibre glycogen at a rate of 0.59 ± 0.20 % fibre glycogen min−1. Thus, after 30 min exposure to this solution, the fibre glycogen content was 76.7 ± 7.0 % of that in the control segment (n = 8). Analysis of glycogen in the relaxing solutions in which the skinned fibre segments were incubated indicated that this glycogen pool could account for all fibre glycogen lost from the fibre under such conditions (ratio between glycogen present in the bathing solution and estimated glycogen lost from the test fibre segment was 1.14 ± 0.36 (n = 4), where the amount of glycogen lost was calculated by subtracting the concentration of glycogen remaining in the test fibre segment from that in the control fibre segment and by multiplying by the volume of the test fibre segment). Thus, in a relaxing solution, fibre glycogen does not appear to be degraded to simple sugar molecules before being lost into the bathing solution. This is fully consistent with the fact that glycogenolysis does not occur at low [Ca2+] and in the absence of added inorganic phosphate.
Figure 3. Time course of fibre glycogen loss from mechanically skinned fibre segments exposed to relaxing and maximally Ca2+-activating solutions.
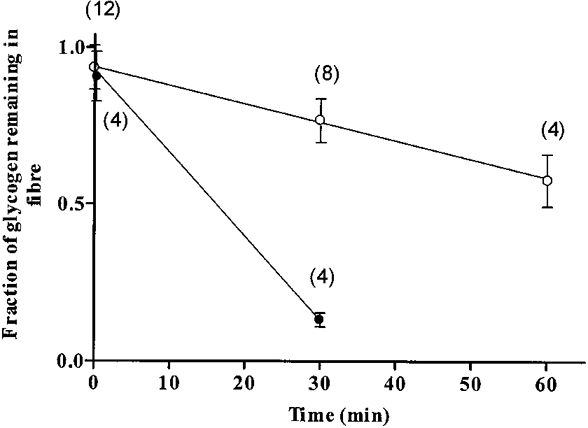
The relaxing solution mimicked a solution mimicking the intracellular ionic environment when the muscle fibre is at rest (repriming solution in Table 1) (^) and the maximally Ca2+-activating solution contained 30 μM Ca2+ (Table 1) (•). The results were obtained with paired segments from the same fibre where both segments (control and test) were initially washed for 2 min in the repriming solution. Results are expressed as a fraction of glycogen concentration in the test segment/glycogen concentration in the control segment after the 2 min wash in the repriming solution. Numbers above data points indicate the number of pairs of fibre segments used. The data point at time zero was obtained from glycogen measurements in 12 pairs of segments which were exposed for 2 min to the repriming solution. The mean value of glycogen in the individual fibres used in this experiment after the 2 min wash in the repriming solution was 81.2 ± 4.3 mmol glucosyl units (l fibre)−1 (n = 32). Slopes of the lines of best fit: ^, 0.0059 ± 0.0020 min−1; •, 0.0266 ± 0.0038 min−1.
In order to determine whether the rate of glycogen loss from the mechanically skinned fibre is [Ca2+] dependent, the preparation was activated in the presence of 30 μM Ca2+ (maximally activating Ca2+ solution, Table 1) and the fraction of glycogen lost was estimated both in the fibre segment and in the washing solution. The results from such an experiment using paired segments from the same fibre are also shown in Fig. 3. The data point for 10 s exposure to the maximally activating Ca2+ solution was not statistically different from the data point for no exposure to the 30 μM Ca2+ solution (90.7 ± 8.0 %, n = 4vs. 93.6 ± 7.0 %, n = 12). However, after 30 min exposure to the 30 μM Ca2+ solution, 86.7 ± 2.2 % (n = 4) of the initial fibre glycogen was lost. The average rate of glycogen loss was 2.66 ± 0.38 % min−1, which is 4.5-fold greater than the rate of glycogen loss in the repriming solution. Moreover, analysis of the 30 min wash solution indicated that only a very small fraction of fibre glycogen was lost as glycogen (3 ± 3 %, n = 4) or glucose (18.6 ± 3.8 %, n = 4) and that the majority of glycogen (about 80 %) was lost in a form that was not detected with the method used. Since the end product of Ca2+-activated phosphorolysis is glucose-1-phosphate, which was not detectable by the fluorogenic analysis used in this study (data not shown), this result strongly indicates that the mechanically skinned fibre segments retain an active phosphorylase kinase/glycogen phosphorylase system. This is not surprising considering that phosphorylase, its modulating enzymes and glycogen particles are part of a tightly integrated system which is regulated by Ca2+ (Entman et al. 1980). Note that even without specific addition of inorganic phosphate to solutions, the ATP and creatine phosphate solutions contained about 0.15 mM inorganic phosphate and in the maximally activated fibre this concentration is expected to increase up to 0.3 mM (see Fryer et al. 1995 for more details).
Considering that fibre glycogen was lost by prolonged exposure to 30 μM Ca2+ solution, it was of great interest to find out whether glycogen could also be lost from the fibre segment by T-system depolarization-induced Ca2+ release from the SR loaded at endogenous levels. In this experiment the skinned fibre preparation was successively activated by depolarization of the sealed T-system (Fig. 1) until the preparation was 90 % run down (the depolarization-induced force response was reduced to 10 % of its maximum level and remained below 10 % of its maximum level after one more depolarization). Under these conditions, the fibre glycogen content in the 90 % run-down fibre segment decreased by 53 ± 9 % (n = 4) compared with that in the paired control. The control segment, from the same fibre, was incubated for 2 min in the repriming solution before being analysed for glycogen. The average time to 90 % run-down was 26 ± 4 min for the four pairs of fibre segments used in this experiment and the fraction of fibre glycogen at the end of the T-system depolarization-induced sequence of force responses (47 ± 9 %, n = 4) was significantly reduced (P = 0.016) compared with that following incubation without depolarization in the repriming solution for 30 min (76.7 ± 7.0, n = 8, Fig. 3). Furthermore, if a correction was made for solution inaccessibility to part of the fibre volume due to the method of fibre attachment to the force recording apparatus (see Methods), one could estimate that the glycogen concentration in the part of the fibre segment which was exposed to solutions would have decreased to less than 25 % of the initial value (24.3 ± 12.9 %, n = 4). Regardless of whether the correction was applied or not, these results clearly demonstrate that glycogen depletion occurred in the mechanically skinned fibre when Ca2+ was released from the SR by the depolarization of the T-system. In order to estimate the rate of glycogen loss from the fibre during T-system depolarization-induced responses one could consider that the mean number of depolarization-induced responses to 90 % run-down was 21.3 ± 4.7 (n = 4) and that the mean duration of a response measured at the base was about 2 s (see Fig. 1). Therefore, one could argue that, on average, the preparations were activated by T-system depolarizations for 42.6 s and this caused a depletion of fibre glycogen by 29.7 % without correction for restricted access of 30 % fibre segment volume to the bathing solution (76.7–47 %) and 52.4 % (76.7–24.3 %) when the correction was applied. With these values, the rate of glycogen loss caused by T-system depolarization-induced responses was estimated to be 41.8 and 73.8 % min−1 without and with restricted volume correction, respectively. In either case, this rate is at least one order of magnitude greater than that measured in the fibre segment exposed to the maximum Ca2+-activated solution.
Correlation between fibre responsiveness to T-system depolarization and glycogen content
As seen in Fig. 1, after a certain number of T-system depolarization-induced responses are elicited in a mechanically skinned fibre preparation, the E-C coupling mechanism becomes impaired as indicated by the decline in the size of the T-system depolarization-induced responses. This loss of fibre response capacity to T-system depolarization cannot be reversed and its onset shows a great deal of variability between fibres (Lamb & Stephenson, 1990).
The major goal of this study was to assess whether there is a correlation between fibre response capacity to T-system depolarization (expressed as equivalent number of maximum Ca2+-activated force responses that can be elicited in a skinned fibre segment by successive T-system depolarization until 50 % run-down; see Methods) and fibre glycogen concentration under conditions where the concentrations of ATP and creatine phosphate in the myoplasm were high and not altered. In order to determine the fibre response capacity to T-system depolarization for individual fibre segments, the sealed T-system network of the mechanically skinned fibre preparation was successively depolarized as shown in Fig. 1 until the depolarization induced response decreased to 50 % of the maximum Na+-depolarization-induced force response and this was then followed by brief activation (less than 10 s) in the maximum Ca2+- activating solution of 30 μM Ca2+. Several preparations were briefly exposed to a low-Mg2+ (0.015 mM) solution immediately after the run-down to check the pool of SR releasable Ca2+.
The glycogen concentration in the fibre segment at the start of the series of successive depolarizations (initial glycogen) was assessed from measurements of glycogen concentration in its paired segment that was incubated in the repriming solution for 2 min. This is the normal incubation period in the repriming solution prior to subjecting a fibre segment to successive depolarization-repolarization cycles. In order to ensure that the fibre population tested had a broad range of glycogen concentrations, iliofibularis muscles were obtained from toads collected throughout the year since we have previously shown that fibre glycogen content varies greatly with the season when the toads were collected (Nguyen et al. 1998b). The results obtained with 22 pairs of fibre segments from seven toads collected in summer (3), winter (2), spring (1) and autumn (1) are displayed in Fig. 4 and a statistical analysis of the data indicates that there is a highly significant linear correlation (P < 0.0001) between fibre response capacity expressed as equivalent number of maximum Ca2+-activated force responses that can be elicited by successive T-system depolarizations until 50 % run-down and initial fibre glycogen concentration. No fibre which had a low initial glycogen content (Fig. 4) displayed a high fibre response capacity to T-system depolarization. This clearly shows that the presence of a significant pool of fibre glycogen is necessary to ensure a high capacity for fibre excitability.
Figure 4. Correlation between fibre capacity to respond to T-system depolarization and initial glycogen concentration in the fibre.
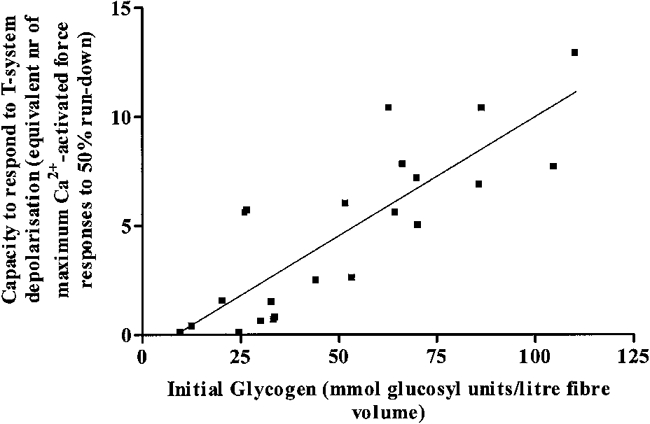
The fibre capacity to respond to the T-system depolarization is expressed in equivalent number of maximally Ca2+-activated force responses that were elicited in that preparation by successive T-system depolarizations until the response declined to 50 % of its highest level (50 % run-down, see text). The glycogen concentration in the fibre at the beginning of the series of depolarizations was estimated from measurements in paired segments from the same fibres. Each data point corresponds to results obtained with paired segments from one fibre. Correlation factor r = 0.83; slope = 0.109 ± 0.016 maximally Ca2+-activated responses per millimole of glucosyl units of initial fibre glycogen per litre fibre (95 % confidence intervals, 0.075 to 0.144; P < 0.0001 that slope is zero). Y-axis intercept, −0.93 ± 0.95.
Note that in order to convert the number of depolarization-induced responses to fibre response capacity, the sum of the amplitude of the depolarization-induced responses was divided by the maximally Ca2+-activated response in that fibre (see Methods). For the fibre whose results are shown in Fig. 1 we did not measure the maximum Ca2+-activated response because we did not wish to expose it to high [Ca2+] before measuring the glycogen content. However, based on the fibre cross-sectional area we could estimate that the maximum Ca2+-activated force would have been about 1.5-fold the size of the largest depolarization-induced response. Based on this estimation, the fibre response capacity would have been 12.2 and this is within the range of the data points shown in Fig. 4. The slope of the line of best fit in Fig. 4 indicates that each millimole of glucosyl units of initial glycogen per litre confers on the fibre the capacity to produce a T-system depolarization-induced response of a magnitude equivalent to 10.9 ± 1.6 % of the maximally Ca2+-activated force response. The intercept of the line of best fit with the X-axis is close to and not significantly different from zero suggesting direct proportionality between initial glycogen content and fibre response capacity to T-system depolarization.
In order to check that in the run-down fibres the SR was functional and loaded with enough Ca2+ to elicit near-maximal contractions, the inhibition exerted by the 1 mM Mg2+ on the SR Ca2+ release channels was removed by exposing six run-down preparations to a low-Mg2+ (0.015 mM) solution (Table 1). In all instances near-maximal Ca2+-activated force responses were obtained demonstrating that the SR was functional and a large pool of releasable Ca2+ was available in the SR at that time. Since neither the contractile apparatus nor the SR function appear to be impaired in run-down fibres (see also Lamb & Stephenson, 1990), it follows that the run-down must be caused by impairment of an earlier event in the E-C coupling process.
We have already shown that T-system depolarization-induced contraction is accompanied by marked glycogen loss. To determine the level of depolarization-induced force response (expressed as a percentage of the maximum Ca2+-activated force) that leads to the depletion of 1 mmol glucosyl units (l fibre)−1, we estimated the glycogen concentration lost (Glyclost) and the equivalent number of maximally Ca2+-activated force responses induced by depolarization in 17 fibre segments after they were activated to 50 % run-down and then briefly (less than 10 s) maximally activated in the 30 μM Ca2+ solution. Glyclost was calculated by subtracting the glycogen concentration in the 50 % run-down fibre segments (corrected for solution inaccessibility to 30 % of the fibre volume due to constraints associated with the fibre attachment to the force recording apparatus; see Methods) from the initial glycogen concentration measured in the paired segments (corrected for the incubation-related loss of glycogen in the HDTA repriming solution; see Fig. 3). No correction was made with respect to the brief exposure to the maximally ca2+-activating solution because, as shown in Fig. 3, exposure for 10 s to the 30 μM Ca2+ solution would have reduced the fibre glycogen concentration by less than 1 %. A value of 8.6 ± 3.5 % of the maximum Ca2+-activated force induced by T-system depolarization per millimole glucosyl units of lost fibre glycogen per litre was obtained from the linear regression analysis of the data. This value was close to and not statistically different from the response capacity to T-system depolarization conferred on the fibre by 1 mmol glucosyl units of initial fibre glycogen per litre (10.9 ± 1.6 % maximally Ca2+-activated force), suggesting a causal relationship between the depolarization-induced fibre glycogen loss and the use-dependent reduction in the capacity of the fibre to respond to T-system depolarization.
Addition of glycogen (100 mmol glucosyl units ml−1) to solutions did not prevent fibre run-down and did not restore to any degree the ability of the run-down fibres to respond to sealed T-system depolarization (data not shown).
Protein profile of fibre segments and wash-out/incubation solutions
Many different types of molecular species are docked to glycogen particles and therefore are expected to be lost from a mechanically skinned fibre preparation when glycogen is broken down. If some of these molecules, such as kinases and phosphatases, are necessary in E-C coupling, then E-C coupling would become impaired when glycogen is broken down. We have attempted to assess the extent of protein loss from the freshly skinned fibre preparation incubated under conditions where the glycogen pool becomes depleted (high [Ca2+]) and where the glycogen pool is only marginally affected (low [Ca2+]).
Figure 5A shows the protein profiles of freshly skinned segments before exposure to an aqueous solution (lane 1), after 2 min wash in the low-Ca2+ solution (repriming solution with 100 μM total EGTA; lane 2), after another 30 min in the low-Ca2+ solution (lane 3), where the glycogen pool remains largely intact (see Fig. 3) and after 30 min exposure to the maximally Ca2+-activating solution (lane 4), when the glycogen pool is greatly diminished (see Fig. 3). The results show that there was essentially no loss of any of the major protein components in the muscle fibre such as myosin heavy chains and actin after any of the above-mentioned treatments. We have also analysed the protein profile in the wash-out/incubation solutions and the results are also shown in Fig. 5B. From the silver-stained SDS-PAGE analysis one can see that there are at least 11 proteins varying in molecular mass between 10 and 80 kDa which are lost after a 2 min wash (lane 5). Further incubation of the skinned fibre segments for 30 min in either the low-Ca2+ or high-Ca2+ solution apparently caused only further wash-out of the same protein species which were lost after 2 min in the low-Ca2+ repriming solution but did not result in the obvious removal of extra protein components (lanes 6 and 7). Similar results to those shown in Fig. 5 were obtained with segments from six fibres. These results demonstrate that the amount of protein that is tightly and specifically bound to the fibre glycogen is below the limit of detection with our rather sensitive technique.
Figure 5. Silver stained electrophoretogram of muscle proteins from segments of single muscle fibres (A) and from the solutions (see Table 1 for composition) to which single fibre segments were exposed for various lengths of time (B).
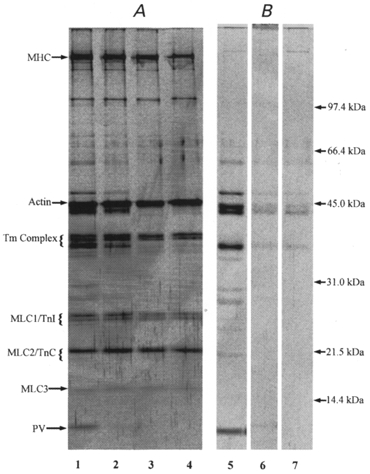
Samples shown are as follows: lane 1, freshly dissected fibre; lane 2, fibre segment after 2 min incubation in the low [Ca2+] repriming solution containing 100 μM total EGTA (washed fibre); lane 3, washed fibre segment after an additional 30 min incubation in the low-Ca2+ repriming solution; lane 4, washed fibre segment after 30 min incubation in the maximally Ca2+-activating solution; lane 5, the low-Ca2+ repriming solution, in which the fibre segment was incubated/washed for 2 min; lane 6, the low-Ca2+ repriming solution in which a washed fibre segment was incubated for 30 min; lane 7, the maximally Ca2+-activating solution in which a washed fibre segment was incubated for 30 min. Sample size for single fibre segments: 4 nl fibre volume; sample size for solutions: the volume of washing/incubating solution in which a 4 nl fibre segment was washed/incubated for the appropriate time. Results in lanes 3, 4, 6 and 7 were obtained with paired segments of one fibre. MHC, myosin heavy chains; Tm, tropomyosin; MLC, myosin light chain; TnI, troponin I; TnC, troponin C; PV, parvalbumin.
DISCUSSION
This study demonstrates that the mechanically skinned fibre preparation is very well suited to investigating the relationship between fibre glycogen and muscle contractility under conditions where the composition of the intracellular environment can be carefully controlled.
The most important result from this investigation refers to the finding that, under conditions where the concentrations of ATP (8 mM) and creatine phosphate (10 mM) were maintained high and constant, the capacity of the skinned muscle fibre to respond to T-system depolarization was strongly positively correlated with the concentration of the glycogen pool in the fibre (Fig. 4). Moreover, successive force responses induced by T-system depolarization were shown to be the major factor responsible for the depletion of the glycogen pool in the skinned fibre preparation. In turn, the depolarization-induced depletion of fibre glycogen markedly diminished the capacity of the skinned fibre preparation to respond to T-system depolarization.
These results represent the strongest indication so far that the presence of non-washable glycogen in skeletal muscle fibres is a prerequisite for normal E-C coupling and that this protective role exerted by glycogen does not relate to its role of energy store in the fibre. Recently Chin & Allen (1997) reported that the mean values for myoplasmic [Ca2+] during tetanic stimulation in a mammalian skeletal muscle fibre was positively correlated with the relative glycogen concentration in the intact fibres and there is a large body of information, particularly for mammalian skeletal muscle, that associates the presence of glycogen above a critical level with the ability of the muscle to contract (Bergström et al. 1967; Galbo et al. 1979; Vøllestad et al. 1988; Fitts, 1994; Chin & Allen, 1997). Some have argued recently that glycogen depletion may lead to local shortages in ATP, which is locally needed for normal coupling processes (Chin & Allen, 1997). In the experiments described here we maintained constant, large concentrations of ATP (8 mM) and creatine phosphate (10 mM) in the myoplasmic environment which should have prevented any local shortage of ATP. The high activity of creatine phosphokinase associated with the SR membranes (see for example Rossi et al. 1990) would have further prevented any significant local depletion of ATP and accumulation of ADP in the vicinity of the SR. Previous observations with mechanically skinned fibre segments indicated that it was necessary to decrease the [ATP] in the bathing solution to 2 mM or less in order to reduce the amount of Ca2+ release from the SR by T-system-induced depolarization (Owen et al. 1997). Therefore, the experiments reported here provide strong evidence against any variant of an energy limitation hypothesis for the protective role played by glycogen in muscle contractility. Our conclusion is in agreement with Vøllestad et al. 1988 who argued against the energy limitation hypothesis on the basis that there was a significant amount of ATP that remained available in myoplasm even under extreme fatigue conditions. However, under those conditions one could argue that locally, the free energy from the hydrolysis of ATP could have been significantly reduced due to accumulation of inorganic phosphate and ADP.
The results from this study demonstrate that in mechanically skinned fibres, the glycogen pool is very stable under rigor conditions and relatively stable in relaxing solutions. The pool of glycogen in mechanically skinned fibres is likely to be represented by glycogen particles tightly attached to the SR membranes (Entman et al. 1980) since any glycogen which was not tightly attached to intracellular structures should be able to diffuse out from the preparation in the relaxing solution. The enhanced stability of the glycogen pool in the rigor preparation can be explained by further trapping of glycogen particles between rigid myofibrils in rigor. The slow loss of glycogen in the relaxing solution appears to be in the form of glycogen rather than as a result of glycogenolysis suggesting that some glycogen particles are able to diffuse slowly from the relaxed muscle. Importantly, the rate of loss of glycogen was markedly increased by a factor of 4.5 when the ionized [Ca2+] in the preparation was increased from 0.2 to 30 μM and under these conditions glycogen was broken down rather than simply diffused out of the preparation. The observations indicate that Ca2+-dependent glycogenolysis by phosphorolysis occurs in the mechanically skinned fibre preparation, as would be expected if the SR glycogenolytic complex (Entman et al. 1980) remained functional in this preparation. It is particularly important to note that the rate of glycogen loss from the skinned fibre preparation appeared greater by at least one order of magnitude following T-system depolarization-induced force responses. This can be due either to a more efficient activation of the SR glycogenolytic complex by physiological Ca2+ release from the SR (Danforth & Helmreich 1964; Entman et al. 1980) than by exogenous Ca2+ or to a considerably longer period of activation of the SR glycogenolytic complex than the duration of the force response (which was used to calculate this rate) or both. Nevertheless, we estimate that about 9–12 mmol glucosyl units (l fibre)−1 (the reciprocal values of 10.9 % and 8.6 % of maximally Ca2+-activated force per millimole glucosyl units per litre fibre; see Results) are lost with each equivalent maximally Ca2+-activated response induced by depolarization. This is equivalent to 14–18 mmol phosphate (l fibre water)−1 (assuming that 1 l fibre contains about 0.65 l water; see Baylor et al. 1983) being used in glycogen phosphorolysis for each equivalent maximally Ca2+-activated response. Undoubtedly, this represents a sizeable sink for inorganic phosphate in the contracting muscle. Since accumulation of inorganic phosphate is an important fatiguing factor (see reviews by Fitts, 1994 and Stephenson et al. 1998), prevention of phosphate accumulation in the fibre by glycogen phosphorolysis could provide a simple physiological mechanism by which the presence and degradation of glycogen opposes fatigue. However, this mechanism is not able to explain the tight correlation between glycogen concentration and capacity of the fibre to respond to T-system depolarization under our conditions, where the phosphate generated by the SR and myofibrillar ATPases was allowed to diffuse freely into the bathing solutions.
We could not determine whether the protective mechanism exerted by the presence of endogenous glycogen is due to glycogen per se or to the many different types of molecular species that are either docked to the glycogen particles or are functionally coupled via endogenous glycogen particles associated with the SR membranes (Entman et al. 1980). The failure of exogenous glycogen to revert or prevent loss of fibre capacity to respond to T-system depolarization cannot be taken as strong evidence against a specific role of endogenous glycogen particles per se in E-C coupling simply because it is highly unlikely that exogenous and endogenous glycogen will occupy the same location in the fibre and will have the same three-dimensional structure. Furthermore, the inability to detect loss of specific molecular species associated with the loss of glycogen from the fibre (Fig. 5), despite the use of highly sensitive analyses, cannot be taken as strong evidence against the possibility that molecular species associated with glycogen particles may be implicated in the E-C coupling process (see review by Stephenson et al. 1995). Species such as kinases and phosphatases would be expected to lose their local distribution and/or become functionally uncoupled when the glycogen particles diminish below a critical size.
Results from this study may provide an explanation for the run-down phenomenon described earlier in this preparation (Lamb & Stephenson, 1990) because in this study, the run-down was correlated with glycogen depletion in the fibre. Thus, fibre run-down occurs not only after successive T-system depolarization-induced responses, but also after prolonged exposure (45–60 min) to repriming solution (Lamb & Stephenson, 1990) and in this study we show that in both situations, the loss of fibre excitability is paralleled by loss of glycogen content. In this context, skinned fibre run-down under the conditions used in this study can be viewed as a type of muscle fibre fatigue associated with glycogen depletion.
It is important to point out that whilst glycogen may be an important factor implicated in the run-down phenomenon observed in mechanically skinned fibres under the conditions used here and in other studies (Lamb & Stephenson, 1990), there are also other factors which can cause different types of run-down. For example a rise in [Ca2+] for several seconds above 10 μM causes complete uncoupling in toad skeletal muscle fibres (Lamb et al. 1995), but according to Fig. 3, this type of uncoupling is unlikely to be associated with glycogen depletion. Also interference with the FK506 binding protein can cause loss of fibre excitability (Lamb & Stephenson, 1996).
Concluding remarks
Results presented in this study conclusively show that (i) the largest pool of muscle fibre glycogen is not freely diffusible from the freshly mechanically skinned preparation when exposed to an aqueous environment, (ii) this glycogen pool becomes depleted in mechanically skinned fibre preparations when T-system depolarization-induced contractions are elicited, (iii) fibre excitability is related either directly or indirectly to the presence of endogenous glycogen, and (iv) this process is not related to the role of glycogen as an energy store.
Acknowledgments
This work was supported by the National Health and Medical Research Council of Australia.
References
- Baylor SM, Chandler WK, Marshall MW. Sarcoplasmic reticulum calcium release in frog skeletal muscle fibres estimated from arsenazo III calcium transients. The Journal of Physiology. 1983;344:625–666. doi: 10.1113/jphysiol.1983.sp014959. [DOI] [PMC free article] [PubMed] [Google Scholar]
- Bergström J, Hermansen L, Hultman E, Saltin B. Diet, muscle glycogen and physical performance. Acta Physiologica Scandinavica. 1967;71:140–150. doi: 10.1111/j.1748-1716.1967.tb03720.x. [DOI] [PubMed] [Google Scholar]
- Bortolotto S, Stephenson DG, Stephenson GMM. Fiber type populations and Ca2+-activation properties of single fibers in soleus muscles from SHR and WKY rats. American Journal of Physiology. 1999;276:C628–637. doi: 10.1152/ajpcell.1999.276.3.C628. [DOI] [PubMed] [Google Scholar]
- Chin ER, Allen DG. Effects of reduced muscle glycogen concentration on force, Ca2+ release and contractile protein function in intact mouse skeletal muscle. The Journal of Physiology. 1997;498:17–29. doi: 10.1113/jphysiol.1997.sp021838. [DOI] [PMC free article] [PubMed] [Google Scholar]
- Danforth WH, Helmreich E. Regulation of glycolysis in muscle I. The conversion of phosphorylase b to phosphorylase a in frog sartorius muscle. Journal of Biological Chemistry. 1964;239:3133–3138. [PubMed] [Google Scholar]
- Entman ML, Keslensky SS, Chu A, van Winkle WB. The sarcoplasmic reticulum-glycogenolytic complex in mammalian fast-twitch skeletal muscle. Proposed in vitro counterpart of the contraction-activated glycogenolytic pool. Journal of Biological Chemistry. 1980;255:6245–6252. [PubMed] [Google Scholar]
- Fitts RH. Cellular mechanisms of muscle fatigue. Physiological Reviews. 1994;74:49–94. doi: 10.1152/physrev.1994.74.1.49. [DOI] [PubMed] [Google Scholar]
- Fryer MW, Owen VJ, Lamb GD, Stephenson DG. Effects of creatine phosphate and Pi on Ca2+ movements and tension development in rat skinned skeletal muscle fibres. The Journal of Physiology. 1995;482:123–140. doi: 10.1113/jphysiol.1995.sp020504. [DOI] [PMC free article] [PubMed] [Google Scholar]
- Galbo H, Holst JJ, Christensen HJ. The effect of different diets and of insulin on the hormonal response to prolonged exercise. Acta Physiologica Scandinavica. 1979;107:19–32. doi: 10.1111/j.1748-1716.1979.tb06438.x. [DOI] [PubMed] [Google Scholar]
- Hintz CS, Chi MM-Y, Fell RD, Ivy JL, Kaiser KK, Lowry CV, Lowry OH. Metabolite changes in individual rat muscle fibres during stimulation. American Journal of Physiology. 1982;242:C218–228. doi: 10.1152/ajpcell.1982.242.3.C218. [DOI] [PubMed] [Google Scholar]
- Lamb GD, Junankar PR, Stephenson DG. Raised intracellular [Ca2+] abolishes excitation-contraction coupling in skeletal muscle fibres of rat and toad. The Journal of Physiology. 1995;489:349–362. doi: 10.1113/jphysiol.1995.sp021056. [DOI] [PMC free article] [PubMed] [Google Scholar]
- Lamb GD, Stephenson DG. Calcium release in skinned muscle fibres of the toad by transverse tubule depolarization or by direct stimulation. The Journal of Physiology. 1990;423:495–517. doi: 10.1113/jphysiol.1990.sp018036. [DOI] [PMC free article] [PubMed] [Google Scholar]
- Lamb GD, Stephenson DG. Effects of FK506 and rapamycin on excitation-contraction coupling in skeletal muscle fibres of the rat. The Journal of Physiology. 1996;494:569–576. doi: 10.1113/jphysiol.1996.sp021514. [DOI] [PMC free article] [PubMed] [Google Scholar]
- Moisescu DG. Kinetics of reaction in calcium-activated skinned muscle fibres. Nature New Biology. 1976;262:610–613. doi: 10.1038/262610a0. [DOI] [PubMed] [Google Scholar]
- Moisescu DG, Thieleczek R. Calcium and strontium concentration changes within skinned muscle preparations following a change in the external bathing solution. The Journal of Physiology. 1978;275:241–262. doi: 10.1113/jphysiol.1978.sp012188. [DOI] [PMC free article] [PubMed] [Google Scholar]
- Nguyen LT, Stephenson DG, Stephenson GMM. Correlation between the ability to respond to T-system depolarization and the glycogen content of mechanically skinned fibres of the cane toad. The Journal of Physiology. 1997;505.P:89. P. [Google Scholar]
- Nguyen LT, Stephenson DG, Stephenson GMM. A direct microfluorimetric method for measuring subpicomol amounts of NADPH, glucose and glycogen. Analytical Biochemistry. 1998a;259:274–278. doi: 10.1006/abio.1998.2634. [DOI] [PubMed] [Google Scholar]
- Nguyen LT, Stephenson DG, Stephenson GMM. Microfluorimetric analyses of glycogen in freshly dissected, single skeletal muscle fibres of the cane toad using a mechanically skinned fibre preparation. Journal of Muscle Research and Cell Motility. 1998b;19:631–638. doi: 10.1023/a:1005377030193. [DOI] [PubMed] [Google Scholar]
- Owen VJ, Lamb GD, Stephenson DG, Fryer MW. Relationship between depolarization-induced force responses and Ca2+ content in skeletal muscle fibres of rat and toad. The Journal of Physiology. 1997;498:571–586. doi: 10.1113/jphysiol.1997.sp021884. [DOI] [PMC free article] [PubMed] [Google Scholar]
- Rossi AM, Eppenberger HM, Vople P, Cotrufo R, Wallimann T. Muscle type MM creatine kinase is specifically bound to sarcoplasmic reticulum and can support Ca2+-uptake and regulate ATP/ADP ratios. Journal of Biological Chemistry. 1990;265:5258–5266. [PubMed] [Google Scholar]
- Stephenson DG, Lamb GD, Stephenson GMM, Fryer MW. Mechanisms of excitation-contraction coupling relevant to skeletal muscle fatigue. Advances in Experimental and Medical Biology. 1995;384:45–56. doi: 10.1007/978-1-4899-1016-5_4. [DOI] [PubMed] [Google Scholar]
- Stephenson DG, Lamb GD, Stephenson GMM. Events of the excitation-contraction-relaxation (E-C-R) cycle in fast- and slow-twitch mammalian muscle fibres relevant to muscle fatigue. Acta Physiologica Scandinavica. 1998;162:229–245. doi: 10.1046/j.1365-201X.1998.0304f.x. [DOI] [PubMed] [Google Scholar]
- Vøllestad NK, Sejersted OM, Bahr R, Woods JJ, Bigland-Ritchie B. Motor drive and metabolic responses during repeated submaximal contractions in humans. Journal of Applied Physiology. 1988;64:1421–1427. doi: 10.1152/jappl.1988.64.4.1421. [DOI] [PubMed] [Google Scholar]