

Abstract
The responses of neurones in forelimb motor cortex to impulse volleys evoked by single pulse electrical stimulation (at 1.5 or 2 times the threshold for most excitable nerve fibres) of the superficial radial (SR) and ulnar (UL) nerves of the contralateral forelimb were studied in awake cats both resting quietly and walking on a horizontal ladder. Nerve volley amplitude was monitored by recording the compound action potential elicited by the stimulus.
In the resting animal 34/82 (41 %) cells yielded statistically significant responses to SR stimulation, and 20/72 (28 %) responded to UL stimulation. Some responses were confined to or began with an increase in firing probability (‘excitatory’ responses) and others with a decrease in firing (‘inhibitory’ responses), typically including a brief interruption of the spike train (zero rate). Cells responding to both nerves usually yielded responses similar in type. Most (78 %) response onset latencies were less than 30 ms. Responses involved the addition or subtraction of from 3.4 to 0.1 impulses stimulus−1 (most < 1 impulse stimulus−1). The distribution of response sizes was continuous down to the smallest values, i.e. there was no ‘gap’ which would represent a clear separation into ‘responsive’ and ‘unresponsive’ categories. Responses were commonest in the lateral part of the pericruciate cortex, and commoner among pyramidal tract neurones (PTNs) than non-PTNs.
During ladder walking most cells generated a rhythmic step-related discharge; in assessing the size of responses to nerve stimulation (20 studied, from 13 cells) this activity was first subtracted. Response onset latencies (90 % < 30 ms) and durations showed little or no change. Although most cells were overall more active than during rest both ‘excitatory’ and ‘inhibitory’ responses in both PTNs and non-PTNs were often markedly reduced in large parts of the step cycle; over some (usually brief) parts responses approached or exceeded their size during rest, i.e. response size was step phase dependent. Such variations occurred without parallel change in the nerve compound action potential, nor were they correlated with the level of background firing at the time that the response was evoked. When responses to both nerves were studied in the same neurone they differed in their patterns of phase dependence.
The findings are interpreted as evidence for central mechanisms that, during ‘skilled’, cortically controlled walking, powerfully regulate the excitability of the somatic afferent paths from forelimb mechanoreceptors (including low threshold cutaneous receptors) to motor cortex. Retention (or enhancement) of responsiveness often occurred (especially for ulnar nerve) around footfall, perhaps reflecting a behavioural requirement for sensory input signalling the quality of the contact established with the restricted surface available for support.
To understand the role(s) in movement control of any pathway that forwards information from receptors in the limbs to some part of the central nervous system, information must be obtained regarding the extent to which, during active movement, its ability to transmit is subject to regulation (modulation; sometimes termed gating) by central mechanisms. Moreover, the possibility must be explored that such mechanisms may vary their influence with the type of movement or with its phases (for a detailed review, see Prochazka, 1989).
Thus, to consider only the context of locomotor movements, the responsiveness of spinal reflex paths to inputs from both muscle and skin receptors is now known to differ between the presence and absence of stepping movements and to vary during the step cycle (see for example Forssberg, 1979; Akazawa et al. 1982; Rossignol & Drew, 1985). The factors responsible include mechanisms acting at pre-motoneuronal levels. In addition, step phase-related excitability changes have been shown to occur (at pre-cerebellar levels) in two spino-olivocerebellar pathways (Apps et al. 1990; Lidierth & Apps, 1990; Apps et al. 1995; Apps & Hartell, 1995).
Somatic afferent pathways to the cerebral cortex appear also to be subject to central regulation during active movement. Lemon (1979) reported the existence of movement-related gating of transmission to motor cortex in monkeys trained to pull on a spring-loaded lever. During the active movement, responses of motor cortical cells (including pyramidal tract neurones, PTNs) to peripheral inputs were either attenuated or abolished. Jiang et al. (1991) reported modulation of cutaneous responsiveness of neurones in the primary somatosensory cortex during conditioned arm movement (see also Gardner et al. 1984, who made a similar observation using a conditioning-test protocol involving paired tactile stimuli). As regards the specific context of locomotion, Chapin & Woodward (1982; see also Shin et al. 1994) found in neurones of the primary somatosensory cortex of the rat that firing increases evoked by electrical stimulation of the contralateral forepaw were step phase dependent in size (and reduced overall) relative to responses during rest. Passive changes in limb position did not lead to comparable changes in response, suggesting that the response modulation was not due to variation in the peripheral afferent volley and that central mechanisms must therefore be involved. In the cat, Palmer et al. (1985) recorded from 16 motor cortical neurones clustered around the lateral end of the cruciate sulcus and found that short latency responses to electrical stimuli applied to the palmar part of the forepaw were commonly largest during the flexion phase of the step and smallest at stance onset. In some neurones these changes did not parallel the step cycle-related variations in cell excitability as judged from the firing rate in steps without stimuli.
Palmer et al. (1985) studied animals walking on a moving belt and locomotion under other circumstances appears to require different control signals from the motor cortex. During walking on the rungs of a horizontal ladder or over a succession of low barriers individual cortical neurones (including PTNs) discharge at substantially higher rates than during walking on a flat uninterrupted surface (Amos et al. 1990,Beloozerova & Sirota, 1993a, b). Moreover, the timing of peak population output from forelimb motor cortex may differ between treadmill and ladder walking (see Armstrong & Marple-Horvat, 1996). Furthermore, walking over a flat surface devoid of obstacles is only transiently impaired by pyramidotomy or motor cortex lesion while, by contrast, more demanding forms of walking (including ladder walking) are grossly impaired for long periods (Liddell & Phillips, 1944; Chambers & Liu, 1957; Hicks & D'Amato, 1975).
In the light of this background, we earlier studied the responses of motor cortical neurones during ladder walking to peripheral input resulting from a footfall onto a rung that proved unexpectedly unstable (Marple-Horvat et al. 1993). Notwithstanding any sensory modulation that may have been operative, substantial numbers of cells responded briskly, including cells projecting into the pyramidal tract. A limitation of this work, however, was that it was possible to externally perturb the stepping only in one specific step phase, namely the onset of stance.
In the present study we have investigated the excitability throughout the step cycle of somatic afferent paths from the forelimb to motor cortex via an approach similar to that of Chapin & Woodward (1982), Shin et al. (1994) and Palmer et al. (1985). Non-noxious electrical stimuli were used to set up test volleys in two peripheral nerves of the forelimb. The superficial radial nerve was chosen because of its pure cutaneous innervation and receptive field including the paw and the forearm; in the absence of a second pure cutaneous nerve, the palmar branch of the ulnar nerve was selected because its territory also includes both the paw and forearm - these two nerves seem to provide a good opportunity to compare and contrast gating of peripheral inputs that have some features in common and others that are in some sense related. The responses evoked in single pericruciate neurones have been compared for stimuli delivered in the resting, immobile animal and at different times in the step cycle during ladder walking.
The findings reveal that during ladder walking the amplitudes of responses show marked step phase dependency. Its temporal pattern differs both between neurones and between the responses evoked from two different nerves when these provide input to the same cell. Some, at least, of this sensory modulation occurs at pathway levels prior to the cortical neurones studied. Some of the findings have been included in a brief abstract (Armstrong et al. 1995).
METHODS
Animals and surgical procedures
Five purpose-bred adult cats (3.0–5.0 kg) were trained to walk steadily on the rungs of a large circular horizontal ladder comprising 48 rungs spaced evenly at a separation of 20 cm, which constitutes a comfortable half-stride length (for further ladder details see Amos et al. 1987a, b). Food rewards were employed and the animals took readily to the task requiring little encouragement and walked confidently with a tail-up posture. No aversive training techniques were used; the experiments were carried out in accordance with the UK Animals (Scientific Procedures) Act, 1986.
When the animals were task proficient an aseptic operation was carried out with a surgical level of barbiturate anaesthesia (pentobarbitone sodium, Sagatal, BDH; initial i.p. dose of 40 mg kg−1, plus supplementary i.v. doses as required). Prophylactic antibiotic cover was provided (Crystapen, Glaxo; 300 μg, i.m.) and post-operative recovery was rapid and without complications. For the first 24 post-operative hours an opiate analgesic was administered (Temgesic, Reckitt & Colman; 60 μg, i.m.).
During the operation up to 35 platinum-iridium microwires, teflon insulated except at the tip, were implanted into the right motor cortex. Each wire (outer diameter, 25 μm) was inserted through the exposed pia mater to a depth of 1.5–2.0 mm; points of insertion were charted onto a scale diagram of the cortical surface. The dura mater was then repaired with pledgets of gelfoam (Sterispon, Allen & Hanbury) and the craniotomy was sealed with dental acrylic cement.
Via a burr hole over the cerebellum a bipolar stimulating electrode was also stereotaxically implanted into the right medullary pyramid and sealed in position with dental cement (see Armstrong & Drew, 1984a). In the contralateral (i.e. left) forelimb a bipolar electromyographic (EMG) electrode was sutured into the lateral head of triceps brachii muscle to record whole muscle EMG (for details see Armstrong & Drew, 1984a). In the same limb two bipolar cuff electrodes were implanted around the superficial radial (SR) nerve, one in the forearm, the other above the elbow; a cuff was also placed around the palmar branch of the ulnar (UL) nerve near the wrist with another around the main trunk of the nerve in the mid-forearm part of its course. For each nerve the proximal cuff was used to monitor the nerve compound action potential (NCAP) elicited by electrical pulses delivered via the distal cuff (see Apps et al. 1990, 1995).
The leads from the EMG electrode and the nerve cuffs were led subcutaneously to a connector block to which the microwires and the pyramidal electrode were also connected. The block was cemented securely to the skull and the scalp margins were drawn to its edges where they were protected by an overhanging lip. Post-operatively, regular swabbing with 3 % hydrogen peroxide prevented infection of the scalp margins.
Stimulating and recording procedures
During recording sessions single 0.05 ms electrical pulses were delivered to the nerves during periods while the animals sat quietly at rest and during walking on the ladder. Stimulus intensities were defined in terms of the threshold (T) required to elicit a just discernible NCAP and were always in the non-noxious range. In each animal for both nerves the threshold stimulus intensity remained the same over several weeks. The mean threshold current across all five cats was 2.3 mA for UL nerve and 1.5 mA for SR nerve. Intensities up to 4T were employed but a strength of 1.5T was usually used; the strongest stimuli sometimes evoked a small twitch in the forelimb musculature but the animals invariably showed no behavioural reaction detectable by visual inspection.
During walking, stimuli were delivered at a repetition rate of 1 Hz and because the walking was self-paced and step durations therefore varied, the time of stimulation drifted relative to the step cycle allowing subsequent sorting of neuronal and NCAP responses into batches that had been evoked at different times during the step (see below). Stance and swing durations were unaffected by 1.5T stimulation and there was no evidence of any ‘carry over’ of the effect of one stimulus into the neuronal or NCAP responses evoked by the next (i.e. there was no progressive change in the responses related to the time of delivery of the stimulus during the recording session).
Recording sessions were conducted daily beginning on post-operative day 3 or 4 and continued until the microwires ceased to yield any recordings from single motor cortical neurones (see Armstrong & Drew, 1984a). Each microwire was screened in turn for the presence of single unit action potentials and if none was present the animal was returned to the home pen. Most units displayed background activity even when the animal was immobile, but during screening the animal was encouraged to move and peripheral inputs were provided via stroking and patting; it is unlikely therefore that any ‘silent’ neurones were overlooked. If units were detected on one or more microwires, recording was continued until the animal lost interest in the task. Units were typically studied during several rest periods and several bouts of walking each involving 12–15 circuits of the ladder. Bouts in which stimuli were delivered were alternated with control bouts without stimulation.
Subsequently, a somatic afferent receptive field was sought for each recorded neurone by seeking to evoke discharges through manual delivery of mechanical stimuli in the resting animal. Stimuli included brushing of hairs, gentle taps to the skin and manipulation of muscles and joints while the animal lay relaxed and purring. Some neurones responded vigorously and only to the brushing of a small patch of hairs (for example on one or two digits), and in such cases the receptive field boundaries and the field type (cutaneous) were readily defined. However, many fields were more widespread, the responses varied in intensity in different parts of the field and the required stimuli (taps, squeezes, etc.) were such that field boundaries were difficult to establish precisely, as was the field type (cutaneous, deep or mixed). For this reason receptive fields are presented only in terms of their general location, i.e. paw, wrist and/or forearm, elbow and/or upper arm, shoulder and/or neck. Some fields included two or (rarely) more of these areas.
Finally, pulses (0.2 ms duration and intensities up to 2 mA) were delivered to the pyramid to determine whether or not the neurone could be shown to generate an antidromic action potential and therefore to provide an axon to the pyramidal tract. Cells were judged to be pyramidal tract neurones (PTNs) if the threshold for an antidromic action potential was below 1.5 mA, and if each suprathreshold stimulus evoked a fixed latency action potential that could follow twin pulse stimulation at 330 Hz or higher. Evidence was sought of collision between spontaneous and evoked action potentials and was always found. For each PTN the threshold current to evoke an antidromic response was noted and also the latency of the response evoked by a twice threshold stimulus. Latencies were converted to axonal conduction velocities assuming a conduction distance of 44 mm (see Armstrong & Drew, 1984a). Neurones with velocities greater than 21 m s−1 were classed as fast axon PTNs, the remainder as slow axon PTNs (see Takahashi, 1965). Neurones which could not be shown to be PTNs are termed non-PTNs below but it would be unsafe to conclude that these never provided a pyramidal axon; the term implies only that such a projection could not be demonstrated.
All neuronal, EMG and NCAP data were amplified and stored using a digital tape recorder (analog signals sampled at 2.75 kHz, neuronal action potentials at 44 kHz). Neuronal action potentials were bandpass filtered at 500 Hz to 5 kHz and EMG and NCAP signals at 50–400 Hz and 100 Hz to 20 kHz, respectively. Stimulus marker pulses were recorded simultaneously with the other signals; note that during control walking ‘mock’ marker pulses recurring at 1 Hz were recorded (see below).
Data analysis
To characterize any step cycle-related modulation of the discharge frequency of each neurone, a computer program (Marple-Horvat & Gilbey, 1992) was used to identify the onset of each locomotor burst of EMG in triceps brachii muscle. This extensor of the elbow is active once per step cycle with burst onset preceding footfall by ca 40 ms (see Armstrong & Drew, 1984a; Marple-Horvat et al. 1993). The program produced a marker pulse at each burst onset, the accuracy of which was always confirmed visually. The pulses were used to compute the duration of each step cycle which was then divided into 10 equal time epochs (tenths of a step cycle) and neuronal firing rate in each tenth was computed. For each tenth a mean rate was then computed by averaging over many (typically 60–100) paces.
To characterize neuronal responses to nerve stimulation, peri-stimulus time histograms (PSTHs) of the discharges were constructed. PSTHs for data collected during rest periods typically included 60–80 stimulus presentations while for walking 100–150 presentations were used whenever possible. A bin width of 5 ms was routinely used and the height of each bin represented the number of spikes per step during that bin; multiplication by 200 yields the number of impulses per second. PSTHs for rest periods included pre- and post-stimulus periods of 500 ms and a significant response to nerve stimulation was deemed to occur when the rate in two successive post-stimulus bins differed from the mean for a pre-stimulus period of 200 ms by at least twice the standard deviation (s.d.) during that period. When a post-stimulus change was confined to a single bin the significance level was taken as 3 times the s.d. about the pre-stimulus mean. Response sizes were expressed as mean spikes per stimulus after subtraction of the background level of discharge.
Response onset latencies were taken as the interval between the stimulus and the start of the first bin in which the response criterion was satisfied, and durations as the interval between that time and the start of the bin in which the criterion was no longer met. PSTH bin width was sometimes reduced to 2 ms to provide more precise timing information.
For responses during walking, separate PSTHs were constructed for each tenth of the step cycle, in order to quantify any step phase dependence that might exist in regard to response size, latency and duration. Because many neurones discharged rhythmically during the step cycle, variations in the locomotor-related background activity were allowed for by using ‘mock’ marker pulses (see above) to construct a parallel set of ‘PSTHs’ for a bout of walking without nerve stimulation and subtracting the activity evident in each of these from that in the corresponding PSTH so as to produce a ‘difference’ histogram in which the response to nerve stimulation alone was isolated. A significant response to nerve stimulation was deemed to occur when in the difference histogram the rate in two successive post-stimulus bins differed from the mean for a pre-stimulus period of 200 ms by twice the s.d. during that period (3 s.d. for a single bin). In the difference histogram relating to a particular step cycle tenth, response onset and offset were the leading edge of the first significant bin and the trailing edge of the last significant bin, respectively (i.e. corresponding measures to those used at rest). A time frame was defined and applied to all ten difference histograms which spanned the period from the earliest response onset seen in any tenth to the latest response offset seen in any tenth. Response size (per stimulus) in any tenth was the sum of spikes per bin in all bins within this time frame. For any tenth of the step cycle in which significance criteria were not exceeded, the sum of spikes in all bins within this time frame could nevertheless be calculated. Variations in response size between different step tenths could then be displayed as shown in Figs 5–8, with significant responses indicated by filled symbols, and variations below the level of significance by open symbols.
Figure 5. Step phase dependency of response did not occur in parallel with any step cycle-related variation in amplitude of the NCAP.
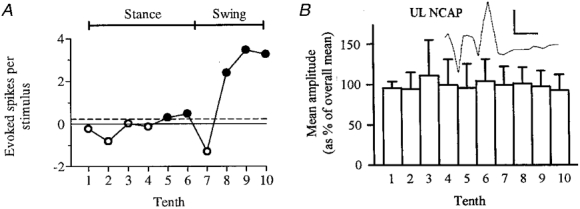
The step phase-dependent changes in response size illustrated in Fig. 4 and summarized in A did not correlate with small variations in NCAP amplitude at different times in the step cycle (B). Response size in each tenth, in evoked spikes per stimulus, was obtained from the appropriate difference histogram as described in Methods. Filled circles in A indicate statistically significant modulations; open circles indicate modulations which did not exceed significance criteria. The horizontal dashed line indicates the response size during rest. B shows the mean amplitude for the UL NCAP recorded simultaneously with the neuronal responses. Error bars show s.d. Inset shows the averaged NCAP (preceded by stimulus artifact, see Fig. 1C). Scale bars are 1 ms and 0.2 mV.
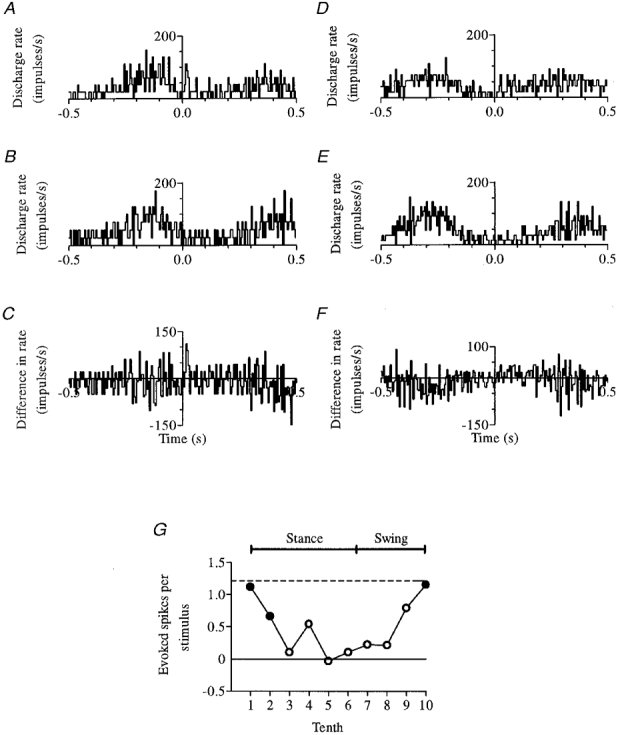
Figure 8. Significant responsiveness to nerve stimulation across a broad portion of the step cycle.
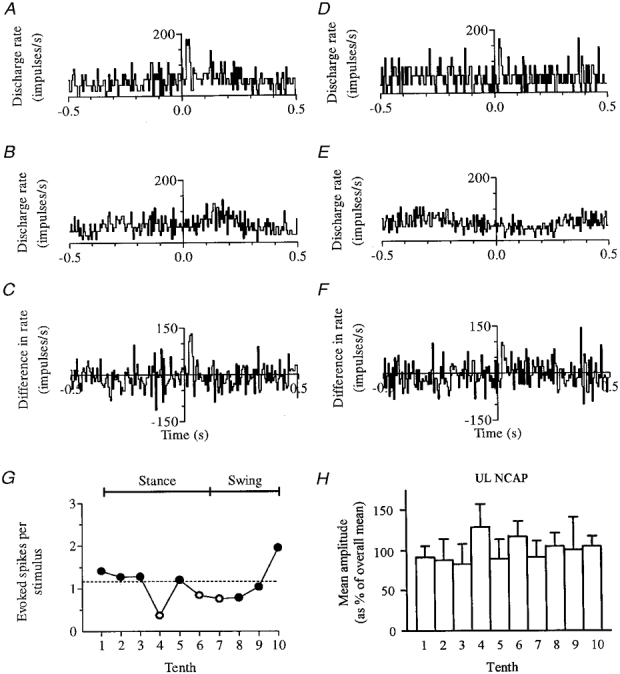
The effect on this fast axon PTN of stimuli delivered at the end of swing (tenth 10) is shown in A-C, and the effect of stimuli delivered in the second half of stance (tenth 5) is shown in D-F; step phase dependence is summarized in G. All conventions as in Fig. 6. Variation in NCAP amplitude at different times in the step cycle is shown in H (conventions as in Fig. 5B). Note that the maximum and minimum responsiveness of the cell (tenths 10 and 4, respectively) are not matched by a parallel increase and decrease in NCAP amplitude.
Nerve compound action potentials
With rare exceptions the compound action potential elicited in the stimulated nerve was recorded concurrently with the motor cortical neuronal responses. Peak-to-peak amplitudes were measured and mean and s.d. were calculated for each batch of stimulus presentations used to compile a PSTH (see Apps et al. 1990, 1995).
Cortical mapping
The cortical scale diagrams were used to measure, for each ‘productive’ microwire, the rostro-caudal and medio-lateral distances of the microwire entry point from the lateral end of the cruciate sulcus. These co-ordinates were used to prepare a cortical diagram which pooled the results from all five animals. Because evidence has been presented (see Pappas & Strick, 1979, 1981) that significant inter-animal variations may occur in the spatial organization of the cat motor cortex some ‘blurring’ of results may have resulted from the pooling. However, it was reassuring that conclusions reached by pooling (see Results) were supported by the maps for the two individual animals that yielded the largest numbers of neurones (n = 28 and 29). Nevertheless, although most microwires were inserted orthogonal to the cortical surface, the entry-point maps (whether individual or pooled) obviously provide only an approximate indication of electrode tip location.
Histological controls
When, after a few weeks, single neurone recordings were no longer obtainable (see Armstrong & Drew, 1984a; Palmer et al. 1985)the animals were killed painlessly via i.p. administration of an anaesthetic overdose. Locations of nerve cuffs and EMG electrodes were verified by dissection and the brainstem and the frontal pole of the right cerebral hemisphere were removed and fixed in neutral buffered formalin prior to frozen sectioning at 50 μm, followed by Nissl staining. The location of the pyramidal electrode tip was confirmed as lying within, or at the dorsal border of, the right medullary pyramid, and the pericruciate cortex was inspected for signs of damage incidental to microwire implantation. Apart from occasional localized thinning of the molecular layer no such damage was visible. Thin lines of gliosis marked the positions of some electrodes but others left no trace that we could detect with light microscopy.
RESULTS
General characteristics of the recorded neurones
In five animals, 151 microwires were implanted (see Methods), of which 43 provided extracellular recordings of the action potentials of 83 reliably discriminable single neurones in the cortex surrounding the lateral part of the cruciate sulcus. From 24 (56 %) of the ‘productive’ microwires more than one neurone was recorded either simultaneously or sequentially and one wire in each of two animals yielded six neurones. Contact with individual neurones was maintained for periods ranging from 2 h to several days; the characteristics (amplitude, polarity, duration) of their action potentials were entirely similar to those described by Armstrong & Drew (1984a) and by Marple-Horvat et al. (1993) who used the same recording technique.
Each neurone was characterized (see Methods) in terms of the nature and size of any response during both rest and walking to single pulse stimulation of one or both of the superficial radial (SR) and ulnar (palmar branch; UL) nerves in the contralateral forelimb; and in terms of the nature of the somatic afferent receptive field, step cycle-related pattern of discharge during ladder walking, presence or absence of a pyramidal projection and microwire location.
Sixty-one neurones had receptive fields confined to, or including, some part of the contralateral forelimb. Three-quarters of these had unipartite receptive fields; a quarter were bipartite (i.e. involved two non-contiguous parts of the limb). Among the other 22/83 neurones there were 15 receptive fields confined to the neck (11 of which were from the most rostral recording sites), and small minorities related to the ipsilateral shoulder, the face, or undefined areas. All main parts of the forelimb were well represented: the forefoot, the wrist/forearm, the elbow/upper arm and the shoulder were included in the receptive field in 31, 18, 20 and 30 %, respectively, of the total of 83 neurones.
In 32 of the 83 neurones (39 %) an antidromic response to stimulation of the medullary pyramid could be demonstrated. The overall range of axonal conduction velocities was from 10 to 55 m s−1 and there were 18 fast axon and 14 slow axon PTNs (see Methods). Figure 1A shows an example of one fast PTN responding antidromically to each of two stimuli 2.4 ms apart.
Figure 1. Discharges of motor cortex neurones recorded extracellularly via chronically implanted microwire electrodes.
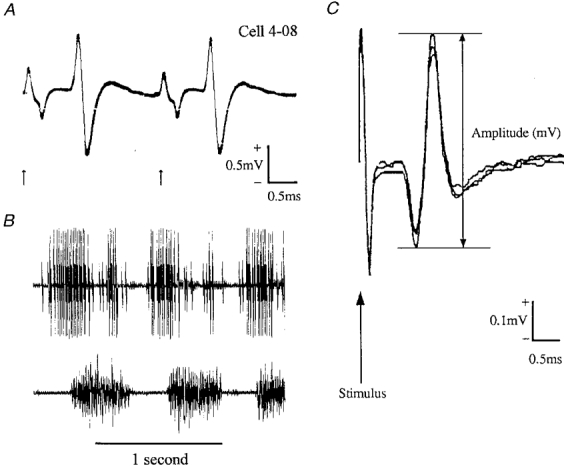
A, example of a neurone (a fast axon PTN) generating antidromic action potentials in response to each of two 0.2 ms stimuli applied to the pyramidal tract (arrows); interstimulus interval, 2.4 ms; 10 trials superimposed. B, the PTN discharged rhythmically during ladder walking. Locomotor EMG signals from the lateral head of triceps brachii muscle (an elbow extensor with one period of activity per step during stance) in the contralateral forelimb were recorded simultaneously. The neurone discharged two high frequency bursts of impulses per step cycle (a second, smaller and discriminable cell discharged when the larger unit was silent). C, three consecutive NCAPs superimposed to illustrate variation in peak-to-peak amplitude.
During walking all but six neurones showed step cycle-related modulations of their discharge frequency; some fired one or two discrete bursts of high frequency impulses per step whilst others fired tonically but at different rates in different parts of the cycle; times of peak activity varied widely between neurones (see Armstrong & Drew, 1984b). Step-related firing of the cell shown in Fig. 1A and the locomotor-related bursts of EMG recorded simultaneously from triceps brachii muscle in the contralateral forelimb are shown in Fig. 1B.
Responsiveness to peripheral nerve stimulation in the resting animal
The responses of individual neurones to stimulation of the SR and UL nerves were compared between the two behavioural states of quiet rest and steady walking on the ladder to determine the nature and extent of any central modulation of sensory responsiveness that might be present during ladder walking. It is therefore necessary to describe first the responses encountered in the resting animal.
Frequency of responsiveness
All neurones were tested for responsiveness to single pulse stimulation of one or both nerves at an intensity of 1.5 times threshold for the most excitable fibres in the nerve (1.5T). Among the 82 neurones tested with SR stimulation a total of 34 (41 %) responded at this stimulus intensity with a statistically significant modulation according to the criteria in Methods, while for the UL nerve significant responses were found in 20 out of 72 (28 %) cells tested. We confined our investigation to cells that responded at 1.5T.
‘Excitatory’ responses
Among the total of 54 responses identified there were 30 (56 %) which were confined to, or began with, an increase in discharge probability. In most cases (20 cells, 67 %) the response was a monophasic facilitation but in others the initial increase was followed by a second response component which was usually a decrease in discharge probability but occasionally a second period of facilitation. Because these second components were restricted to a minority of cells attention is confined below largely to the initial component. For descriptive convenience, responses involving an initial facilitation are referred to as excitatory but this is not meant to imply that they necessarily all resulted from excitatory synaptic actions exerted on the membrane of the cells under study: some may have been disinhibitory in nature.
Examples of excitatory responses are provided in Fig. 2 (see also Fig. 3) in the form of peri-stimulus time histograms (PSTHs) that average the responses to substantial numbers of stimulus presentations. Figure 2A and D are examples in which responses (respectively to UL and SR stimulation) were confined in two different neurones to a brief monophasic increase in discharge probability, while Fig. 2B and E show, for another neurone, responses (respectively to UL and SR stimulation) in which the initial facilitation was succeeded by a period of reduction in discharge probability. Note that Fig. 2B and D show responses from the same cell to UL and SR stimulation, respectively.
Figure 2. Responses of motor cortex neurones to single pulse stimulation of the SR nerve and the palmar branch of the UL nerve in the contralateral forelimb during quiet rest.
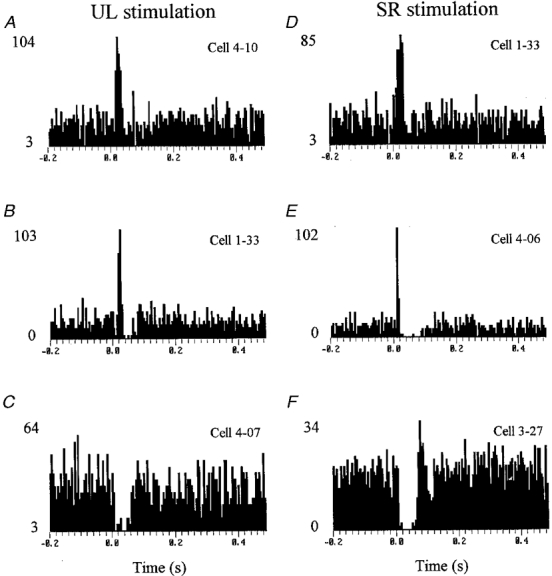
Stimulus delivered at time zero in each histogram. Stimulus intensity in each case was 1.5 times threshold for the most excitable fibres in the nerve. A and D show excitatory responses to UL and SR stimulation, respectively (from 2 different neurones). B and E show responses to stimulation of each nerve in which the initial facilitation was followed by a reduction in discharge rate. C and F show responses that began with a decrease in firing rate (followed in F by an increase). Note that B and D show responses from the same cell to stimulation of each nerve. Numbers to the left of each histogram indicate discharge rate (impulses s−1) at baseline and peak (divide by 200 to obtain number of spikes bin−1 stimulus−1). Bin width in all cases, 5 ms.
Figure 3. Response amplitudes in the resting animal.
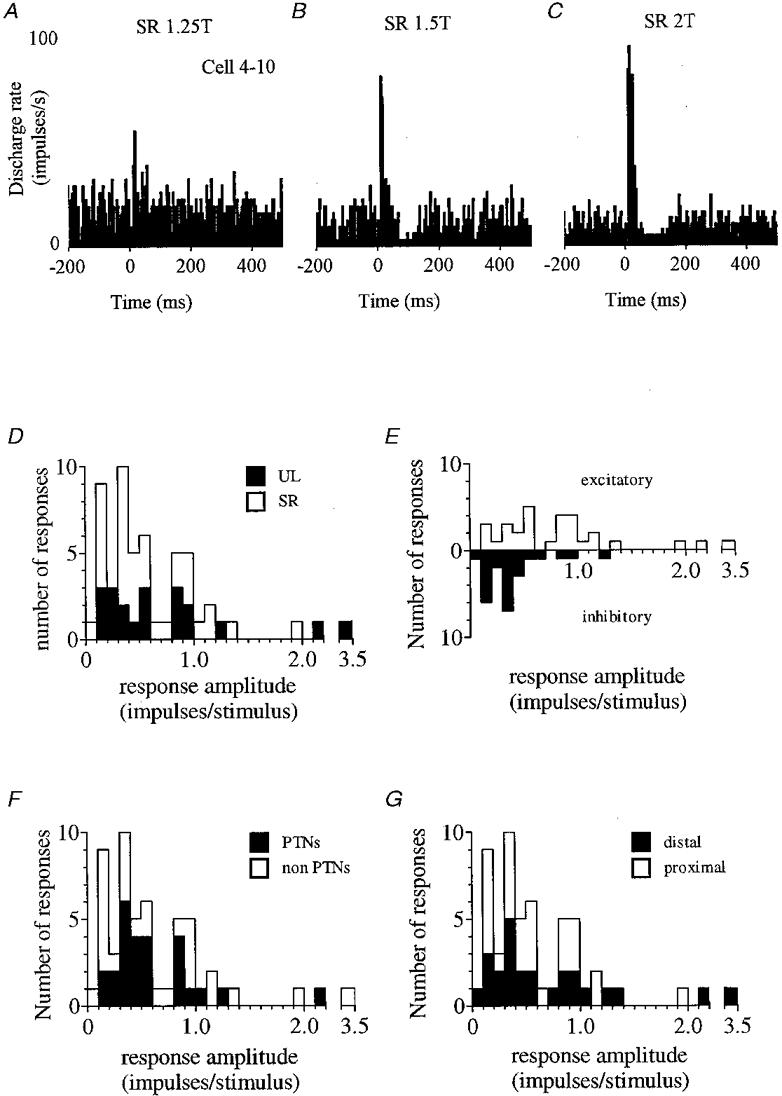
A-C show the initial excitatory response of a neurone undergoing a graded increase in size as stimulus intensity increased. Note in B and C the appearance of a subsequent decrease in firing. D-G illustrate amplitude distributions for all responses (n = 54) divided according to whether responses were to UL or SR stimulation (D), excitatory or inhibitory (E), obtained from PTNs or non-PTNs (F), and from cells which had a distal or proximal receptive field (G).
‘Inhibitory’ responses
Twenty-four of the 54 responses (44 %) differed from those above in that they were confined to, or began with, a reduction in discharge probability. Again for descriptive convenience all such responses are referred to as inhibitory but we have no evidence to exclude the possibility that some were dis-facilitatory in nature. Most responses (18 cells, 75 %) were confined to a monophasic reduction in activity but in the remaining minority the response was biphasic, the period of ‘inhibition’ being succeeded by a period of increased discharge probability. Because such second components were again relatively uncommon the focus below is on the initial response component. An example of a monophasic inhibitory response is provided in Fig. 2C while Fig. 2F shows a biphasic response.
The frequency of occurrence of excitatory and inhibitory responses was similar for the two nerves. Thus, of the 30 excitatory responses 18 were evoked from the SR and 12 from the UL nerve, while for the 24 inhibitory responses 16 and eight were from SR and UL nerve, respectively. No evidence was found to indicate that excitatory and inhibitory responses were segregated within different areas of the motor cortex.
Graded nature of the responses
When possible, stimulus intensities other than 1.5T were also employed and all the response types above were found to be graded in amplitude with stimulus intensity. An example is shown by the histograms of Fig. 3A-C. This cell was a fast axon PTN with a receptive field confined to the digits of the contralateral forelimb (dorsiflexion of all digits caused discharge rate to increase). In Fig. 3A a 1.25T SR stimulus evoked a small increase in discharge probability which was progressively augmented in Fig. 3B and C by intensities of 1.5 and 2T, respectively. In this case the stronger stimuli also evoked, after the initial facilitation, an obvious reduction in firing probability that was not evident at 1.25T. However, in other instances the overall form of the response remained unchanged across the range of intensities used. Changes in stimulus intensity never altered the direction of the initial change in discharge probability.
Response amplitudes
Figure 3D illustrates the amplitude distribution for the 54 statistically significant responses identified in the resting animal. Responses involved the addition or subtraction of between 3.4 and8 0.1 impulses stimulus−1 but most (46/54, 85 %) were less than 1 impulse stimulus−1.
The distribution of response sizes suggests that the motor cortex neurones of the present study should not necessarily (or even probably) be regarded as in reality divisible into separate ‘responsive’ and ‘unresponsive’ categories. Rather, there was a continuum from strong responses to progressively smaller ones and at a discharge loss or gain of around 0.1 impulses stimulus−1 relative to background, stimulus-induced changes failed to meet the response criteria defined in Methods.
Responses to UL and SR stimulation are separately identified in the distribution, from which it is clear that responses to each nerve covered a broadly similar range. Mean values (± 1 s.d.) were 0.76 ± 0.78 impulses stimulus−1 for UL and 0.57 ± 0.42 impulses stimulus−1 for SR (not significantly different at the 5 % level, unpaired t test).
In Fig. 3E excitatory and inhibitory responses have been plotted above and below the x-axis, respectively. Inhibitory responses were significantly smaller (unpaired t test, P < 0.01); less than half the size of excitatory responses on average (0.85 ± 0.67 impulses stimulus−1 for excitatory, and 0.38 ± 0.29 impulses stimulus−1 for inhibitory responses).
Twenty-six of the responses were obtained from 17 PTNs (the overall range of thresholds for an antidromic response was 75 μA to 1.4 mA; mean, 440 μA). Comparison of response size for PTNs versus non-PTNs (Fig. 3F), and for cells possessing a distal receptive field versus those that were proximal (Fig. 3G) failed to identify any significant differences.
Response latencies
For both nerves the onset latencies of both excitatory and inhibitory responses varied between neurones. For both types of response and both nerves the earliest responses occurred in the 5–10 ms bin of the PSTH and the majority of responses (42/54, 78 %) had latencies less than 30 ms. PSTHs with 2 ms bin width showed that the earliest responses of both types had onset latencies between 6 and 8 ms. Latencies showed no or very little change with stimulus intensity.
Convergence patterns
Seventy-one cells were tested for responsiveness to both nerves and among the 28 responding to at least one, 17 (61 %) responded to both, eight (29 %) only to the SR nerve and three (10 %) only to the UL nerve. There was therefore heavy but incomplete overlap between the cell populations influenced by stimulation of the two nerves, the proportion of responsive cells selective for the UL nerve (3/20) being half that for the SR nerve (8/25). Throughout the area of cortex explored, responsive cells were mingled with unresponsive cells and no evidence was found for differential distribution across the cortical surface of the SR- versus the UL-responsive populations.
Among the 17 neurones tested that responded to both nerves the commonest finding was that the responses were similar in type (see Fig. 2B and D). In eight cases both nerves evoked an excitatory response and in five both evoked an inhibitory response. Cases of differential responsiveness were confined to two neurones excited by the SR nerve and inhibited by the UL nerve and two with the converse pattern.
In summary, each nerve influenced cells which were widely distributed across the forelimb motor cortex with heavy, but incomplete, overlap between the two populations. Likewise there was incomplete (though substantial) overlap between the cells excited and those inhibited by the two nerves so that some cells excited by one nerve were inhibited or uninfluenced by the other while others inhibited by one nerve were excited or uninfluenced by the other.
Responsiveness to peripheral nerve stimulation during ladder walking
From visual inspection it was evident at the time of recording that during ladder walking most responses to both nerves were considerably reduced relative to rest size. In addition, preliminary analyses of the first few neurones indicated that at least some responses varied in amplitude depending on stimulus timing relative to the step cycle, i.e. were step phase dependent in size. These two factors implied that in order fully to study the responses during walking, i.e. to define the pattern of any phase dependence, it was necessary to record throughout a considerable number of steps. Moreover, most responses were superimposed on a background of step-related variations in discharge rate and it was, therefore, also necessary to record this activity in the absence of stimulation in order to construct difference histograms (see Methods). Because the animals sometimes lost interest in the task before sufficient data could be recorded it was not possible to study all cells and responses adequately. Successful study required as a minimum delivery of 100 stimuli and the same number of control steps (stimulus marker pulse only).
Note that defining ‘adequate’ testing during locomotion is not theoretically straightforward because (as in the resting animal) whether or not a response is recognized as present depends on its size relative to the variance of the background discharge on which it is superimposed. When, during walking, difference histograms are constructed the variances of the two PSTHs interact additively and, given the constraints on trial numbers imposed by the need for behavioural compliance by the animal, a ‘real’ activity change, if small, may fail to reach the criteria set for recognition of a response. In these circumstances it is clear when a significant response has occurred (criterion reached or exceeded) but complete absence of a response cannot safely be inferred when the criteria are not met. This carries the important implication that a study of the present kind cannot show that a response has been truly abolished, only that it has been substantially reduced.
Preliminary analysis confirmed that because of the above factors it was likely that step phase dependency could be satisfactorily studied only for those responses that were relatively large at rest. We therefore rank ordered such responses according to the number of spikes per stimulus added to or subtracted from the background and restricted analysis of step phase dependency to recordings in which (a) the response at rest involved the addition or loss of at least 0.3 impulses stimulus−1 (excluded 13 responses studied at rest, retained 41) and (b) at least 100 stimuli had been delivered during walking (excluded a further 21 responses, leaving a total of 20 responses for further study).
In addition, 10 neurones tested during rest against stimulation of one or both nerves and found unresponsive were also studied during locomotion. In those cases (all tested with UL and 8 with SR stimulation) no response was ever detected.
Responses during locomotion showed no significant change in onset latency from responses obtained in the same cells during rest. However, when all responses obtained during stepping were pooled, regardless of when in the step cycle stimuli were delivered, the resultant overall average response was usually reduced in both amplitude and duration. Such reduction was not accompanied by any parallel change in the form or amplitude of the compound action potentials recorded from the peripheral nerves.
NCAP data are not presented routinely (though see Figs 1, 5 and 8) because the findings were entirely similar to those in several previous studies in our laboratory (see Apps et al. 1990, 1995). NCAPs evoked during walking were sometimes unchanged in mean amplitude relative to rest, and sometimes modestly increased or decreased. In the resting animal gentle palpation of the limb in the region of the stimulating cuff produced no change in NCAP size but similar manipulation near the recording cuff sometimes increased or decreased the NCAP. It is likely therefore that when the NCAP did differ between walking and rest this was mainly due to mechanical instability at the recording site and the change in volley size was apparent rather than real.
Averaging all trials irrespective of stimulus timing relative to the step cycle is, however, an analytical approach of limited utility because, by separate analysis of responses obtained in different tenths of the step cycle, it was possible in many cases to demonstrate the existence of substantial variations in response size during the step cycle.
Step phase dependency of responsiveness to nerve stimulation
Step phase dependency was studied for 20 responses, nine to SR and 11 to UL nerve stimulation. One SR response and one UL response had an onset latency greater than 30 ms (40 ms in each case). The two responses were contributed by the same neurone. The remaining 18 responses (90 %), contributed by 12 cells, i.e. the great majority in each case, had onset latencies of less than 30 ms; mean values were 12 and 16 ms for SR and UL responses, respectively.
During rest, 14 of the 20 responses were excitatory (7 SR, 7 UL) and six inhibitory (2 SR, 4 UL); collectively they exhibited a surprising variety of patterns of step phase dependence. As mentioned in the previous section (and underlying the usual overall reduced responsiveness during ladder walking), in some phases of the step cycle responses were invariably reduced relative to rest size, though the degree of reduction usually varied markedly during the cycle as in the examples provided by Figs 5–8; at some times modulation of discharge failed to achieve significance (open symbols in figures).
Such observations nevertheless need to be balanced by the finding that although the response was always depressed for some cycle tenths, in half of the cells it was augmented in other tenths (often just one tenth), i.e. there was some point in the step cycle where the response exceeded that obtained when at rest. Substantial excitatory or inhibitory responses were usually present only once per cycle and fairly briefly, i.e. for one cycle tenth or for two contiguous tenths, though there were clear exceptions (see below). The timing of greatest responsiveness varied more from neurone to neurone for responses to SR stimulation; among the UL cases, responsiveness was, with two exceptions, greatest in the eighth, ninth or (most commonly) the final step tenth, the latter being a time immediately preceding onset of triceps activity during which the forelimb is being extended forwards and downwards to establish footfall.
Figure 4 illustrates step phase dependency in responsiveness to stimulation of the UL nerve. This cell was a fast axon PTN with a peripheral receptive field on the contralateral forepaw. Its activity was not significantly or only weakly affected by nerve stimulation throughout stance (step tenths 1–6) and in early swing (step tenth 7), but was increasingly affected by stimulation progressively later in swing (step tenth 8) and most affected in late swing (step tenths 9 and 10) just prior to onset of triceps activity (which occurs at the end of step tenth 10). At this time the excitatory response of the cell, an additional 3.4 impulses stimulus−1, was more than 10 times that obtained during rest (0.25 impulses stimulus−1). The augmented response in this phase of the step cycle represents both increased frequency modulation (150 impulses s−1) and increased response duration (45 ms) as compared with responses at rest (52 impulses s−1 and 5 ms).
Figure 4. Step phase dependency in responsiveness to nerve stimulation during locomotion.
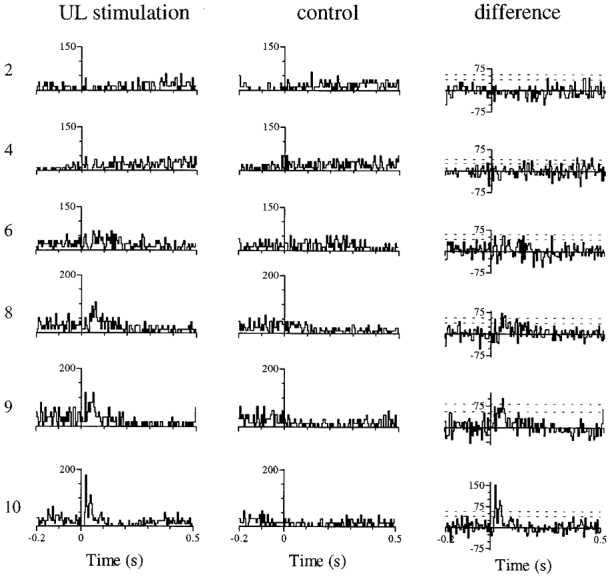
Responses of a fast axon PTN (with a peripheral receptive field on the contralateral forepaw) to UL stimulation in different tenths (2, 4, 6, 8, 9 and 10) of the step cycle are shown on the left. Note that onset of triceps activity occurs at the end of tenth 10, so that the stance phase of the step cycle begins at the start of tenth 1. Delivery of ‘mock’ stimuli (monitor pulse only) generates an equivalent control histogram (centre) for each of the responses, in which the same step-related rhythmicity of the cell is evident. Subtraction of a control histogram from its corresponding response histogram produces a difference histogram (right) in which the response to nerve stimulation is isolated. Horizontal dashed lines in difference histograms are at 2 and 3 s.d. above mean rate during the 200 ms pre-stimulus period (for further details, see Methods). Time axis at the bottom of each column applies to all histograms above (stimuli delivered at time zero in response histograms). Vertical axis is discharge rate (left and centre) and difference in rate (right) in impulses per second.
The response of this cell to SR stimulation during locomotion (not shown) was, in comparison with the UL response, very weak, amounting to only 0.25 impulses stimulus−1 at best, in the first half of swing (tenths 7 and 8); this represents a reduction in sensitivity throughout the step cycle when compared with rest (0.6 additional impulses evoked on average). Both the change in responsiveness accompanying the transition from rest to walking, and the phase of the step cycle in which responsiveness was greatest were therefore different for the two nerves tested. Neither pattern of step phase dependency in response size occurred in parallel with any step cycle-related modulation in NCAP amplitude. Those (modest) variations are shown together with a summary of the phase dependency of the response to UL stimulation in Fig. 5, and no correlation is apparent.
Figure 6 illustrates an example of an inhibitory response to SR stimulation (obtained from a non-PTN with a cutaneous receptive field on the contralateral forepaw). The biggest effect was obtained following stimulation early in the swing phase (step tenth 7), just before the cell reached its peak firing rate in mid-swing (tenth 8) and is visible in Fig. 6A as a ‘notch’ cut into the rising phase of the cell's discharge 10 ms after the stimulus was delivered (at time zero). Subtraction of step-related rhythmicity (Fig. 6B) isolates the response in Fig. 6C. Onset latency was 10 ms and duration was 25 ms, and the discharge rate of the cell was reduced by 95 impulses s−1 below its usual value at this point in the step cycle. The inhibition represents on average removal of 2.2 impulses stimulus−1 from the neuronal spike train - more than double the single impulse per stimulus lost at rest. This is because at rest the ongoing discharge rate was much lower, only 18 impulses s−1, so that although the spike train was interrupted for 55 ms (twice as long) the depth of the inhibition was much less (only 18 impulses s−1 - about a fifth of that seen when walking).
Figure 6. An inhibitory response to SR stimulation.
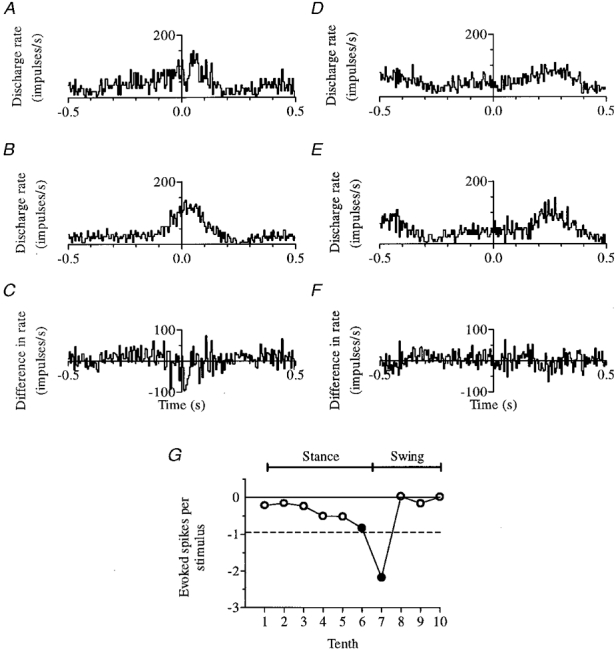
The effect of stimuli delivered early in the swing phase (tenth 7) is shown in A-C, and lack of significant modulation when stimuli were delivered in mid-stance (tenth 4) is shown for comparison in D-F. In each case, response histograms are shown at the top (A and D), control histograms in the centre (B and E) and difference histograms at the bottom (C and F, which are A - B and D - E, respectively). G summarizes for this non-PTN the step phase dependency of SR inhibition (conventions as in Fig. 5A).
Figure 6D-F illustrates for comparison the lack of significant modulation following stimulation in mid-stance (step tenth 4), and Fig. 6G summarizes the step phase dependency of SR inhibition.
An excitatory response (of a non-PTN with a shoulder/neck receptive field) to SR stimulation is illustrated in Fig. 7. The size of the response never exceeded that obtained at rest, but was equally large just after the onset of stance (Fig. 7A-C) as just before (and persisted into the second step tenth), which was never the case for UL responses. Figure 7D-F shows lack of responsiveness in mid-stance (tenth 3) for comparison, and step phase dependence is summarized in Fig. 7G.
Figure 7. An excitatory response to SR stimulation.
Responsiveness (of this non-PTN) just after the onset of stance (tenth 1) is shown in A-C together with lack of responsiveness in mid-stance (tenth 3) in D-F; step phase dependence is summarized in G. All conventions as in Fig. 6.
Figure 8 shows that whereas significant responsiveness was usually confined to a small part of the step cycle (1–3 step tenths), a quite different pattern sometimes emerged, as with this fast axon PTN (receptive field all digits - dorsiflexion preferred stimulus). Responsiveness was greatest (typically, for UL nerve) at the end of swing (2 impulses stimulus−1 - almost twice the response at rest), but remained quite high (and significant) through the greater part of stance (4 out of 6 tenths). (The response of this cell to UL stimulation during rest is shown in Fig. 2A.) Note that greatest and least responsiveness of the cell are not matched by any parallel increase or decrease in NCAP.
All of the above patterns of step phase dependency in response size and sign occurred in the absence of parallel step cycle-related modulations in NCAP amplitude, indicating they were generated by mechanisms acting centrally rather than peripherally. Whatever the nature of these mechanisms, it is clear that they operate on the pathway from limb to motor cortex at a level or levels before the membrane of the recorded neurone. Thus, in cells responsive during walking to input from both nerves the pattern of response size modulation was never identical for the two responses. In addition, the temporal pattern of the response size variations did not correlate with the background excitability of the neurone as indicated by the pattern of its discharge frequency modulation related to the step cycle.
Thus, for example, inspection of Fig. 4 and comparison of Fig. 7A-C with D-F shows for both nerves that the response to nerve stimulation could be very different in size between step tenths in which the step-related firing rate was virtually identical. Figure 9 further confirms that response size showed no obvious co-variation with the ‘background’ firing rate on which the response was superimposed. Figure 9A-F shows plots of response size in each step tenth against the concurrent step-related firing rate, as determined from batches of steps taken in the absence of nerve stimulation. Only in one case, a response to SR stimulation (the only example among 9 studied), is there a significant but weak correlation (r2 = 0.46, P < 0.05); one of the 11 responses to UL stimulation (not shown) yielded a similar significant correlation.
Figure 9. Size of neuronal response to nerve stimulation during each step tenth plotted against step-related discharge rate of the neurone in the same tenth.
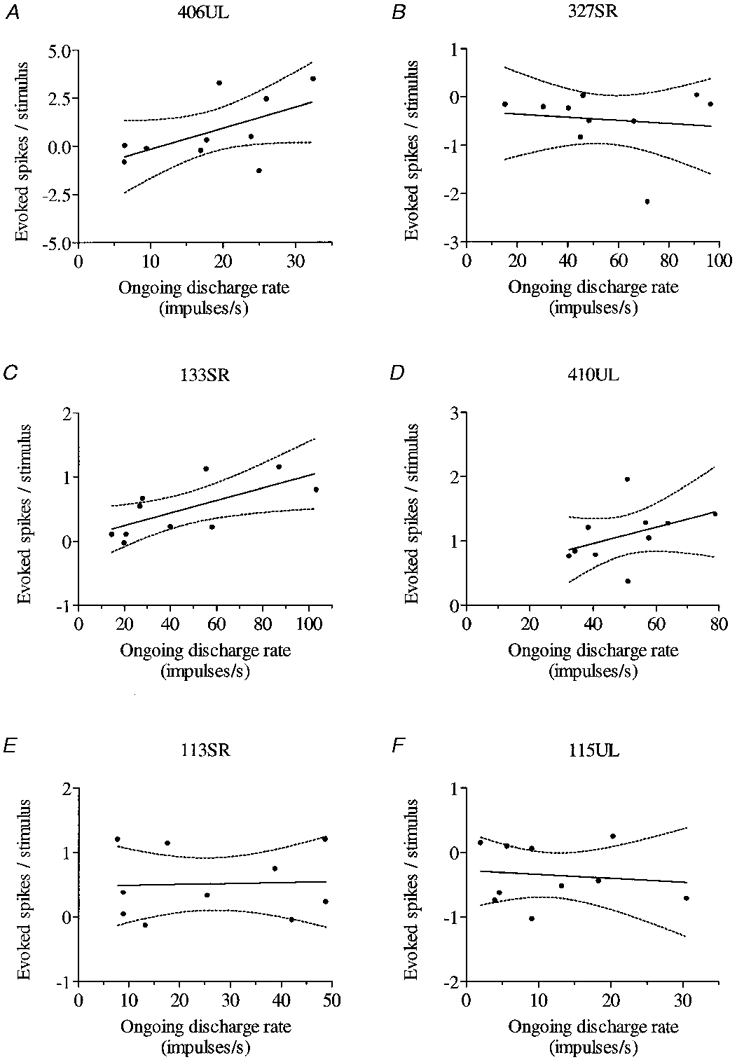
A-F relate to six responses all from different neurones. Response size shows no obvious covariation with the ‘background’ firing rate on which the response was superimposed; only response C yields a significant (but weak) correlation.
Finally, variations in response size were not confined to cells with strong step-related rhythmicity: they occurred (and were as substantial) in cells showing only weak frequency modulation during the step cycle.
Responsiveness to nerve stimulation compared with other functional characteristics of the neurones
Because each neurone was characterized in regard to its somatic afferent receptive field, its pattern of step-related discharge and whether or not it was a PTN, the relationships could be investigated between these neuronal properties and responsiveness to nerve stimulation.
Somatic afferent receptive field
Responsiveness to stimulation of one or both nerves during rest was present in half the cells (15/30) in which the somatic afferent receptive field included the distal part of the forelimb (i.e. included forearm and/or wrist and/or paw) and was not found for the minority of cells (n = 5) which had receptive fields confined to the face or for which no receptive field could be found. These findings are not surprising, but less expected was the finding that among the 41 cells in which the receptive field did not extend distal to the elbow no fewer than a third responded to stimulation of SR and/or UL nerve.
Electrically evoked afferent volleys are of course likely to be more synchronous than peripheral inputs evoked by mechanical stimulation of receptors and for that reason may generate such a mismatch. Alternatively, the technique of ‘listening’ for changes in firing rate evoked by mechanical stimulation may have allowed some weak responses evoked by mechanical stimuli distal to the elbow to be overlooked.
Locomotor-related activity
The frequency distributions of Fig. 10 show, for cells that fired rhythmically during walking, the proportions reaching their peak frequency at different times in the step cycle. Figure 10A and B relate, respectively, to neurones that were responsive and unresponsive to nerve stimulation during rest, and comparison shows that the former group includes a substantially higher proportion of cells that peaked in the first tenth of the cycle (i.e. around the time of footfall; 24 % as compared with 8 %) and a substantially lower proportion that peaked in the period of late stance/early swing (tenths 5, 6, 7 and 8; 19 % as compared with 52 %).
Figure 10. Frequency distributions showing the proportion of neurones with peak step-related firing in each tenth of the step cycle, and step tenths in which neuronal activity was affected by nerve stimulation.
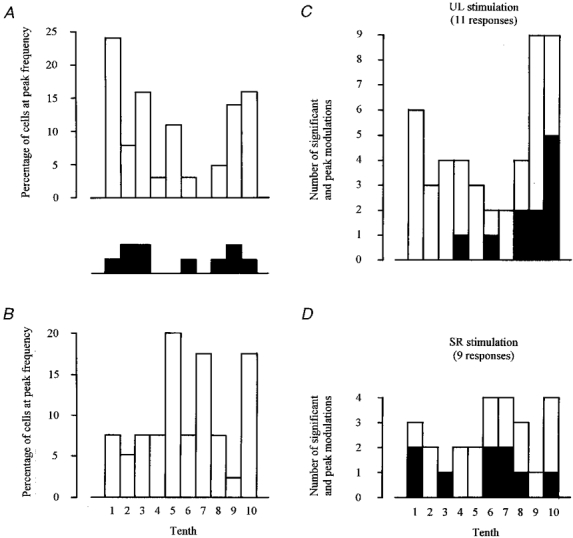
A includes all 37 neurones responding in the resting animal to stimulation of one or both nerves. B includes 40 of the 46 neurones unresponsive to nerve stimulation in the resting animal (the 6 other neurones did not discharge rhythmically during ladder walking). Step phase dependency was studied in 13 cells, 10 of which fired rhythmically during walking. The step tenth in which each of these reached peak discharge rate is indicated (filled squares) in the inset between A and B. C and D show, for UL and SR stimulation, respectively, step tenths in which neuronal activity was significantly (open bars) and most (filled bars) affected.
Thirteen cells yielded the 20 responses for which we were able to study step phase dependency. Ten of these cells fired rhythmically during walking, and the step tenth in which each reached peak discharge rate is indicated by the filled squares (one for each cell) in the inset between Fig. 10A and B. This shows that we were able to demonstrate step phase dependence in cells whose discharge rate peaked in most of the step cycle tenths represented in Fig. 10A. Step phase dependency, and the gating mechanism(s) it implies, therefore showed no obvious tendency to act selectively on cells peaking at particular times. Figure 10C and D show separately for the 11 responses to UL stimulation and the nine responses to SR stimulation the distribution of step tenths in which neuronal activity was significantly and most affected.
Presence of a pyramidal projection
In the resting animal the proportion of PTNs responsive to a volley in at least one peripheral nerve was 17/32 (53 %) whilst for non-PTNs the proportion was 20/51 (39 %). While PTNs made up 17/37 (46 %) of the neurones responsive to nerve stimulation during rest they comprised 9/13 (69 %) of those exhibiting step phase dependency during walking (for these 9 PTNs, the overall range of thresholds for an antidromic response was 75–980 μA; mean, 330 μA).
Among PTNs, 10 of the 17 responsive during rest and six of the nine responsive during walking were of the fast axon type, the remainder being slow axon PTNs. Responsiveness to nerve stimulation and step phase dependency were both therefore encountered within both classes of PTN.
Among the 20 responses during walking there was obviously (see Figs 4–8) a wide variety of patterns of step-related modulation in response size. Attempts were made to determine whether particular categories of neurone tended to exhibit common patterns but no such correlations could be established. Thus, PTNs and non-PTNs exhibited a similar variety of patterns, as did neurones with receptive fields involving any one of the four limb ‘segments’. Application of the converse approach of determining whether neurones with similar patterns of response modulation had other characteristics in common was limited by the variety of patterns encountered, but when the five neurones were compared which had excitatory responses to UL stimulation that were largest in step tenth 10 (from a total of 7 cells in which excitatory responses to UL stimuli could be studied for phase dependency) they were found to include four PTNs and just one non-PTN. The five cells had widely different receptive fields and exhibited very different patterns of step-related firing.
Neuronal characteristics considered in relation to cortical location
Figure 11 shows pooled onto a single cortical map (see Methods) the locations of neurones from all five animals. In Fig. 11A the open circles represent the neurones unresponsive during rest to stimulation of either nerve while the filled circles represent the neurones responsive to at least one nerve. The upper and lower horizontal dashed lines are, respectively, 2 mm caudal and rostral to the lateral end of the cruciate sulcus.
Figure 11. Distributions of neurones relative to the surface of the pericruciate cortex.
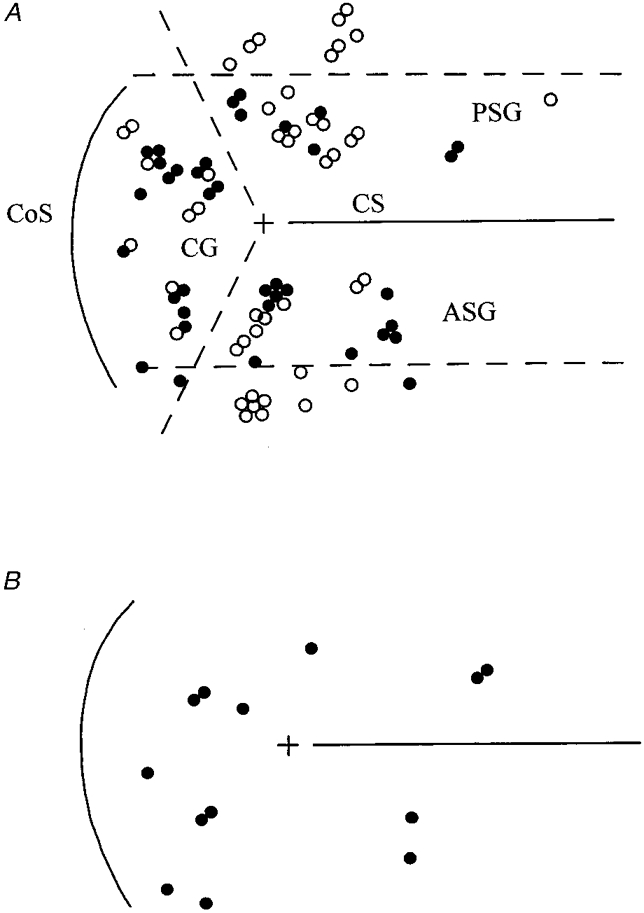
A shows locations of 46 neurones unresponsive to nerve stimulation in the resting animal (^) and 37 neurones responsive to one or both peripheral nerves (•). Upper and lower horizontal dashed lines are, respectively, 2 mm caudal and rostral to the landmark (+) provided by the lateral end of the cruciate sulcus (CS). Diagonal dashed lines approximate to the junctions between the anterior sigmoid, posterior sigmoid and coronal gyri (ASG, PSG, CG). CoS, coronal sulcus. Results from all five animals are pooled (see Methods and text). B shows the distribution of the 13 neurones for which step phase dependency could be studied (•).
Of the eight neurones caudal to the upper line none were responsive and of the 12 rostral to the lower line only three were responsive. The rostral and caudal areas therefore together contained only 3/37 (8 %) of the responsive cells but 17/46 (37 %) of the unresponsive cells. By contrast, in the remaining area closer to the cruciate sulcus no fewer than 34/63 neurones (54 %) were responsive.
Figure 11A also shows, via the two diagonal dashed lines, an alternative mode of subdividing the cortical area studied. These lines approximate to the junctions between the posterior sigmoid (PSG), anterior sigmoid (ASG) and coronal (CG) gyri (nomenclature of Livingston & Phillips, 1957). Within these three subregions the proportion of responsive cells was 8/28 (29 %) for PSG, 12/29 (41 %) for ASG and 17/26 (65 %) for CG. Thus, in summary, responsiveness to nerve stimulation during rest was most frequent within 2 mm of the cruciate sulcus and especially within the coronal gyrus.
As noted previously, the change from rest to walking was accompanied by a reduction to 13 in the number of cells we were able to study that were responsive to at least one nerve and for which sufficient trials were obtained to investigate step phase dependency. Their spatial distribution is shown in Fig. 11B; 8/13 (62 %) were within the coronal gyrus.
Pairs of neurones recorded simultaneously via the same microwire (of which there were 8) must have been closely juxtaposed within the cortex and it was therefore of interest to compare the properties of the cells making up each of these pairs. There were five in which at least one cell responded to at least one of the nerves and three in which neither cell responded to either nerve. Space precludes a detailed presentation but the overall picture was that within each pair the two neurones usually differed in regard to most, sometimes all, of their other functional characteristics.
When a microwire yielded recordings from different neurones sequentially rather than simultaneously, the proximity of the neurones was of course less certain but their characteristics were nevertheless compared. The results simply confirmed our impression of the wide variety of neuronal properties encountered within small volumes of the cortex. Thus, for those electrodes (n = 6) that recorded three or more neurones these ‘groups’ usually included a mixture of PTNs and non-PTNs and cells both similar and very different in respect of receptive field and pattern of step-related discharge. During rest some cells were unresponsive to both nerves, others responsive to one or both nerves, and among the responsive cells some yielded excitatory and others inhibitory responses. Finally, during walking the patterns of step-related modulation of response size were usually very different.
DISCUSSION
Nature of the motor cortical responses to nerve stimulation and pathways involved
The peripheral nerve volleys used as ‘probes’ to test the excitability of the somatic afferent pathways from the distal part of the forelimb to motor cortex were usually generated using stimulus intensities of 1.5T or less. SR volleys were therefore presumably confined almost entirely to Aβ fibres connected to cutaneous mechanoreceptors, while UL volleys presumably involved similar afferents together with IA and IB muscle afferents and perhaps some group II afferents. As in previous studies from this laboratory (see Apps et al. 1990, 1995) the amplitudes of the NCAPs used to monitor nerve volley size did not differ systematically (or substantially) between rest and walking, nor did they usually vary during the step cycle. When variation was present it did not in any instance parallel in its temporal pattern the variation present in the responses of the cortical neurone simultaneously under study.
The excitatory responses generated in motor cortex neurones by nerve stimulation were similar in latency and size to those encountered in awake cats by Palmer et al. (1985) who employed stimuli delivered to palmar skin. However, Palmer et al. (1985) did not report responses of the kind we have termed inhibitory and we have located no other systematic description of such responses in anaesthetized or awake cats, perhaps because previous studies have not sought them. Their existence is not in fact surprising because it has been reported (Brooks et al. 1961a, b) that discharges evoked by mechanical stimulation in one part of the limb can in some motor cortex cells be reduced or suppressed by concurrent stimulation elsewhere in the limb. Such findings were interpreted as evidence for the existence of some form of surround inhibition in the pathways concerned, and the simplest interpretation of our inhibitory responses is that they reflect the existence of such a mechanism and arose because the stimulated nerve innervated areas of the limb that were wholly or predominantly within inhibitory parts of the receptive fields of the neurones concerned. In accord with this hypothesis an excitatory field could indeed be found for all neurones yielding such responses and these fields were often (though by no means always) more proximal on the limb (i.e. at the elbow and/or above).
Such an interpretation in fact offers at least a partial explanation for the lack of inhibitory responses in the study by Palmer et al. (1985): these authors confined their study to cells with cutaneous receptive fields involving the distal part of the limb and the chances would in consequence be high that the electrical stimuli were delivered within the excitatory receptive fields.
When using mechanical stimuli to define receptive fields we focused, like previous workers, on evoking increases in discharge, i.e. on defining excitatory fields. However, on occasion some stimuli were observed to produce obvious reductions in background firing; in retrospect such effects merited systematic investigation and in future studies it will be worthwhile systematically to define inhibitory as well as excitatory components of receptive fields (see also later).
The earliest responses we observed (both excitatory and inhibitory) had onset latencies of 6–8 ms and most, 42/54 (78 %) of those tested at rest and 18/20 (90 %) of those tested during walking, had latencies less than 30 ms. Following exclusion of the single cell that gave the two longer latency responses during ladder walking, mean onset latencies of 12 and 16 ms were obtained for the remaining SR and UL responses, respectively. The great majority of the responses could not therefore have resulted from any reafference resulting from reflex or other movements elicited by the stimuli and despite close scrutiny movements were not observed except occasionally when stronger stimuli (3–4T) were employed. The possibility cannot, however, be excluded that the minority of longer latency responses (just two from one cell during walking) might have resulted from reafference secondary to twitches too small to detect of intrinsic muscles of the paw.
The pathways generating the responses cannot be precisely specified but the earliest must have been initiated (perhaps wholly generated) via a rather direct path. A route involving primary afferent collaterals to the cuneate nucleus, synaptic relay in that nucleus and subsequent input to motor cortex as a result of excitation of thalamocortical neurones via lemniscal fibres is the most probable. However, for all but the earliest responses (latencies ≤ ca 10 ms) contributions cannot be excluded from less direct pathways which might include the spino-cervical system and/or a path involving a cortico-cortical relay to motor cortex from primary somatosensory cortex and/or a path involving a cerebellar relay, most probably involving transmission through nucleus interpositus (see for example Eccles et al. 1974).
Although we detected no latency difference between the earliest excitatory and inhibitory responses the smallest PSTH bin width was 2 ms so no difficulty necessarily attends the supposition that an additional synaptic relay (i.e. one involving an inhibitory interneurone interpolated at some level in the afferent pathway) was involved in the production of the inhibitory responses.
Reduced responsiveness to peripheral nerve stimulation during ladder walking
When responses obtained during stepping were pooled, regardless of when in the step cycle stimuli were delivered, the resultant overall response was usually reduced in both amplitude and duration as compared with the response obtained with the cat sitting quietly. This overall reduction occurred in the absence of any parallel difference in the amplitude of the peripheral nerve volleys used to evoke the responses and despite the fact that most (though not all) of the neurones discharged more rapidly during walking (and were therefore presumably more excitable). This overall reduction might be taken to suggest the existence of some central mechanism which during ladder walking on the whole reduces the excitability of the path(s) from forelimb nerves to the motor cortex. But, importantly, the overall reduction evident in such pooled responses demonstrably arose, in those cells whose step-related responsiveness could be investigated, from inclusion of trials from parts of the step cycle in which nerve stimulation failed to evoke any significant modulation of neuronal activity. It therefore reflects step phase modulation of the response rather than a ‘blanket’ effect at all times (see below).
One other study has reported locomotor-related response suppressions (i.e. abolition). Palmer et al. (1985) found among 16 motor cortical neurones which responded during rest to stimulation of the inner surface of the palmar skin that three neurones (19 %) ceased to respond at all during treadmill walking. As in the present experiments, peripheral nerve compound action potentials were monitored to establish that the changes were of central origin. However, the response criteria differ between the two studies because Palmer et al. (1985) estimated their responses by visual inspection of PSTHs whilst we used measures (see Methods) that were statistical (though necessarily arbitrary). Furthermore, it is clear that we could not claim a response had been abolished even if no feature in a pooled (regardless of step phase) response histogram met our statistical criteria. Abolition could only be claimed if, following step phase analysis, responses in each tenth of the step cycle all failed to achieve significance; and this was never the case.
The mechanism(s) that led to step phase dependency in our sample of 20 responses that could be fully investigated is clearly not a ‘blunderbuss’ affair but incorporates selective features in its organization, whose purpose might for example be to reduce the effect of expected afferent input on cortical activity (Baev & Shimansky, 1992; see below). These cells were located in a larger proportion in that area of cortex (the coronal gyrus) in which the proportion of neurones responsive during rest was highest. This perhaps suggests that the gating mechanism is organized not simply to permit the motor cortex to ‘pay less attention’ overall to somatic afferent inputs during walking but also to preserve the extent to which such inputs are focused onto particular areas of cortex.
One other study has investigated locomotor-related response ‘suppression’. This is the study by Chapin & Woodward (1982) of the responses of neurones in the primary somatosensory receiving area of the cerebral cortex in the rat. ‘Suppression’ was widespread but these authors used the term as a synonym for response size reduction: complete abolition appears not to have been observed. Note also that like Palmer et al. (1985) these authors studied only ‘excitatory’ responses though in one instance of a response to nerve stimulation that involved an increase in activity followed by a decrease the two components were analysed separately.
In the resting animal 46 % of neurones responsive to a volley in at least one peripheral nerve were PTNs; a proportion that increased to 69 % during walking. In the absence of information regarding the destinations of the axons of the non-PTNs any interpretation must be speculative, but it is a priori likely that we mostly recorded large cells in the deeper layers of the cortex and therefore cells with corticofugal axons would predominate. If the gating mechanism operates on naturally as well as on electrically evoked somatic afferent inputs it may therefore encourage channelling of the resultant changes in motor cortical output into the pyramidal system at the expense of the other projections issuing from motor cortex.
It will be valuable in future to explore whether a similar phenomenon to the step phase gating of somatosensory information is evident during other movement paradigms such as, for example, a reach-retrieve task. Moreover, if a ‘standard’ visual stimulus can be devised it may be possible to determine whether responsiveness to it is increased: in that case what we have currently observed might be part of a mechanism to favour visual as compared with somatic sensory guidance of movements.
It would be unsafe to assume that any gating mechanism(s) are locomotor or even movement specific; it will therefore be of interest in future to determine whether the same phenomenon occurs during other behaviours. However, the particular pattern of step phase dependency evident for responses during walking might be specific to ladder walking (visually guided stepping), and prove to be different, for example, during treadmill walking or when using the limb for a different purpose such as reaching.
Step phase dependency of responses during walking
In regard to excitatory responses our findings bear a general similarity to those of Palmer et al. (1985), who found step phase dependency in the size of the responses evoked in each of 13 motor cortical neurones, some of which were PTNs and some non-PTNs. Differences do exist, however, in that their commonest finding was of responses that increased progressively in size throughout stance to reach a peak during the flexion phase of the step (i.e. during early swing) before declining rapidly to a minimum at around footfall. We found a wider range of modulation patterns particularly for responses to SR stimulation (three of which were largest in early stance), though this may in part reflect greater heterogeneity in our cell sample in regard to receptive field location. However, those of our responses most directly comparable with those of Palmer et al. (1985; i.e. those to stimulation of the palmar branch of the UL nerve) were usually largest in the last tenth of the step cycle (i.e. the time when the foot is brought forwards and downwards to establish footfall) and substantial in the first tenth (during which footfall occurs). This occurred in five out of seven neurones clearly raising the possibility that modulation patterns may differ between treadmill and ladder walking.
Such a difference would not be surprising in view of the fact that successful performance of the latter task demands more precise control over the locus of footfall and differs in being crucially dependent on the integrity of the motor cortex and pyramidal tract. In these circumstances it might well be important that the excitability of the pathway from forelimb mechanoreceptors to some cortical neurones is high immediately before and at footfall. Indeed, in line with this suggestion, the responses in four of the five cases were actually larger in the last tenth than in the resting animal. Moreover, in a previous study (Marple-Horvat et al. 1993) we demonstrated that footfall onto an unstable ladder rung gave rise in substantial numbers of motor cortical neurones (including PTNs) to short-latency excitatory responses. This finding of ready transmission of a mechanically induced change in somatic afferent input at footfall accords better with our present findings than with those of Palmer et al. (1985). However, both studies involved small numbers of neurones and Palmer et al. (1985) confined detailed description to the commonest modulation pattern they found, so the possibility of sampling differences cannot be ignored.
In addition to the cases of transient response enhancement just mentioned we found that three out of seven SR responses exceeded rest size during part of the step cycle and Palmer et al. (1985) also reported three instances of enhancement. It therefore seems probable that it is an important aspect of the central regulation of the excitability of the pathways(s) from forelimb mechanoreceptors to the motor cortex. The point scarcely needs to be laboured that if some motor cortical responses are reduced relative to rest throughout the step cycle, while others are at times reduced and at times enhanced, then a rather sophisticated input-filtering mechanism must be in operation during locomotion. The likely significance for movement control of enhanced or reduced somatosensory responsiveness of cortical neurones at certain times has been extensively discussed in the context of manipulative movements of the hand made by monkeys (e.g. Prochazka, 1989; Chapman & Ageranioti-Belanger, 1991; Ageranioti-Belanger & Chapman, 1992; Porter & Lemon, 1993). It is, however, worthwhile to add that, in neurones with step phase-dependent responses, response size was frequently (see Figs 5–8) reduced not just below significance criteria, but actually to zero for some part of the step cycle and that such phasic losses of responsiveness rarely coincided for the two nerves. This constitutes a demonstration (albeit for artifically evoked inputs) that during the step the extent of somatic afferent convergence onto the neurones concerned is not a constant but is dynamically determined.
In their study of somatosensory cortical neurones in the rat, Chapin & Woodward (1982) recognized three patterns of size modulation of excitatory responses during treadmill walking. In some cells (14/30, 43 %) responses were tonically reduced below rest size, in others (7/30, 23 %) they were reduced for most of stance but facilitated just before and at footfall, while in the remainder there was a facilitation in early swing declining to a marked depression at footfall (see also Shin et al. 1994). Patterns generally similar to the first two types occurred, respectively, in 6/14 and 4/14 cases in our study (i.e. in 43 and 29 % of cases, respectively). Either pattern, but particularly the second, might reflect the operation of a mechanism designed to reduce (or neutralize) the effect of expected afferent inputs during walking, as suggested by Baev & Shimansky (1992). However, we encountered only one instance of the third type, which resembles closely the commonest type observed by Palmer et al. (1985). Moreover, we found three instances of responses (to SR stimulation) that were largest during stance and therefore had no parallel in the results of Chapin & Woodward (1982). There were therefore some similarities and some significant differences between our findings and those of Chapin & Woodward (1982). The latter may be either species or task related.
Site of action of the mechanism(s) regulating somatic afferent transmission to motor cortex during locomotion
Further than the evidence that response size modulation involves mechanisms acting at levels prior to the recorded neurones, our results do not enable us to pinpoint the site(s) at which pathway excitability was regulated. However, previous studies have shown the existence of mechanisms suitable for, and/or the occurrence of, movement-related gating both in the dorsal column nuclei and the thalamus of the cat (e.g. Towe & Jabbur, 1961; Ghez & Pisa, 1972; Coulter, 1974; Tsumoto et al. 1975). Investigations employing the present protocol but targeting neurones at these sites would allow assessment of the relative contributions made by cortical and sub-cortical mechanisms: indeed this strategy has been profitably adopted in relation to the thalamus and the primary somatosensory cortex of rats engaged in treadmill walking and evidence found for response regulation at both levels (Shin et al. 1993, 1994).
Acknowledgments
This work was supported by a Wellcome Trust Programme Grant (no. 042269) held jointly by D. M. A. and D. M.-H. Drs A. J. Amos and A. S. Montgomery are thanked for their participation in recording sessions and Mr S. Gilbey and Ms Rachel Bissett for excellent assistance respectively with computing and histology.
References
- Ageranioti-Belanger SA, Chapman CE. Discharge properties of neurones in the hand area of primary somatosensory cortex in monkeys in relation to the performance of an active tactile discrimination task. II. Area 2 as compared to areas 3b and 1. Experimental Brain Research. 1992;91:207–228. doi: 10.1007/BF00231655. [DOI] [PubMed] [Google Scholar]
- Akazawa K, Aldridge JW, Steeves JD, Stein RB. Modulation of stretch reflexes during locomotion in the mesencephalic cat. The Journal of Physiology. 1982;329:553–567. doi: 10.1113/jphysiol.1982.sp014319. [DOI] [PMC free article] [PubMed] [Google Scholar]
- Amos A, Armstrong DM, Marple-Horvat DE. Four mechanisms used to study skilled and adaptive ladder locomotion in the cat. The Journal of Physiology. 1987a;382:11. doi: 10.1016/0165-0270(87)90064-1. P. [DOI] [PubMed] [Google Scholar]
- Amos A, Armstrong DM, Marple-Horvat DE. A ladder paradigm for studying skilled and adaptive locomotion in the cat. Journal of Neuroscience Methods. 1987b;20:323–340. doi: 10.1016/0165-0270(87)90064-1. [DOI] [PubMed] [Google Scholar]
- Amos A, Armstrong DM, Marple-Horvat DE. Changes in the discharge patterns of motor cortical-neurons associated with volitional changes in stepping in the cat. Neuroscience Letters. 1990;109:107–112. doi: 10.1016/0304-3940(90)90546-l. [DOI] [PubMed] [Google Scholar]
- Apps R, Hartell NA. Gating of spino-olivocerebellar pathways in the awake cat. In: Taylor A, Gladden MH, Durbaba R, editors. Alpha and Gamma Motor Systems. New York and London: Plenum Press; 1995. pp. 403–405. [Google Scholar]
- Apps R, Hartell NA, Armstrong DM. Step phase-related excitability changes in spino-olivocerebellar paths to the c1 and c3 zones in cat cerebellum. The Journal of Physiology. 1995;483:687–702. doi: 10.1113/jphysiol.1995.sp020614. [DOI] [PMC free article] [PubMed] [Google Scholar]
- Apps R, Lidierth M, Armstrong DM. Locomotion-related variations in excitability of spino-olivocerebellar paths to cat cerebellar cortical c2 zone. The Journal of Physiology. 1990;424:487–512. doi: 10.1113/jphysiol.1990.sp018079. [DOI] [PMC free article] [PubMed] [Google Scholar]
- Armstrong DM, Criado JM, Marple-Horvat DE, Montgomery AS. Aspects of the supraspinal control of locomotion. Japanese The Journal of Physiology. 1995;45(suppl. 2):S63. [Google Scholar]
- Armstrong DM, Drew T. Discharges of pyramidal tract and other motor cortical neurones during locomotion in the cat. The Journal of Physiology. 1984a;346:471–495. doi: 10.1113/jphysiol.1984.sp015036. [DOI] [PMC free article] [PubMed] [Google Scholar]
- Armstrong DM, Drew T. Locomotor-related neuronal discharges in cat motor cortex compared with peripheral receptive fields and evoked movements. The Journal of Physiology. 1984b;346:497–517. doi: 10.1113/jphysiol.1984.sp015037. [DOI] [PMC free article] [PubMed] [Google Scholar]
- Armstrong DM, Marple-Horvat DE. Role of the cerebellum and motor cortex in the regulation of visually controlled locomotion. Canadian The Journal of Physiology and Pharmacology. 1996;74:443–455. [PubMed] [Google Scholar]
- Baev KV, Shimansky YP. Principles of organisation of neural systems controlling automatic movements in animals. Progress in Neurobiology. 1992;39:45–112. doi: 10.1016/0301-0082(92)90030-i. [DOI] [PubMed] [Google Scholar]
- Beloozerova IN, Sirota MG. The role of the motor cortex in the control of accuracy of locomotor movements in the cat. The Journal of Physiology. 1993a;461:1–25. doi: 10.1113/jphysiol.1993.sp019498. [DOI] [PMC free article] [PubMed] [Google Scholar]
- Beloozerova IN, Sirota MG. The role of the motor cortex in the control of vigor of locomotor movements in the cat. The Journal of Physiology. 1993b;461:27–46. doi: 10.1113/jphysiol.1993.sp019499. [DOI] [PMC free article] [PubMed] [Google Scholar]
- Brooks VB, Rudomin P, Slayman CL. Sensory activation of neurones in the cat's cerebral cortex. Journal of Neurophysiology. 1961a;24:286–301. [Google Scholar]
- Brooks VB, Rudomin P, Slayman CL. Peripheral receptive fields of neurones in the cat's cerebral cortex. Journal of Neurophysiology. 1961b;24:302–325. [Google Scholar]
- Chambers WW, Liu CN. Cortico-spinal tract of the cat. An attempt to correlate the pattern of degeneration with deficits in reflex activity following neocortical lesions. Journal of Comparative Neurology. 1957;108:23–55. doi: 10.1002/cne.901080103. [DOI] [PubMed] [Google Scholar]
- Chapin JK, Woodward DJ. Somatic sensory transmission to the cortex during movement: phasic modulation over the locomotor step cycle. Experimental Neurology. 1982;78:670–684. doi: 10.1016/0014-4886(82)90083-8. [DOI] [PubMed] [Google Scholar]
- Chapman CE, Ageranioti-Belanger SA. Discharge properties of neurones in the hand area of primary somatosensory cortex in monkeys in relation to the performance of an active tactile discrimination task. I. Areas 3b and 1. Experimental Brain Research. 1991;87:319–339. doi: 10.1007/BF00231849. [DOI] [PubMed] [Google Scholar]
- Coulter JD. Sensory transmission through lemniscal pathway during voluntary movement in the cat. Journal of Neurophysiology. 1974;37:831–845. doi: 10.1152/jn.1974.37.5.831. [DOI] [PubMed] [Google Scholar]
- Eccles JC, Rosen I, Scheid P, Taborikova H. Temporal patterns of responses of interpositus neurones to peripheral afferent stimulation. Journal of Neurophysiology. 1974;37:1424–1437. doi: 10.1152/jn.1974.37.6.1424. [DOI] [PubMed] [Google Scholar]
- Forssberg H. Stumbling corrective response: a phase-dependent compensatory reaction during locomotion. Journal of Neurophysiology. 1979;42:936–953. doi: 10.1152/jn.1979.42.4.936. [DOI] [PubMed] [Google Scholar]
- Gardner EP, Hamalainen HA, Warren S, Davis J, Young W. Somatosensory evoked potentials (SEPs) and cortical single unit responses elicited by mechanical tactile stimuli in awake monkeys. Electroencephalography and Clinical Neurophysiology. 1984;58:537–552. doi: 10.1016/0013-4694(84)90044-0. [DOI] [PubMed] [Google Scholar]
- Ghez C, Pisa M. Inhibition of afferent transmission in cuneate nucleus during voluntary movement in cat. Brain Research. 1972;40:145–151. doi: 10.1016/0006-8993(72)90120-5. [DOI] [PubMed] [Google Scholar]
- Hicks SP, D'Amato CJ. Motor-sensory cortex-corticospinal system and developing locomotion and placing in rats. American Journal of Anatomy. 1975;143:1–42. doi: 10.1002/aja.1001430102. [DOI] [PubMed] [Google Scholar]
- Jiang W, Chapman CE, Lamarre Y. Modulation of the cutaneous responsiveness of neurones in the primary somatosensory cortex during conditioned arm movements in the monkey. Experimental Brain Research. 1991;84:342–354. doi: 10.1007/BF00231455. [DOI] [PubMed] [Google Scholar]
- Lemon RN. Short-latency peripheral inputs to the motor cortex in conscious monkeys. Brain Research. 1979;161:150–155. doi: 10.1016/0006-8993(79)90202-6. [DOI] [PubMed] [Google Scholar]
- Liddell EGT, Phillips CG. Pyramidal section in the cat. Brain. 1944;67:1–9. [Google Scholar]
- Lidierth M, Apps R. Gating in the spino-olivocerebellar pathways to the c1 zone of the cerebellar cortex during locomotion in the cat. The Journal of Physiology. 1990;430:453–469. doi: 10.1113/jphysiol.1990.sp018301. [DOI] [PMC free article] [PubMed] [Google Scholar]
- Livingston A, Phillips CG. Maps and thresholds for the sensorimotor cortex of the cat. Quarterly Journal of Experimental Physiology. 1957;42:190–205. doi: 10.1113/expphysiol.1957.sp001250. [DOI] [PubMed] [Google Scholar]
- Marple-Horvat DE, Amos AJ, Armstrong DM, Criado JM. Changes in the discharge patterns of cat motor cortex neurons during unexpected perturbations of on-going locomotion. The Journal of Physiology. 1993;462:87–113. doi: 10.1113/jphysiol.1993.sp019545. [DOI] [PMC free article] [PubMed] [Google Scholar]
- Marple-Horvat DE, Gilbey SL. A method for automatic identification of periods of muscular activity from EMG recordings. Journal of Neuroscience Methods. 1992;42:163–167. doi: 10.1016/0165-0270(92)90095-u. [DOI] [PubMed] [Google Scholar]
- Palmer CI, Marks WB, Bak MJ. The responses of the cat motor cortical units to electrical cutaneous stimulation during locomotion and during lifting falling and landing. Experimental Brain Research. 1985;58:102–116. doi: 10.1007/BF00238958. [DOI] [PubMed] [Google Scholar]
- Pappas CL, Strick PL. Double representation of the distal forelimb in cat motor cortex. Brain Research. 1979;167:412–416. doi: 10.1016/0006-8993(79)90837-0. [DOI] [PubMed] [Google Scholar]
- Pappas CL, Strick PL. Physiological demonstration of multiple representation in the forelimb region of the cat motor cortex. Journal of Comparative Neurology. 1981;200:481–490. doi: 10.1002/cne.902000403. [DOI] [PubMed] [Google Scholar]
- Porter R, Lemon RN. Corticospinal Function and Voluntary Movement. Oxford: Oxford University Press; 1993. [Google Scholar]
- Prochazka A. Sensorimotor gain control: A basic strategy of motor systems? Progress in Neurobiology. 1989;33:281–307. doi: 10.1016/0301-0082(89)90004-x. [DOI] [PubMed] [Google Scholar]
- Rossignol S, Drew T. Interactions of segmental and suprasegmental inputs with the spinal pattern generator of locomotion. In: Barnes WJP, Gladden MH, editors. Feedback and Motor Control. London: Croom Helm; 1985. pp. 355–377. [Google Scholar]
- Shin H-C, Park HK, Chapin JK. Differential phasic modulation of short and long latency afferent sensory transmission to single neurons in the ventroposterolateral thalamus in behaving rats. Neuroscience Research. 1993;17:117–125. doi: 10.1016/0168-0102(93)90089-9. [DOI] [PubMed] [Google Scholar]
- Shin H-C, Park HK, Chapin JK. Differential phasic modulation of short and long latency afferent sensory transmission to single neurons in the primary somatosensory cortex in behaving rats. Neuroscience Research. 1994;19:419–425. doi: 10.1016/0168-0102(94)90083-3. [DOI] [PubMed] [Google Scholar]
- Takahashi K. Slow and fast groups of pyramidal tract cells and their respective membrane properties. Journal of Neurophysiology. 1965;28:908–924. doi: 10.1152/jn.1965.28.5.908. [DOI] [PubMed] [Google Scholar]
- Towe AL, Jabbur SJ. Cortical inhibition of neurons in dorsal column nuclei of cat. Journal of Neurophysiology. 1961;24:488–498. doi: 10.1152/jn.1961.24.5.488. [DOI] [PubMed] [Google Scholar]
- Tsumoto T, Nakamura S, Iwama K. Pyramidal tract control over cutaneous and kinesthetic sensory transmission in the cat thalamus. Experimental Brain Research. 1975;22:281–294. doi: 10.1007/BF00234770. [DOI] [PubMed] [Google Scholar]