

Abstract
Corticothalamic (CT) EPSPs evoked at ≤ 0.1 Hz were recorded from thalamocortical neurones in the rat dorsal lateral geniculate nucleus in vitro, with both GABAA and GABAB receptors blocked.
The group III metabotropic glutamate (mGlu) receptor agonists L-2-amino-4-phosphono-butyric acid (L-AP4) and O-phospho-L-serine (L-SOP) both caused a concentration-dependent depression of the CT EPSP. The maximum depression and EC50 values for these effects were 64.4 ± 3.8 % and 88.0 ± 24.7 μm for L-AP4, and 42.0 ± 2.5 % and 958 ± 492 μm for L-SOP, respectively (means ±s.e.m.). Neither agonist had any effect on membrane potential or input resistance.
The depression of the CT EPSP caused by L-AP4 was reversed using the group III antagonist (S)-2-amino-2-methyl-4-phosphonobutanoic acid (MAP4, 1 mM), and the group II/III antagonist LY341495 (3 μm), but not using the group II antagonist (2S)-α-ethylglutamic acid (300 μm). The potencies of L-AP4, L-SOP and LY341495 indicate that this action of L-AP4 is mediated via mGlu7 and mGlu8 and not mGlu4 receptors.
Neither MAP4 nor LY341495 had any effect on the CT EPSPs evoked by 10 Hz trains of five stimuli, indicating the lack of endogenous activation of group III mGlu receptors in the thalamus during short bursts of cortical input. However, the magnitude of the depression caused by L-AP4 indicates that any physiological activation of group III mGlu receptors would have a profound effect on the CT input to the thalamus, and hence cortical control of thalamic function.
The thalamocortical (TC) axons from the sensory thalamic nuclei, such as the dorsal lateral geniculate nucleus (dLGN), provide the main subcortical excitatory input to the cortex. In turn, the corticothalamic (CT) axons from layer VI of the cortex, together with those of ascending sensory and brainstem afferents, form the three principal excitatory inputs to the TC neurones (Jones, 1985). It is the interplay of the thalamus, cortex and brainstem that is believed to be critical to sensory processing and to determine sleep/awake states. The sensory afferents form the relay input to the sensory thalamic nuclei from the specific sensory system they subserve, i.e. retinogeniculate axons in the case of the dLGN. This input is mediated by both non-NMDA and NMDA ionotropic glutamate receptors (Scharfman et al. 1990; Turner et al. 1994). The brainstem afferents provide a modulatory input that is able to depolarize the membrane potential of TC neurones during arousal, and is predominantly mediated by cholinergic receptors (McCormick & Prince, 1987). Both the sensory and brainstem afferents contact TC neurones on their proximal dendrites < 100 μm from the soma (Wilson et al. 1984; Erisir et al. 1997). In contrast, those from the cortex contact the distal dendrites > 100 μm from the soma (Erisir et al. 1997), forming a feedback loop which allows the cortex to control the thalamic output it receives. Hence, the CT input is able to synchronize thalamic neurones responding to common features of sensory stimuli (Sillito et al. 1994), and to provide the oscillatory input necessary for active information decoding (Ahissar et al. 1997). The activation of both non-NMDA and NMDA ionotropic glutamate receptors contributes to the postsynaptic responses evoked by this input (Scharfman et al. 1990; Eaton & Salt, 1996; Turner & Salt, 1998).
In contrast, the role of the metabotropic glutamate receptors (mGlu1-8; Conn & Pin, 1997) in CT synaptic transmission is not fully understood. Of the group I mGlu receptors, mGlu1 receptor-like immunoreactivity is found on the distal dendrites of TC neurones opposed to the CT axon terminals (Martin et al. 1992; Godwin et al. 1996; Vidnyánszky et al. 1996). The activation of these receptors by the non-selective agonist (1S, 3R)-1-aminocyclopentane-1,3-dicarboxylic acid results in excitation of thalamic neurones in vivo (Salt & Eaton, 1991), and membrane potential depolarization and an increase in input resistance in vitro (McCormick & von Krosigk, 1992). The activation of these receptors may contribute to the postsynaptic response evoked by cortical input (McCormick & von Krosigk, 1992; Eaton & Salt, 1996).
Group II mGlu (mGlu2/3) receptor-like immunoreactivity has been found in the neuropil and on cell bodies of the thalamus in the rat (Petralia et al. 1996). However, the lack of mGlu2 and mGlu3 receptor mRNA expression in the sensory nuclei of the thalamus, the weak to moderate expression in the cortex, and the prominent expression of mGlu3 but not mGlu2 receptors in the nucleus reticularis thalami (NRT) (Ohishi et al. 1993a, b), indicate that group II mGlu receptors are predominantly located on the terminals of axons from the NRT, as shown in vivo (Salt & Eaton, 1995). However, of the group III mGlu receptors, mGlu7-like immunoreactivity is found in the thalamus (Kinoshita et al. 1998), and the mRNAs for mGlu4 and mGlu7 receptors are expressed both in the thalamus and in the cortex, whilst only the mGlu7 receptor is expressed in the NRT (Ohishi et al. 1995). In contrast, the mRNA for the mGlu8 receptor is much better expressed in the cortex than in the thalamus or NRT (Saugstad et al. 1997). This robust expression of the mRNAs for group III mGlu receptors, both at the sites of origin of the CT afferents in layers IV-VI of the cortex and in the thalamus itself, suggests they are potentially involved in the control of transmission at CT synapses and so influence the feedback control exerted by the cortical input. The aim of the present study was to examine the effect of group III mGlu receptor activation on EPSPs evoked by stimulation of CT afferents in slices of rat dLGN.
Parts of this work have previously appeared in abstract form (Turner & Salt, 1997, 1999).
METHODS
Slicing procedures
The methods used here for the preparation of pseudo-parasagittal brain slices containing the dLGN have been described previously (Turner & Salt, 1998). Briefly, young adult male Hooded Lister rats (150-200 g) were anaesthetized with halothane (May & Baker) and decapitated using licensed procedures approved by the UK Home Office. Their brains were then rapidly removed and placed in ice-cold (1-3°C) continuously oxygenated (95 % O2-5 % CO2) Krebs medium, in which the NaCl used to make up the solution had been replaced with an approximately isosmotic concentration of sucrose. Two angled cuts were made along either side of the mid-line and pseudo-parasagittal brain slices (350-450 μm) containing the dLGN, the main thalamic field, the adjacent NRT and internal capsule were prepared. These slices were then placed in a storage chamber, where they were maintained in continuously oxygenated Krebs medium of the same composition as that used for slice cutting, at room temperature (20-22°C). After 1 h this medium was replaced by a continuously oxygenated Krebs medium containing (mM): NaCl, 124; KCl, 3; KH2PO4, 1.25; MgSO4, 1; CaCl2, 2; NaHCO3, 26; and glucose, 10. After a further hour, slices were transferred to an interface recording chamber where they were perfused with the same continuously oxygenated Krebs medium. This medium also contained the GABAA and GABAB receptor antagonists bicuculline methiodide (30 μm) and P-(3-aminopropyl)-P-diethoxymethyl-phosphinic acid (CGP35348, 0.5-1 mM) or 3-N[1-(S)-(3,4-dichlorophenyl)ethyl]amino-2-(S)-hydroxypropyl-P-benzyl-phosphinic acid (CGP55845A, 1-3 μm), respectively, so that the synaptic transmission mediated by these receptors was blocked and would not influence the properties of the recorded neurones. Slices were maintained at a temperature of 34 ± 1°C, and then left for another hour before recording commenced.
Recording procedures
Using the current clamp technique, intracellular recordings were made with sharp standard-walled glass microelectrodes (TF120, Clark Electromedical), filled with 1 M potassium acetate (final tip resistance, 80-120 MΩ). To generate EPSPs of CT fibre origin, a bipolar stimulating electrode was placed in the NRT region adjacent to the dLGN. EPSPs were evoked using 100 μs square wave pulses of current (30-500 μA) delivered either as single stimuli at ≤ 0.1 Hz or in 10 Hz trains of five stimuli at 0.1 Hz. In most experiments, at membrane potentials between -60 and -70 mV, stimulus intensity was adjusted in order to minimize the contribution from the low-threshold Ca2+ potential (LTCP) to the CT EPSP at the time to peak of the underlying synaptic event. In order to obtain an accurate indication of this time to peak, membrane potential was temporally depolarized using constant current injection to a level where the low-threshold Ca2+ current (IT) underlying the LTCP (Crunelli et al. 1989) was inactivated. The time to peak measured at this membrane potential was used for the subsequent analysis of CT EPSP amplitude during the rest of the experiment. This ensured that during the 10 Hz trains of stimuli, the facilitated CT EPSPs did not exceed firing threshold. In the remaining experiments, the membrane potential was continuously depolarized using constant current injection to inactivate the LTCP. Following amplification with an Axoprobe 1A (Axon Instruments), voltage and current records were either stored on an analog tape recorder (Racal) and later digitized at 1-10 kHz via a DigiData 1200A interface using Axoscope software (Axon Instruments) for subsequent analysis, or digitized directly at 10 kHz via a μ1401 interface using Spike2 software (Cambridge Electronic Design) with the data files being later converted to Axon file format for subsequent analysis. All analyses were performed using either Axoscope or pCLAMP 6 software (Axon Instruments). The criteria for the distinction of TC cells and local circuit interneurones were similar to those described previously for the dLGN (Crunelli et al. 1987; Williams et al. 1996).
Data analysis
Quantitative results are expressed in the text and figures as means ±s.e.m. Statistical significance was tested using either Student's t test or paired t test, depending on the experimental design. Using Origin software (Microcal), the concentration-effect curves were fitted with the Hill equation:
where x is the drug concentration, y is the percentage inhibition at x, Vmax is the maximal percentage inhibition, k is the EC50 value and nHis the Hill slope constant, by non-linear regression analysis.
Material sources
Bicuculline methiodide and O-phospho-L-serine (L-SOP) were from Sigma; L-2-amino-4-phosphonobutyric acid (L-AP4), (S)-2-amino-2-methyl-4-phosphonobutanoic acid (MAP4) and (2S)-α-ethylglutamic acid (EGLU) were from Tocris (MAP4 was originally a gift from Professor J. C. Watkins, University of Bristol, UK); lidocaine N-ethyl bromide (QX-314) was from Alomone Labs; 2S-2-amino-2-(1S, 2S-2-carboxycycloprop-1-yl)-3-(xanth-9-yl)propanoic acid (LY341495) was a gift from Dr A. E. Kingston (Eli Lilly, Windlesham, UK); and CGP35348 and CGP55845A were gifts from Dr W. Fröstl (Ciba-Geigy/Novartis, Basel, Switzerland). All drugs were applied in the perfusion medium.
RESULTS
Group III mGlu receptor agonist-induced depression of the CT EPSP
The application of the specific group III mGlu receptor agonist L-AP4 caused a reversible depression of CT EPSP amplitude (Fig. 1Aa), without any associated changes in the membrane potential or apparent input resistance of TC neurones (Fig. 1Ab). For those CT EPSPs evoking LTCPs, which generated action potential burst firing at membrane potentials between -75 and -65 mV, the depression of the EPSP was sufficiently large at higher concentrations of l-AP4 to prevent the appearance of this mode of firing (Fig. 1Aa and B). This depression of the CT EPSP was independent of membrane potential (Fig. 1B), indicating that it did not involve the voltage-dependent properties of TC neurones, and so appeared to be an action directly associated with the CT EPSP. In order to establish this, a few experiments (number of TC neurones tested (n) = 4) were performed with a filling solution containing 50 mM QX-314 in the recording electrode. This quaternary lidocaine derivative blocks a number of the voltage-dependent conductances found in the neurones of the CNS, including the low-threshold Ca2+ current IT (Talbot & Sayer, 1996), which underlies the generation of the LTCP in TC neurones (Crunelli et al. 1989), and the IH current (Perkins & Wong, 1995), which is responsible for the inward rectification in TC neurones (McCormick & Pape, 1990). Under these conditions L-AP4 still caused a depression of CT EPSPs, suggesting a lack of involvement of IT and IH in the action of L-AP4 on the CT EPSP (Fig. 2A). However, although the LTCP was apparently blocked by QX-314 at the soma, when assessed by the injection of square pulses of current (Fig. 2B a) it could still be evoked by the CT EPSP (Fig. 2B b), indicating that this drug probably did not reach the most distal part of the dendrites at a concentration high enough to fully block IT (see Talbot & Sayer, 1996). An equally effective method to limit the generation of the LTCP was to reduce stimulus intensity or to depolarize membrane potential as outlined in the Methods (see Figs 3-5).
Figure 1. The depression of the CT EPSP caused by the specific group III mGlu receptor agonists L-AP4 and L-SOP.

Aa, three panels each comprising five superimposed voltage records illustrating consecutive CT EPSPs before, during and after the application of 300 μm L-AP4. Ab, three panels each comprising five superimposed voltage records of the electrotonic response to the square pulse current injection indicated above, obtained before, during and after the application of 300 μm L-AP4, from the same TC neurones as in Aa. Membrane potential was -70 mV. B, six panels each comprising four superimposed voltage records of the CT EPSP before and during the application of 300 μm L-AP4, at the membrane potentials denoted on the left. Spike amplitudes have been truncated for clarity in A and B. C, concentration-effect curves for the depression of the CT EPSP caused by L-AP4 and L-SOP. The vertical lines represent the s.e.m. for the means represented by the filled symbols with the number of TC neurones tested at each concentration indicated in parentheses. The data were fitted with curves described by the Hill equation, the parameters for which are shown in the boxes.
Figure 2. The L-AP4-induced depression of the CT EPSP and the block of the LTCP with QX-314-filled microelectrodes.
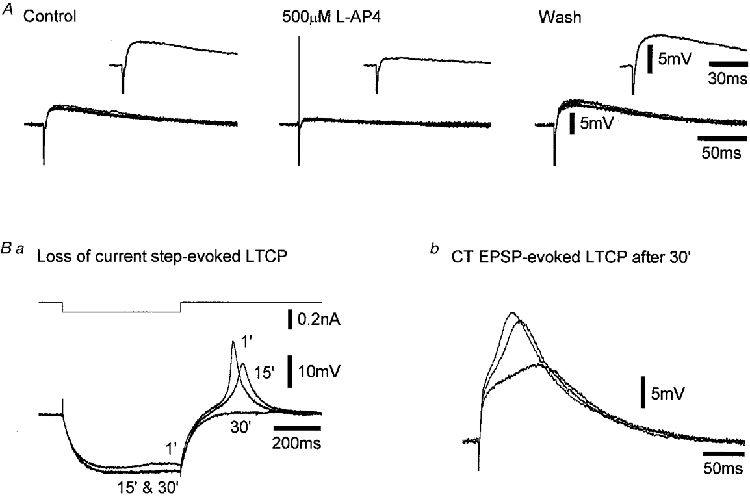
A, three panels each comprising five superimposed voltage records illustrating consecutive CT EPSPs before, during and after the application of 500 μm L-AP4 obtained using sharp microelectrodes filled with 1 M potassium acetate and 50 mM QX-314. The insets show the average of the traces below. Ba, three superimposed voltage responses to the square pulse current injection indicated above, obtained at the times indicated in minutes from the onset of recording, showing the loss of membrane potential sag during negative current injection and the LTCP at the offset of the negative current pulse. Bb, three superimposed voltage records illustrating the ability of the CT EPSP to evoke LTCPs after 30 min of recording, at a higher stimulation current than that used in A. All records from the same TC neurone. Membrane potential was -71 mV.
Figure 3. The effect of L-AP4, MAP4 and LY341495 on CT EPSPs evoked by trains of five stimuli at 10 Hz.

A, three panels each comprising four superimposed voltage records showing consecutive CT EPSP responses to trains of five stimuli at 10 Hz before, during and after the application of 300 μm L-AP4. Membrane potential was -62 mV. Ba-c, summaries of the amplitudes of the CT EPSP response to each stimulus in the train and the percentage depression of EPSP amplitude caused by 300 μm L-AP4 (a), 1 mM MAP4 (b) and 3 μm LY341495 (c). The vertical lines represent the s.e.m. for the means of the EPSP amplitude in the absence (○) and in the presence of the mGlu receptor agonist or antagonist (•), and the percentage depression of the EPSP caused by the mGlu receptor agonist or antagonist (♦) for the number of TC neurones indicated. * P < 0.005, paired t test.
Figure 5. The reversal of the L-AP4-induced depression of the CT EPSP by the selective group II/III mGlu receptor antagonist LY341495, but not the selective group II antagonist EGLU.

A, three panels each comprising five superimposed voltage records illustrating consecutive CT EPSPs before and during the application of 300 μm L-AP4 alone, and during the co-application of 300 μm L-AP4 and 3 μm LY341495. Membrane potential was -64 mV. Summary bar charts show the depression of the CT EPSP by L-AP4 and the reversal of this depression by LY341495, illustrated as a percentage reduction of the control response on the left and as a percentage change between these values on the right. Each column represents the mean and s.e.m. of six experiments. B, three panels each comprising five superimposed voltage records showing consecutive CT EPSPs before and during the application of 300 μm L-AP4 alone, and during the co-application of 300 μm L-AP4 and 300 μm EGLU. Membrane potential was -69 mV. Summary bar charts show the depression of the CT EPSP by L-AP4 and the reversal by EGLU, illustrated as a percentage reduction of the control response on the left and as a percentage change between these values on the right. Each column represents the mean and s.e.m. of three experiments.
The effect of L-AP4 was concentration dependent (20-500 μm, n = 39), with a mean maximal inhibition of 64.4 ± 3.8 % at 300 μm, and an estimated Vmax of 67.4 ± 9.2 % and an EC50 of 88.0 ± 24.7 μm (Fig. 1C). A second group III agonist, L-SOP, also depressed CT EPSP amplitude in a concentration-dependent manner (1-5 mM, n = 19), with a mean apparent maximal inhibition of 42.0 ± 2.5 % at 5 mM, and an estimated Vmax of 46.0 ± 18.5 % and EC50 of 958 ± 492 μm (Fig. 1C). L-SOP also had no effect on the membrane potential or apparent input resistance of TC neurones (data not shown), confirming that the activation of group III mGlu receptors caused the depression of the CT EPSP by a direct action.
L-AP4-induced depression of CT EPSPs evoked by trains of five stimuli at 10 Hz
The CT EPSP becomes augmented in amplitude using stimulation frequencies at or above 1 Hz, owing to the increased probability of release for each successive EPSP (Castro-Alamancos et al. 1997). In the present study, this phenomenon was examined using trains of five stimuli delivered at 10 Hz. The facilitation of the CT EPSP produced with this stimulation protocol was characterized by a 185 ± 9 % increase in amplitude between the first and second EPSP, with relatively small increases in amplitude for the subsequent three EPSPs, which were not significantly different from each other (P > 0.05, paired t test, n = 17, Fig. 3A). This would suggest that the probability of release neared its permissible maximum at the second EPSP under control conditions. In the presence of L-AP4, the facilitation of the CT EPSP was characterized by a 178 ± 10 % increase in amplitude between the first and the second EPSP, almost identical to that for the control EPSPs. However, there was also a significant 47 ± 5 % increase in amplitude between the second and the third EPSP (P < 0.005, paired t test). As a result there was a significant reduction (P < 0.005, paired t test) in the depression of the CT EPSP caused by L-AP4 from the third EPSP onwards (Fig. 3B a). This observation suggested that there may be endogenous activation of group III mGlu receptors resulting in depression of the third, fourth and fifth CT EPSP during trains of five stimuli under control conditions. In order to examine this further, the effects of mGlu receptor antagonists alone on trains of stimuli were examined.
Action of mGlu receptor antagonists on the CT EPSP
The selective group III mGlu receptor antagonist MAP4 (1 mM) alone had no effect on the amplitude of the CT EPSP evoked at ≤ 0.1 Hz (n = 8, data not shown), the facilitation of the CT EPSP in response to five stimuli at 10 Hz (n = 7, Fig. 3B b), or the membrane potential or apparent input resistance of TC neurones when applied alone (n = 8, data not shown). The selective group II/III mGlu receptor antagonist LY341495 has a potency profile against human group III mGlu receptors which suggests that it should be relatively selective for mGlu7 and mGlu8 but not mGlu4 receptors at concentrations between 1 and 10 μm (Kingston et al. 1998). A concentration of 3 μm was chosen, in order to exploit this selectivity for these group III mGlu receptors. At this concentration, LY341495 like MAP4 had no effect on the CT EPSP evoked at ≤ 0.1 Hz (data not shown), the facilitation of the CT EPSP in response to five stimuli at 10 Hz (n = 10, Fig. 3B c), or the membrane potential or apparent input resistance of TC neurones when applied alone (data not shown, n = 10). This suggests that there was no activation of mGlu receptors by endogenously released neurotransmitter during trains of five stimuli, and that there is no physiological activation of group II and III mGlu receptors during short bursts of CT activity in the thalamus. As a consequence, the most likely explanation for the shift in reaching the maximum amplitude of the facilitated CT EPSPs from the second to the third EPSP in the presence of L-AP4 is the smaller decrease in the driving force of the synaptic current underlying the EPSP at its peak. Therefore, the probability of release for the facilitated CT EPSPs is more likely to near its permissible maximum at the third EPSP or later at 10 Hz.
Action of mGlu receptor antagonists on the L-AP4-induced depression of the CT EPSP
The mGlu receptor antagonists were tested against a fixed concentration of L-AP4 in order to determine the specific mGlu receptor(s) mediating the depression of the CT EPSP. The concentration of L-AP4 selected was 300 μm, since this caused a near- or just-maximal effect based on the data obtained in this study (see Fig. 1C), and so would cause a robust depression of the CT EPSP. Following a 56.7 ± 4.9 % depression of the CT EPSP caused by 300 μm L-AP4 (n = 9), the co-application of 1 mM MAP4 reduced depression to only 17.3 ± 4.9 % (Fig. 4). In addition, the depression of CT responses to trains of five stimuli at 10 Hz by 300 μm L-AP4 was reversed by the co-application of 1 mM MAP4, so that the first and fifth EPSPs were only depressed by 23.5 ± 10.8 and 14.9 ± 3.6 %, respectively (n = 5, data not shown).
Figure 4. The reversal of the L-AP4-induced depression of the CT EPSP by the group III mGlu receptor antagonist MAP4.
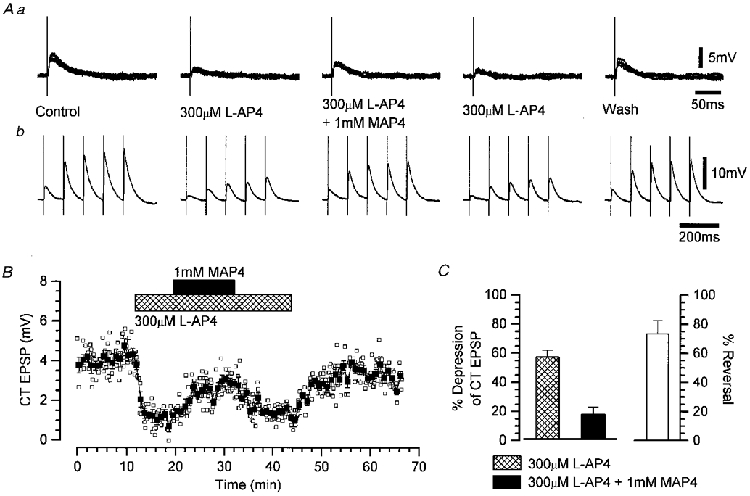
Aa, five panels each comprising four superimposed voltage records showing consecutive CT EPSPs before, during and after the application of 300 μm L-AP4 alone, and during the co-application of 300 μm L-AP4 and 1 mM MAP4. Ab, five panels each comprising the mean voltage records derived from four consecutive CT EPSP responses to five stimuli at 10 Hz before, during and after the application of 300 μm L-AP4 alone, and during the co-application of 300 μm L-AP4 and 1 mM MAP4. Membrane potential was -62 mV. B, the amplitude of the CT EPSP over the time course of the experiment, illustrating the depression by L-AP4 and the reversal by MAP4. The vertical lines represent the s.e.m. for the means (▪) derived from five consecutive individual EPSP amplitudes (□). The bars above the plots represent the duration of the mGlu receptor agonist/antagonist application. C, summary bar charts for the depression of the CT EPSP by L-AP4 and the reversal by MAP4, shown as a percentage reduction of the control response on the left and as a percentage change between these values on the right. Each column represents the mean and s.e.m. of nine experiments.
Similarly, following a 71.0 ± 4.2 % depression of the CT EPSP caused by 300 μm L-AP4 (n = 6), the co-application of 3 μm LY341495 reduced this depression to 8.3 ± 11.2 % (Fig. 5A). The depression of the CT response to trains of five stimuli at 10 Hz by 300 μm L-AP4 was also reversed by the co-application of 3 μm LY341495, so that the first and fifth EPSPs were only depressed by 27.0 ± 7.0 and 8.1 ± 5.5 %, respectively (n = 3, data not shown). Since LY341495 is also a group II antagonist with IC50 values in the 10-100 nM range (Kingston et al. 1998), the selective group II mGlu receptor antagonist EGLU (Jane et al. 1996) was also tested for comparison with LY341495. EGLU had no effect on an 80.5 ± 4.7 % depression of the CT EPSP caused by 300 μm L-AP4 (n = 3), so that during co-application of 300 μm EGLU the depression remained at 84.7 ± 2.4 % (Fig. 5B). The depression of the CT response to trains of five stimuli at 10 Hz by 300 μm L-AP4 was also unaffected by the co-application of 300 μm EGLU (n = 3, data not shown).
DISCUSSION
The main conclusions of this study are as follows. (1) The activation of group III mGlu receptors leads to the depression of the CT EPSP recorded from TC neurones. (2) This depression of the CT EPSP is reversed by the selective group III mGlu receptor antagonist MAP4 (1 mM) and the selective group II/III mGlu receptor antagonist LY341495 (3 μm), but not the selective group II mGlu receptor antagonist EGLU (300 μm). The concentrations of these antagonists together with the potency of L-AP4 suggest that this depression is mediated by mGlu7 and mGlu8, and not mGlu4 receptors. (3) The lack of effect of either MAP4 or LY341495 on the CT EPSPs evoked by trains of five stimuli indicates that short bursts of cortical input do not activate group II or group III mGlu receptors by the endogenously released neurotransmitter. (4) The activation of group III mGlu receptors would have a dramatic impact on the responsiveness of TC neurones to cortical input, probably during sustained CT input.
The pharmacology of the group III mGlu receptor agonists causing depression of the CT EPSP
The conclusion as to which of the group III mGlu receptors mediate the L-AP4-induced depression of the CT EPSP is based upon a combination of the pharmacology observed in this study and that of the L-AP4-induced depression of EPSPs at synapses in the hippocampus where mGlu receptors have been localized. The potency values of 88.0 ± 24.7 μm for L-AP4 and 958 ± 492 μm for L-SOP obtained in this study are incompatible with the depression of the CT EPSP being mediated by only one of the group III mGlu receptors. The EC50 values for L-AP4 and L-SOP are 0.4-1.2 μm and 1.1-4.4 μm at mGlu4 receptors, respectively (Thomsen et al. 1992; Thomsen & Suzdak, 1993; Johansen et al. 1995); 160 μm for both at mGlu7 receptors (Okamoto et al. 1994); and 0.67 μm for L-AP4 at mGlu8 receptors (Saugstad et al. 1997), as determined using expression systems. Indeed, the EC50 values for L-AP4 and L-SOP presented here are greater than those in other electrophysiological studies where mGlu4 and/or mGlu8 receptors are the predominant group III mGlu receptors mediating their effects, such as in the depression of the lateral perforant pathway (LPP) EPSP (2.5 and 23 μm, respectively; Koerner et al. 1983; Johansen et al. 1995). In contrast, the EC50 value for L-AP4 presented here is much smaller than that for the depression of the Schaffer collateral (SC) EPSP (EC50 > 500 μm; Gereau & Conn, 1995), generated at synapses in the hippocampus where mGlu7 receptors are predominantly found (Shigemoto et al. 1997). Therefore, the agonist data in this study suggest a combination of mGlu4 and/or mGlu8 receptors together with mGlu7 receptors, with no one receptor predominating in the mediation of CT EPSP depression.
The pharmacology of the mGlu receptor antagonists
The profile of activity exhibited by the mGlu receptor antagonists used in this study provides the most compelling evidence for the conclusion that the mGlu receptors mediating the depression of the CT EPSP are mGlu7 and mGlu8 receptors, and not mGlu4 receptors. Firstly, the reversal of the L-AP4-induced depression of the CT EPSP by MAP4 is consistent with the involvement of either mGlu4 or mGlu8 receptors, since MAP4 has been shown to be both an antagonist or a partial agonist at mGlu4 receptors and an antagonist at mGlu8 receptors in expression systems (Johansen & Robinson, 1995; Knöpfel et al. 1995; Saugstad et al. 1997). While MAP4 also reverses the mGlu4 or mGlu8 receptor-mediated L-AP4-induced depression of the LPP EPSP (Macek et al. 1996), it does not reverse the mGlu7 receptor-mediated L-AP4-induced depression of the SC EPSP (Gereau & Conn, 1995), indicating that it is not a good antagonist at mGlu7 receptors. In the present study, there was an incomplete reversal of the L-AP4-induced depression of the CT EPSP with 1 mM MAP4 and this concentration would be expected to fully reverse effects mediated by mGlu4 and mGlu8 receptors. Since the potencies of L-AP4 and L-SOP indicate that the activation of mGlu7 receptors is involved in the depression of the CT EPSP, this MAP4-resistent component suggests that the activation of these receptors contributes 25-30 % of the total depression caused by L-AP4.
Secondly, the concentration of the mGlu receptor antagonist LY341495 used in this study was carefully chosen so that it fell between the IC50 values of human mGlu7 and mGlu8 receptors and the IC50 value of mGlu4 receptors (0.99, 0.17 and 22 μm, respectively; Kingston et al. 1998). The > 90 % reduction of the L-AP4-induced depression of the CT EPSP achieved with 3 μm LY341495 indicates that the activation of either mGlu7 or mGlu8 receptors mediates the L-AP4 effect. LY341495 is a more potent antagonist of group II mGlu receptors (IC50 values at mGlu2 and mGlu3 receptors, 0.021 and 0.014 μm, respectively; Kingston et al. 1998), but the lack of effect of EGLU at a concentration in excess of those shown to be effective in other studies (Jane et al. 1996) shows that this effect is not mediated via these receptors. In addition, 3 μm LY341495 would only have a relatively small amount of antagonist activity at group I receptors (IC50 values at mGlu1 and mGlu5 receptors, 6.8 and 8.2 μm, respectively; Kingston et al. 1998), and L-AP4 and L-SOP have no agonist activity at either group I or group II receptors (Conn & Pin, 1997), indicating that the depression of the CT EPSP caused by L-AP4 also cannot be mediated via these receptors. Therefore, in conjunction with the MAP4 data and consistent with the agonist profile, the activation of mGlu7 and mGlu8 receptors, and not mGlu4 receptors, contributes to the group III mGlu receptor-mediated depression of the CT EPSP.
The localization of the mGlu receptors mediating the depression of the CT EPSP
In view of the involvement of the activation of mGlu7 and mGlu8 receptors in the depression of the CT EPSP caused by L-AP4, the expression of the mRNAs for these mGlu receptors in both the cortex and the thalamus (Ohishi et al. 1995; Saugstad et al. 1997) indicates that these receptors may have either a pre- or a postsynaptic location in the thalamus. Since the first two CT EPSPs evoked by the trains of five stimuli are effectively a paired-pulse protocol, and no change in the facilitation was observed in the present study, some would argue that the effect of the group III agonists may well be postsynaptic (Kahle & Cotman, 1993). However, any changes in the amount of facilitation between the first and second EPSP could be obscured by the relative differences in the driving force of the synaptic current underlying these EPSPs at its peak. Indeed, there are better methods for determining the site of receptors modulating synaptic transmission, such as the analysis of single fibre EPSP failures or of miniature EPSC frequency. However, neither of these methods was practicable in the present study, owing to a high degree of convergence of CT axons onto a single TC neurone (several 100:1; Robson, 1983) and the remote location of the CT synapses on TC neurone dendrites making miniature EPSCs of CT origin, unlike those of retinogeniculate origin, difficult to detect (Paulsen & Heggelund, 1996). Therefore, the precise location of these receptors could not be determined in the present study. However, if they are postsynaptic, then the lack of effect of either L-AP4 or L-SOP on membrane potential or input resistance indicates that their activation leads to a relatively direct modification of the CT EPSP at its site of generation on the distal dendrites of TC neurones.
The activation of the group III mGlu receptors has already been shown to cause the presynaptic depression of GABAergic inhibition from the NRT in the ventro-basal thalamus (Salt & Eaton, 1995). The present study illustrates that the activation of these receptors is also effective in depressing the CT EPSP, indicating that group III mGlu receptors exert control over both cortical and NRT inputs in the thalamus. However, this does not preclude other groups of mGlu receptors having effects on the CT EPSP in view of their localizations either in the cortex or in the thalamus, as has been demonstrated for the group II mGlu receptors and the GABAergic input from the NRT (Salt & Eaton, 1995). Clearly, further investigation into the effects of activating other groups of mGlu receptors on the CT input will be required.
The physiological impact of group III mGlu receptors on the CT input
Although the origin of the neurotransmitter acting on the group III mGlu receptors in the thalamus is at present unknown, the depression of the CT EPSP by the activation of these receptors indicates the potential for endogenous modulation and, therefore, the possibility of feedback/feedforward control of synaptic transmission at CT synapses. However, the lack of effect of MAP4 and LY341495 against the facilitated EPSPs evoked by the 10 Hz trains of five stimuli indicates that this modulation does not occur during short bursts of cortical input. It is highly likely that the activation of these mGlu receptors only occurs when the extracellular concentration of endogenous transmitter is high and so limits the impact of cortical activity on TC neurones during periods of more sustained or excessive excitatory input. Indeed, the intrathalamic injection of both L-AP4 and L-SOP has been shown to be protective against seizures induced by thalamic group I mGlu receptor activation (Tizzano et al. 1995), indicating that the activation of the group III mGlu receptors is probably important in the control of the CT input during the generation and propagation of seizures in thalamic structures. However, further work is required to demonstrate whether transmission at the CT synapse leads to this proposed profound modification of the postsynaptic response during such activities.
In conclusion, this first clear demonstration of a glutamate receptor-mediated modulation of the CT EPSP raises the possibility that activity-dependent modification of the CT input to TC neurones occurs during the high frequency components of physiological and/or pathological activities associated with this input, such as the fast oscillations occurring during arousal (Steriade et al. 1996) and the fast components of paroxysmal discharges (Timofeev et al. 1998). This depression of the CT EPSP could also contribute to the function of the CT input in feature-linked synchronization of thalamic activity (Sillito et al. 1994) or active information decoding in the thalamus (Ahissar et al. 1998), but this remains to be elucidated.
Acknowledgments
This work was supported by The Wellcome Trust. We wish to thank Dr A. E. Kingston (Eli Lilly) for supplying the LY341495, Professor J. C. Watkins (University of Bristol) for supplying the MAP4, and Ciba-Geigy/Novartis for the CGP35348 and CGP55845A.
References
- Ahissar E, Haidarliu S, Zacksenhouse M. Decoding temporally encoded sensory input by cortical oscillations and thalamic phase comparators. Proceedings of the National Academy of Sciences of the USA. 1997;94:11633–11638. doi: 10.1073/pnas.94.21.11633. [DOI] [PMC free article] [PubMed] [Google Scholar]
- Castro-Alamancos MA, Landisman CE, Connors BW. Mechanisms of facilitation at corticothalamic synapses in the ventrobasal thalamus. Society for Neuroscience Abstracts. 1997;23:230.5. [Google Scholar]
- Conn PJ, Pin J-P. Pharmacology and functions of metabotropic glutamate receptors. Annual Review of Pharmacology and Toxicology. 1997;37:205–237. doi: 10.1146/annurev.pharmtox.37.1.205. [DOI] [PubMed] [Google Scholar]
- Crunelli V, Kelly JS, Leresche N, Pirchio M. The ventral and dorsal lateral geniculate nucleus of the rat: intracellular recordings in vitro. The Journal of Physiology. 1987;384:587–601. doi: 10.1113/jphysiol.1987.sp016471. [DOI] [PMC free article] [PubMed] [Google Scholar]
- Crunelli V, Lightowler S, Pollard CE. A T-type Ca2+ current underlies low-threshold Ca2+ potentials in cells of the cat and rat lateral geniculate nucleus. The Journal of Physiology. 1989;413:543–561. doi: 10.1113/jphysiol.1989.sp017668. [DOI] [PMC free article] [PubMed] [Google Scholar]
- Eaton SA, Salt TE. Role of N-methyl-D-aspartate and metabotropic glutamate receptors in corticothalamic excitatory postsynaptic potentials in vivo. Neuroscience. 1996;73:1–5. doi: 10.1016/0306-4522(96)00123-6. [DOI] [PubMed] [Google Scholar]
- Erisir A, Van Horn SC, Bickford ME, Sherman SM. Immunocytochemistry and distribution of parabrachial terminals in the lateral geniculate nucleus of the cat: a comparison with corticogeniculate terminals. Journal of Comparative Neurology. 1997;337:535–549. [PubMed] [Google Scholar]
- Gereau RW, IV, Conn PJ. Multiple presynaptic metabotropic glutamate receptors modulate excitatory and inhibitory synaptic transmission in hippocampal area CA1. Journal of Neuroscience. 1995;15:6879–6889. doi: 10.1523/JNEUROSCI.15-10-06879.1995. [DOI] [PMC free article] [PubMed] [Google Scholar]
- Godwin DW, Van Horn SC, Erisir A, Sesma M, Romano C, Sherman SM. Ultrastructural localization suggests that retinal and cortical inputs access different metabotropic glutamate receptors in the lateral geniculate nucleus. Journal of Neuroscience. 1996;16:8181–8192. doi: 10.1523/JNEUROSCI.16-24-08181.1996. [DOI] [PMC free article] [PubMed] [Google Scholar]
- Jane DE, Thomas NK, Tse H-W, Watkins JC. Potent antagonists at the L-AP4- and (1S,3S)-ACPD-sensitive presynaptic metabotropic glutamate receptors in the neonatal rat spinal cord. Neuropharmacology. 1996;35:1029–1035. doi: 10.1016/s0028-3908(96)00048-2. [DOI] [PubMed] [Google Scholar]
- Johansen PA, Chase LA, Sinor AD, Koerner JF, Johnson RL, Robinson MB. Type 4a metabotropic glutamate receptors: identification of new potent agonists and differentiation from the L-(+)-2-amino-4-phosphonobutanoic acid-sensitive receptor in the lateral perforant pathway in rats. Molecular Pharmacology. 1995;48:140–149. [PubMed] [Google Scholar]
- Johansen PA, Robinson MB. Identification of 2-amino-2-methyl-4-phosphonobutanoic acid as an antagonist at the mGlu4a receptor. European Journal of Pharmacology. 1995;290:R1–3. doi: 10.1016/0922-4106(95)90032-2. [DOI] [PubMed] [Google Scholar]
- Jones EG. The Thalamus. New York: Plenum Press; 1985. [Google Scholar]
- Kahle JS, Cotman CW. Adenosine, L-AP4, and baclofen modulation of paired-pulse potentiation in the dendate gyrus: interstimulus interval-dependent pharmacology. Experimental Brain Research. 1993;94:97–104. doi: 10.1007/BF00230473. [DOI] [PubMed] [Google Scholar]
- Kingston AE, Ornstein PL, Wright RA, Johnson BG, Mayne NG, Burnett JP, Belagaje R, Wu S, Schoepp DD. LY341495 is a nanomolar potent and selective antagonist of group II metabotropic glutamate receptors. Neuropharmacology. 1998;37:1–12. doi: 10.1016/s0028-3908(97)00191-3. [DOI] [PubMed] [Google Scholar]
- Kinoshita A, Shigemoto R, Ohishi H, Van Der Putten H, Mizuno N. Immunohistochemical localization of metabotropic glutamate receptors, mGluR7a and mGluR7b, in the central nervous system of the adult rat and mouse: a light and electron microscope study. Journal of Comparative Neurology. 1998;393:332–352. [PubMed] [Google Scholar]
- Knöpfel T, Lukic S, Leonardt T, Flor PJ, Kuhn R, Gasparini F. Pharmacological characterization of MCCG and MAP4 at the mGluR1b, mGluR2 and mGluR4a human metabotropic glutamate receptor subtypes. Neuropharmacology. 1995;34:1099–1102. doi: 10.1016/0028-3908(95)00111-i. [DOI] [PubMed] [Google Scholar]
- Koerner JF, Johnson RL, Freund RK, Robinson MB, Crooks SL. Structure-function relationships for γ-substituted glutamate analogues on dentate granule cells. Brain Research. 1983;272:299–309. doi: 10.1016/0006-8993(83)90577-2. [DOI] [PubMed] [Google Scholar]
- McCormick DA, Pape H-C. Properties of a hyperpolarization-activated cation current and its role in rhythmic oscillation in thalamic relay neurones. The Journal of Physiology. 1990;431:291–318. doi: 10.1113/jphysiol.1990.sp018331. [DOI] [PMC free article] [PubMed] [Google Scholar]
- McCormick DA, Prince DA. Actions of acetylcholine in the guinea-pig and cat medial and lateral geniculate nuclei, in vitro. The Journal of Physiology. 1987;392:147–165. doi: 10.1113/jphysiol.1987.sp016774. [DOI] [PMC free article] [PubMed] [Google Scholar]
- McCormick DA, Von Krosigk M. Corticothalamic activation modulates thalamic firing through glutamate ‘metabotropic’ receptors. Proceedings of the National Academy of Sciences of the USA. 1992;89:2774–2778. doi: 10.1073/pnas.89.7.2774. [DOI] [PMC free article] [PubMed] [Google Scholar]
- Macek TA, Winder DG, Gereau RW, IV, Ladd CO, Conn PJ. Differential involvement of group II and group III mGluRs as autoreceptors at lateral and medial perforant path synapses. Journal of Neurophysiology. 1996;76:3798–3805. doi: 10.1152/jn.1996.76.6.3798. [DOI] [PubMed] [Google Scholar]
- Martin LJ, Blackstone CD, Huganir RL, Price DL. Cellular localization of a metabotropic glutamate receptor in rat brain. Neuron. 1992;9:259–270. doi: 10.1016/0896-6273(92)90165-a. [DOI] [PubMed] [Google Scholar]
- Ohishi H, Akazawa C, Shigemoto R, Nakanishi S, Mizuno N. Distributions of the mRNAs for L-2-amino-4-phosphonobutyrate-sensitive metabotropic glutamate receptors, mGluR4 and mGluR7, in the rat brain. Journal of Comparative Neurology. 1995;360:555–570. doi: 10.1002/cne.903600402. [DOI] [PubMed] [Google Scholar]
- Ohishi H, Shigemoto R, Nakanishi S, Mizuno N. Distribution of the messenger RNA for a metabotropic glutamate receptor, mGluR2, in the central nervous system of the rat. Neuroscience. 1993a;53:1009–1018. doi: 10.1016/0306-4522(93)90485-x. [DOI] [PubMed] [Google Scholar]
- Ohishi H, Shigemoto R, Nakanishi S, Mizuno N. Distribution of the mRNA for a metabotropic glutamate receptor (mGluR3) in the rat brain: an in situ hybridization study. Journal of Comparative Neurology. 1993b;335:252–266. doi: 10.1002/cne.903350209. [DOI] [PubMed] [Google Scholar]
- Okamoto N, Hori S, Akazawa C, Hayashi Y, Shigemoto R, Mizuno N, Nakanishi S. Molecular characterization of a new metabotropic glutamate receptor mGluR7 coupled to inhibitory cyclic AMP signal transduction. Journal of Biological Chemistry. 1994;269:1231–1236. [PubMed] [Google Scholar]
- Paulsen O, Heggelund P. Quantal properties of spontaneous EPSCs in neurones of the guinea-pig dorsal lateral geniculate nucleus. The Journal of Physiology. 1996;496:759–772. doi: 10.1113/jphysiol.1996.sp021725. [DOI] [PMC free article] [PubMed] [Google Scholar]
- Perkins KL, Wong RKS. Intracellular QX-314 blocks the hyperpolarization-activated inward current Iq in hippocampal CA1 pyramidal cells. Journal of Neurophysiology. 1995;73:911–915. doi: 10.1152/jn.1995.73.2.911. [DOI] [PubMed] [Google Scholar]
- Petralia RS, Wang Y-X, Niedzielski AS, Wenthold RJ. The metabotropic glutamate receptors, mGluR2 and mGluR3, show unique postsynaptic, presynaptic and glial localizations. Neuroscience. 1996;71:949–976. doi: 10.1016/0306-4522(95)00533-1. [DOI] [PubMed] [Google Scholar]
- Robson JA. The morphology of corticofugal axons to the dorsal lateral geniculate nucleus of the cat. Journal of Comparative Neurology. 1983;216:89–103. doi: 10.1002/cne.902160108. [DOI] [PubMed] [Google Scholar]
- Salt TE, Eaton SA. Excitatory action of the metabotropic excitatory amino acid receptor agonist, trans-(±)-1-amino-cyclopentane-1,3-dicarboxylate (t-ACPD), on rat thalamic neurones in vivo. European Journal of Neuroscience. 1991;3:1104–1111. doi: 10.1111/j.1460-9568.1991.tb00045.x. [DOI] [PubMed] [Google Scholar]
- Salt TE, Eaton SA. Distinct presynaptic metabotropic receptors for L-AP4 and CCG1 on GABAergic terminals: pharmacological evidence using novel α-methyl derivative mGluR antagonists, MAP4 and MCCG, in rat thalamus in vivo. Neuroscience. 1995;65:5–13. doi: 10.1016/0306-4522(94)00464-g. [DOI] [PubMed] [Google Scholar]
- Saugstad JA, Kinze JM, Shinohara MM, Segerson TP, Westbrook GL. Cloning and expression of rat metabotropic glutamate receptor 8 reveals distinct pharmacological profile. Molecular Pharmacology. 1997;51:119–125. doi: 10.1124/mol.51.1.119. [DOI] [PubMed] [Google Scholar]
- Scharfman HE, Lu S-M, Guido W, Adams PR, Sherman SM. N-Methyl-D-Aspartate (NMDA) receptors contribute to EPSPs of cat lateral geniculate neurons recorded in thalamic slices. Proceedings of the National Academy of Sciences of the USA. 1990;87:4548–4552. doi: 10.1073/pnas.87.12.4548. [DOI] [PMC free article] [PubMed] [Google Scholar]
- Shigemoto R, Kinoshita A, Wada E, Nomura S, Ohishi H, Takada M, Flor PJ, Neki A, Abe T, Nakanishi S, Mizuno N. Differential presynaptic location of metabotropic glutamate receptor subtypes in the rat hippocampus. Journal of Neuroscience. 1997;17:7503–7522. doi: 10.1523/JNEUROSCI.17-19-07503.1997. [DOI] [PMC free article] [PubMed] [Google Scholar]
- Sillito AM, Jones HE, Gerstein GL, West DC. Feature-linked synchronization of thalamic relay cell firing induced by feedback from the visual cortex. Nature. 1994;369:479–482. doi: 10.1038/369479a0. [DOI] [PubMed] [Google Scholar]
- Steriade M, Contreras D, Amzica F, Timofeev I. Synchronization of fast (30–40 Hz) spontaneous oscillations in intrathalamic and thalamocortical networks. Journal of Neuroscience. 1996;16:2788–2808. doi: 10.1523/JNEUROSCI.16-08-02788.1996. [DOI] [PMC free article] [PubMed] [Google Scholar]
- Talbot MJ, Sayer RJ. Intracellular QX-314 inhibits calcium currents in hippocampal CA1 pyramidal neurons. Journal of Neurophysiology. 1996;76:2120–2124. doi: 10.1152/jn.1996.76.3.2120. [DOI] [PubMed] [Google Scholar]
- Thomsen C, Kristensen P, Mulvihill E, Haldeman B, Suzdak PD. L-2-Amino-4-phosphonobutyrate (L-AP4) is an agonist at the type IV metabotropic glutamate receptor which is negatively coupled to adenylate cyclase. European Journal of Pharmacology. 1992;227:361–362. doi: 10.1016/0922-4106(92)90018-q. [DOI] [PubMed] [Google Scholar]
- Thomsen C, Suzdak PD. Serine-O-phosphate has affinity for type IV, but not type I, metabotropic glutamate receptor. NeuroReport. 1993;4:1099–1101. [PubMed] [Google Scholar]
- Timofeev I, Grenier F, Steriade M. Spike-wave complexes and fast components of cortically generated seizures. IV. Paroxysmal fast runs in cortical and thalamic neurons. Journal of Neurophysiology. 1998;80:1495–1513. doi: 10.1152/jn.1998.80.3.1495. [DOI] [PubMed] [Google Scholar]
- Tizzano JP, Griffey KI, Schoepp DD. Induction or protection of limbic seizures in mice by mGluR subtype selective agonists. Neuropharmacology. 1995;34:1063–1067. doi: 10.1016/0028-3908(95)00083-i. [DOI] [PubMed] [Google Scholar]
- Turner JP, Leresche N, Guyon A, Soltesz I, Crunelli V. Sensory input and burst firing output of thalamocortical cells: the role of NMDA and non-NMDA receptors. The Journal of Physiology. 1994;480:281–295. doi: 10.1113/jphysiol.1994.sp020359. [DOI] [PMC free article] [PubMed] [Google Scholar]
- Turner JP, Salt TE. Control of corticothalamic input to thalamocortical neurones in rat dLGN by group III metabotropic glutamate receptors in vitro. Society for Neuroscience Abstracts. 1997;23:708.06. [Google Scholar]
- Turner JP, Salt TE. Characterization of sensory and corticothalamic excitatory inputs to rat thalamocortical neurones in vitro. The Journal of Physiology. 1998;510:829–843. doi: 10.1111/j.1469-7793.1998.829bj.x. [DOI] [PMC free article] [PubMed] [Google Scholar]
- Turner JP, Salt TE. Control of corticothalamic synaptic transmission in the rat thalamus in vitro by group III metabotropic glutamate receptors. The Journal of Physiology. 1999;515.P:114P. doi: 10.1111/j.1469-7793.1999.0481m.x. [DOI] [PMC free article] [PubMed] [Google Scholar]
- Vidnyánszky Z, Görcs TJ, Négyessy L, Borostyánköi Z, Kuhn R, Knöpfel T, Hámori J. Immunocytochemical visualization of the mGluR1a metabotropic glutamate receptor at synapses of corticothalamic terminals originating from area 17 of the rat. European Journal of Neuroscience. 1996;8:1061–1071. doi: 10.1111/j.1460-9568.1996.tb01273.x. [DOI] [PubMed] [Google Scholar]
- Williams SR, Turner JP, Anderson CM, Crunelli V. Electrophysiological and morphological properties of interneurones in the rat dorsal lateral geniculate nucleus in vitro. The Journal of Physiology. 1996;490:129–147. doi: 10.1113/jphysiol.1996.sp021131. [DOI] [PMC free article] [PubMed] [Google Scholar]
- Wilson JR, Friedlander MJ, Sherman SM. Fine structural morphology of identified X- and Y-cells in the cat's lateral geniculate nucleus. Proceedings of the Royal Society. 1984;B 221:411–436. doi: 10.1098/rspb.1984.0042. [DOI] [PubMed] [Google Scholar]