

Abstract
Time-lapse diffusion-weighted magnetic resonance imaging (DWI) was used to detect and characterize complex waves of cortical spreading depression (CSD) evoked with KCl placed upon the suprasylvian gyrus of anaesthetized cats.
The time-lapse representations successfully demonstrated primary CSD waves that propagated with elliptical wavefronts selectively over the ipsilateral cerebral hemispheres with a velocity of 3.8 ± 0.70 mm min−1 (mean ± s.e.m. of 5 experiments).
In contrast, the succeeding secondary waves often remained within the originating gyrus, were slower (velocity 2.0 ± 0.18 mm min−1), more fragmented and varied in number.
Computed traces of the apparent diffusion coefficients (ADCs) showed negative deflections followed by monotonic decays (amplitudes: primary wave, -19.9 ± 2.8 %; subsequent waves, -13.6 ± 1.9 %; duration at half-maximal decay, 150-200 s) when determined from regions of interest (ROIs) through which both primary and succeeding CSD waves propagated.
The passage of both the primary and the succeeding waves often correlated with transient DC potential deflections recorded from the suprasylvian gyrus.
The detailed waveforms of the ADC and the T2*-weighted (blood oxygenation level-dependent: BOLD) traces showed a clear reciprocal correlation. These imaging features that reflect disturbances in cellular water balance agree closely with BOLD measurements that followed the propagation velocities of the first and subsequent CSD events. They also provide a close physiological correlate for clinical observations of cortical blood flow disturbances associated with human migraine.
Aura is experienced in 10 % of migraine patients who describe a classic ‘slow march’ of symptoms such as fortification spectra across the entire visual field, observations which have been associated with the electrophysiological phenomenon of cortical spreading depression (CSD). More common are less specific disturbances such as ‘flickering lights’, ‘spots in front of eyes’ or a ‘shimmering vision’ which again cover the full visual field. Such non-specific effects are seen in 25 % of patients (Lance, 1993). Lashley in 1941, before CSD was first described, inadvertently suggested such a possible physiological mechanism for migraine with aura in the visual cortex. Thus he gave the first piece of evidence that implicated the CSD, which was to be described later, by mapping the spread of his own visual scotoma across the field of vision and calculating that the visual cortex must have been compromised at ∼3 mm min−1 (Lashley, 1941; Milner, 1958).
In animal experiments, CSD describes a distinctive, wave-like phenomenon which propagates across the cerebral cortex with a conduction velocity between 2 and 5 mm min−1 (Leao, 1944; Bures et al. 1984; Lauritzen, 1994; Parsons, 1998). CSD produces a prolonged (1-2 min) inhibition of electrical activity that is accompanied by a local loss of neuronal function (Sugaya et al. 1975; Back et al. 1994; Wolf et al. 1996). As indicated above, the CSD phenomenon has been implicated in important human clinical conditions such as migraine (Welch et al. 1993; Flippen & Welch, 1997), head injury (Mayevsky et al. 1996) and lesion expansion in stroke (Hossmann, 1996; Strong et al. 1996). However, although well known in experimental models, CSD has proven difficult to detect clinically (Cutrer et al. 1988) and its role in disease remains controversial. The occurrence of CSD is accompanied by disturbances in transmembrane ion balances. As this alters the distribution of cerebral intra- and extracellular water thereby reducing cerebral water diffusibility, such changes should be detectable using diffusion-weighted magnetic resonance imaging (DWI). Currently DWI reports of CSD (Gardner Medwin et al. 1994; Latour et al. 1994; Hasegawa et al. 1995; de Crespigny et al. 1998) are limited to the rat telencephalon which is undifferentiated compared with gyrencephalic species (e.g. cat, human) and differs in CSD biology (Marshall, 1959): thus inhalational anaesthetics inhibit CSD initiation in the cat, but are used routinely in the rat (Piper & Lambert, 1996). This study accordingly reports for the first time, the detection and characterization, using time-lapse DWI, of complex CSD waves evoked with KCl in the cat. First, we have successfully detected primary and secondary CSD waves using such imaging methods. Secondly we have measured individual ADC waveforms, size and time course from individual MRI regions of interest through which such waves have propagated. Finally, we have detected associated changes in vascular responsivity from concurrent BOLD images.
METHODS
Surgical preparation
This work was ethically approved by the SmithKline Beecham Procedures Review Panel and complied with all aspects of the Animals (Scientific Procedures) Act 1986. Fasted female cats (2.5-3.5 kg) were anaesthetized with 4-5 % halothane and maintained with α-chloralose (100-160 mg kg−1i.v.) without recovery, and eventually killed at the end of each experiment under Schedule I guidelines. Ventilation was mechanical (20-24 ml at 30 strokes min−1); core temperature was maintained at 37°C with a homeothermic blanket; femoral vein and artery cannulation allowed anaesthetic administration and blood pressure and blood gas analysis was performed to ensure physiological stability throughout each experiment.
The initial studies sought to characterize the anatomy and gyrencephalic nature of the cat brain, in order to define appropriate imaging planes and involved the acquisition of 3-dimensional (3-D) data sets. The protocol used for studying CSD made use of the derived 3-D brain structure, but otherwise was modified from previous studies (Read et al. 1997) as follows. Craniotomies were performed in both orbital sinuses and over the suprasylvian gyrus: the sinuses were filled with agar (2 % in sterile saline) to reduce image susceptibility effects; craniotomy (centre: 5 mm posterior, 5 mm lateral to bregma) and durectomy exposed the surface of the left suprasylvian gyrus for KCl application and a further 4-5 mm posteriorly, for a Ag-AgCl electrode to record surface DC potentials (with scalp as reference). A plastic-coated silver-wire surface coil (diameter 4 cm) was bonded symmetrically to the skull using cyanoacrylate and Silastic medical adhesive; by forming a well flooded with mineral oil, dehydration of the cortical surface and dispersion of the KCl was prevented. Solid KCl was carefully applied to the brain surface for the experimental duration, a technique shown to produce reliable CSD initiation (Read et al. 1997). Physiological variables were maintained stable throughout the experiment: blood pressure (systolic/diastolic) 137/91 ± 10/8.9 mmHg (mean ±s.e.m.), pH 7.36, PCO2 34.6 ± 0.3 mmHg, PO2 121 ± 0.7 mmHg.
Image acquisition
Images were acquired using a whole body, 2.0 T superconducting magnet (Oxford Magnet Technology), driven by a MSL 400 console running Tomikon imaging software (version 890601) (Bruker Medizin Technik GmbH). The gradient set was 20.5 cm diameter of Maxwell-Golay design. For the anatomical studies we used a 10 cm diameter quadrature bird cage probe in both transmit and receive mode, in which the head of the animal was securely positioned. High-resolution 3-D anatomical images encompassing the entire brain were acquired using a 3-D spoiled Grass (3-D SPGR) MRI imaging sequence with a 8 cm isotropic field of view (FoV), image matrix: 256 × 256 × 128, repetition time (TR) 35 ms, and echo time (TE) 7.5 ms.
In the CSD studies we used the surface coil for signal acquisition (as described above), and a sine-space resonator for excitation. Introducing the use of disposable surface coils ensured a good filling factor and hence a good signal-to-noise ratio. The resonator was 14.0 cm in diameter and incorporated a purpose-built head holder and animal tray. The head was centred in the resonator inside the gradient set within the magnet bore: positioning was checked using fast gradient echo images (TR/TE 100/10 ms with flip angle 60 deg, 128 × 256 matrix, FoV 10 cm). Horizontal high-resolution anatomical images through both suprasylvian and marginal gyri were then acquired (Gradient echo: TR/TE 200/11 ms, flip angle 90 deg, FoV 5 cm, slice thickness 3 mm, matrix 256 × 256). To study the temporal nature of CSD, time-lapse diffusion weighted images (DWI) were acquired repeatedly in a fixed sequence i.e. in loops, before and after KCl application. The DWI were horizontal, single shot spin echo, echo planar images (TR/TE 7000/72 ms) using a 64 × 64 acquisition matrix symmetrically zero-filled to yield 128 × 128 images. Initial experiments acquired images with alternate low (low-b) and high (high-b) diffusion factors (Xing et al. 1997) (referred to as ‘DWEP’, with b values of 100 and 850 s mm−2, respectively, δ= 10 ms, Δ= 39 ms), a single loop taking 14 s to complete. When blood oxygen level-dependent (BOLD) imaging was incorporated (referred to as ‘DWEPBOLD’) two more images per loop were added: a symmetric T2-weighted (with the origin of k-space acquired at the TE), and an asymmetric T2-weighted (with the origin of k-space acquired at an offset at 12 ms before the TE). The BOLD addition extended the loop acquisition time to 28 s. Data acquisition was interrupted for accurate KCl deposition without moving the animal: the delay between KCl deposition and data collection was ∼50 s. Prior to each experiment phantom data were collected for image quality assurance and showed a stable signal commensurate with the image signal-to-noise ratio. DWEPBOLD image loops were continuously acquired for 20 min pre-KCl application, and up to 70 min post-KCl.
Image processing
All images were reconstructed using a Pentium II processor GNU/ Debian Linux version 1.3 and in-house reconstruction software. 3-D data sets were volume rendered using Volren software (Silicon Graphics, CA, USA).
From the DWEP and DWEPBOLD data sets, the high-b images were extracted first of all, and concatenated into a time-lapse series for replaying as a continuous loop. This process most easily visualized the CSD changes. For quantitative analysis, regions of interest (ROIs) were then selected from the high-b images using Interactive Data Language software (IDL Research Systems). To reveal the changes in diffusion a reference high-b image was taken immediately post-KCl (without a CSD) and subtracted from the remaining post-KCl high-b images. The resulting data were median-filtered and thresholded to isolate hyperintense areas representing reduced diffusion; to illustrate CSD passage, the hyperintense areas were colour coded according to the magnitude of the change and superimposed onto a reference image. Pixel intensity values for the ROIs were exported to Excel spreadsheets (Microsoft Inc. Windows NT version 4) where the mean pixel intensity for each ROI was plotted against time. Plots were smoothed using a three-point rolling mean. Similarly, BOLD changes were characterized using the same ROI.
RESULTS
Anatomical characterization of cortical gyri for the selection of imaging planes
Our initial experiments obtained 3-D volume-rendered representations of the feline brain in order to derive imaging planes appropriate for the demonstration and characterization of CSD events. Figure 1 clearly demonstrates the gyrencephalic nature of the feline cortex and identifies the ectosylvian, suprasylvian and marginal gyri. Figure 1A displays the volume-rendered brain in dorsal view; Fig. 1B displays the relevant structures in a transverse section; taken together, these panels demonstrate that the suprasylvian and marginal gyri are relatively prominent, superficial, of simple geometry and continuous along the length of the cortex. These features make them most appropriate for the study of a propagating physiological phenomenon, as well as being easier to image. The dashed box in Fig. 1B indicates the relatively straightforward selection of a horizontal imaging slice. Note that the slice runs through the superficial cortex of the suprasylvian gyrus, though it occupies a slightly deeper plane within the marginal gyrus. Previous reports in rats indicate that CSD affects the superficial layers of cortex (Richter & Lehmenkuhler, 1993). In contrast the ectosylvian gyrus occupies a lateral position, is complex in geometry, small, and would require an oblique imaging plane that is difficult to optimize. Figure 1C displays the relationships of the craniotomy and electrode placement on a reconstructed cranium to the surface projections of the marginal, suprasylvian and ectosylvian gyri: the relatively remote sites of the electrode recording ensured a local field uniformity within the selected MRI imaging planes.
Figure 1. 3-D and transverse images of the feline brain in vivo.
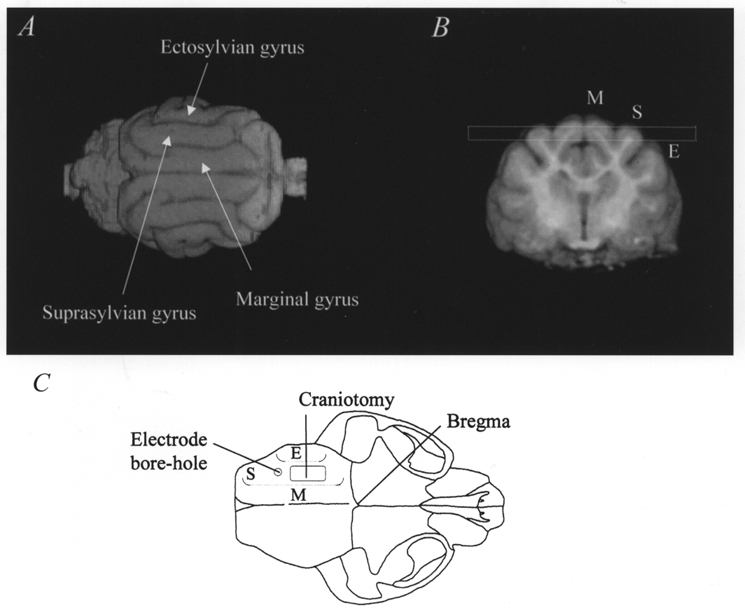
A shows a dorsal view of a volume-rendered reconstruction of the feline brain, in conjunction with a transverse image (B) showing the marginal (M), suprasylvian (S) and ectosylvian (E) gyri. The dashed box in B indicates the selection of the horizontal imaging slice (3 mm slice thickness) used for the DWEP and DWEPBOLD experiments described in the text. C reconstructs a dorsal view of the feline skull to indicate the surgical positions of the craniotomy and the electrode bore hole. Dotted lines indicate the relative positions of the three gyri.
CSD propagation across the surface of the cat brain in vivo
In all five studies, high-b movies revealed, within 1-2 min post-KCl, the progressive spread of a complex, hyperintense wavefront containing regions of reduced diffusibility crossing both the suprasylvian and marginal gyri that originated from the site of KCl deposition. Passage of the wave coincided with a transiently decreased DC potential (∼6 mV), as measured with a Ag-AgCl electrode placed 4-6 mm away from the KCl crystals on the suprasylvian gyrus surface. In most studies further waves were also observed (Table 1): these varied in number (between 1 and 11) over the recording period of up to 60 min. Such subsequent events appeared more fragmentary, were much less widespread than the first wave and were often but not always confined to the suprasylvian gyrus. When the subsequent waves were observed to pass the site of the electrode, a coincident decrease in DC potential was recorded confirming the passage of a spreading depression event.
Table 1.
Primary and secondary CSD wave characteristics
| Experiment number | 1 | 2 | 3 | 4 | 5 | Mean ± S.E.M. | |
|---|---|---|---|---|---|---|---|
| Wave number | SSG | 3 | 2 | 1 | 6 | 11 | – |
| MG | 2 | 1 | 0 | 5 | 7 | – | |
| Velocity (mm min−1) | Primary | 2.8 | 2.2 | 5.9 | 5.0 | 3.2 | 3.8 ± 0.70 |
| Secondary | 2.1 | 2.4 | – | 1.6 | 1.7 | 2.0 ± 0.18 * | |
| ADC decrease (%) | Primary | 19.2 | 18.5 | 21.0 | 29.2 | 11.8 | 19.9 ± 2.8 |
| Secondary | 11.2 | 12.4 | – | 19.2 | 11.7 | 13.6 ± 1.9 |
Number and spread of CSD waves were determined by inspection of the high-b movies. SSG, suprasylvian gyri; MG, marginal gyri.
Secondary velocity < primary velocity (P < 0.05, Student's t test).
Waves were not observed in high-b movies either before KCl deposition or in the contralateral gyrus following the application of KCl. Similarly, inspection of the low-b movie, less sensitive to diffusion, revealed no waves, either pre-KCl or in either hemisphere post-KCl, although a region round the site of KCl deposition was observed to become gradually hyperintense, indicating oedema that was probably reactive to the presence of the KCl throughout the experiment. Figure 2 is a representative illustration of the propagation of an elliptical wavefront of reduced ADC, moving over the cortex away from the site of KCl application. The top left panel (Fig. 2a) displays the control, horizontal gradient-echo anatomical image depicting the suprasylvian and marginal gyri. The coloured overlays in the remaining images were obtained by subtracting a baseline image from the high-b images from the DWEP sequence and transforming the signal difference into a percentage of change (blue 5 %, red 30 %). The frames display changes at 10 s intervals starting about 50 s after KCl application (Fig. 2b). They display elliptical regions of reduced diffusion travelling away from the KCl application site with velocity 3.2 ± 0.1 mm min−1 (mean ±s.e.m. of 5 measurements in the experiment illustrated). Over the first 11 frames (Fig. 2b-l), the wave travels both rostrally and caudally along the suprasylvian gyrus; when it reaches the caudal junction of the two gyri (frames 12-18: Fig. 2m-s) it appears to pass into the marginal gyrus (frames 19-23: Fig. 2t-x); likewise, rostrally, the wave passes first (frames 17-23; Fig. 2r-x)into the ectosylvian gyrus, where it dissipates (frames 21-23; Fig. 2v-x), and then into the marginal gyrus (frames 19-23; Fig. 2t-x)). Waves were never detected in the contralateral hemisphere.
Figure 2. CSD propagation across the surface of the cat brain in vivo.
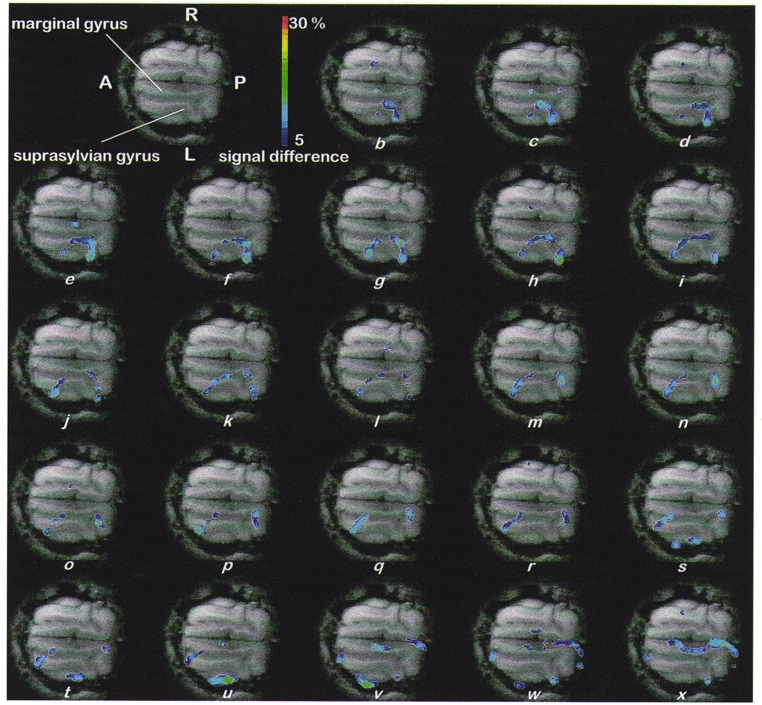
a (top, left), control, horizontal, gradient-echo anatomical image depicting the suprasylvian and marginal gyri. Remaining images (b-x): coloured overlays, shown at 10 s intervals starting about 50 s after KCl application, represent elliptical regions of reduced diffusion travelling away from the KCl application site with velocity 3.2 ± 0.1 mm min−1 (mean ±s.e.m. of 5 measurements). Over the first 11 frames (b-l) the wave travels both rostrally and caudally along the suprasylvian gyrus; when it reaches the caudal junction of the two gyri (frames 12-18; m-s) it appears to pass into the marginal gyrus (frames 19-23; t-x); likewise, rostrally, the wave passes first (frames 17-23; r-x) into the ectosylvian gyrus where it dissipates (frames 21-23; v-x) and then into the marginal gyrus (frames 19-23; t-x). Waves were never detected in the contralateral hemisphere. Abbreviations: A, anterior; P, posterior; R, right; L, left; overlays were obtained by subtracting a baseline image from the high-b images obtained in the DWEP sequence and transforming the signal difference into a percentage change (blue 5 %, red 30 %). Scale bar, 15 mm.
Thus the spread of CSD was clearly confined to the hemisphere in which it was initiated, although it was seen to spread between the suprasylvian and marginal gyri. To analyse these waves further, a baseline image, acquired immediately after KCl deposition, again was subtracted from later high-b images. Considering the five experiments together, the velocity of the first wave was 3.8 ± 0.70 mm min−1 (mean ±s.e.m. of 5 experiments; Table 1); subsequent waves travelled at the slower velocity of 2.0 ± 0.18 mm min−1 (P < 0.05, Student's t test). These velocities agree with classical clinical observations of visual cortical disturbances associated with migraine propagation (Lashley, 1941; Lance, 1993) and correlate well with previous observations using laser Doppler velocimetry, in which the velocity of the first and subsequent events differed (Kaube & Goadsby, 1994).
Changes in the apparent diffusion coefficient (ADC) with time
Maps of the ADC values were then derived from the low-b and high-b images obtained from our DWEPBOLD sequence. Unlike DWI which contain information from T2 as well as diffusion, ADC maps provide a direct measure of cerebral water diffusion. Figure 3 shows the four regions of interest, of increasing size encompassing the elliptical wave that were selected for the analysis of ADC signal changes pre- and post-application of KCl in addition to post-KCl BOLD signal changes (see below). These cover both the marginal and suprasylvian gyri, ipsilateral to the point of stimulus application, i.e. the ipsilateral cortical areas in which waves could be observed. These overlays were created using a similar method as used in Fig. 2, by subtracting a baseline image from a series of high-b images acquired post-application of KCl. However, in this figure all areas of the image where a 5 % or greater change in signal intensity occurred were uniformly marked, as opposed to using a graduated colour scale. The coloured overlays in Fig. 3A-D indicate the four ROIs that were selected for the analysis of ADC and BOLD signal changes over time, both before KCl application and during the passage of CSD across the suprasylvian and marginal gyri of the cat brain. These overlays were created by subtracting a baseline image from a stack of high-b images obtained using the DWEPBOLD sequence (post-application of KCl) and marking those areas where a 5 % or greater change occurred. Such overlays (Fig. 3A-D) were obtained at the time points at 0.5, 1.0, 1.4 and 5.1 min, respectively. Once selected, the regions of interest were kept constant in order to follow the physiological changes over time in those selected regions following the application of stimulus.
Figure 3. Regions of interest (ROI) selected for the analysis of the cerebral apparent diffusion coefficient (ADC) and blood oxygenation level-dependent (BOLD) signal changes.
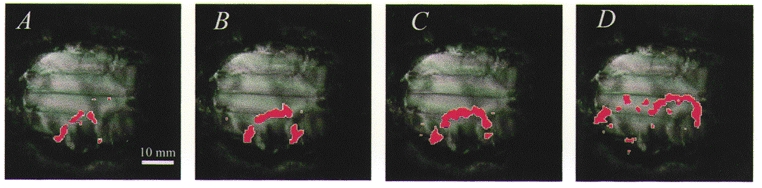
The coloured overlays in frames A-D indicate the ROIs selected for the analysis of ADC and BOLD signal changes before KCl application and during the passage of CSD across the suprasylvian and marginal gyri of the cat brain. Overlays were created by subtracting a baseline image from a stack of high-b images obtained using the DWEPBOLD sequence (post-application of KCl) and marking those areas where a 5 % or greater change occurred. Overlays (A-D) represent time points at 0.5, 1.0, 1.4 and 5.1 min, respectively.
Figure 4 shows graphs of ADC value with time as calculated during an ∼20 min control period before the application of KCl, using the four ROIs depicted in Fig. 3. Clearly, there are no apparent trends in these control graphs, with the traces being quite stable over time. The baseline (pre-KCl) ADC was (810 ± 22) × 10−6 mm2 s−1, in agreement with previous findings (Fischer et al. 1995). Figure 5 displays representative graphs showing transient changes in ADC over time following the application of KCl through the four ROIs (A-D). The initial wave of decreased ADC, occurring within 2 min of KCl application, was the most sizeable (decrease 19.9 ± 2.8 %; Table 1). Figure 5A-D and Table 1 show that subsequent waves were smaller, their mean ADC decrease being 13.6 ± 1.9 %. Since the subsequent waves were more fragmentary, covered less of the cortex and were also significantly slower, the secondary waves appear either intrinsically less energetic or better damped by the cortical tissue than the primary wave. Considering that the KCl stimulus was designed to be the same for all similar measurements, the variation in wave number and spread between animals may also indicate that animals intrinsically vary in susceptibility to CSD wave propagation. These data suggest that propagation of secondary events may be altered by intrinsic mechanisms within each animal.
Figure 4. Changes in the ADC with time during a control period before KCl application.
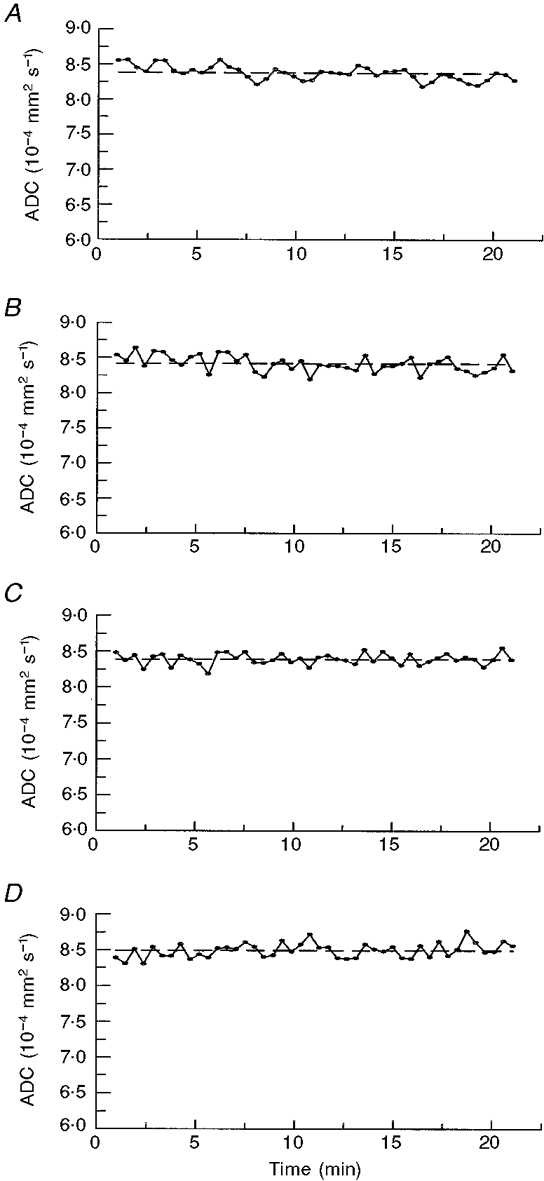
A-D, average ADC values over time were calculated for an ≈20 min pre-KCl application control period using the ROIs identified in Fig. 3. The average ADC value for the control period is indicated by the horizontal dashed line. Mean ADC values (±s.d.) for the 4 ROIs (Fig. 3A-D) are 8.38 × 10⁻⁴± 1.23 × 10⁻⁵, 8.42 × 10⁻⁴± 1.13 × 10⁻⁵, 8.39 × 10⁻⁴± 7.86 × 10⁻⁶ and 8.49 × 10⁻⁴± 1.22 × 10⁻⁵ mm2 s−1, respectively; the s.d. accounts, respectively, for 1.5, 1.3, 0.9 and 1.4 % of the ADC values in the unstimulated brain.
Figure 5. Changes in the ADC with time after KCl application.
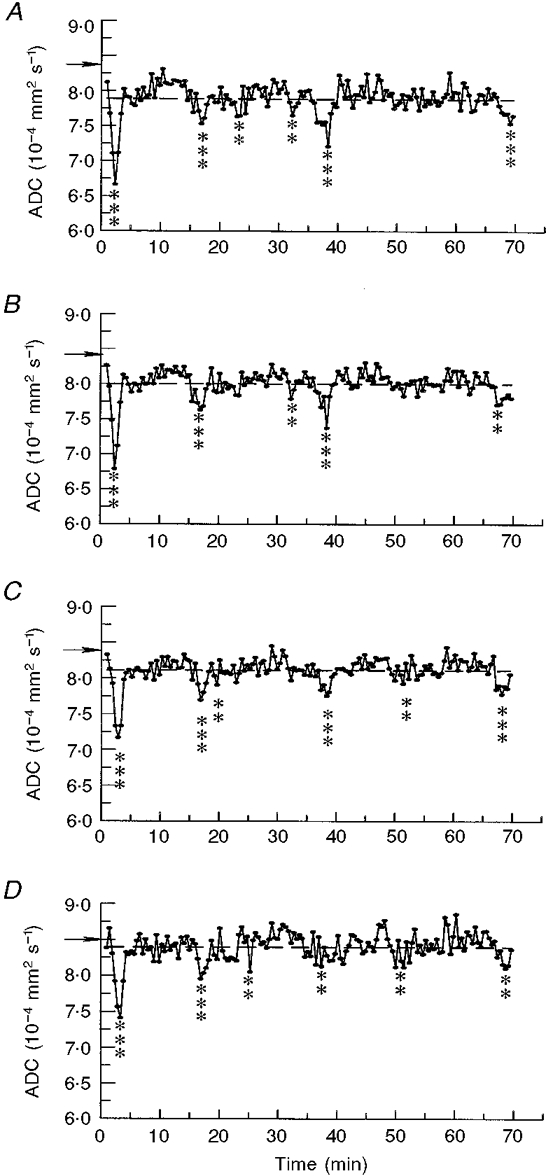
A-D, average ADC values were calculated from the 4 ROIs shown in Fig. 3A-D. Asterisks indicate ADC values significantly decreased from the mean of all time points (indicated by the horizontal dashed line) (**≥ 2 s.d.s, ***≥ 3 s.d.s); ADC decreases coincided with negative DC potential deflections indicating CSD passage; horizontal arrows indicate reference ADC values from the same areas before KCl application.
Correlations between apparent diffusion coefficient, blood oxygen level-dependent (BOLD) and DC potential changes
The DC potential trace (Fig. 6a), which provides the classic indicator of CSD passage, shows negative deflections of variable magnitude which frequently coincide with the decrease in ADC (Fig. 6c). In total, 11 waves could be distinguished in the high-b movie in the experiment illustrated (Fig. 2). Trace c in Fig. 6 shows ADC data from one ROI (ROI in Fig. 3C; trace of ADC in Fig. 5C), smoothed to show more clearly the negative deflections caused by CSD passage. Each event appeared to last 150-200 s when measured across the full width at half-maximum decrease. As both DC and ADC values were measured at separate ROIs (see Fig. 1C) changes in these parameters were offset in time, or diminished, compared with the ADC decreases in Fig. 6c. It is of particular interest that the number of DC potential and ADC deflections is less than the number of waves observed in the high-b movie (Table 1) because the movie covers the whole of the cortical surface, whereas the ROIs are necessarily restricted in their placement. This demonstrates that care should be taken when using restricted ROIs for detection and assessment of the wave phenomenon since they have widespread spatial and temporal characteristics.
Figure 6. Correlations between DC potential, ADC and BOLD changes.
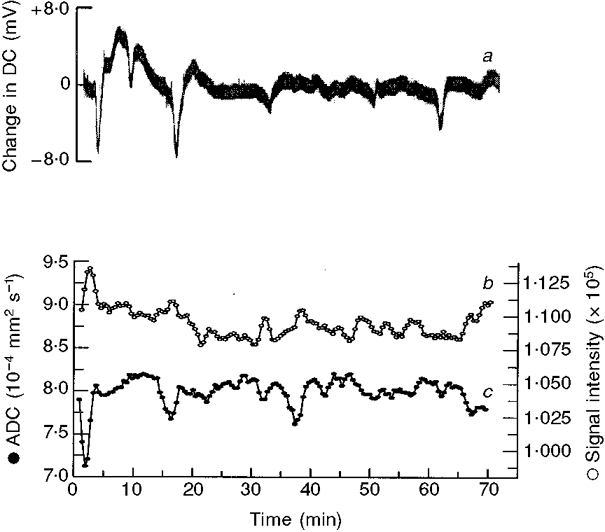
Changes in the DC potential (a) recorded at the brain surface following application of KCl; variation in the apparent diffusion coefficient (ADC; c) and the BOLD signal measuring haemoglobin oxygenation (b), within a single ROI. Comparison of the ADC and BOLD signals demonstrates an inverse correlation and good temporal superposition. ADC and BOLD traces (c and b) were subject to a 3-point running-mean smoothing procedure to improve definition and show that BOLD activation (increased signal intensity) occurs slightly later than ADC decreases.
Uniquely in our experiments, in contrast to studies already published (Gardner Medwin et al. 1994; Rother et al. 1996), we have interleaved the acquisition of ADC and T2*-weighted images. The contrast of the T2* images is dependent upon changes in blood oxygenation level (BOLD), as a result of vascular changes (van Zijl et al. 1998). Vascular changes seen in migraine coincide with the symptomatology and are thought to follow a slowly propagating, extinguishable pattern (Leao, 1944; Lance, 1993). Evidence suggests that the advancing wave of neuronal depolarization causes activation of perivascular nerves, a release of vasodilatory neurotransmitters and a spreading wave of disturbed vascular function (Moskowitz & Macfarlane, 1993; Weiller et al. 1995; Parsons et al. 1996). In trace c in Fig. 6 smoothed ADC data are compared with the corresponding BOLD data (Fig. 6b) for the same ROI and the contemporaneous DC changes (Fig. 6a). Traces b and c in Fig. 6 show that there was a clear reciprocal correlation between the detailed wave forms shown by the ADC and BOLD traces, as previously reported (Zhang et al. 1994; Wolf et al. 1996). Transient BOLD activations were small (< 5 % change) and probably indicate reflex vascular arterialization and/or reduced oxygen extraction. Like the first ADC wave, the first BOLD ‘wave’ was the largest (increase of 4.9 %). The subsequent BOLD waves were more difficult to quantify because the BOLD deflections were then much smaller.
DISCUSSION
The present experiments represent the first report in the literature of the production and propagation of waves of cortical spreading depression as measured by diffusion-weighed and blood oxygenation level-dependent magnetic resonance imaging (DW and BOLD MRI) in cat cerebral cortex. Both the feline and human cerebral cortex share a characteristic gyrencephalic anatomy. Accordingly, the results demonstrate that gyrencephalic brain types are capable of generating such ADC and BOLD changes related to CSD. In contrast, other (rodent) brain systems in which this phenomenon has been demonstrated with MRI have not been of the gyrencephalic type, making extrapolations from rodent experimental to human clinical conditions such as migraine much more difficult.
The evidence is that CSD is readily elicited in lissencephalic (e.g. rodent) brain but not in more complex, gyrencephalic brains (Marshall, 1959), including man (Chopp, 1996). The reasons for this difference are presently unclear but a glial role seems likely. Although both glial cells and neurones are active during CSD (Higashida et al. 1974), it is glia rather than neurones that propagate events: thus tetrodotoxin, the neuronal Na+-channel inhibitor and transmission blocker, fails to prevent CSD propagation (Ramos & de la Cerda, 1974; Sugaya et al. 1975); the CSD propagation velocity is in any case considerably less than neuronal transmission rates. Glia are responsible for the extracellular clearance of both glutamate and K+, and protect against CSD (Szerb, 1991), but it appears that high extracellular K+, not the excitatory neurotransmitter glutamate, propagates CSD (Obrenovitch & Zilkha, 1995), suggesting a transient glial incapacity. Possibly K+ release predominantly accounts for the transient cerebral swelling during CSD, since raised extracellular K+ appears to affect astroglia more than neurones (Hertz, 1981). A clear species difference in CSD propagation is revealed by halothane, an inhalational anaesthetic of choice for rodent studies which inhibits CSD in the gyrencephalic feline brain (Saito et al. 1995; Piper & Lambert, 1996): halothane is known to strongly uncouple astrocyte gap junctions (Mantz et al. 1993), suggesting this functionality is more important for CSD propagation in gyrencephalic species. Furthermore, the ratio of cortical glial cells to neurones is proportional to brain size (Tower & Young, 1973), and anatomically the cortical layers are well-differentiated into grey and white matter in cat and man, unlike rodents, and it is the superficial grey matter that is important for CSD propagation (Leao & Morison, 1945; Ochs & Hunt, 1960). Finally, glia are increasingly recognised to directly influence neuronal function (Nedergaard, 1994; Kaplan et al. 1997; Pfrieger & Barres, 1997) through specific biochemical mechanisms (Yuan & Ganetzky, 1999), but whether such functionality differs between lissencephalic and gyrencephalic brains is not known.
For all these reasons it is most appropriate to study CSD in gyrencephalic species if insight into the human condition is being sought. In the present work we have shown that CSD can be classified as primary and secondary, and that secondary waves are indeed restricted: in terms of ADC decrease, velocity of propagation and, anatomically, often to the originating gyrus. It is tempting to consider that such properties may be true even more so of CSD in man, a species with a larger brain even more complexly folded, and that the failure of detection in man is primarily one of technique: that CSDs are limited in spread by the complexly gyrate nature of the human brain. Their detection then becomes a question of knowing where to look, a problem simplified if a large portion of the cortical surface can be investigated simultaneously, as we showed here in the cat with a non-invasive technique of direct relevance to clinical studies.
Our studies entailed the introduction of a number of specific experimental measures and techniques. Firstly, a series of anatomical studies were needed to establish and characterize the gyrate nature of the feline cortex. This formed the basis for our choice of imaging planes and regions of interest. We established that the marginal and suprasylvian gyri would be amenable to MRI study. They were prominent, had simple anatomy and were surgically accessible. They could be examined using an easily defined horizontal imaging plane that would run through the superficial layers of these cortical structures concerned. In contrast, the anatomy of the ectosylvian gyrus made it an unsuitable candidate for imaging. The CSD phenomena that we examined accordingly covered the following anatomical areas. They were initiated by a stimulus that was applied to the suprasylvian gyrus; we then followed the spread of the consequent CSD waves through the suprasylvian gyrus itself, i.e. on the same gyrus as the point of application of the stimulus. We could also follow the spread of the CSD wave through the marginal gyrus, i.e. across a sulcus, and then onto the gyrus adjacent to the point of application of the stimulus.
Secondly, a number of specific experimental measures were required for such a successful MRI study of CSDs in an anaesthetized cat preparation. For example, there were significant technical problems associated with delivering the stimulus without disturbing the preparation when it was within the bore of the magnet. Furthermore, it was essential to adopt a strong stimulus in order to determine whether the CSD phenomenon took place at all, and to ascertain whether additionally we could observe secondary as well as primary waves. These experimental difficulties of combining a major physiological experiment with a demanding physical technique constrained our initial choice of stimulus. Nevertheless we continued to use the stimulus accepted in the literature based on KCl application.
Thirdly, our data acquisition procedure involved implementation of a new, more rapid two-point method of ADC determination that could be combined with BOLD signal estimations (Xing et al. 1997). In any case, as indicated above, the images were not obtained in cross section but through a tangential horizontal imaging plane made across curved gyral surfaces. This made it possible to follow ADC waves associated with CSD over the gyral surfaces of feline brain for the first time. However, our planes of imaging did not include the sulci; consequently it was not possible to follow the details of wave propagation through these areas.
The resulting CSD changes reflect a dynamic process varying over both time and space. Accordingly, they were most easily visualized when we concatenated the image frames into a time series, and viewed them as a continuous loop on a video screen in rapid succession, instead of only employing a static frame-by-frame analysis.
Our studies have provided the first demonstration of the propagation of CSD waves in a gyrencephalic species using diffusion-weighted with T2*-weighted time-lapse MRI. They demonstrated a number of characteristic features. Firstly, we unambiguously detected successive waves of propagating change in cortical ADC and BOLD following a KCl stimulus, in five anaesthetized cats. Secondly, the ADC changes were ∼20 %, confined to a single hemisphere and were most common in the gyrus where the activity was initiated. Although large ADC decreases (∼35-50 % (Latour et al. 1994)) are associated with cerebral ischaemia due to the loss of metabolically dependent transmembrane osmotic balance, the average ADC changes observed here are smaller. Thirdly, their propagation velocity and ADC recovery were rapid in these experiments. Finally, we have additionally characterized the geometrical features of the propagated wave, in particular its spread or otherwise across specific sulci and the midline. Thus these observations indicated that inhibitory boundaries exist which limit the spread of CSD activity in the gyrencephalic brain.
Both the geometrical features and the velocity shown by the ADC waves offer two important neurophysiological correlates for the extensiveness and rate of development of the specific deficits that are associated with migraine. Thus the waves propagated with velocities that agree with classical clinical observations of visual cortical disturbances associated with migraine propagation (Lashley, 1941; Lance, 1993). They also correlate well with previous observations using laser Doppler velocimetry, in which the velocity of the first and subsequent events differed (Kaube & Goadsby, 1994). Finally, the correlation between the DC and ADC changes associate abnormalities of water balance between intra- and extracellular fluid compartments with the activity changes associated with CSD.
Continuous periods of recurrent CSD activity are thought to contribute to neuronal damage in various human neuropathological conditions such as stroke, focal ischaemia (Iijima et al. 1992) and brain injury: they disrupt transmembrane ionic distributions resulting in acidosis, enhanced energy demand and neurotransmitter release, particularly of glutamate (Obrenovitch et al. 1995). During CSD the neurones are unable to elicit synaptic firing except at the beginning of the depolarization when some cells may produce rapid bursts of impulses. Membrane potential drifts slowly at first but accelerates as the cells become maximally depolarized, usually up to 4 s after initiation. Providing there is adequate supply of metabolic substrates the cells will repolarize after 1-2 min, via Na+-K+-ATPase activity. Studies of the cerebral Na+-K+-ATPase have shown that activity in glial cells far exceeds that in neurones and therefore it is likely that elevated levels of extracellular K+ are principally controlled by the glia (Ballanyi et al. 1987). The supply of metabolic substrates to enable repolarization is provided by the large dilatation of pial blood vessels and an accompanied increase in local cerebral blood flow (Lauritzen, 1987). Subsequently, a long-lasting reduction of CBS may occur, reminescent of that seen in migraine (Lauritzen, 1984). However, in instances of metabolic limitation, e.g. cerebral ischaemia, re-establishment of ionic homeostasis may not be possible (Back et al. 1994).
It has also been suggested that CSDs constitute the primary event in the neurological disturbances associated with the development of a migraine with aura attack (Lauritzen, 1994). However, there are no reports in the literature describing CSD wave propagation using DW-MRI in gyrencephalic species whether experimentally in cat or clinically in man. The present findings now establish the required conditions for such a characterization. Studies of CSD in the human brain might examine the occipital cortex as this is located well away from the orbital sinuses, adopt tangential imaging planes, use surface coils and stabilize the subject's head in the magnet. The Methods section additionally lists remaining conditions required for successful CSD imaging.
Acknowledgments
This research was supported by SmithKline Beecham Pharmaceuticals (M. F. J., M. I. S., A. A. P., K. H. J. B.), the BBSRC (N. G. P., C. L.-H. H., T. A. C., G. C. H.), the University of Cambridge (J. M. S.) and the Herchel Smith endowment (L. D. H., T. A. C.). We thank Dr Newman Burdett for skilled assistance.
References
- Back T, Kohno K, Hossmann KA. Cortical negative DC deflections following middle cerebral artery occlusion and KCl-induced spreading depression: effect on blood flow, tissue oxygenation, and electroencephalogram. Journal of Cerebral Blood Flow and Metabolism. 1994;14:12–19. doi: 10.1038/jcbfm.1994.3. [DOI] [PubMed] [Google Scholar]
- Ballanyi K, Grafe P, Ten Bruggencate G. Ion activities and potassium uptake mechanisms of glial cells in guinea-pig olfactory cortex slices. The Journal of Physiology. 1987;382:159–174. doi: 10.1113/jphysiol.1987.sp016361. [DOI] [PMC free article] [PubMed] [Google Scholar]
- Bures J, Buresova O, Krivanek J. The meaning and significance of Leao's spreading depression. Anais da Academia Brasileira de Ciencias. 1984;56:385–400. [PubMed] [Google Scholar]
- Chopp M. Editorial comment: spreading depression. Cephalagia. 1996;16:77. doi: 10.1046/j.1468-2982.1996.1602077.x. [DOI] [PubMed] [Google Scholar]
- Cutrer FM, Sorenson AG, Weisskoff RM, Ostergaard L, Sanchez Del Rio M, Lee EJ, Rosen EJ, Moskowitz MA. Perfusion-weighted imaging defects during spontaneous migrainous aura. Annals of Neurology. 1988;43:25–31. doi: 10.1002/ana.410430108. [DOI] [PubMed] [Google Scholar]
- De Crespigny A, Rother A, Van Bruggen N, Beaulieu C, Moseley ME. Magnetic Resonance Imaging assessment of cerebral hemodynamics during spreading depression in rats. Journal of Cerebral Blood Flow and Metabolism. 1998;18:1008–1017. doi: 10.1097/00004647-199809000-00010. [DOI] [PubMed] [Google Scholar]
- Fischer M, Bockhorst K, Hoehn Berlage M, Schmitz B, Hossmann KA. Imaging of the apparent diffusion coefficient for the evaluation of cerebral metabolic recovery after cardiac arrest. Magnetic Resonance Imaging. 1995;13:781–790. doi: 10.1016/0730-725x(95)00030-k. [DOI] [PubMed] [Google Scholar]
- Flippen C, Welch KM. Imaging the brain of migraine sufferers. Current Opinion in Neurology. 1997;10:226–230. doi: 10.1097/00019052-199706000-00010. [DOI] [PubMed] [Google Scholar]
- Gardner Medwin AR, Van Bruggen N, Williams SR, Ahier RG. Magnetic resonance imaging of propagating waves of spreading depression in the anaesthetised rat. Journal of Cerebral Blood Flow and Metabolism. 1994;14:7–11. doi: 10.1038/jcbfm.1994.2. [DOI] [PubMed] [Google Scholar]
- Hasegawa Y, Latour LL, Formato JE, Sotak CH, Fisher M. Spreading waves of a reduced diffusion coefficient of water in normal and ischemic rat brain. Journal of Cerebral Blood Flow and Metabolism. 1995;15:179–187. doi: 10.1038/jcbfm.1995.23. [DOI] [PubMed] [Google Scholar]
- Hertz L. Features of astrocytic function apparently involved in the response of central nervous tissue to ischemia-hypoxia. Journal of Cerebral Blood Flow and Metabolism. 1981;1:143–153. doi: 10.1038/jcbfm.1981.17. [DOI] [PubMed] [Google Scholar]
- Higashida H, Mitarai G, Watanabe S. A comparative study of membrane potential changes in neurons and neuroglial cells during spreading depression in the rabbit. Brain Research. 1974;65:411–425. doi: 10.1016/0006-8993(74)90232-7. [DOI] [PubMed] [Google Scholar]
- Hossmann KA. Periinfarct depolarizations. Cerebrovasculature and Brain Metabolism Reviews. 1996;8:195–208. [PubMed] [Google Scholar]
- Iijima T, Mies G, Hossmann KA. Repeated negative DC deflections in rat cortex following middle cerebral artery occlusion are abolished by MK-801: effect on volume of ischemic injury. Journal of Cerebral Blood Flow and Metabolism. 1992;12:727–733. doi: 10.1038/jcbfm.1992.103. [DOI] [PubMed] [Google Scholar]
- Kaplan MR, Meyer-Franke A, Lambert S, Bennett V, Duncan ID, Levinson SR, Barres BA. Induction of sodium channel clustering by oligodendrocytes. Nature. 1997;386:724–728. doi: 10.1038/386724a0. [DOI] [PubMed] [Google Scholar]
- Kaube H, Goadsby PJ. Anti-migraine compounds fail to modulate the propagation of cortical spreading depression in the cat. European Neurology. 1994;34:30–35. doi: 10.1159/000117004. [DOI] [PubMed] [Google Scholar]
- Lance JW. Current concepts of migraine pathogenesis. Neurology. 1993;43:S11–15. [PubMed] [Google Scholar]
- Lashley KS. Patterns of cerebral integration indicated by the scotomas of migraine. Archives of Neurology and Psychiatry. 1941;46:331–339. [Google Scholar]
- Latour LL, Hasegawa Y, Formato JE, Fisher M, Sotak CH. Spreading waves of decreased diffusion coefficient after cortical stimulation in the rat brain. Magnetic Resonance in Medicine. 1994;32:189–198. doi: 10.1002/mrm.1910320207. [DOI] [PubMed] [Google Scholar]
- Lauritzen M. Long-lasting reduction of cortical blood flow of the brain after spreading depression with preserved autoregulation and impaired CO2 response. Journal of Cerebral Blood Flow and Metabolism. 1984;4:546–554. doi: 10.1038/jcbfm.1984.79. [DOI] [PubMed] [Google Scholar]
- Lauritzen M. Cerebral blood flow in migraine and cortical spreading depression. Acta Neurologica Scandavica Supplementum. 1987;113:1–40. [PubMed] [Google Scholar]
- Lauritzen M. Pathophysiology of the migraine aura. The spreading depression theory. Brain. 1994;117:199–210. doi: 10.1093/brain/117.1.199. [DOI] [PubMed] [Google Scholar]
- Leao AAP. Spreading depression of activity in the cerebral cortex. Journal of Neurophysiology. 1944;7:359–390. doi: 10.1152/jn.1947.10.6.409. [DOI] [PubMed] [Google Scholar]
- Leao AAP, Morison RS. Propagation of spreading cortical depression. Journal of Neurophysiology. 1945;8:33–46. [Google Scholar]
- Mantz J, Cordier J, Giaume C. Effects of general anesthetics on intercellular communications mediated by gap junctions between astrocytes in primary cultures. Anesthesiology. 1993;78:892–901. doi: 10.1097/00000542-199305000-00014. [DOI] [PubMed] [Google Scholar]
- Marshall WH. Spreading cortical depression of Leao. Physiological Reviews. 1959;39:239–279. doi: 10.1152/physrev.1959.39.2.239. [DOI] [PubMed] [Google Scholar]
- Mayevsky A, Doron A, Manor T, Meilin S, Zarchin N, Ouaknine GE. Cortical spreading depression recorded from the human brain using a multiparametric monitoring system. Brain Research. 1996;740:268–274. doi: 10.1016/s0006-8993(96)00874-8. [DOI] [PubMed] [Google Scholar]
- Milner PM. Note on a possible correspondence between the scotomas of migraine and spreading depression of Leao. Electroencephalography and Clinical Neurophysiology. 1958;10:705. doi: 10.1016/0013-4694(58)90073-7. [DOI] [PubMed] [Google Scholar]
- Moskowitz MA, Macfarlane R. Neurovascular and molecular mechanisms in migraine headaches. Cerebrovascular and Brain Metabolism Reviews. 1993;5:159–177. [PubMed] [Google Scholar]
- Nedergaard M. Direct signalling from astrocytes to neurons in cultures of mammalian brain cells. Science. 1994;263:1768–1771. doi: 10.1126/science.8134839. [DOI] [PubMed] [Google Scholar]
- Obrenovitch TP, Zilkha E. High extracellular potassium, and not extracellular glutamate, is required for the propagation of spreading dpression. Journal of Neuroscience. 1995;73:2107–2014. doi: 10.1152/jn.1995.73.5.2107. [DOI] [PubMed] [Google Scholar]
- Obrenovitch TP, Zilkha E, Urenjak J. Intracerebral microdialysis: electrophysiological evidence of a critical pitfall. Journal of Neurochemistry. 1995;64:1884–1887. doi: 10.1046/j.1471-4159.1995.64041884.x. [DOI] [PubMed] [Google Scholar]
- Ochs S, Hunt K. Apical dendrites and propagation of spreading depression in cerebral cortex. Journal of Neurophysiology. 1960;23:434–444. doi: 10.1152/jn.1960.23.4.432. [DOI] [PubMed] [Google Scholar]
- Parsons AA. Recent advances in mechanisms of spreading depression. Current Opinion in Neurology. 1998;11:227–231. doi: 10.1097/00019052-199806000-00006. [DOI] [PubMed] [Google Scholar]
- Parsons AA, Raval P, Smith MI, Read SJ, Bingham S. Cortical spreading depression and migraine: a missing link? In: Clifford Rose F, editor. Developments in Neurology, 12, Towards Migraine 2000. Amsterdam: Elsevier; 1996. pp. 153–161. [Google Scholar]
- Pfrieger FW, Barres BA. Synaptic efficacy enhanced by glial cells in vitro. Science. 1997;277:1684–1687. doi: 10.1126/science.277.5332.1684. [DOI] [PubMed] [Google Scholar]
- Piper RD, Lambert GA. Inhalational anesthetics inhibit spreading depression: relevance to migraine. Cephalalgia. 1996;16:87–92. doi: 10.1046/j.1468-2982.1996.1602087.x. [DOI] [PubMed] [Google Scholar]
- Ramos JG, De La Cerda E. On the ionic nature of the slow potential and impedance changes of spreading depression. Acta Physiologica Pharmacologica et Therapeutica Latinoamericana. 1974;24:216–227. [Google Scholar]
- Read SJ, Smith MI, Hunter AJ, Parsons AA. The dynamics of nitric oxide release measured directly and in real time following repeated waves of cortical spreading depression in the anaesthetised cat. Neuroscience Letters. 1997;232:127–130. doi: 10.1016/s0304-3940(97)00604-6. [DOI] [PubMed] [Google Scholar]
- Richter F, Lehmenkuhler A. Spreading depression can be restricted to distinct depths of the rat cerebral cortex. Neuroscience Letters. 1993;152:65–83. doi: 10.1016/0304-3940(93)90484-3. [DOI] [PubMed] [Google Scholar]
- Rother J, De Crespigny AJ, D'Arceuil HDA, Mosley ME. MR detection of cortical spreading depression immediately after focal ischemia in the rat. Journal of Cerebral Blood Flow and Metabolism. 1996;16:214–220. doi: 10.1097/00004647-199603000-00005. [DOI] [PubMed] [Google Scholar]
- Saito R, Graf R, Hubel K, Taguchi J, Rosner G, Fujita T, Heiss WD. Halothane, but not alpha-chloralose, blocks potassium-evoked cortical spreading depression in cats. Brain Research. 1995;699:109–115. doi: 10.1016/0006-8993(95)00898-z. [DOI] [PubMed] [Google Scholar]
- Strong AJ, Harland SP, Meldrum BS, Whittington DJ. The use of in vivo fluorescence image sequences to indicate the occurrence and propagation of transient focal depolarizations in cerebral ischemia. Journal of Cerebal Blood Flow and Metabolism. 1996;16:367–377. doi: 10.1097/00004647-199605000-00003. [DOI] [PubMed] [Google Scholar]
- Sugaya E, Takato M, Noda Y. Neuronal and glial activity during spreading depression in cerebral cortex of cat. Journal of Neurophysiology. 1975;38:822–841. doi: 10.1152/jn.1975.38.4.822. [DOI] [PubMed] [Google Scholar]
- Szerb JC. Glutamate release and spreading depression in the fascia dentata in responce to microdialysis with high K+: role of glia. Brain Research. 1991;542:259–265. doi: 10.1016/0006-8993(91)91576-m. [DOI] [PubMed] [Google Scholar]
- Tower DB, Young OM. The activities of butyrylcholinesterase and carbonic anhydrase, the rate of anaerobic glycolysis, and the question of a constant density of glial cells in cerebral cortices of various mammalian species from mouse to whale. Journal of Neurochemistry. 1973;20:269–278. doi: 10.1111/j.1471-4159.1973.tb12126.x. [DOI] [PubMed] [Google Scholar]
- Van Zijl OCM, Eleff SM, Ulatolwski JA, Oja JME, Ulug AM, Traystman RJ, Kauppiner RA. Quantitative assessment of blood flow, blood volume and blood oxygenation effects in functional magnetic resonance imaging. Nature Medicine. 1998;4:159–167. doi: 10.1038/nm0298-159. [DOI] [PubMed] [Google Scholar]
- Weiller C, May A, Limmroth V, Juptner M, Kaube H, Schayck RV, Coenen HH. Brain stem activation in spontaneous human migraine attacks. Nature Medicine. 1995;1:658–660. doi: 10.1038/nm0795-658. [DOI] [PubMed] [Google Scholar]
- Welch KMA, Barkley GL, Tepley N, Ramadan NM. Central neurogenic mechanisms of migraine. Neurology. 1993;43:S21–25. [PubMed] [Google Scholar]
- Wolf T, Lindauer U, Obrig H, Dreier J, Back T, Villringer A, Diener HC. Systemic nitric oxide synthase inhibition does not affect brain oxygenation during cortical spreading depression in rats: a noninvasive near-infrared spectroscopy and laser-Doppler flowmetry study. Journal of Cerebral Blood Flow and Metabolism. 1996;16:1100–1107. doi: 10.1097/00004647-199611000-00003. [DOI] [PubMed] [Google Scholar]
- Xing D, Papadakis NG, Huang C L-H, Lee VM, Carpenter TA, Hall LD. Optimised diffusion-weighting for measurement of apparent diffusion coefficient (ADC) in human brain. Magnetic Resonance Imaging. 1997;15:771–784. doi: 10.1016/s0730-725x(97)00037-4. [DOI] [PubMed] [Google Scholar]
- Yuan LL, Ganetzky B. A glial-neuronal signaling pathway revealed by mutations in a neurexin-related protein. Science. 1999;283:1343–1345. doi: 10.1126/science.283.5406.1343. [DOI] [PubMed] [Google Scholar]
- Zhang ZG, Chopp M, Maynard KI, Moskowitz MA. Cerebral blood flow changes during cortical spreading depression are not altered by inhibition of nitric oxide synthesis. Journal of Cerebral Blood Flow and Metabolism. 1994;14:939–943. doi: 10.1038/jcbfm.1994.125. [DOI] [PubMed] [Google Scholar]